Notebookcheck Logo

AMD Radeon R6 (Mullins) vs Intel HD Graphics 405 (Braswell) vs Intel HD Graphics (Cherry Trail)

AMD Radeon R6 (Mullins)

► remove from comparison AMD Radeon R6 (Mullins)

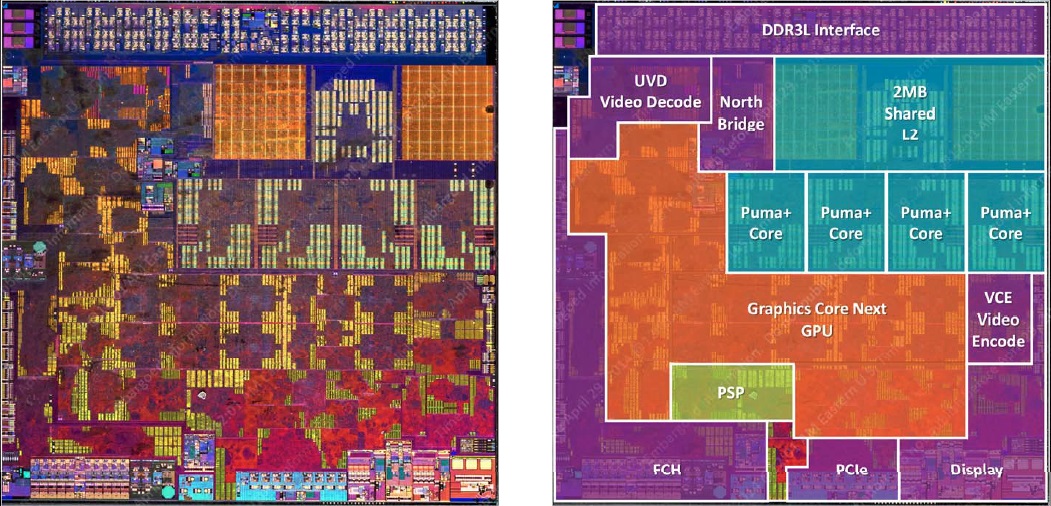
Die AMD Radeon R6 ist eine in einigen Mullins-APUs (A10 Micro-6700T) von AMD integrierte Grafikeinheit. Sie verfügt über 128 Shadereinheiten auf Basis der GCN-Architektur (zwei Compute Units), die mit bis zu 500 MHz takten und beherrscht DirectX 12 (FL 12_0). Die Grafikkarte besitzt keinen eigenen Speicher, sondern greift über den Controller der APU auf den Hauptspeicher zu (Single-Channel DDR3L-1333).

Per UVD (Unified Video Decoder) kann die Radeon R6 den Prozessor beim Decodieren von Videos unterstützen, zudem wurde ein spezialisierter Video-Encoder (VCE 2.0) integriert. Das Bildsignal kann per VGA, DVI, HDMI 1.4a und DisplayPort 1.2 an bis zu zwei externe Monitore ausgegeben werden.

Die Performance der Radeon R6 liegt gut 10 Prozent hinter einer Radeon HD 8330, da der maximale Turbo nicht immer vollständig ausgeschöpft werden kann. Damit entspricht die GPU knapp einer Radeon HD 8280 und siedelt sich im Low-End-Bereich an. In der Regel werden nur ältere oder sehr anspruchslose Spiele flüssig bewältigt (Stand 2014).

Intel HD Graphics 405 (Braswell)

► remove from comparison Intel HD Graphics 405 (Braswell)

Die Intel HD Graphics 405 ist eine in den Low-End-SoCs der Braswell-Serie (z.B. Pentium N3710) integrierte Grafikeinheit. Sie basiert auf der gleichen Architektur wie die GPU verschiedener Broadwell-Prozessoren (z.B. HD Graphics 5300), bietet allerdings deutlich weniger Shadereinheiten und geringere Taktraten. Die genauen Spezifikationen hängen vom jeweiligen SoC ab: Die schnellste Variante mit 16 EUs und maximal 700 MHz schlägt die ältere HD Graphics (Bay Trail) um etwa Faktor zwei. Vor 2016 war die Grafikkarte nur unter Intel HD Graphics (Braswell) bekannt und beinhaltete 12 und 16-Kern-Modelle.

Anwender müssen sich deshalb insbesondere bei den Celeron-Modellen, die zusätzlich durch die Beschneidung auf nur zwei CPU-Kerne ausgebremst werden, auf ältere und anspruchslose Spiele beschränken. Videos werden dagegen auch in 4K/H.265 flüssig wiedergeben.

Weitere Benchmarks sind daher auch auf unserer Seite der Intel HD Graphics (Braswell) zu finden.

Intel HD Graphics (Cherry Trail)

► remove from comparison Intel HD Graphics (Cherry Trail)

Die Intel HD Graphics (Cherry Trail) ist eine in den Tablet-SoCs der Cherry-Trail-Serie (z.B. Atom x7-Z8700) integrierte Grafikeinheit. Sie basiert auf der gleichen Architektur wie die GPU verschiedener Broadwell-Prozessoren (z.B. HD Graphics 5300), bietet allerdings deutlich weniger Shadereinheiten und geringere Taktraten. Die genauen Spezifikationen hängen vom jeweiligen SoC ab:

Die schnellste Variante mit 16 EUs und maximal 600 MHz schlägt die ältere HD Graphics (Bay Trail) um Faktor zwei, womit sich die GPU etwas oberhalb einer Qualcomm Adreno 330 oder PowerVR G6430, jedoch deutlich unter einer Adreno 420 oder GX6450 einordnet. Auch Nvidias Tegra-SoCs K1 und X1 rechnen weitaus schneller.

Unter Windows werden sich Anwender deshalb weiter auf sehr alte und anspruchslose Spiele beschränken müssen, wohingegen moderne Android-Games auch in hohen Auflösungen zumeist flüssig dargestellt werden sollten. Der x7-Z8700 war z.B. nur knapp in der Lage Team Fortress 2 in minimalen Details und 1280x720 flüssig wiederzugeben (11 - 69 fps).

Videos kann die GPU auch in 4K/H.265 flüssig wiedergeben (je nach Bitrate und Farbtiefe).

Die Intel HD Graphics Grafikkarte in den Cherry Trail SoCs unterstützt nach unseren Tests mit dem MS Surface 3 mit Atom x7-Z8700 nur DisplayPort 1.1 und damit lediglich 30 Hz bei 4K (3.840 x 2.160).

AMD Radeon R6 (Mullins)Intel HD Graphics 405 (Braswell)Intel HD Graphics (Cherry Trail)
HD Graphics Serie
Radeon R5 (Beema/Carrizo-L) 128 @ 0.85 GHz64 Bit
Radeon R4 (Beema) 128 @ 0.8 GHz64 Bit
Radeon R3 (Mullins/Beema) 128 @ 0.35 - 0.69 GHz64 Bit
Radeon R2 (Mullins/Beema/Carrizo-L) 128 @ 0.3 - 0.6 GHz64 Bit
Radeon R6 (Mullins) 128 @ 0.5 GHz64 Bit
HD Graphics P530 24 @ 0.35 - 1.05 GHz64/128 Bit
HD Graphics 5600 24 @ 0.3 - 1.05 GHz64/128 Bit
HD Graphics 6000 48 @ 0.3 - 1 GHz64/128 Bit
HD Graphics 4600 20 @ 0.2 - 1.35 GHz64/128 Bit
HD Graphics 5500 24 @ 0.3 - 0.95 GHz64/128 Bit
HD Graphics 5000 40 @ 0.2 - 1.1 GHz64/128 Bit
HD Graphics 4400 20 @ 0.2 - 1.1 GHz64/128 Bit
HD Graphics 5300 24 @ 0.1 - 0.9 GHz64/128 Bit
HD Graphics 4000 16 @ 0.35 - 1.35 GHz64/128 Bit
HD Graphics (Broadwell) 12 @ 0.1 - 0.85 GHz64/128 Bit
HD Graphics 4200 20 @ 0.2 - 0.85 GHz64/128 Bit
HD Graphics (Skylake) 12 @ 0.3 - 0.8 GHz64/128 Bit
HD Graphics 405 (Braswell) 16 @ 0.32 - 0.7 GHz64/128 Bit
HD Graphics (Braswell) 16 @ 0.32 - 0.7 GHz64/128 Bit
HD Graphics 400 (Braswell) 12 @ 0.32 - 0.64 GHz64/128 Bit
HD Graphics (Haswell) 10 @ 0.2 - 1 GHz64/128 Bit
HD Graphics (Cherry Trail) 16 @ 0.2 - 0.6 GHz64/128 Bit
HD Graphics 3000 12 @ 0.35 - 1.35 GHz64/128 Bit
HD Graphics 2500 6 @ 0.65 - 1.15 GHz64/128 Bit
HD Graphics (Ivy Bridge) 6 @ 0.35 - 1.1 GHz64/128 Bit
HD Graphics 2000 6 @ 0.85 - 1.35 GHz64/128 Bit
HD Graphics (Sandy Bridge) 6 @ 0.35 - 1.1 GHz64/128 Bit
HD Graphics (Bay Trail) 4 @ 0.31 - 0.9 GHz32/64/128 Bit
CodenameMullinsBraswellCherry Trail
ArchitekturGCN 1.1Gen. 8Gen. 8
Pipelines128 - unified16 - unified16 - unified
Kerntakt500 MHz320 - 700 (Boost) MHz200 - 600 (Boost) MHz
Speicherbandbreite64 Bit64/128 Bit64/128 Bit
Shared Memoryjajaja
APIDirectX 12 (FL 12_0), Shader 5.0DirectX 11.2, Shader 5.0DirectX 12 (FL 11_1), Shader 5.0, OpenGL 4.3
Herstellungsprozess28 nm14 nm14 nm
Erscheinungsdatum29.04.2014 01.04.2016 02.03.2015
CPU in Radeon R6 (Mullins)GPU Base SpeedGPU Boost / Turbo
AMD A10 Micro-6700T4 x 1200 MHz, 4.5 W? MHz500 MHz
CPU in HD Graphics 405 (Braswell)GPU Base SpeedGPU Boost / Turbo
Intel Pentium N37104 x 1600 MHz, 6 W400 MHz700 MHz
Intel Atom x7-Z87504 x 1600 MHz400 MHz600 MHz
min. - max.400 - ? MHz500 - 700 MHz
CPU in HD Graphics (Cherry Trail)GPU Base SpeedGPU Boost / Turbo
Intel Atom x7-Z87004 x 1600 MHz200 MHz600 MHz
Intel Atom x5-Z85004 x 1440 MHz200 MHz600 MHz
Intel Atom x5-Z83504 x 1440 MHz200 MHz500 MHz
min. - max.200 - ? MHz? - 700 MHz

Benchmarks

Performance Rating - 3DMark 11 + Fire Strike + Time Spy - HD Graphics 405 (Braswell)
0.1 pt (0%)
Performance Rating - 3DMark 11 + Fire Strike + Time Spy - HD Graphics (Cherry Trail)
0.1 pt (0%)
3DMark - 3DMark Ice Storm Unlimited Graphics
20511 Points (2%)
min: 19812     avg: 23763     median: 23763 (2%)     max: 27714 Points
3DMark - 3DMark Ice Storm Extreme Graphics
min: 12601     avg: 14069     median: 14068.5 (2%)     max: 15536 Points
3DMark - 3DMark Cloud Gate Score
1900 Points (2%)
min: 1743     avg: 2000     median: 1933 (2%)     max: 2392 Points
3DMark - 3DMark Cloud Gate Graphics
2258 Points (1%)
min: 1767     avg: 2206     median: 2113 (1%)     max: 2831 Points
3DMark - 3DMark Fire Strike Standard Score
302 Points (1%)
min: 216     avg: 237.5     median: 237.5 (0%)     max: 259 Points
3DMark - 3DMark Fire Strike Standard Graphics
min: 231     avg: 254.5     median: 254.5 (0%)     max: 278 Points
min: 193     avg: 233     median: 225 (0%)     max: 281 Points
3DMark - 3DMark Ice Storm Graphics
min: 26056     avg: 28119     median: 28119 (3%)     max: 30182 Points
min: 7544     avg: 16078     median: 17063.5 (2%)     max: 23395 Points
3DMark - 3DMark Sling Shot (ES 3.0) Unlimited
min: 1445     avg: 1525     median: 1525 (7%)     max: 1605 Points
3DMark - 3DMark Sling Shot (ES 3.0) Unlimited Graphics
min: 1598     avg: 1684     median: 1684 (4%)     max: 1770 Points
3DMark - 3DMark Sling Shot Extreme (ES 3.1) Unlimited
min: 1072     avg: 1215     median: 1159 (6%)     max: 1414 Points
3DMark - 3DMark Sling Shot Extreme (ES 3.1) Unlimited Graphics
min: 1058     avg: 1251     median: 1142 (3%)     max: 1554 Points
3DMark - 3DMark Sling Shot (ES 3.0)
min: 1353     avg: 1429     median: 1398 (12%)     max: 1593 Points
3DMark - 3DMark Sling Shot (ES 3.0) Graphics
min: 1300     avg: 1505     median: 1530 (9%)     max: 1732 Points
3DMark - 3DMark Sling Shot Extreme (ES 3.1)
min: 1037     avg: 1133     median: 1070 (5%)     max: 1319 Points
3DMark - 3DMark Sling Shot Extreme (ES 3.1) Graphics
min: 973     avg: 1102     median: 1054 (4%)     max: 1261 Points
3DMark 11 - 3DM11 Performance Score
582 Points (1%)
min: 314     avg: 359.4     median: 343 (0%)     max: 562 Points
3DMark 11 - 3DM11 Performance GPU
min: 408     avg: 469.1     median: 473 (0%)     max: 496 Points
min: 278     avg: 319.9     median: 298 (0%)     max: 494 Points
3DMark Vantage
3DM Vant. Perf. total + Intel HD Graphics 405 (Braswell)
3DMark Vantage - 3DM Vant. Perf. total
2081 Points (1%)
3DM Vant. Perf. GPU no PhysX + Intel HD Graphics 405 (Braswell)
3DMark Vantage - 3DM Vant. Perf. GPU no PhysX
1730 Points (1%)
3DMark 06 3DMark 06 - Standard 1280x1024 + Intel HD Graphics 405 (Braswell)
3DMark 06
min: 2274     avg: 2920     median: 2920 (4%)     max: 3566 Points
3DMark 06 - Standard 1280x1024 + Intel HD Graphics (Cherry Trail)
min: 2403     avg: 2833     median: 2595 (3%)     max: 3330 Points
3DMark 06 - Standard 1024x768 + Intel HD Graphics (Cherry Trail)
3DMark 06
2877 Points (4%)
Unigine Valley 1.0 - Unigine Valley 1.0 DX
1.2 fps (0%)
Unigine Heaven 2.1 - Heaven 2.1 high
7.4 fps (1%)
Cinebench R10 Cinebench R10 Shading (32bit) + Intel HD Graphics 405 (Braswell)
Cinebench R10 - Cinebench R10 Shading (32bit)
min: 2412     avg: 2685     median: 2753 (2%)     max: 2822 Points
Cinebench R10 Shading (32bit) + Intel HD Graphics (Cherry Trail)
Cinebench R11.5 Cinebench R11.5 OpenGL 64 Bit + AMD Radeon R6 (Mullins)
Cinebench R11.5 - Cinebench R11.5 OpenGL 64 Bit
11.3 fps (4%)
Cinebench R11.5 OpenGL 64 Bit + Intel HD Graphics 405 (Braswell)
min: 10.24     avg: 11.7     median: 11.7 (4%)     max: 13.06 fps
Cinebench R11.5 OpenGL 64 Bit + Intel HD Graphics (Cherry Trail)
Cinebench R15
Cinebench R15 OpenGL 64 Bit + Intel HD Graphics 405 (Braswell)
Cinebench R15 - Cinebench R15 OpenGL 64 Bit
min: 10.3     avg: 13.8     median: 14.1 (1%)     max: 15.74 fps
Cinebench R15 OpenGL 64 Bit + Intel HD Graphics (Cherry Trail)
Cinebench R15 OpenGL Ref. Match 64 Bit + Intel HD Graphics 405 (Braswell)
Cinebench R15 OpenGL Ref. Match 64 Bit + Intel HD Graphics (Cherry Trail)
GFXBench - GFXBench Car Chase Offscreen
9.9 fps (1%)
GFXBench 3.1 - GFXBench Manhattan ES 3.1 Offscreen
20.3 fps (0%)
GFXBench 3.0 - GFXBench 3.0 Manhattan Offscreen
20.3 fps (1%)
GFXBench (DX / GLBenchmark) 2.7
GFXBench T-Rex HD Offscreen C24Z16 + Intel HD Graphics 405 (Braswell)
GFXBench (DX / GLBenchmark) 2.7 - GFXBench T-Rex HD Offscreen C24Z16
41.3 fps (0%)
GFXBench T-Rex HD Offscreen C24Z16 + Intel HD Graphics (Cherry Trail)
LuxMark v2.0 64Bit - LuxMark v2.0 Room GPU
min: 56     avg: 68     median: 68 (0%)     max: 80 Samples/s
min: 48     avg: 58.7     median: 59 (0%)     max: 69 Samples/s
LuxMark v2.0 64Bit - LuxMark v2.0 Sala GPU
min: 81     avg: 102.5     median: 102.5 (0%)     max: 124 Samples/s
min: 69     avg: 87.7     median: 89 (0%)     max: 105 Samples/s
ComputeMark v2.1 - ComputeMark v2.1 Result
min: 388     avg: 390.5     median: 390.5 (0%)     max: 393 Points
277 Points (0%)
Power Consumption - Furmark Stress Test Power Consumption - external Monitor *
9.8 Watt (1%)

Average Benchmarks AMD Radeon R6 (Mullins) → 100% n=6

Average Benchmarks Intel HD Graphics 405 (Braswell) → 98% n=6

Average Benchmarks Intel HD Graphics (Cherry Trail) → 78% n=6

- Bereich der Benchmarkergebnisse für diese Grafikkarte
- Durchschnittliche Benchmarkergebnisse für diese Grafikkarte
* Smaller numbers mean a higher performance
1 This benchmark is not used for the average calculation

Spiele-Benchmarks

Die folgenden Benchmarks basieren auf unseren Spieletests mit Testnotebooks. Die Performance dieser Grafikkarte bei den gelisteten Spielen ist abhängig von der verwendeten CPU, Speicherausstattung, Treiber und auch Betriebssystem. Dadurch müssen die untenstehenden Werte nicht repräsentativ sein. Detaillierte Informationen über das verwendete System sehen Sie nach einem Klick auf den fps-Wert.

low 1920x1080
HD Graphics 405 (Braswell):
17.8  fps
med. 1920x1080
HD Graphics 405 (Braswell):
18  fps
high 1920x1080
HD Graphics 405 (Braswell):
9.9  fps
low 1280x720
HD Graphics 405 (Braswell):
23.6  fps
med. 1920x1080
HD Graphics 405 (Braswell):
18  fps
high 1920x1080
HD Graphics 405 (Braswell):
13.9  fps
PUBG Mobile

PUBG Mobile

2018
low
HD Graphics 405 (Braswell):
0 (!)  fps
World of Tanks Blitz

World of Tanks Blitz

2018
low
HD Graphics 405 (Braswell):
37  fps
high
HD Graphics 405 (Braswell):
24  fps
Arena of Valor

Arena of Valor

2018
low
HD Graphics 405 (Braswell):
25  fps
Shadow Fight 3

Shadow Fight 3

2018
low
HD Graphics 405 (Braswell):
30  fps
Battle Bay

Battle Bay

2018
high
HD Graphics 405 (Braswell):
37  fps
low 1280x720
HD Graphics 405 (Braswell):
19.6  fps
HD Graphics (Cherry Trail):
21.4  fps
low 1280x720
HD Graphics 405 (Braswell):
18.7  fps
HD Graphics (Cherry Trail):
15.5  fps
low 1280x720
HD Graphics 405 (Braswell):
13.5  fps
med. 1920x1080
HD Graphics 405 (Braswell):
11  fps
low 1280x720
HD Graphics 405 (Braswell):
14.4  fps
med. 1366x768
HD Graphics 405 (Braswell):
10.5  fps
low 1280x720
HD Graphics 405 (Braswell):
17.6 31.3 ~ 24 fps
HD Graphics (Cherry Trail):
22.6  fps
med. 1366x768
HD Graphics 405 (Braswell):
21.3  fps
low 1024x768
HD Graphics 405 (Braswell):
12.2  fps
med. 1366x768
HD Graphics 405 (Braswell):
5.2  fps
low 1280x720
HD Graphics 405 (Braswell):
10.5  fps
med. 1366x768
HD Graphics 405 (Braswell):
6.1  fps
low 1024x768
HD Graphics 405 (Braswell):
7.1  fps
med. 1366x768
HD Graphics 405 (Braswell):
4.2  fps
low 1024x768
HD Graphics 405 (Braswell):
15.3  fps
HD Graphics (Cherry Trail):
11.5  fps
med. 1366x768
HD Graphics 405 (Braswell):
8.9  fps
HD Graphics (Cherry Trail):
7  fps
low 1024x768
HD Graphics (Cherry Trail):
8.8  fps
med. 1366x768
HD Graphics (Cherry Trail):
4.8  fps
Anno 2205

Anno 2205

2015
low 1024x768
HD Graphics 405 (Braswell):
10.8  fps
HD Graphics (Cherry Trail):
8.1  fps
med. 1366x768
HD Graphics 405 (Braswell):
6.9  fps
HD Graphics (Cherry Trail):
3.9  fps
low 1366x768
HD Graphics 405 (Braswell):
15 21.8 ~ 18 fps
HD Graphics (Cherry Trail):
13.9 16.8 ~ 15 fps
med. 1366x768
HD Graphics 405 (Braswell):
16.2  fps
low 1024x768
HD Graphics 405 (Braswell):
18.8  fps
HD Graphics (Cherry Trail):
15.1  fps
med. 1366x768
HD Graphics 405 (Braswell):
13  fps
HD Graphics (Cherry Trail):
9.8  fps
low 1280x720
HD Graphics 405 (Braswell):
22.1 35.2 ~ 29 fps
HD Graphics (Cherry Trail):
20  fps
med. 1366x768
HD Graphics 405 (Braswell):
13.7 22.8 ~ 18 fps
HD Graphics (Cherry Trail):
15.2  fps
high 1920x1080
HD Graphics (Cherry Trail):
7.2  fps
low 1024x768
HD Graphics 405 (Braswell):
41.5  fps
HD Graphics (Cherry Trail):
20.1  fps
med. 1366x768
HD Graphics 405 (Braswell):
12.5  fps
HD Graphics (Cherry Trail):
12.5  fps
GTA V

GTA V

2015
low 1024x768
HD Graphics (Cherry Trail):
10.8 (!)  fps
low 1024x768
HD Graphics 405 (Braswell):
12.1  fps
HD Graphics (Cherry Trail):
9.5  fps
med. 1366x768
HD Graphics 405 (Braswell):
7.6  fps
HD Graphics (Cherry Trail):
5.7  fps
low 1024x768
HD Graphics (Cherry Trail):
16.2  fps
med. 1366x768
HD Graphics (Cherry Trail):
6.1  fps
F1 2014

F1 2014

2014
low 1024x768
HD Graphics 405 (Braswell):
28  fps
HD Graphics (Cherry Trail):
16  fps
med. 1366x768
HD Graphics 405 (Braswell):
17  fps
HD Graphics (Cherry Trail):
12  fps
low 1024x768
HD Graphics 405 (Braswell):
18.9  fps
med. 1366x768
HD Graphics 405 (Braswell):
13.6  fps
Fifa 15

Fifa 15

2014
low 1280x720
HD Graphics (Cherry Trail):
15.6  fps
Sims 4

Sims 4

2014
low 1024x768
HD Graphics 405 (Braswell):
77.5  fps
HD Graphics (Cherry Trail):
65.6 66.6 81.4 ~ 71 fps
med. 1366x768
HD Graphics 405 (Braswell):
19.6  fps
HD Graphics (Cherry Trail):
9.4 16.9 21.2 ~ 16 fps
high 1920x1080
HD Graphics (Cherry Trail):
5.5 10 ~ 8 fps
low 1024x768
HD Graphics 405 (Braswell):
14  fps
med. 1366x768
HD Graphics 405 (Braswell):
9.1  fps
low 1024x768
HD Graphics 405 (Braswell):
50.5  fps
HD Graphics (Cherry Trail):
22 27.3 ~ 25 fps
med. 1366x768
HD Graphics 405 (Braswell):
15  fps
HD Graphics (Cherry Trail):
12.5 13.5 ~ 13 fps
Thief

Thief

2014
low 1024x768
HD Graphics 405 (Braswell):
6  fps
low 1024x768
HD Graphics 405 (Braswell):
16.5  fps
HD Graphics (Cherry Trail):
13.3  fps
med. 1366x768
HD Graphics 405 (Braswell):
12.5  fps
high 1366x768
HD Graphics 405 (Braswell):
8.3  fps
Asphalt 8: Airborne

Asphalt 8: Airborne

2013
low
HD Graphics (Cherry Trail):
58  fps
high
HD Graphics (Cherry Trail):
47  fps
Dota 2

Dota 2

2013
low 1024x768
HD Graphics (Cherry Trail):
29.7  fps
med. 1366x768
HD Graphics (Cherry Trail):
16.5  fps
GRID 2

GRID 2

2013
low 1024x768
HD Graphics (Cherry Trail):
24  fps
med. 1366x768
HD Graphics (Cherry Trail):
13.5  fps
low 1280x720
HD Graphics 405 (Braswell):
16.4 17.7 22.2 23.2 ~ 20 fps
HD Graphics (Cherry Trail):
16 18 18.9 19.8 20.1 20.5 ~ 19 fps
med. 1366x768
HD Graphics 405 (Braswell):
9.3 11.4 11.8 ~ 11 fps
HD Graphics (Cherry Trail):
6.4 7.9 9.3 9.8 10 10 ~ 9 fps
high 1366x768
HD Graphics 405 (Braswell):
9.2 10 ~ 10 fps
HD Graphics (Cherry Trail):
5.6 5.7 6.7 7.6 7.9 8.4 ~ 7 fps
ultra 1920x1080
HD Graphics (Cherry Trail):
2.4 2.6 ~ 2 fps
low 1024x768
HD Graphics 405 (Braswell):
27.8  fps
HD Graphics (Cherry Trail):
19.7 25.7 27.8 30.2 33.6 ~ 27 fps
med. 1366x768
HD Graphics 405 (Braswell):
12.8  fps
HD Graphics (Cherry Trail):
10.5 12 13.2 13.5 14.8 ~ 13 fps
high 1366x768
HD Graphics 405 (Braswell):
9.5  fps
HD Graphics (Cherry Trail):
7 8.3 9 ~ 8 fps
ultra 1920x1080
HD Graphics (Cherry Trail):
3.7 3.8 ~ 4 fps
low 1024x768
HD Graphics 405 (Braswell):
43.2  fps
med. 1366x768
HD Graphics 405 (Braswell):
19.6  fps
high 1366x768
HD Graphics 405 (Braswell):
14.3  fps
Temple Run 2

Temple Run 2

2013
high
HD Graphics (Cherry Trail):
34  fps
low 1024x768
HD Graphics (Cherry Trail):
15.2  fps
med. 1366x768
HD Graphics (Cherry Trail):
11.6  fps
low 1024x768
HD Graphics (Cherry Trail):
0 (!)  fps
med. 1366x768
HD Graphics (Cherry Trail):
0 (!)  fps
low 1024x768
HD Graphics 405 (Braswell):
42.6  fps
HD Graphics (Cherry Trail):
14.1 21.6 41.1 ~ 26 fps
med. 1366x768
HD Graphics 405 (Braswell):
32  fps
HD Graphics (Cherry Trail):
4.8 18.6 35.1 ~ 20 fps
high 1366x768
HD Graphics 405 (Braswell):
20.4  fps
HD Graphics (Cherry Trail):
20.3  fps
ultra 1920x1080
HD Graphics (Cherry Trail):
11.4  fps
low 1024x768
HD Graphics 405 (Braswell):
32  fps
HD Graphics (Cherry Trail):
24.3 31.9 ~ 28 fps
med. 1366x768
HD Graphics 405 (Braswell):
19.1  fps
HD Graphics (Cherry Trail):
16 19 ~ 18 fps
high 1366x768
HD Graphics 405 (Braswell):
14.4  fps
Anno 2070

Anno 2070

2011
low 1024x768
HD Graphics (Cherry Trail):
15.3 28.1 33.1 ~ 26 fps
med. 1366x768
HD Graphics (Cherry Trail):
12.8 13.4 13.7 ~ 13 fps
high 1366x768
HD Graphics (Cherry Trail):
8  fps
low 1280x720
HD Graphics 405 (Braswell):
21.8  fps
HD Graphics (Cherry Trail):
15.5 18.9 ~ 17 fps
med. 1366x768
HD Graphics 405 (Braswell):
10.4  fps
HD Graphics (Cherry Trail):
7.2 8.5 ~ 8 fps
high 1366x768
HD Graphics 405 (Braswell):
6.5  fps
low 1024x768
HD Graphics 405 (Braswell):
35.4  fps
HD Graphics (Cherry Trail):
25.6  fps
high 1366x768
HD Graphics 405 (Braswell):
14.7  fps
HD Graphics (Cherry Trail):
12  fps
Dirt 3

Dirt 3

2011
low 800x600
HD Graphics (Cherry Trail):
28.1  fps
med. 1024x768
HD Graphics (Cherry Trail):
12.5  fps
Civilization 5

Civilization 5

2010
low 1024x768
HD Graphics (Cherry Trail):
18.7  fps
low 1024x768
HD Graphics (Cherry Trail):
63.2 64 ~ 64 fps
med. 1360x768
HD Graphics (Cherry Trail):
18 18.8 ~ 18 fps
high 1360x768
HD Graphics (Cherry Trail):
14  fps
ultra 1920x1080
HD Graphics (Cherry Trail):
7  fps
Trackmania Nations Forever

Trackmania Nations Forever

2008
low 640x480
HD Graphics (Cherry Trail):
77.3 92.6 96.1 97.8 99.7 105 128 ~ 100 fps
high 1024x768
HD Graphics (Cherry Trail):
18.2 21.3 22.9 24.4 24.7 25 29.2 ~ 24 fps
ultra 1920x1080
HD Graphics (Cherry Trail):
9.6 15.5 16.8 ~ 14 fps
World of Warcraft

World of Warcraft

2005
low 800x600
HD Graphics (Cherry Trail):
44 50.9 ~ 47 fps
med. 1024x768
HD Graphics (Cherry Trail):
18.3  fps
Intel HD Graphics 405 (Braswell)lowmed.highultraQHD4K
Hearthstone17.8189.91
League of Legends23.61813.9
PUBG Mobile
World of Tanks Blitz3724
Arena of Valor25
Shadow Fight 330
Battle Bay37
Team Fortress 219.6
Rocket League18.7
Resident Evil 713.511
Titanfall 214.410.5
Farming Simulator 172421.3
Civilization VI12.25.2
Mirror's Edge Catalyst10.56.1
Rise of the Tomb Raider7.14.2
Rainbow Six Siege15.38.9
Anno 220510.86.9
World of Warships1816.2
Metal Gear Solid V18.813
Dota 2 Reborn2918
Dirt Rally41.512.5
Dragon Age: Inquisition12.17.6
F1 20142817
Alien: Isolation18.913.6
Sims 477.519.6
Risen 3: Titan Lords149.1
GRID: Autosport50.515
Thief6
Battlefield 416.512.58.3
BioShock Infinite201110
Tomb Raider27.812.89.5
Dead Space 343.219.614.3
Counter-Strike: GO42.63220.4
Diablo III3219.114.4
The Elder Scrolls V: Skyrim21.810.46.5
Deus Ex Human Revolution35.414.7
< 30 fps
< 60 fps
< 120 fps
≥ 120 fps
25
8
1
26
1

11
1


Intel HD Graphics (Cherry Trail)lowmed.highultraQHD4K
Team Fortress 221.4
Rocket League15.5
Farming Simulator 1722.6
Rainbow Six Siege11.57
Star Wars Battlefront8.84.8
Anno 22058.13.9
World of Warships15
Metal Gear Solid V15.19.8
Dota 2 Reborn2015.27.2
Dirt Rally20.112.5
GTA V10.8
Dragon Age: Inquisition9.55.7
Civilization: Beyond Earth16.26.1
F1 20141612
Fifa 1515.6
Sims 471168
GRID: Autosport2513
Battlefield 413.3
Asphalt 8: Airborne5847
Dota 229.716.5
GRID 22413.5
BioShock Infinite19972
Tomb Raider271384
Temple Run 234
Dishonored15.211.6
Borderlands 200
Counter-Strike: GO262020.311.4
Diablo III2818
Anno 207026138
The Elder Scrolls V: Skyrim178
Deus Ex Human Revolution25.612
Dirt 328.112.5
Civilization 518.7
StarCraft 26418147
Trackmania Nations Forever1002414
World of Warcraft4718.3
< 30 fps
< 60 fps
< 120 fps
≥ 120 fps
29
2
3
23


9
2

5


Eine Liste mit weiteren Spielen und allen Grafikkarten finden Sie auf unserer Seite: Welches Spiel ist mit welcher Grafikkarte spielbar?

v1.28
log 24. 07:17:37

#0 ran 0s before starting gpusingle class +0s ... 0s

#1 checking url part for id 5499 +0s ... 0s

#2 checking url part for id 7348 +0s ... 0s

#3 checking url part for id 6197 +0s ... 0s

#4 redirected to Ajax server, took 1727155057s time from redirect:0 +0s ... 0s

#5 did not recreate cache, as it is less than 5 days old! Created at Sun, 22 Sep 2024 05:16:22 +0200 +0s ... 0s

#6 composed specs +0.008s ... 0.008s

#7 did output specs +0s ... 0.008s

#8 start showIntegratedCPUs +0s ... 0.008s

#9 getting avg benchmarks for device 5499 +0.01s ... 0.018s

#10 got single benchmarks 5499 +0s ... 0.018s

#11 getting avg benchmarks for device 7348 +0.001s ... 0.02s

#12 got single benchmarks 7348 +0.001s ... 0.021s

#13 getting avg benchmarks for device 6197 +0.003s ... 0.024s

#14 got single benchmarks 6197 +0.025s ... 0.05s

#15 got avg benchmarks for devices +0s ... 0.05s

#16 min, max, avg, median took s +0.024s ... 0.074s

#17 before gaming benchmark output +0s ... 0.074s

#18 Got 223 rows for game benchmarks. +0.016s ... 0.09s

#19 composed SQL query for gamebenchmarks +0s ... 0.09s

#20 got data and put it in $dataArray +0.002s ... 0.091s

#21 benchmarks composed for output. +0.014s ... 0.105s

#22 calculated avg scores. +0s ... 0.105s

#23 return log +0.001s ... 0.106s

Teilen Sie diesen Artikel, um uns zu unterstützen. Jeder Link hilft!
> Notebook Test, Laptop Test und News > Benchmarks / Technik > Benchmarks / Technik > Grafikkarten Vergleich - Head 2 Head
Autor: Klaus Hinum,  8.09.2017 (Update:  1.07.2023)