Notebookcheck Logo

AMD Radeon R3 (Mullins/Beema) vs Intel HD Graphics P530 vs Intel HD Graphics (Cherry Trail)

AMD Radeon R3 (Mullins/Beema)

► remove from comparison AMD Radeon R3 (Mullins/Beema)

Die AMD Radeon R3 ist eine in einigen Mullins- und Beema-APUs (A4-6210, A4 Micro-6400T) von AMD integrierte Grafikeinheit. Sie verfügt über 128 Shadereinheiten auf Basis der GCN-Architektur (zwei Compute Units), die je nach Modell mit bis zu 350 (Mullins), 600 (Beema) oder 686 MHz (Carrizo-L) takten und beherrscht DirectX 12 (FL 12_0). Die Grafikkarte besitzt keinen eigenen Speicher, sondern greift über den Controller der APU auf den Hauptspeicher zu (modellabhängig Single-Channel DDR3L-1333 oder DDR3L-1600).

Per UVD (Unified Video Decoder) kann die Radeon R3 den Prozessor beim Decodieren von Videos unterstützen, zudem wurde ein spezialisierter Video-Encoder (VCE 2.0) integriert. Das Bildsignal kann per VGA, DVI, HDMI 1.4a und DisplayPort 1.2 an bis zu zwei externe Monitore ausgegeben werden.

Die Performance der Radeon R3 kann sich durch unterschiedliche Taktraten von Modell zu Modell stark unterscheiden. Die schnellste Variante erreicht in etwa die Radeon HD 8400, in anderen Fällen entspricht die Leistung nur einer Radeon HD 8250. In der Regel werden nur ältere oder sehr anspruchslose Spiele flüssig bewältigt (Stand 2014).

Intel HD Graphics P530

► remove from comparison Intel HD Graphics P530

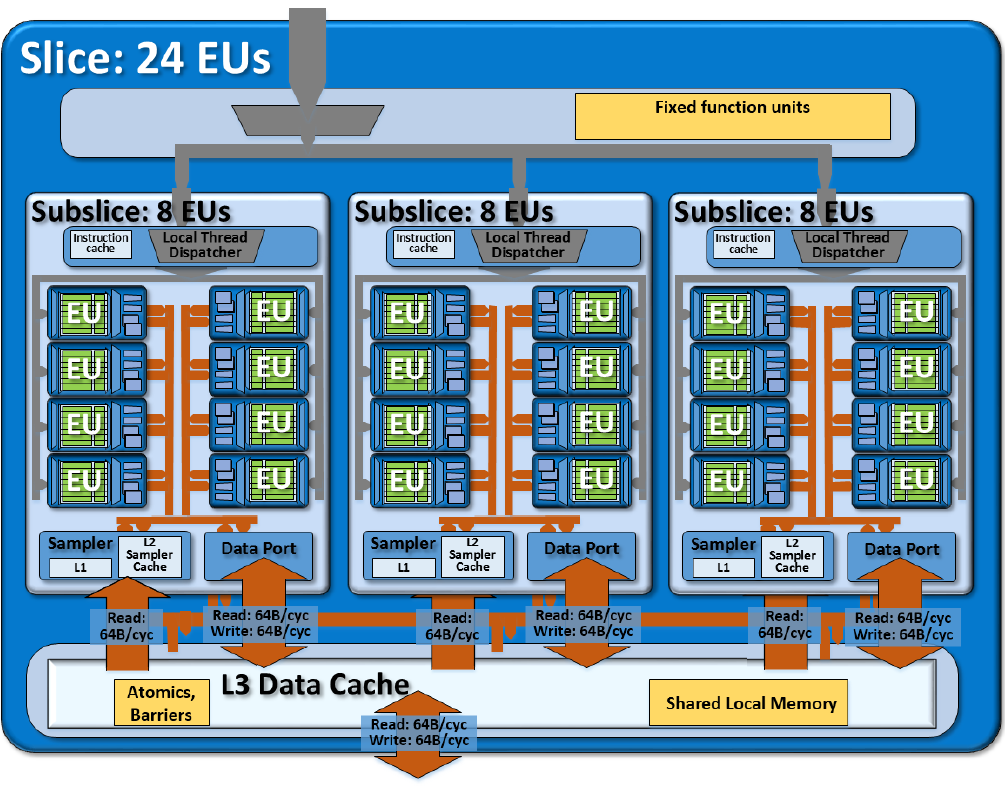
Die Intel HD Graphics P530 (GT2) ist eine integrierte Grafikeinheit, die in Skylake-Prozessoren der Xeon-Baureihe für Workstation-Notebooks verbaut wird. Die mittlere, auch "GT2" genannte Ausbaustufe verfügt über 24 EUs (Execution Units bzw. Ausführungseinheiten) und taktet je nach Modell mit bis zu 1.050 MHz (Turbo). Mangels eigenem Grafikspeicher oder eDRAM-Cache greift die HD Graphics P530 über das Interface des Prozessors auf den System-RAM zu (2x 64 Bit DDR3L-1600/DDR4-2133).

Performance

Die Leistung der HD Graphics P530 dürfte entsprechend der identischen technischen Daten genau auf dem Niveau der HD Graphics 530 liegen. Je nach Spiel kann die GPU damit in etwa mit einer dedizierten GeForce 920M konkurrieren und aktuelle Spiele (Stand 2015) zumeist in niedrigen, selten auch mittleren Einstellungen flüssig darstellen.

Features

Der überarbeitete Videodecoder decodiert nun auch H.265-/HEVC-Videos vollständig in Hardware und arbeitet dadurch deutlich effizienter als bislang. Die Bildausgabe erfolgt über DP 1.2/eDP 1.3 (max. 3.840 x 2.160 @ 60 Hz), wohingegen HDMI nur in der älteren Version 1.4a angeboten wird. Ein HDMI-2.0-Anschluss kann aber mittels Konverter von DisplayPort ergänzt werden. Maximal lassen sich drei Displays parallel angesteuern.

Leistungsaufnahme

Mobile Xeon-Modelle wie der E3-1535M v5 werden von Intel mit einer TDP von 45 Watt spezifiziert, sodass die HD Graphics P530 vor allem in größeren Notebooks ab etwa 15 Zoll zu finden ist.

Intel HD Graphics (Cherry Trail)

► remove from comparison Intel HD Graphics (Cherry Trail)

Die Intel HD Graphics (Cherry Trail) ist eine in den Tablet-SoCs der Cherry-Trail-Serie (z.B. Atom x7-Z8700) integrierte Grafikeinheit. Sie basiert auf der gleichen Architektur wie die GPU verschiedener Broadwell-Prozessoren (z.B. HD Graphics 5300), bietet allerdings deutlich weniger Shadereinheiten und geringere Taktraten. Die genauen Spezifikationen hängen vom jeweiligen SoC ab:

Die schnellste Variante mit 16 EUs und maximal 600 MHz schlägt die ältere HD Graphics (Bay Trail) um Faktor zwei, womit sich die GPU etwas oberhalb einer Qualcomm Adreno 330 oder PowerVR G6430, jedoch deutlich unter einer Adreno 420 oder GX6450 einordnet. Auch Nvidias Tegra-SoCs K1 und X1 rechnen weitaus schneller.

Unter Windows werden sich Anwender deshalb weiter auf sehr alte und anspruchslose Spiele beschränken müssen, wohingegen moderne Android-Games auch in hohen Auflösungen zumeist flüssig dargestellt werden sollten. Der x7-Z8700 war z.B. nur knapp in der Lage Team Fortress 2 in minimalen Details und 1280x720 flüssig wiederzugeben (11 - 69 fps).

Videos kann die GPU auch in 4K/H.265 flüssig wiedergeben (je nach Bitrate und Farbtiefe).

Die Intel HD Graphics Grafikkarte in den Cherry Trail SoCs unterstützt nach unseren Tests mit dem MS Surface 3 mit Atom x7-Z8700 nur DisplayPort 1.1 und damit lediglich 30 Hz bei 4K (3.840 x 2.160).

AMD Radeon R3 (Mullins/Beema)Intel HD Graphics P530Intel HD Graphics (Cherry Trail)
HD Graphics Serie
Radeon R5 (Beema/Carrizo-L) 128 @ 0.85 GHz64 Bit
Radeon R4 (Beema) 128 @ 0.8 GHz64 Bit
Radeon R3 (Mullins/Beema) 128 @ 0.35 - 0.69 GHz64 Bit
Radeon R2 (Mullins/Beema/Carrizo-L) 128 @ 0.3 - 0.6 GHz64 Bit
Radeon R6 (Mullins) 128 @ 0.5 GHz64 Bit
HD Graphics P530 24 @ 0.35 - 1.05 GHz64/128 Bit
HD Graphics 5600 24 @ 0.3 - 1.05 GHz64/128 Bit
HD Graphics 6000 48 @ 0.3 - 1 GHz64/128 Bit
HD Graphics 4600 20 @ 0.2 - 1.35 GHz64/128 Bit
HD Graphics 5500 24 @ 0.3 - 0.95 GHz64/128 Bit
HD Graphics 5000 40 @ 0.2 - 1.1 GHz64/128 Bit
HD Graphics 4400 20 @ 0.2 - 1.1 GHz64/128 Bit
HD Graphics 5300 24 @ 0.1 - 0.9 GHz64/128 Bit
HD Graphics 4000 16 @ 0.35 - 1.35 GHz64/128 Bit
HD Graphics (Broadwell) 12 @ 0.1 - 0.85 GHz64/128 Bit
HD Graphics 4200 20 @ 0.2 - 0.85 GHz64/128 Bit
HD Graphics (Skylake) 12 @ 0.3 - 0.8 GHz64/128 Bit
HD Graphics 405 (Braswell) 16 @ 0.32 - 0.7 GHz64/128 Bit
HD Graphics (Braswell) 16 @ 0.32 - 0.7 GHz64/128 Bit
HD Graphics 400 (Braswell) 12 @ 0.32 - 0.64 GHz64/128 Bit
HD Graphics (Haswell) 10 @ 0.2 - 1 GHz64/128 Bit
HD Graphics (Cherry Trail) 16 @ 0.2 - 0.6 GHz64/128 Bit
HD Graphics 3000 12 @ 0.35 - 1.35 GHz64/128 Bit
HD Graphics 2500 6 @ 0.65 - 1.15 GHz64/128 Bit
HD Graphics (Ivy Bridge) 6 @ 0.35 - 1.1 GHz64/128 Bit
HD Graphics 2000 6 @ 0.85 - 1.35 GHz64/128 Bit
HD Graphics (Sandy Bridge) 6 @ 0.35 - 1.1 GHz64/128 Bit
HD Graphics (Bay Trail) 4 @ 0.31 - 0.9 GHz32/64/128 Bit
CodenameBeema/MullinsSkylake GT2Cherry Trail
ArchitekturGCN 1.1Gen. 9 SkylakeGen. 8
Pipelines128 - unified24 - unified16 - unified
Kerntakt350 - 686 (Boost) MHz350 - 1050 (Boost) MHz200 - 600 (Boost) MHz
Speicherbandbreite64 Bit64/128 Bit64/128 Bit
Shared Memoryjajaja
APIDirectX 12 (FL 12_0), Shader 5.0DirectX 12_1, OpenGL 4.4DirectX 12 (FL 11_1), Shader 5.0, OpenGL 4.3
Herstellungsprozess28 nm14 nm14 nm
Erscheinungsdatum29.04.2014 01.09.2015 02.03.2015
SpeichertypDDR3/DDR4
FeaturesQuickSync
CPU in Radeon R3 (Mullins/Beema)GPU Base SpeedGPU Boost / Turbo
AMD A4-72104 x 1800 MHz, 15 W? MHz686 MHz
AMD A4-62104 x 1800 MHz, 15 W? MHz600 MHz
AMD A4 Micro-6400T4 x 1000 MHz, 4.5 W? MHz350 MHz
min. - max.? MHz350 - 686 MHz
CPU in HD Graphics P530GPU Base SpeedGPU Boost / Turbo
Intel Xeon E3-1535M v54 x 2900 MHz, 45 W350 MHz1050 MHz
Intel Xeon E3-1505M v54 x 2800 MHz, 45 W350 MHz1050 MHz
min. - max.350 - ? MHz350 - 1050 MHz
CPU in HD Graphics (Cherry Trail)GPU Base SpeedGPU Boost / Turbo
Intel Atom x7-Z87004 x 1600 MHz200 MHz600 MHz
Intel Atom x5-Z85004 x 1440 MHz200 MHz600 MHz
Intel Atom x5-Z83504 x 1440 MHz200 MHz500 MHz
min. - max.200 - ? MHz? - 1050 MHz

Benchmarks

Performance Rating - 3DMark 11 + Fire Strike + Time Spy - Radeon R3 (Mullins/Beema)
0.2 pt (1%)
Performance Rating - 3DMark 11 + Fire Strike + Time Spy - HD Graphics (Cherry Trail)
0.1 pt (0%)
3DMark - 3DMark Ice Storm Unlimited Graphics
min: 18563     avg: 20873     median: 19303 (2%)     max: 27537 Points
3DMark - 3DMark Cloud Gate Score
min: 1638     avg: 2296     median: 2391 (3%)     max: 2763 Points
3DMark - 3DMark Cloud Gate Graphics
min: 2099     avg: 2847     median: 3049 (1%)     max: 3191 Points
3DMark - 3DMark Fire Strike Standard Score
min: 219     avg: 359.8     median: 396.5 (1%)     max: 427 Points
3DMark - 3DMark Fire Strike Standard Graphics
min: 253     avg: 384     median: 419.5 (0%)     max: 444 Points
min: 193     avg: 233     median: 225 (0%)     max: 281 Points
3DMark - 3DMark Ice Storm Graphics
min: 22434     avg: 31629     median: 33757 (4%)     max: 36567 Points
min: 7544     avg: 16078     median: 17063.5 (2%)     max: 23395 Points
3DMark - 3DMark Sling Shot (ES 3.0) Unlimited
min: 1445     avg: 1525     median: 1525 (7%)     max: 1605 Points
3DMark - 3DMark Sling Shot (ES 3.0) Unlimited Graphics
min: 1598     avg: 1684     median: 1684 (4%)     max: 1770 Points
3DMark - 3DMark Sling Shot Extreme (ES 3.1) Unlimited
min: 1072     avg: 1215     median: 1159 (6%)     max: 1414 Points
3DMark - 3DMark Sling Shot Extreme (ES 3.1) Unlimited Graphics
min: 1058     avg: 1251     median: 1142 (3%)     max: 1554 Points
3DMark - 3DMark Sling Shot (ES 3.0)
min: 1353     avg: 1429     median: 1398 (12%)     max: 1593 Points
3DMark - 3DMark Sling Shot (ES 3.0) Graphics
min: 1300     avg: 1505     median: 1530 (9%)     max: 1732 Points
3DMark - 3DMark Sling Shot Extreme (ES 3.1)
min: 1037     avg: 1133     median: 1070 (5%)     max: 1319 Points
3DMark - 3DMark Sling Shot Extreme (ES 3.1) Graphics
min: 973     avg: 1102     median: 1054 (4%)     max: 1261 Points
3DMark 11 - 3DM11 Performance Score
min: 444     avg: 619     median: 686 (1%)     max: 740 Points
min: 314     avg: 359.4     median: 343 (0%)     max: 562 Points
3DMark 11 - 3DM11 Performance GPU
min: 394     avg: 576     median: 620 (1%)     max: 668 Points
min: 278     avg: 319.9     median: 298 (0%)     max: 494 Points
3DMark Vantage
3DM Vant. Perf. total + AMD Radeon R3 (Mullins/Beema)
3DMark Vantage - 3DM Vant. Perf. total
min: 1331     avg: 1815     median: 1814.5 (1%)     max: 2298 Points
3DM Vant. Perf. GPU no PhysX + AMD Radeon R3 (Mullins/Beema)
3DMark Vantage - 3DM Vant. Perf. GPU no PhysX
min: 1100     avg: 1512     median: 1511.5 (1%)     max: 1923 Points
3DMark 06 3DMark 06 - Standard 1280x1024 + AMD Radeon R3 (Mullins/Beema)
3DMark 06
min: 2547     avg: 3595     median: 4010 (5%)     max: 4229 Points
3DMark 06 - Standard 1280x1024 + Intel HD Graphics (Cherry Trail)
min: 2403     avg: 2833     median: 2595 (3%)     max: 3330 Points
3DMark 06 - Standard 1024x768 + Intel HD Graphics (Cherry Trail)
3DMark 06
2877 Points (4%)
Unigine Valley 1.0 - Unigine Valley 1.0 DX
1.2 fps (0%)
Unigine Heaven 2.1 - Heaven 2.1 high
min: 5.2     avg: 5.5     median: 5.5 (1%)     max: 5.7 fps
Cinebench R10 Cinebench R10 Shading (32bit) + AMD Radeon R3 (Mullins/Beema)
Cinebench R10 - Cinebench R10 Shading (32bit)
min: 2090     avg: 2732     median: 2908 (2%)     max: 3021 Points
Cinebench R10 Shading (32bit) + Intel HD Graphics (Cherry Trail)
Cinebench R11.5 Cinebench R11.5 OpenGL 64 Bit + AMD Radeon R3 (Mullins/Beema)
Cinebench R11.5 - Cinebench R11.5 OpenGL 64 Bit
min: 9.44     avg: 12.9     median: 13.9 (5%)     max: 14.55 fps
Cinebench R11.5 OpenGL 64 Bit + Intel HD Graphics (Cherry Trail)
Cinebench R15
Cinebench R15 OpenGL 64 Bit + AMD Radeon R3 (Mullins/Beema)
Cinebench R15 - Cinebench R15 OpenGL 64 Bit
min: 8.69     avg: 13.1     median: 14.4 (1%)     max: 14.88 fps
Cinebench R15 OpenGL 64 Bit + Intel HD Graphics (Cherry Trail)
Cinebench R15 OpenGL Ref. Match 64 Bit + AMD Radeon R3 (Mullins/Beema)
Cinebench R15 OpenGL Ref. Match 64 Bit + Intel HD Graphics (Cherry Trail)
GFXBench 3.0 - GFXBench 3.0 Manhattan Offscreen
min: 10.9     avg: 12     median: 11.7 (1%)     max: 13.3 fps
GFXBench (DX / GLBenchmark) 2.7
GFXBench T-Rex HD Offscreen C24Z16 + Intel HD Graphics (Cherry Trail)
LuxMark v2.0 64Bit - LuxMark v2.0 Room GPU
min: 33     avg: 54     median: 64 (0%)     max: 65 Samples/s
min: 48     avg: 58.7     median: 59 (0%)     max: 69 Samples/s
LuxMark v2.0 64Bit - LuxMark v2.0 Sala GPU
min: 57     avg: 92.7     median: 108 (0%)     max: 113 Samples/s
min: 69     avg: 87.7     median: 89 (0%)     max: 105 Samples/s
ComputeMark v2.1 - ComputeMark v2.1 Result
min: 257     avg: 348     median: 379 (0%)     max: 408 Points
277 Points (0%)

Average Benchmarks AMD Radeon R3 (Mullins/Beema) → 0% n=0

Average Benchmarks Intel HD Graphics (Cherry Trail) → 0% n=0

- Bereich der Benchmarkergebnisse für diese Grafikkarte
- Durchschnittliche Benchmarkergebnisse für diese Grafikkarte
* Smaller numbers mean a higher performance
1 This benchmark is not used for the average calculation

Spiele-Benchmarks

Die folgenden Benchmarks basieren auf unseren Spieletests mit Testnotebooks. Die Performance dieser Grafikkarte bei den gelisteten Spielen ist abhängig von der verwendeten CPU, Speicherausstattung, Treiber und auch Betriebssystem. Dadurch müssen die untenstehenden Werte nicht repräsentativ sein. Detaillierte Informationen über das verwendete System sehen Sie nach einem Klick auf den fps-Wert.

low 1280x720
HD Graphics (Cherry Trail):
21.4  fps
low 1280x720
HD Graphics (Cherry Trail):
15.5  fps
low 1280x720
HD Graphics (Cherry Trail):
22.6  fps
low 1024x768
HD Graphics (Cherry Trail):
11.5  fps
med. 1366x768
HD Graphics (Cherry Trail):
7  fps
low 1024x768
HD Graphics (Cherry Trail):
8.8  fps
med. 1366x768
HD Graphics (Cherry Trail):
4.8  fps
Anno 2205

Anno 2205

2015
low 1024x768
HD Graphics (Cherry Trail):
8.1  fps
med. 1366x768
HD Graphics (Cherry Trail):
3.9  fps
low 1366x768
HD Graphics (Cherry Trail):
13.9 16.8 ~ 15 fps
low 1024x768
HD Graphics (Cherry Trail):
15.1  fps
med. 1366x768
HD Graphics (Cherry Trail):
9.8  fps
low 1280x720
HD Graphics (Cherry Trail):
20  fps
med. 1366x768
HD Graphics (Cherry Trail):
15.2  fps
high 1920x1080
HD Graphics (Cherry Trail):
7.2  fps
low 1024x768
100%
Radeon R3 (Mullins/Beema):
49.7  fps
40%
HD Graphics (Cherry Trail):
20.1  fps
med. 1366x768
100%
Radeon R3 (Mullins/Beema):
14.8  fps
84%
HD Graphics (Cherry Trail):
12.5  fps
GTA V

GTA V

2015
low 1024x768
HD Graphics (Cherry Trail):
10.8 (!)  fps
The Crew

The Crew

2014
low 1280x720
100%
Radeon R3 (Mullins/Beema):
13.6  fps
med. 1366x768
100%
Radeon R3 (Mullins/Beema):
10  fps
low 1024x768
100%
Radeon R3 (Mullins/Beema):
15.6  fps
61%
HD Graphics (Cherry Trail):
9.5  fps
med. 1366x768
100%
Radeon R3 (Mullins/Beema):
10.4  fps
55%
HD Graphics (Cherry Trail):
5.7  fps
Far Cry 4

Far Cry 4

2014
low 1024x768
100%
Radeon R3 (Mullins/Beema):
13.1  fps
med. 1366x768
100%
Radeon R3 (Mullins/Beema):
9.2  fps
low 1024x768
100%
Radeon R3 (Mullins/Beema):
8  fps
med. 1366x768
100%
Radeon R3 (Mullins/Beema):
5.3  fps
low 1024x768
100%
Radeon R3 (Mullins/Beema):
26.8 28.4 ~ 28 fps
58%
HD Graphics (Cherry Trail):
16.2  fps
med. 1366x768
100%
Radeon R3 (Mullins/Beema):
9.2 9.8 ~ 10 fps
61%
HD Graphics (Cherry Trail):
6.1  fps
F1 2014

F1 2014

2014
low 1024x768
100%
Radeon R3 (Mullins/Beema):
33  fps
48%
HD Graphics (Cherry Trail):
16  fps
med. 1366x768
100%
Radeon R3 (Mullins/Beema):
24  fps
50%
HD Graphics (Cherry Trail):
12  fps
high 1920x1080
100%
Radeon R3 (Mullins/Beema):
17  fps
low 1024x768
100%
Radeon R3 (Mullins/Beema):
8.3  fps
med. 1366x768
100%
Radeon R3 (Mullins/Beema):
5.1  fps
low 1024x768
100%
Radeon R3 (Mullins/Beema):
11.4  fps
med. 1366x768
100%
Radeon R3 (Mullins/Beema):
7.1  fps
low 1024x768
100%
Radeon R3 (Mullins/Beema):
19.9  fps
med. 1366x768
100%
Radeon R3 (Mullins/Beema):
12.3  fps
low 1280x720
100%
Radeon R3 (Mullins/Beema):
14.7  fps
med. 1344x756
100%
Radeon R3 (Mullins/Beema):
9  fps
Fifa 15

Fifa 15

2014
low 1280x720
100%
Radeon R3 (Mullins/Beema):
25.3  fps
62%
HD Graphics (Cherry Trail):
15.6  fps
high 1366x768
100%
Radeon R3 (Mullins/Beema):
18.5  fps
Sims 4

Sims 4

2014
low 1024x768
100%
Radeon R3 (Mullins/Beema):
70.1  fps
101%
HD Graphics (Cherry Trail):
65.6 66.6 81.4 ~ 71 fps
med. 1366x768
100%
Radeon R3 (Mullins/Beema):
25.5  fps
63%
HD Graphics (Cherry Trail):
9.4 16.9 21.2 ~ 16 fps
high 1920x1080
HD Graphics (Cherry Trail):
5.5 10 ~ 8 fps
low 1024x768
100%
Radeon R3 (Mullins/Beema):
19.9  fps
med. 1366x768
100%
Radeon R3 (Mullins/Beema):
11  fps
low 1024x768
100%
Radeon R3 (Mullins/Beema):
55.5  fps
45%
HD Graphics (Cherry Trail):
22 27.3 ~ 25 fps
med. 1366x768
100%
Radeon R3 (Mullins/Beema):
22.6  fps
58%
HD Graphics (Cherry Trail):
12.5 13.5 ~ 13 fps
high 1920x1080
100%
Radeon R3 (Mullins/Beema):
12.5  fps
low 1024x768
100%
Radeon R3 (Mullins/Beema):
10.9  fps
med. 1366x768
100%
Radeon R3 (Mullins/Beema):
8  fps
low 1280x720
100%
Radeon R3 (Mullins/Beema):
15.5  fps
med. 1280x720
100%
Radeon R3 (Mullins/Beema):
13.8  fps
Thief

Thief

2014
low 1024x768
100%
Radeon R3 (Mullins/Beema):
9.6  fps
med. 1366x768
100%
Radeon R3 (Mullins/Beema):
7  fps
high 1366x768
100%
Radeon R3 (Mullins/Beema):
5.8  fps
low 1024x768
100%
Radeon R3 (Mullins/Beema):
14.1  fps
med. 1366x768
100%
Radeon R3 (Mullins/Beema):
10.8  fps
high 1366x768
100%
Radeon R3 (Mullins/Beema):
5.1  fps
low 1024x768
100%
Radeon R3 (Mullins/Beema):
17.8  fps
med. 1366x768
100%
Radeon R3 (Mullins/Beema):
10.7  fps
high 1366x768
100%
Radeon R3 (Mullins/Beema):
5.1  fps
low 1024x768
100%
Radeon R3 (Mullins/Beema):
20.2  fps
66%
HD Graphics (Cherry Trail):
13.3  fps
med. 1366x768
100%
Radeon R3 (Mullins/Beema):
14.7  fps
high 1366x768
100%
Radeon R3 (Mullins/Beema):
10.1  fps
low 1024x768
100%
Radeon R3 (Mullins/Beema):
32  fps
med. 1366x768
100%
Radeon R3 (Mullins/Beema):
18  fps
high 1366x768
100%
Radeon R3 (Mullins/Beema):
9  fps
F1 2013

F1 2013

2013
low 1024x768
100%
Radeon R3 (Mullins/Beema):
19  fps
med. 1366x768
100%
Radeon R3 (Mullins/Beema):
14  fps
high 1366x768
100%
Radeon R3 (Mullins/Beema):
13  fps
low 1024x768
100%
Radeon R3 (Mullins/Beema):
26.5  fps
med. 1366x768
100%
Radeon R3 (Mullins/Beema):
19.2  fps
high 1366x768
100%
Radeon R3 (Mullins/Beema):
15.3  fps
low 1280x720
100%
Radeon R3 (Mullins/Beema):
10.4  fps
med. 1366x768
100%
Radeon R3 (Mullins/Beema):
8.3  fps
high 1366x768
100%
Radeon R3 (Mullins/Beema):
4.3  fps
low 1024x768
100%
Radeon R3 (Mullins/Beema):
18.8  fps
med. 1366x768
100%
Radeon R3 (Mullins/Beema):
11.5  fps
high 1366x768
100%
Radeon R3 (Mullins/Beema):
8.1  fps
low 1024x768
100%
Radeon R3 (Mullins/Beema):
21.2  fps
med. 1366x768
100%
Radeon R3 (Mullins/Beema):
13.1  fps
high 1366x768
100%
Radeon R3 (Mullins/Beema):
5.1  fps
Asphalt 8: Airborne

Asphalt 8: Airborne

2013
low
HD Graphics (Cherry Trail):
58  fps
high
HD Graphics (Cherry Trail):
47  fps
Dota 2

Dota 2

2013
low 1024x768
100%
Radeon R3 (Mullins/Beema):
24.9  fps
119%
HD Graphics (Cherry Trail):
29.7  fps
med. 1366x768
100%
Radeon R3 (Mullins/Beema):
21.2  fps
78%
HD Graphics (Cherry Trail):
16.5  fps
low 1024x768
100%
Radeon R3 (Mullins/Beema):
9.7  fps
med. 1366x768
100%
Radeon R3 (Mullins/Beema):
7.3  fps
GRID 2

GRID 2

2013
low 1024x768
100%
Radeon R3 (Mullins/Beema):
27.6  fps
87%
HD Graphics (Cherry Trail):
24  fps
med. 1366x768
100%
Radeon R3 (Mullins/Beema):
14.4  fps
94%
HD Graphics (Cherry Trail):
13.5  fps
high 1366x768
100%
Radeon R3 (Mullins/Beema):
12.5  fps
low 1024x768
100%
Radeon R3 (Mullins/Beema):
13.5  fps
med. 1366x768
100%
Radeon R3 (Mullins/Beema):
10.4  fps
high 1366x768
100%
Radeon R3 (Mullins/Beema):
5.8  fps
low 1280x720
100%
Radeon R3 (Mullins/Beema):
30.4 30.6 ~ 31 fps
61%
HD Graphics (Cherry Trail):
16 18 18.9 19.8 20.1 20.5 ~ 19 fps
med. 1366x768
100%
Radeon R3 (Mullins/Beema):
15.5  fps
58%
HD Graphics (Cherry Trail):
6.4 7.9 9.3 9.8 10 10 ~ 9 fps
high 1366x768
100%
Radeon R3 (Mullins/Beema):
13.3  fps
53%
HD Graphics (Cherry Trail):
5.6 5.7 6.7 7.6 7.9 8.4 ~ 7 fps
ultra 1920x1080
HD Graphics (Cherry Trail):
2.4 2.6 ~ 2 fps
low 1024x768
100%
Radeon R3 (Mullins/Beema):
66.6 76.6 ~ 72 fps
med. 1366x768
100%
Radeon R3 (Mullins/Beema):
22.1 27 ~ 25 fps
high 1366x768
100%
Radeon R3 (Mullins/Beema):
14.9  fps
low 1024x768
100%
Radeon R3 (Mullins/Beema):
20.7 31.3 31.7 31.8 ~ 29 fps
93%
HD Graphics (Cherry Trail):
19.7 25.7 27.8 30.2 33.6 ~ 27 fps
med. 1366x768
100%
Radeon R3 (Mullins/Beema):
10.2 15.8 15.9 16.7 ~ 15 fps
87%
HD Graphics (Cherry Trail):
10.5 12 13.2 13.5 14.8 ~ 13 fps
high 1366x768
100%
Radeon R3 (Mullins/Beema):
6.9 10.8 10.8 ~ 10 fps
80%
HD Graphics (Cherry Trail):
7 8.3 9 ~ 8 fps
ultra 1920x1080
HD Graphics (Cherry Trail):
3.7 3.8 ~ 4 fps
Crysis 3

Crysis 3

2013
low 1024x768
100%
Radeon R3 (Mullins/Beema):
13.3  fps
med. 1366x768
100%
Radeon R3 (Mullins/Beema):
8.5  fps
low 1024x768
100%
Radeon R3 (Mullins/Beema):
43.7  fps
med. 1366x768
100%
Radeon R3 (Mullins/Beema):
19.5  fps
high 1366x768
100%
Radeon R3 (Mullins/Beema):
15.5  fps
Temple Run 2

Temple Run 2

2013
high
HD Graphics (Cherry Trail):
34  fps
low 1024x768
100%
Radeon R3 (Mullins/Beema):
15.6  fps
med. 1366x768
100%
Radeon R3 (Mullins/Beema):
12.1  fps
high 1366x768
100%
Radeon R3 (Mullins/Beema):
5.8  fps
low 1024x768
100%
Radeon R3 (Mullins/Beema):
30.5  fps
med. 1366x768
100%
Radeon R3 (Mullins/Beema):
21.5  fps
high 1366x768
100%
Radeon R3 (Mullins/Beema):
10.3  fps
low 1024x768
100%
Radeon R3 (Mullins/Beema):
18.3  fps
med. 1366x768
100%
Radeon R3 (Mullins/Beema):
12.2  fps
high 1366x768
100%
Radeon R3 (Mullins/Beema):
9.9  fps
low 1024x768
100%
Radeon R3 (Mullins/Beema):
17.6  fps
86%
HD Graphics (Cherry Trail):
15.2  fps
med. 1366x768
100%
Radeon R3 (Mullins/Beema):
14.1  fps
82%
HD Graphics (Cherry Trail):
11.6  fps
high 1366x768
100%
Radeon R3 (Mullins/Beema):
12.8  fps
low 1024x768
HD Graphics (Cherry Trail):
0 (!)  fps
med. 1366x768
HD Graphics (Cherry Trail):
0 (!)  fps
low 1024x768
100%
Radeon R3 (Mullins/Beema):
52.8  fps
49%
HD Graphics (Cherry Trail):
14.1 21.6 41.1 ~ 26 fps
med. 1366x768
100%
Radeon R3 (Mullins/Beema):
40.8  fps
49%
HD Graphics (Cherry Trail):
4.8 18.6 35.1 ~ 20 fps
high 1366x768
100%
Radeon R3 (Mullins/Beema):
28.5  fps
71%
HD Graphics (Cherry Trail):
20.3  fps
ultra 1920x1080
HD Graphics (Cherry Trail):
11.4  fps
low 1024x768
100%
Radeon R3 (Mullins/Beema):
31.2  fps
med. 1366x768
100%
Radeon R3 (Mullins/Beema):
21.3  fps
high 1366x768
100%
Radeon R3 (Mullins/Beema):
17  fps
low 1024x768
100%
Radeon R3 (Mullins/Beema):
37.8 38.7 ~ 38 fps
74%
HD Graphics (Cherry Trail):
24.3 31.9 ~ 28 fps
med. 1366x768
100%
Radeon R3 (Mullins/Beema):
24.7 26.1 ~ 25 fps
72%
HD Graphics (Cherry Trail):
16 19 ~ 18 fps
high 1366x768
100%
Radeon R3 (Mullins/Beema):
19.8 20.8 ~ 20 fps
low 1280x720
100%
Radeon R3 (Mullins/Beema):
22.9  fps
high 1366x768
100%
Radeon R3 (Mullins/Beema):
16.8  fps
Alan Wake

Alan Wake

2012
low 1024x768
100%
Radeon R3 (Mullins/Beema):
13.6  fps
med. 1366x768
100%
Radeon R3 (Mullins/Beema):
8.3  fps
Anno 2070

Anno 2070

2011
low 1024x768
100%
Radeon R3 (Mullins/Beema):
29.3 43 ~ 36 fps
72%
HD Graphics (Cherry Trail):
15.3 28.1 33.1 ~ 26 fps
med. 1366x768
100%
Radeon R3 (Mullins/Beema):
12.9 19.1 ~ 16 fps
81%
HD Graphics (Cherry Trail):
12.8 13.4 13.7 ~ 13 fps
high 1366x768
100%
Radeon R3 (Mullins/Beema):
8.1  fps
99%
HD Graphics (Cherry Trail):
8  fps
low 1280x720
100%
Radeon R3 (Mullins/Beema):
17  fps
100%
HD Graphics (Cherry Trail):
15.5 18.9 ~ 17 fps
med. 1366x768
100%
Radeon R3 (Mullins/Beema):
11.3  fps
71%
HD Graphics (Cherry Trail):
7.2 8.5 ~ 8 fps
high 1366x768
100%
Radeon R3 (Mullins/Beema):
7.2  fps
low 1024x768
100%
Radeon R3 (Mullins/Beema):
16.2  fps
med. 1366x768
100%
Radeon R3 (Mullins/Beema):
12.2  fps
high 1366x768
100%
Radeon R3 (Mullins/Beema):
9.1  fps
low 1024x768
100%
Radeon R3 (Mullins/Beema):
28.7  fps
89%
HD Graphics (Cherry Trail):
25.6  fps
high 1366x768
100%
Radeon R3 (Mullins/Beema):
12  fps
100%
HD Graphics (Cherry Trail):
12  fps
Dirt 3

Dirt 3

2011
low 800x600
100%
Radeon R3 (Mullins/Beema):
59.2  fps
47%
HD Graphics (Cherry Trail):
28.1  fps
med. 1024x768
100%
Radeon R3 (Mullins/Beema):
31.6  fps
40%
HD Graphics (Cherry Trail):
12.5  fps
high 1360x768
100%
Radeon R3 (Mullins/Beema):
21  fps
Total War: Shogun 2

Total War: Shogun 2

2011
low 1024x768
100%
Radeon R3 (Mullins/Beema):
55.1  fps
med. 1280x720
100%
Radeon R3 (Mullins/Beema):
12.1  fps
Civilization 5

Civilization 5

2010
low 1024x768
HD Graphics (Cherry Trail):
18.7  fps
low 1024x768
HD Graphics (Cherry Trail):
63.2 64 ~ 64 fps
med. 1360x768
HD Graphics (Cherry Trail):
18 18.8 ~ 18 fps
high 1360x768
HD Graphics (Cherry Trail):
14  fps
ultra 1920x1080
HD Graphics (Cherry Trail):
7  fps
low 1024x768
100%
Radeon R3 (Mullins/Beema):
21.2  fps
med. 1366x768
100%
Radeon R3 (Mullins/Beema):
15.6  fps
high 1366x768
100%
Radeon R3 (Mullins/Beema):
9  fps
Resident Evil 5

Resident Evil 5

2009
low 800x600
100%
Radeon R3 (Mullins/Beema):
35.8  fps
Trackmania Nations Forever

Trackmania Nations Forever

2008
low 640x480
100%
Radeon R3 (Mullins/Beema):
70.8  fps
141%
HD Graphics (Cherry Trail):
77.3 92.6 96.1 97.8 99.7 105 128 ~ 100 fps
high 1024x768
100%
Radeon R3 (Mullins/Beema):
19.6  fps
122%
HD Graphics (Cherry Trail):
18.2 21.3 22.9 24.4 24.7 25 29.2 ~ 24 fps
ultra 1920x1080
HD Graphics (Cherry Trail):
9.6 15.5 16.8 ~ 14 fps
World of Warcraft

World of Warcraft

2005
low 800x600
HD Graphics (Cherry Trail):
44 50.9 ~ 47 fps
med. 1024x768
HD Graphics (Cherry Trail):
18.3  fps

Average Gaming AMD Radeon R3 (Mullins/Beema) → 100%

Average Gaming 30-70 fps → 100%

Average Gaming Intel HD Graphics (Cherry Trail) → 74%

Intel HD Graphics (Cherry Trail)lowmed.highultraQHD4K
Team Fortress 221.4
Rocket League15.5
Farming Simulator 1722.6
Rainbow Six Siege11.57
Star Wars Battlefront8.84.8
Anno 22058.13.9
World of Warships15
Metal Gear Solid V15.19.8
Dota 2 Reborn2015.27.2
Dirt Rally20.112.5
GTA V10.8
Dragon Age: Inquisition9.55.7
Civilization: Beyond Earth16.26.1
F1 20141612
Fifa 1515.6
Sims 471168
GRID: Autosport2513
Battlefield 413.3
Asphalt 8: Airborne5847
Dota 229.716.5
GRID 22413.5
BioShock Infinite19972
Tomb Raider271384
Temple Run 234
Dishonored15.211.6
Borderlands 200
Counter-Strike: GO262020.311.4
Diablo III2818
Anno 207026138
The Elder Scrolls V: Skyrim178
Deus Ex Human Revolution25.612
Dirt 328.112.5
Civilization 518.7
StarCraft 26418147
Trackmania Nations Forever1002414
World of Warcraft4718.3
< 30 fps
< 60 fps
< 120 fps
≥ 120 fps
29
2
3
23


9
2

5


AMD Radeon R3 (Mullins/Beema)lowmed.highultraQHD4K
Dirt Rally49.714.8
The Crew13.610
Dragon Age: Inquisition15.610.4
Far Cry 413.19.2
Assassin's Creed Unity85.3
Civilization: Beyond Earth2810
F1 2014332417
The Evil Within8.35.1
Ryse: Son of Rome11.47.1
Alien: Isolation19.912.3
Middle-earth: Shadow of Mordor14.79
Fifa 1525.318.5
Sims 470.125.5
Risen 3: Titan Lords19.911
GRID: Autosport55.522.612.5
Watch Dogs10.98
Wolfenstein: The New Order15.513.8
Thief9.675.8
Assassin´s Creed IV: Black Flag14.110.85.1
X-Plane 10.2517.810.75.1
Battlefield 420.214.710.1
Batman: Arkham Origins32189
F1 2013191413
Total War: Rome II26.519.215.3
Saints Row IV10.48.34.3
The Bureau: XCOM Declassified18.811.58.1
Splinter Cell: Blacklist21.213.15.1
Dota 224.921.2
Company of Heroes 29.77.3
GRID 227.614.412.5
Metro: Last Light13.510.45.8
BioShock Infinite3115.513.3
StarCraft II: Heart of the Swarm722514.9
Tomb Raider291510
Crysis 313.38.5
Dead Space 343.719.515.5
Hitman: Absolution15.612.15.8
Call of Duty: Black Ops 230.521.510.3
Medal of Honor: Warfighter18.312.29.9
Dishonored17.614.112.8
Counter-Strike: GO52.840.828.5
Dirt Showdown31.221.317
Diablo III382520
Mass Effect 322.916.8
Alan Wake13.68.3
Anno 207036168.1
The Elder Scrolls V: Skyrim1711.37.2
Battlefield 316.212.29.1
Deus Ex Human Revolution28.712
Dirt 359.231.621
Total War: Shogun 255.112.1
Battlefield: Bad Company 221.215.69
Resident Evil 535.8
Trackmania Nations Forever70.819.6
< 30 fps
< 60 fps
< 120 fps
≥ 120 fps
37
14
3
47
2

34


Eine Liste mit weiteren Spielen und allen Grafikkarten finden Sie auf unserer Seite: Welches Spiel ist mit welcher Grafikkarte spielbar?

v1.28
log 24. 07:21:14

#0 ran 0s before starting gpusingle class +0s ... 0s

#1 checking url part for id 5497 +0s ... 0s

#2 checking url part for id 6452 +0s ... 0s

#3 checking url part for id 6197 +0s ... 0s

#4 redirected to Ajax server, took 1727155273s time from redirect:1 +0s ... 0s

#5 did not recreate cache, as it is less than 5 days old! Created at Sun, 22 Sep 2024 05:16:22 +0200 +0s ... 0s

#6 composed specs +0.008s ... 0.008s

#7 did output specs +0s ... 0.008s

#8 start showIntegratedCPUs +0s ... 0.008s

#9 getting avg benchmarks for device 5497 +0.011s ... 0.019s

#10 got single benchmarks 5497 +0.001s ... 0.02s

#11 getting avg benchmarks for device 6452 +0s ... 0.021s

#12 got single benchmarks 6452 +0s ... 0.021s

#13 getting avg benchmarks for device 6197 +0.003s ... 0.024s

#14 got single benchmarks 6197 +0.024s ... 0.048s

#15 got avg benchmarks for devices +0s ... 0.048s

#16 min, max, avg, median took s +0.023s ... 0.071s

#17 before gaming benchmark output +0s ... 0.071s

#18 Got 294 rows for game benchmarks. +0.017s ... 0.088s

#19 composed SQL query for gamebenchmarks +0s ... 0.088s

#20 got data and put it in $dataArray +0.003s ... 0.091s

#21 benchmarks composed for output. +0.021s ... 0.112s

#22 calculated avg scores. +0s ... 0.112s

#23 return log +0.001s ... 0.112s

Teilen Sie diesen Artikel, um uns zu unterstützen. Jeder Link hilft!
> Notebook Test, Laptop Test und News > Benchmarks / Technik > Benchmarks / Technik > Grafikkarten Vergleich - Head 2 Head
Autor: Klaus Hinum,  8.09.2017 (Update:  1.07.2023)