Notebookcheck Logo

AMD Radeon 680M vs NVIDIA T1000 vs NVIDIA T500 Laptop GPU

AMD Radeon 680M

► remove from comparison AMD Radeon 680M

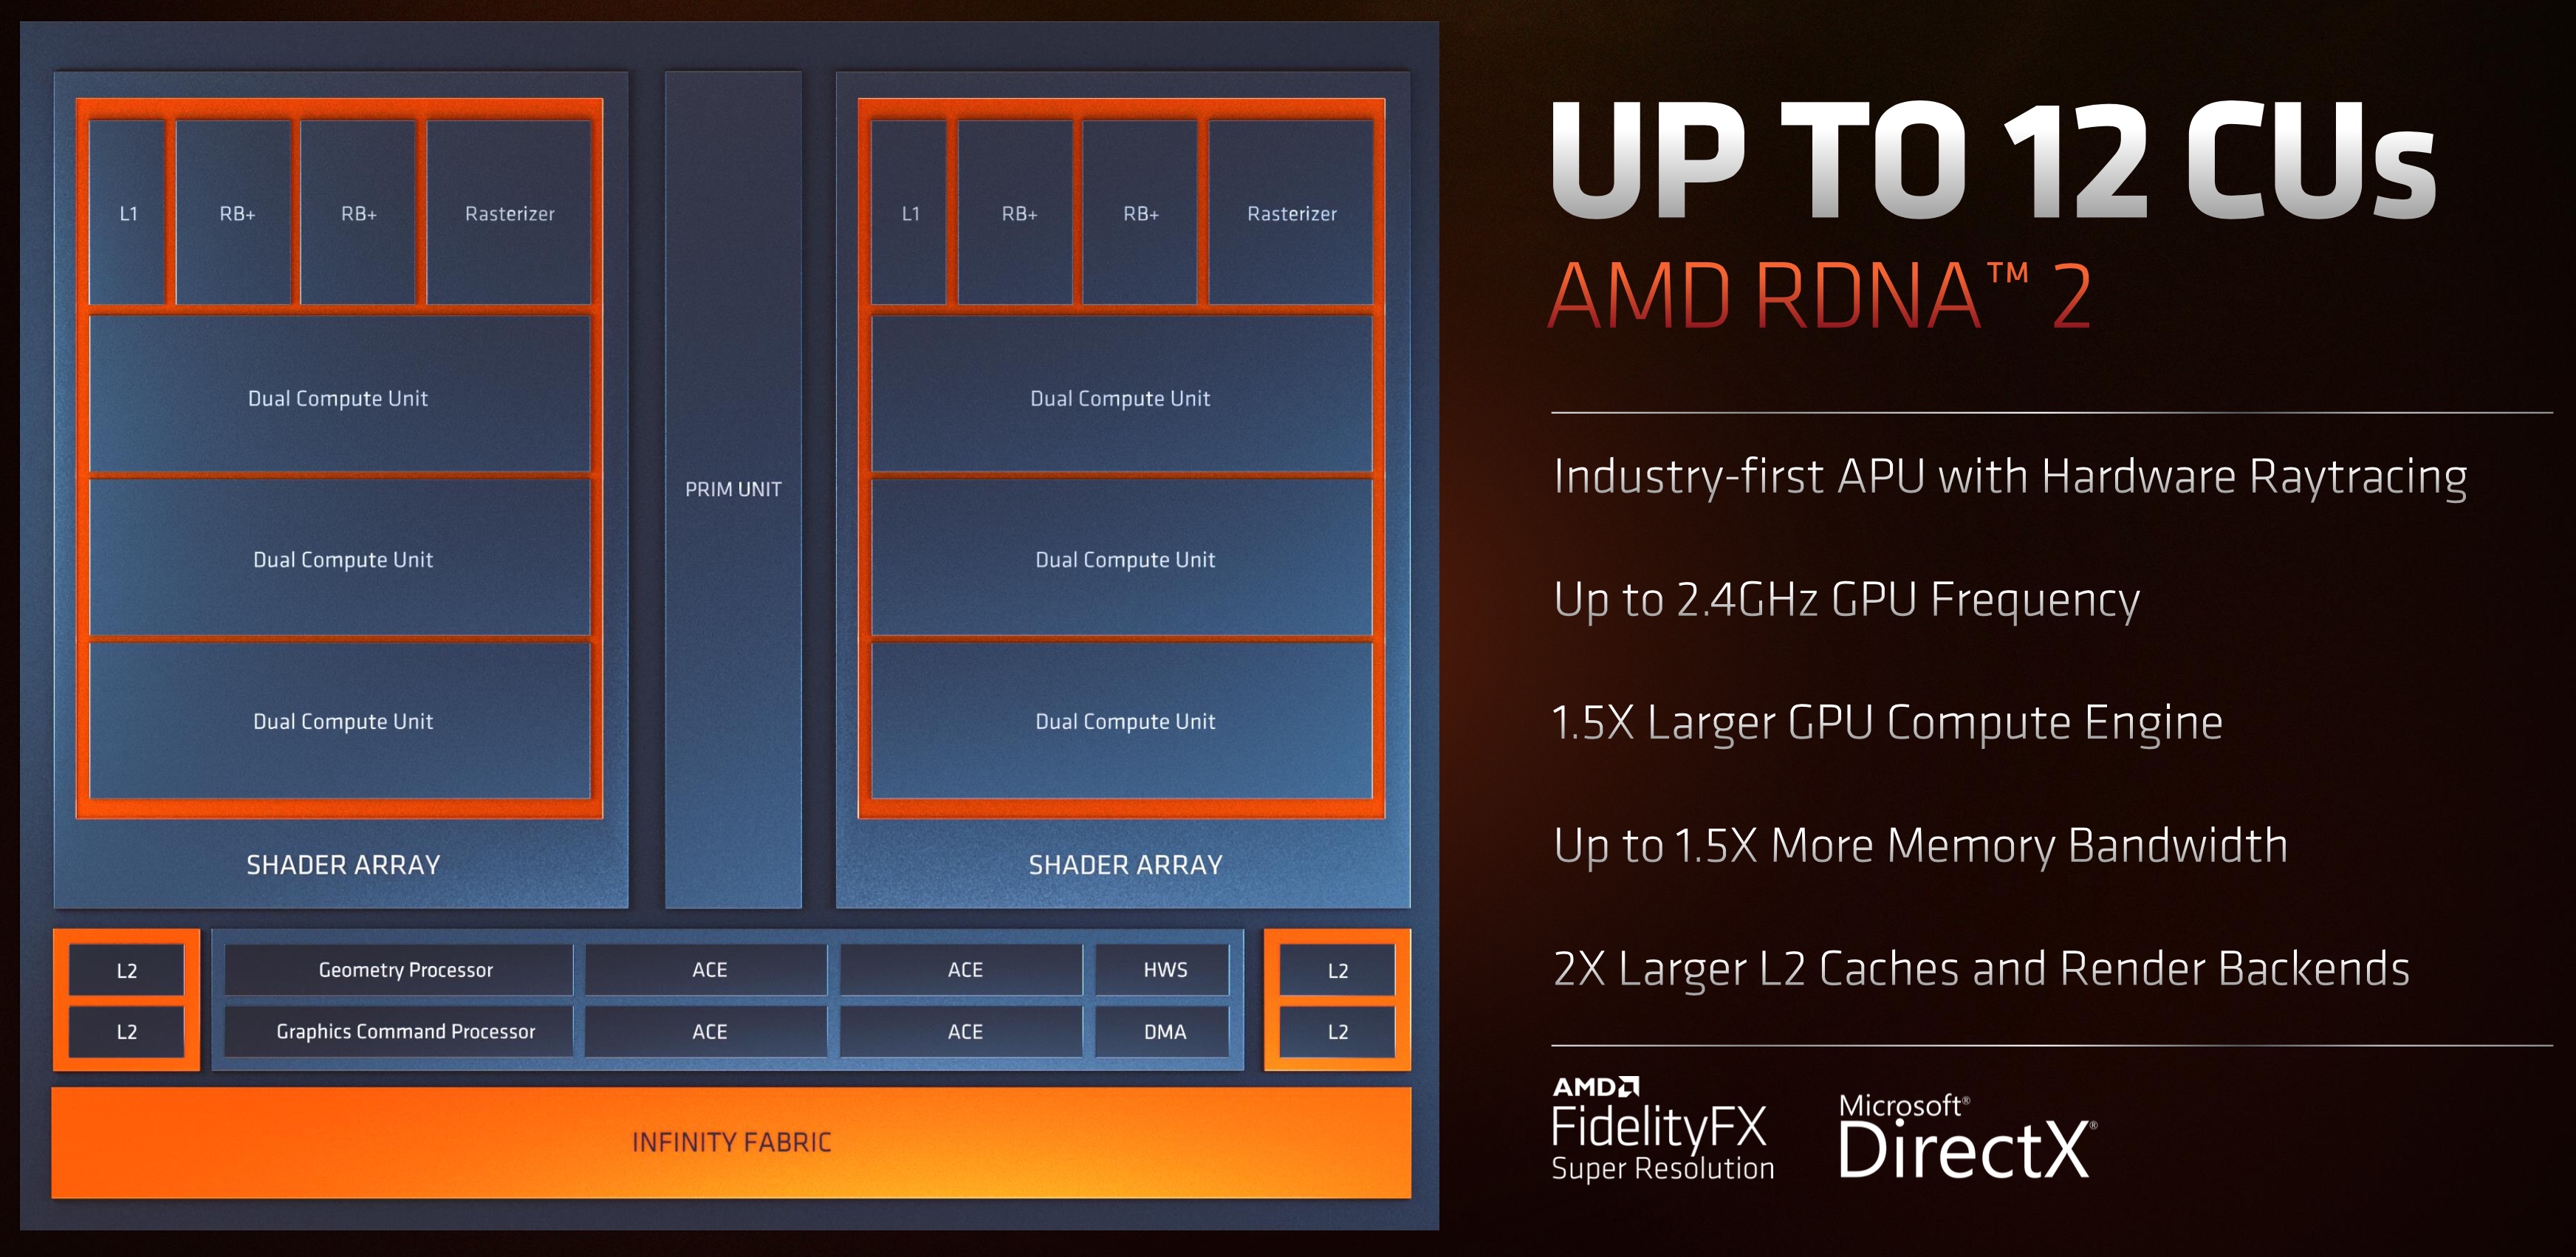
Die AMD Radeon 680M (oder RX 680M) ist eine integrierte Grafikkarte (iGPU) für Notebooks. Sie befindet sich in den stärkeren Rembrandt (Ryzen 6000 Mobile) APUs und bietet alle 12 CUs (768 Shader). Sie nutzt die aktuelle RDNA 2 Architektur (wie die RX 6000M Serie). Die Taktrate ist abhängig vom CPU-Modell und rangiert beim Launch von 2,2 - 2,4 GHz (maximaler Boost-Takt). Die GPU hat keinen eigenen Grafikspeicher, sondern nutzt den gemeinsamen Hauptspeicher (bis zu LPDDR5 6400 MT/s oder DDR5 4800 MT/s). Als erste iGPU unterstützt die 680M Raytracing in Hardware, ist jedoch bei aktuellen Spielen zu langsam um dieses Feature sinnvoll nutzen zu können.

Die Leistung der GPU ist abhängig von der CPU, dem konfiguriertem TDP (15 - 45W+), der Kühlung und dem verbautem Hauptspeicher. Die Performance sollte durch die neue Architektur und der erhöhten CU-Anzahl deutlich oberhalb der alten Radeon RX Vega 8 (Cezanne, z.B. Ryzen 7 5800U) liegen. Die dedizierten Radeon RX 5300M ist jedoch deutlich schneller. Laut AMD liegt die Leistung oberhalb einer dedizierten Nvidia GeForce MX450 und ermöglicht damit 1080p Gaming bei niedrigen Details.

Der Stromverbrauch ist dank 6nm Prozess und ausgeklügelten Stromsparmechanismen relativ gering (laut AMD) und daher eignet sich die Grafikkarte auch für dünne und leichte Notebooks.

NVIDIA T1000

► remove from comparison

Die Nvidia T1000 Desktop ist eine professionelle Grafikkarte für kleine Workstations der Einstiegsklasse. Sie basiert auf dem selben TU117 Turing-Chip wie die Consumer GeForce GTX1650. Auch die Anzahl der Shadereinheiten ist mit 896 identisch. Mit 8-GB-VRAM bietet die Nvidia T1000 mehr VRAM, welcher weiterhin über ein 128 Bit Speicherbus angebunden ist. Die Leistungsaufnahme der Nvidia T1000 beträgt nur 50 Watt und kommt daher ohne einen zusätzlichen Stromanschluss aus.

Die professionellen Grafikkarten bieten zertifizierte Treiber, welche auf Stabiltität und Performance bei professionellen Anwendungen (CAD-, DCC-, Medizin-, Prospektions-, Visualisierungsanwendungen) optimiert sind. Dadurch ist die Performance im Vergleich zu den Consumergrafikkarten mit gleichem Chip in diesen Bereichen deutlich besser.

Die kleineren Chips der Turing Serie bietet im Unterschied zu den stärkeren RTX Karten (z.B. Quadro RTX 3000) keine Raytracing und Tensor Kerne. Bei der Turing Architektur gab es auch auf der Ebene der CUDA-Kerne deutliche Verbesserungen. Float und INT Operationen können nun gleichzeitig ausgeführt werden, der Cache wurde vereinheitlicht und verbessert und Adaptive Shading eingeführt. Nvidia spricht dadurch von einer bis zu 50% höheren Leistung pro Kern im Vergleich zu Pascal.

NVIDIA T500 Laptop GPU

► remove from comparison NVIDIA T500 Laptop GPU

Die Nvidia T500 Mobile (oder auch Quadro T500 Mobile) für Laptops ist eine professionelle Grafikkarte für Notebooks und mobile Workstations der Einstiegsklasse. Sie basiert auf den selben TU117 Turing-Chip wie die Consumer GeForce MX450 und bietet ebenso 896 Shader und einen 64 Bit Speicherbus. Der Boost-Takt ist jedoch anscheinend etwas höher. Wie auch die MX450 ist sie mit GDDR5 und GDDR6 erhältlich, aktuell gibt es 2 und 4 GB Speichervarianten. Der TDP ist mit 18 - 25 Watt je nach Variante spezifiziert.

Die Quadro-Grafikkarten bieten zertifizierte Treiber, welche auf Stabiltität und Performance bei professionellen Anwendungen (CAD-, DCC-, Medizin-, Prospektions-, Visualisierungsanwendungen) optimiert sind. Dadurch ist die Performance im Vergleich zu den Consumergrafikkarten mit gleichem Chip in diesen Bereichen deutlich besser.

Die kleineren Chips der Turing Serie bietet im Unterschied zu den stärkeren RTX Karten (z.B. Quadro RTX 3000) keine Raytracing und Tensor Kerne. Bei der Turing Architektur gab es auch auf der Ebene der CUDA-Kerne deutliche Verbesserungen. Float und INT Operationen können nun gleichzeitig ausgeführt werden, der Cache wurde vereinheitlicht und verbessert und Adaptive Shading eingeführt. Nvidia spricht dadurch von einer bis zu 50% höheren Leistung pro Kern im Vergleich zu Pascal.

AMD Radeon 680MNVIDIA T1000NVIDIA T500 Laptop GPU
Quadro Turing Serie
Radeon 680M 768 @ 2.4 GHz
Radeon 660M 384 @ 1.9 GHz
Radeon Graphics (Ryzen 7000) 128 @ 2.2 GHz
Radeon 610M 128 @ 0.4 - 2.2 GHz
Quadro RTX 6000 (Laptop) 4608 @ 1.28 - 1.46 GHz384 Bit @ 14000 MHz
Quadro RTX 5000 (Laptop) 3072 @ 1.04 - 1.55 GHz256 Bit @ 14000 MHz
Quadro RTX 5000 Max-Q 3072 @ 0.6 - 1.35 GHz256 Bit @ 14000 MHz
Quadro RTX 4000 (Laptop) 2560 @ 1.11 - 1.56 GHz256 Bit @ 14000 MHz
Quadro RTX 4000 Max-Q 2560 @ 0.78 - 1.38 GHz256 Bit @ 14000 MHz
Quadro RTX 3000 (Laptop) 1920 @ 0.95 - 1.38 GHz192 Bit @ 14000 MHz
Quadro RTX 3000 Max-Q 1920 @ 0.6 - 1.22 GHz192 Bit @ 14000 MHz
Quadro T2000 (Laptop) 1024 @ 1.58 - 1.79 GHz128 Bit @ 8000 MHz
Quadro T2000 Max-Q 1024 @ 0.93 - 1.5 GHz128 Bit @ 8000 MHz
T1000 896 @ 1.07 - 1.4 GHz128 Bit @ 10000 MHz
T1200 Laptop GPU 1024 @ 0.86 - 1.43 GHz128 Bit @ 10000 MHz
Quadro T1000 (Laptop) 768 @ 1.4 - 1.46 GHz128 Bit @ 8000 MHz
Quadro T1000 Max-Q 768 @ 0.8 - 1.46 GHz128 Bit @ 8000 MHz
T600 Laptop GPU 896 @ 1.4 GHz128 Bit @ 10000 MHz
T550 Laptop GPU 1024 @ 1.07 - 1.67 GHz64 Bit @ 12000 MHz
T500 Laptop GPU 896 @ 1.37 - 1.7 GHz64 Bit @ 10000 MHz
T600 640 @ 0.74 - 1.34 GHz128 Bit @ 10000 MHz
CodenameRDNA 2 Rembrandt
ArchitekturRDNA 2TuringTuring
Pipelines768 - unified896 - unified896 - unified
Kerntakt2400 (Boost) MHz1065 - 1395 (Boost) MHz1365 - 1695 (Boost) MHz
Shared Memoryneinneinnein
APIDirectX 12_1DirectX 12_1, Shader 6.8, OpenGL 4.6, OpenCL 3.0, Vulkan 1.3DirectX 12_1, OpenGL 4.6
Stromverbrauch45 Watt50 Watt25 Watt
Herstellungsprozess6 nm12 nm12 nm
FeaturesTiled Rasterization, Shared Memory (up to Dual-Channel DDR4-3200)
Erscheinungsdatum04.01.2022 06.05.2021 27.05.2019
TMUs56
ROPs32
Theoretical Performance5000 TFLOPS FP16, 2500 TFLOPS FP32, 0.7812 TFLOPS FP64
Speichertakt10000 effective = 1250 MHz10000 MHz
Speicherbandbreite128 Bit64 Bit
SpeichertypGDDR6GDDR5, GDDR6
Max. Speichergröße8 GB4 GB
Memory Bandwidth160 GB/s
Transistors4.7 Billion
Die Size 200 mm²
PCIe3.0 x16
Displays4 Displays (max.), DisplayPort 1.4a
Notebookgrößemittel (15.4" z.B.)
CPU in Radeon 680MGPU Base SpeedGPU Boost / Turbo
AMD Ryzen 9 6980HX8 x 3300 MHz, 45 W? MHz2400 MHz
AMD Ryzen 9 PRO 6950H8 x 3300 MHz, 45 W? MHz2400 MHz
AMD Ryzen 9 6900HX8 x 3300 MHz, 45 W? MHz2400 MHz
min. - max.? MHz2200 - 2400 MHz

Benchmarks

Performance Rating - 3DMark 11 + Fire Strike + Time Spy - Radeon 680M
3 pt (9%)
Performance Rating - 3DMark 11 + Fire Strike + Time Spy - T1000
3.7 pt (11%)
Performance Rating - 3DMark 11 + Fire Strike + Time Spy - T500 Laptop GPU
1.9 pt (6%)
3DMark - 3DMark Time Spy Score
min: 1546     avg: 2497     median: 2594.5 (7%)     max: 2914 Points
3534 Points (10%)
min: 1627     avg: 1953     median: 1958 (6%)     max: 2270 Points
3DMark - 3DMark Time Spy Graphics
min: 1359     avg: 2229     median: 2313 (6%)     max: 2607 Points
3088 Points (8%)
min: 1554     avg: 1814     median: 1787.5 (5%)     max: 2127 Points
3DMark - 3DMark Ice Storm Unlimited Graphics
min: 111130     avg: 334841     median: 359776 (36%)     max: 419088 Points
111%
1 T1000 +
398761 Points (40%)
3DMark - 3DMark Ice Storm Extreme Graphics
min: 64259     avg: 152833     median: 149024 (19%)     max: 199788 Points
121%
1 T1000 +
179865 Points (22%)
3DMark - 3DMark Cloud Gate Score
min: 21960     avg: 29933     median: 31002 (33%)     max: 35309 Points
37881 Points (40%)
min: 15562     avg: 15975     median: 15851 (17%)     max: 16513 Points
3DMark - 3DMark Cloud Gate Graphics
min: 24634     avg: 40893     median: 43250 (11%)     max: 50120 Points
50553 Points (13%)
min: 22719     avg: 24657     median: 23453 (6%)     max: 27800 Points
3DMark - 3DMark Fire Strike Standard Score
min: 3531     avg: 6112     median: 6292 (11%)     max: 6993 Points
8124 Points (14%)
min: 3406     avg: 4047     median: 3973.5 (7%)     max: 4833 Points
3DMark - 3DMark Fire Strike Standard Graphics
min: 3791     avg: 6689     median: 6865 (8%)     max: 7653 Points
8450 Points (10%)
min: 3696     avg: 4322     median: 4224.5 (5%)     max: 5141 Points
3DMark - 3DMark Ice Storm Graphics
min: 68280     avg: 208623     median: 209290 (24%)     max: 310414 Points
237130 Points (28%)
80696 Points (9%)
3DMark - 3DMark Wild Life Unlimited
min: 14403     avg: 15238     median: 15237.5 (8%)     max: 16072 Points
3DMark - 3DMark Wild Life Extreme Unlimited
min: 2476     avg: 3812     median: 3955 (5%)     max: 4497 Points
3DMark - 3DMark Night Raid
100%
1 T1000 +
34584 Points (33%)
3DMark - 3DMark Night Raid Graphics Score
100%
1 T1000 +
41157 Points (16%)
3DMark 11 - 3DM11 Performance Score
min: 6723     avg: 9969     median: 10377 (14%)     max: 11523 Points
12953 Points (18%)
min: 6293     avg: 7692     median: 8132 (11%)     max: 8212 Points
3DMark 11 - 3DM11 Performance GPU
min: 6858     avg: 10030     median: 10399 (9%)     max: 11668 Points
11793 Points (10%)
min: 6767     avg: 7808     median: 7995.5 (7%)     max: 8475 Points
3DMark Vantage
3DM Vant. Perf. total + AMD Radeon 680M
3DMark Vantage - 3DM Vant. Perf. total
min: 17643     avg: 31620     median: 34600 (10%)     max: 39139 Points
3DM Vant. Perf. total + NVIDIA T1000
134%
1 T1000 +
46318 Points (13%)
3DM Vant. Perf. GPU no PhysX + AMD Radeon 680M
3DMark Vantage - 3DM Vant. Perf. GPU no PhysX
min: 14306     avg: 27350     median: 29953 (16%)     max: 34407 Points
3DM Vant. Perf. GPU no PhysX + NVIDIA T1000
132%
1 T1000 +
39668 Points (22%)
3DMark 05 - 3DMark 05 - Standard
min: 11711     avg: 43633     median: 46753 (51%)     max: 54628 Points
168%
1 T1000 +
78565 Points (86%)
3DMark 06 3DMark 06 - Standard 1366x768 + AMD Radeon 680M
3DMark 06
25274 Points (33%)
3DMark 06 - Standard 1280x1024 + AMD Radeon 680M
3DMark 06
min: 13533     avg: 31075     median: 34617 (45%)     max: 39654 Points
3DMark 06 - Standard 1280x1024 + NVIDIA T1000
58968 Points (77%)
3DMark 06 - Standard 1280x1024 + NVIDIA T500 Laptop GPU
31133 Points (41%)
Unigine Valley 1.0 - Unigine Valley 1.0 DX
min: 11.6     avg: 17.8     median: 18.9 (6%)     max: 23.7 fps
224%
1 T1000 +
42.2 fps (13%)
Blender - Blender 3.3 Classroom CUDA *
100%
1 T1000 +
159 Seconds (24%)
Blender - Blender 3.3 Classroom OPTIX *
100%
1 T1000 +
159 Seconds (59%)
Blender - Blender 3.3 Classroom HIP *
min: 270     avg: 347.4     median: 331.5 (27%)     max: 555 Seconds
SPECviewperf 12
specvp12 sw-03 + AMD Radeon 680M
SPECviewperf 12 - specvp12 sw-03
min: 58.6     avg: 91     median: 90.3 (22%)     max: 120 fps
specvp12 snx-02 + AMD Radeon 680M
SPECviewperf 12 - specvp12 snx-02
min: 37.5     avg: 54.4     median: 58.5 (9%)     max: 65.6 fps
specvp12 showcase-01 + AMD Radeon 680M
SPECviewperf 12 - specvp12 showcase-01
min: 17.5     avg: 29.9     median: 30.4 (7%)     max: 36.2 fps
specvp12 mediacal-01 + AMD Radeon 680M
SPECviewperf 12 - specvp12 mediacal-01
min: 15     avg: 33.2     median: 30.5 (8%)     max: 51.3 fps
specvp12 maya-04 + AMD Radeon 680M
SPECviewperf 12 - specvp12 maya-04
min: 37.9     avg: 60.5     median: 61.9 (17%)     max: 75.7 fps
specvp12 energy-01 + AMD Radeon 680M
SPECviewperf 12 - specvp12 energy-01
min: 3.14     avg: 36.4     median: 32.2 (29%)     max: 80.4 fps
specvp12 creo-01 + AMD Radeon 680M
SPECviewperf 12 - specvp12 creo-01
min: 30.9     avg: 43.5     median: 44.5 (18%)     max: 56.7 fps
specvp12 catia-04 + AMD Radeon 680M
SPECviewperf 12 - specvp12 catia-04
min: 48.7     avg: 67.9     median: 70.9 (12%)     max: 91.2 fps
specvp12 3dsmax-05 + AMD Radeon 680M
SPECviewperf 12 - specvp12 3dsmax-05
min: 46.9     avg: 76.5     median: 80.5 (14%)     max: 90.8 fps
SPECviewperf 13 specvp13 sw-04 + AMD Radeon 680M
SPECviewperf 13 - specvp13 sw-04
min: 63.1     avg: 92.5     median: 98 (26%)     max: 111 fps
specvp13 sw-04 + NVIDIA T500 Laptop GPU
min: 64.9     avg: 80.7     median: 82.1 (22%)     max: 93.6 fps
specvp13 snx-03 + AMD Radeon 680M
SPECviewperf 13 - specvp13 snx-03
min: 40.2     avg: 94.7     median: 107 (12%)     max: 124 fps
specvp13 snx-03 + NVIDIA T500 Laptop GPU
min: 71.2     avg: 79.2     median: 77.5 (9%)     max: 90.8 fps
specvp13 showcase-02 + AMD Radeon 680M
SPECviewperf 13 - specvp13 showcase-02
min: 17.4     avg: 29.6     median: 29.9 (7%)     max: 37.5 fps
specvp13 showcase-02 + NVIDIA T500 Laptop GPU
min: 16.01     avg: 18.9     median: 16.9 (4%)     max: 23.87 fps
specvp13 medical-02 + AMD Radeon 680M
SPECviewperf 13 - specvp13 medical-02
min: 20.5     avg: 43     median: 41.4 (9%)     max: 63.1 fps
specvp13 medical-02 + NVIDIA T500 Laptop GPU
min: 24.84     avg: 29.6     median: 28.7 (6%)     max: 36.14 fps
specvp13 maya-05 + AMD Radeon 680M
SPECviewperf 13 - specvp13 maya-05
min: 58.3     avg: 91.6     median: 98.7 (11%)     max: 113 fps
specvp13 maya-05 + NVIDIA T500 Laptop GPU
min: 48.47     avg: 53.5     median: 51.9 (6%)     max: 62 fps
specvp13 energy-02 + AMD Radeon 680M
SPECviewperf 13 - specvp13 energy-02
min: 1.04     avg: 10.8     median: 11.9 (4%)     max: 14.6 fps
specvp13 energy-02 + NVIDIA T500 Laptop GPU
min: 8.57     avg: 9.6     median: 8.7 (3%)     max: 12.41 fps
specvp13 creo-02 + AMD Radeon 680M
SPECviewperf 13 - specvp13 creo-02
min: 44.9     avg: 69.8     median: 70.8 (10%)     max: 87.1 fps
specvp13 creo-02 + NVIDIA T500 Laptop GPU
min: 55.8     avg: 62.1     median: 59.2 (9%)     max: 74.3 fps
specvp13 catia-05 + AMD Radeon 680M
SPECviewperf 13 - specvp13 catia-05
min: 73.9     avg: 97.2     median: 99.8 (11%)     max: 118 fps
specvp13 catia-05 + NVIDIA T500 Laptop GPU
min: 81.9     avg: 88.6     median: 88.3 (10%)     max: 95.8 fps
specvp13 3dsmax-06 + AMD Radeon 680M
SPECviewperf 13 - specvp13 3dsmax-06
min: 48.3     avg: 75.7     median: 79.2 (14%)     max: 90.3 fps
specvp13 3dsmax-06 + NVIDIA T500 Laptop GPU
min: 45.15     avg: 51     median: 50.4 (9%)     max: 57.9 fps
SPECviewperf 2020 specvp2020 solidworks-05 1080p + AMD Radeon 680M
SPECviewperf 2020 - specvp2020 solidworks-05 1080p
min: 39.7     avg: 45.2     median: 45.2 (9%)     max: 50.6 fps
specvp2020 solidworks-05 1080p + NVIDIA T500 Laptop GPU
min: 37.82     avg: 40.2     median: 39.1 (8%)     max: 43.59 fps
specvp2020 snx-04 1080p + AMD Radeon 680M
SPECviewperf 2020 - specvp2020 snx-04 1080p
min: 40.4     avg: 94.1     median: 118 (19%)     max: 124 fps
specvp2020 snx-04 1080p + NVIDIA T500 Laptop GPU
min: 66.2     avg: 76     median: 68.8 (11%)     max: 93.1 fps
specvp2020 medical-03 1080p + AMD Radeon 680M
SPECviewperf 2020 - specvp2020 medical-03 1080p
min: 15.4     avg: 21.8     median: 15.6 (11%)     max: 34.3 fps
specvp2020 medical-03 1080p + NVIDIA T1000
39.3 fps (28%)
specvp2020 medical-03 1080p + NVIDIA T500 Laptop GPU
min: 10.73     avg: 12.1     median: 11 (8%)     max: 14.74 fps
specvp2020 maya-06 1080p + AMD Radeon 680M
SPECviewperf 2020 - specvp2020 maya-06 1080p
min: 88.1     avg: 108     median: 102 (11%)     max: 134 fps
specvp2020 maya-06 1080p + NVIDIA T500 Laptop GPU
min: 59     avg: 65.5     median: 59.3 (7%)     max: 78.1 fps
specvp2020 energy-03 1080p + AMD Radeon 680M
SPECviewperf 2020 - specvp2020 energy-03 1080p
min: 0.85     avg: 7.5     median: 6.7 (4%)     max: 14.9 fps
specvp2020 energy-03 1080p + NVIDIA T1000
18.1 fps (12%)
specvp2020 energy-03 1080p + NVIDIA T500 Laptop GPU
min: 8.62     avg: 9.7     median: 8.7 (6%)     max: 11.96 fps
specvp2020 creo-03 1080p + AMD Radeon 680M
SPECviewperf 2020 - specvp2020 creo-03 1080p
min: 35.3     avg: 47     median: 45.9 (23%)     max: 59.8 fps
specvp2020 creo-03 1080p + NVIDIA T1000
78.1 fps (38%)
specvp2020 creo-03 1080p + NVIDIA T500 Laptop GPU
min: 29.28     avg: 34.7     median: 32.7 (16%)     max: 41.95 fps
specvp2020 catia-06 1080p + AMD Radeon 680M
SPECviewperf 2020 - specvp2020 catia-06 1080p
min: 18.9     avg: 24.3     median: 21 (13%)     max: 32.9 fps
specvp2020 catia-06 1080p + NVIDIA T1000
37.3 fps (23%)
specvp2020 catia-06 1080p + NVIDIA T500 Laptop GPU
min: 16.48     avg: 19.2     median: 18 (11%)     max: 23.22 fps
specvp2020 3dsmax-07 1080p + AMD Radeon 680M
SPECviewperf 2020 - specvp2020 3dsmax-07 1080p
min: 28.5     avg: 33.6     median: 35 (11%)     max: 37.2 fps
specvp2020 3dsmax-07 1080p + NVIDIA T1000
44 fps (14%)
specvp2020 3dsmax-07 1080p + NVIDIA T500 Laptop GPU
min: 19.56     avg: 23.3     median: 21.6 (7%)     max: 28.9 fps
specvp2020 solidworks-05 4k + AMD Radeon 680M
SPECviewperf 2020 - specvp2020 solidworks-05 4k
min: 11.6     avg: 17.6     median: 18.7 (6%)     max: 21.2 fps
specvp2020 snx-04 4k + AMD Radeon 680M
SPECviewperf 2020 - specvp2020 snx-04 4k
min: 33     avg: 52.8     median: 56.7 (6%)     max: 62.2 fps
specvp2020 medical-03 4k + AMD Radeon 680M
SPECviewperf 2020 - specvp2020 medical-03 4k
min: 3.73     avg: 7.9     median: 8.6 (8%)     max: 12.1 fps
specvp2020 medical-03 4k + NVIDIA T1000
156%
1 T1000 +
13.4 fps (13%)
specvp2020 maya-06 4k + AMD Radeon 680M
SPECviewperf 2020 - specvp2020 maya-06 4k
min: 29.5     avg: 42.6     median: 43.9 (7%)     max: 50.1 fps
specvp2020 maya-06 4k + NVIDIA T1000
143%
1 T1000 +
62.8 fps (10%)
specvp2020 energy-03 4k + AMD Radeon 680M
SPECviewperf 2020 - specvp2020 energy-03 4k
min: 4.77     avg: 10.1     median: 8 (2%)     max: 19.4 fps
specvp2020 energy-03 4k + NVIDIA T1000
120%
1 T1000 +
9.5 fps (2%)
specvp2020 creo-03 4k + AMD Radeon 680M
SPECviewperf 2020 - specvp2020 creo-03 4k
min: 17.5     avg: 26.2     median: 29 (14%)     max: 32 fps
specvp2020 creo-03 4k + NVIDIA T1000
149%
1 T1000 +
43.3 fps (21%)
specvp2020 catia-06 4k + AMD Radeon 680M
SPECviewperf 2020 - specvp2020 catia-06 4k
min: 13.1     avg: 18.9     median: 20.3 (13%)     max: 22.8 fps
specvp2020 catia-06 4k + NVIDIA T1000
108%
1 T1000 +
21.9 fps (14%)
specvp2020 3dsmax-07 4k + AMD Radeon 680M
SPECviewperf 2020 - specvp2020 3dsmax-07 4k
min: 9.26     avg: 16.5     median: 17.5 (7%)     max: 20.1 fps
specvp2020 3dsmax-07 4k + NVIDIA T1000
157%
1 T1000 +
27.4 fps (11%)
Cinebench R10 Cinebench R10 Shading (32bit) + AMD Radeon 680M
Cinebench R10 - Cinebench R10 Shading (32bit)
min: 6573     avg: 14793     median: 15332 (11%)     max: 17565 Points
Cinebench R10 Shading (32bit) + NVIDIA T1000
45%
1 T1000 +
6837 Points (5%)
Cinebench R11.5 Cinebench R11.5 OpenGL 64 Bit + AMD Radeon 680M
Cinebench R11.5 - Cinebench R11.5 OpenGL 64 Bit
min: 59.85     avg: 98.1     median: 109.4 (36%)     max: 113.68 fps
Cinebench R11.5 OpenGL 64 Bit + NVIDIA T1000
252.5 fps (83%)
Cinebench R11.5 OpenGL 64 Bit + NVIDIA T500 Laptop GPU
156.6 fps (52%)
Cinebench R15
Cinebench R15 OpenGL 64 Bit + AMD Radeon 680M
Cinebench R15 - Cinebench R15 OpenGL 64 Bit
min: 72.39     avg: 137.6     median: 145 (8%)     max: 186.07 fps
Cinebench R15 OpenGL 64 Bit + NVIDIA T1000
335.8 fps (20%)
Cinebench R15 OpenGL 64 Bit + NVIDIA T500 Laptop GPU
min: 134     avg: 168.8     median: 173 (10%)     max: 195 fps
Cinebench R15 OpenGL Ref. Match 64 Bit + AMD Radeon 680M
Cinebench R15 - Cinebench R15 OpenGL Ref. Match 64 Bit
min: 97.9     avg: 97.9     median: 97.9 (98%)     max: 98 %
Cinebench R15 OpenGL Ref. Match 64 Bit + NVIDIA T1000
99.6 % (100%)
Cinebench R15 OpenGL Ref. Match 64 Bit + NVIDIA T500 Laptop GPU
99.6 % (100%)
GFXBench - GFXBench 5.0 4K Aztec Ruins High Tier Offscreen
23.2 fps (9%)
GFXBench - GFXBench 5.0 Aztec Ruins High Tier Offscreen
min: 47.8     avg: 49.2     median: 49.2 (9%)     max: 50.6 fps
GFXBench - GFXBench 5.0 Aztec Ruins Normal Tier Offscreen
min: 120     avg: 120.6     median: 120.6 (9%)     max: 121.1 fps
GFXBench - GFXBench Car Chase Offscreen
min: 105.6     avg: 107.5     median: 107.5 (12%)     max: 109.3 fps
119 fps (13%)
GFXBench 3.1 - GFXBench Manhattan ES 3.1 Offscreen
183 fps (4%)
GFXBench 3.0 - GFXBench 3.0 Manhattan Offscreen
236 fps (14%)
GFXBench (DX / GLBenchmark) 2.7
GFXBench T-Rex HD Offscreen C24Z16 + NVIDIA T500 Laptop GPU
GFXBench (DX / GLBenchmark) 2.7 - GFXBench T-Rex HD Offscreen C24Z16
503 fps (4%)
Basemark GPU 1.2 - Basemark GPU 1.2 Vulkan Official Medium Offscreen 1080
min: 104.6     avg: 199.3     median: 234.5 (1%)     max: 289 fps
165%
1 T1000 +
386 fps (2%)
Basemark GPU 1.2 - Basemark GPU 1.2 Vulkan Official High Offscreen 2160
min: 3.64     avg: 11.3     median: 3.6 (1%)     max: 24.1 fps
876%
1 T1000 +
31.9 fps (7%)
Geekbench 6.2 - Geekbench 6.2 GPU OpenCL
min: 14210     avg: 25785     median: 27759 (8%)     max: 29288 Points
139%
1 T1000 +
38611 Points (11%)
Geekbench 6.2 - Geekbench 6.2 GPU Vulkan
min: 18321     avg: 25952     median: 27324 (8%)     max: 29819 Points
132%
1 T1000 +
36031 Points (10%)
LuxMark v2.0 64Bit - LuxMark v2.0 Room GPU
min: 353     avg: 693     median: 584.5 (3%)     max: 1958 Samples/s
1987 Samples/s (9%)
653 Samples/s (3%)
LuxMark v2.0 64Bit - LuxMark v2.0 Sala GPU
min: 766     avg: 1162     median: 1290.5 (2%)     max: 1406 Samples/s
4129 Samples/s (7%)
1976 Samples/s (3%)
ComputeMark v2.1 - ComputeMark v2.1 Result
min: 3439     avg: 5712     median: 5921.5 (6%)     max: 7111 Points
6369 Points (7%)
4734 Points (5%)
Power Consumption - Furmark Stress Test Power Consumption - external Monitor *
min: 35     avg: 57.1     median: 57.3 (8%)     max: 80.2 Watt
56%
1 T1000 +
101.9 Watt (14%)
min: 45.1     avg: 47.1     median: 47.1 (7%)     max: 49 Watt
Power Consumption - The Witcher 3 Power Consumption - external Monitor *
min: 28.2     avg: 53.7     median: 54.1 (8%)     max: 76.8 Watt
min: 36.6     avg: 43.7     median: 43.7 (6%)     max: 50.8 Watt
Power Consumption - Witcher 3 Power Consumption *
min: 40.1     avg: 53.5     median: 50.1 (11%)     max: 69 Watt
min: 37.1     avg: 49.9     median: 53 (12%)     max: 59.6 Watt
Power Consumption - Witcher 3 ultra Power Efficiency
min: 0.2296     avg: 0.4     median: 0.4 (37%)     max: 0.558 fps per Watt
min: 0.3674     avg: 0.4     median: 0.4 (38%)     max: 0.4555 fps per Watt
Power Consumption - Witcher 3 ultra Power Efficiency - external Monitor
min: 0.2466     avg: 0.4     median: 0.4 (36%)     max: 0.713 fps per Watt
min: 0.439     avg: 0.5     median: 0.5 (37%)     max: 0.4617 fps per Watt
Power Consumption - Cyberpunk 2077 Power Consumption 150cd *
42.4 Watt (14%)
Power Consumption - Cyberpunk 2077 Power Consumption - external Monitor *
min: 41.4     avg: 50.1     median: 50.1 (6%)     max: 58.8 Watt
32%
1 T1000 +
156.8 Watt (20%)
Power Consumption - Cyberpunk 2077 ultra Power Efficiency
min: 0.2415     avg: 0.2     median: 0.2 (54%)     max: 0.4455 fps per Watt
31%
1 T1000 +
min: 0.07462     avg: 0.1     median: 0.1 (17%)     max: 0.4455 fps per Watt
Emissions Witcher 3 Fan Noise + AMD Radeon 680M
Emissions - Witcher 3 Fan Noise
min: 27.5     avg: 38.9     median: 40.2 (64%)     max: 48.6 dB(A)
Witcher 3 Fan Noise + NVIDIA T500 Laptop GPU
min: 36.1     avg: 38.1     median: 38.1 (61%)     max: 40.1 dB(A)
Clock Speed - GPU Clock Witcher 3 ultra
1724 MHz (68%)

Average Benchmarks AMD Radeon 680M → 100% n=21

Average Benchmarks NVIDIA T1000 → 172% n=21

Average Benchmarks NVIDIA T500 Laptop GPU → 85% n=21

- Bereich der Benchmarkergebnisse für diese Grafikkarte
- Durchschnittliche Benchmarkergebnisse für diese Grafikkarte
* Smaller numbers mean a higher performance
1 This benchmark is not used for the average calculation

Spiele-Benchmarks

Die folgenden Benchmarks basieren auf unseren Spieletests mit Testnotebooks. Die Performance dieser Grafikkarte bei den gelisteten Spielen ist abhängig von der verwendeten CPU, Speicherausstattung, Treiber und auch Betriebssystem. Dadurch müssen die untenstehenden Werte nicht repräsentativ sein. Detaillierte Informationen über das verwendete System sehen Sie nach einem Klick auf den fps-Wert.

F1 24

F1 24

2024
low 1920x1080
T1000:
98.4  fps
med. 1920x1080
T1000:
82.6  fps
high 1920x1080
T1000:
58.8  fps
med. 1920x1080
100%
Radeon 680M:
89.3 175.4 ~ 132 fps
high 1920x1080
100%
Radeon 680M:
58.8 131.4 ~ 95 fps
ultra 1920x1080
100%
Radeon 680M:
58.4 124.2 ~ 91 fps
low 1920x1080
T1000:
22  fps
med. 1920x1080
T1000:
19  fps
high 1920x1080
T1000:
15  fps
ultra 1920x1080
T1000:
10  fps
low 1920x1080
100%
Radeon 680M:
18.3  fps
med. 1920x1080
100%
Radeon 680M:
16  fps
high 1920x1080
100%
Radeon 680M:
14.9  fps
low 1920x1080
100%
Radeon 680M:
24.3  fps
med. 1920x1080
100%
Radeon 680M:
18.3  fps
high 1920x1080
100%
Radeon 680M:
12.3  fps
ultra 1920x1080
100%
Radeon 680M:
8.7  fps
low 1920x1080
100%
Radeon 680M:
43.3 72.4 74.6 84.4 ~ 69 fps
201%
T1000:
138.6  fps
med. 1920x1080
100%
Radeon 680M:
33.3 62.5 65.1 68.6 ~ 57 fps
159%
T1000:
90.8  fps
high 1920x1080
100%
Radeon 680M:
21.6 48.4 51.8 52.6 ~ 44 fps
115%
T1000:
50.6  fps
ultra 1920x1080
100%
Radeon 680M:
16.9 43.6 46.3 46.9 ~ 38 fps
105%
T1000:
39.8  fps
low 1920x1080
100%
Radeon 680M:
34  fps
129%
T1000:
44  fps
med. 1920x1080
100%
Radeon 680M:
32  fps
125%
T1000:
40  fps
high 1920x1080
100%
Radeon 680M:
30  fps
127%
T1000:
38  fps
ultra 1920x1080
100%
Radeon 680M:
24  fps
low 1920x1080
100%
Radeon 680M:
80.3  fps
med. 1920x1080
100%
Radeon 680M:
57.9  fps
high 1920x1080
100%
Radeon 680M:
42  fps
ultra 1920x1080
100%
Radeon 680M:
39.5  fps
low 1920x1080
100%
Radeon 680M:
32.1 34.8 35.7 ~ 34 fps
133%
T1000:
45.1  fps
med. 1920x1080
100%
Radeon 680M:
25.1 27.2 27.3 ~ 27 fps
127%
T1000:
34.2  fps
high 1920x1080
100%
Radeon 680M:
20.1 21.3 21.8 ~ 21 fps
135%
T1000:
28.3  fps
ultra 1920x1080
100%
Radeon 680M:
18.1 18.4 20 ~ 19 fps
125%
T1000:
23.8  fps
QHD 2560x1440
100%
Radeon 680M:
10.4  fps
4K 3840x2160
100%
Radeon 680M:
4  fps
Lies of P

Lies of P

2023
low 1920x1080
100%
Radeon 680M:
42.5  fps
med. 1920x1080
100%
Radeon 680M:
37.2  fps
high 1920x1080
100%
Radeon 680M:
32.7  fps
ultra 1920x1080
100%
Radeon 680M:
29.2  fps
low 1920x1080
100%
Radeon 680M:
29  fps
med. 1920x1080
100%
Radeon 680M:
28  fps
high 1920x1080
100%
Radeon 680M:
24  fps
ultra 1920x1080
100%
Radeon 680M:
20  fps
Starfield

Starfield

2023
low 1920x1080
100%
Radeon 680M:
23.2  fps
med. 1920x1080
100%
Radeon 680M:
19.4  fps
high 1920x1080
100%
Radeon 680M:
14.8  fps
ultra 1920x1080
100%
Radeon 680M:
12.7  fps
low 1920x1080
100%
Radeon 680M:
32.3  fps
med. 1920x1080
100%
Radeon 680M:
31.4  fps
high 1920x1080
100%
Radeon 680M:
30  fps
ultra 1920x1080
100%
Radeon 680M:
25.3  fps
low 1920x1080
100%
Radeon 680M:
17.4  fps
high 1920x1080
100%
Radeon 680M:
14.7  fps
ultra 1920x1080
100%
Radeon 680M:
10.4  fps
low 1920x1080
100%
Radeon 680M:
36  fps
med. 1920x1080
100%
Radeon 680M:
34.8  fps
high 1920x1080
100%
Radeon 680M:
32  fps
ultra 1920x1080
100%
Radeon 680M:
24.9  fps
low 1920x1080
100%
Radeon 680M:
34.9 36.9 ~ 36 fps
125%
T1000:
45  fps
med. 1920x1080
100%
Radeon 680M:
28 28.3 ~ 28 fps
126%
T1000:
35.2  fps
high 1920x1080
100%
Radeon 680M:
22.6 23.3 ~ 23 fps
131%
T1000:
30.2  fps
ultra 1920x1080
100%
Radeon 680M:
22.1 22.8 ~ 22 fps
134%
T1000:
29.5  fps
low 1920x1080
100%
Radeon 680M:
29.9  fps
med. 1920x1080
100%
Radeon 680M:
25.5  fps
high 1920x1080
100%
Radeon 680M:
21.1  fps
ultra 1920x1080
100%
Radeon 680M:
18  fps
F1 23

F1 23

2023
low 1920x1080
100%
Radeon 680M:
45.3 66.6 71 71.8 74.2 76.1 ~ 68 fps
159%
T1000:
108.3  fps
med. 1920x1080
100%
Radeon 680M:
40.1 56.3 63 64.5 66.2 68 ~ 60 fps
161%
T1000:
96.5  fps
high 1920x1080
100%
Radeon 680M:
29.1 40.9 44.7 45 47.6 47.8 ~ 43 fps
148%
T1000:
63.6  fps
ultra 1920x1080
100%
Radeon 680M:
9 9.4 10 10.7 ~ 10 fps
Diablo 4

Diablo 4

2023
low 1920x1080
100%
Radeon 680M:
45.8  fps
med. 1920x1080
100%
Radeon 680M:
43.5  fps
high 1920x1080
100%
Radeon 680M:
39.1  fps
ultra 1920x1080
100%
Radeon 680M:
32.8  fps
low 1920x1080
100%
Radeon 680M:
40.2  fps
med. 1920x1080
100%
Radeon 680M:
27.3  fps
high 1920x1080
100%
Radeon 680M:
19.7  fps
ultra 1920x1080
100%
Radeon 680M:
15.4  fps
low 1920x1080
100%
Radeon 680M:
62.4  fps
med. 1920x1080
100%
Radeon 680M:
51.6  fps
high 1920x1080
100%
Radeon 680M:
39.5  fps
ultra 1920x1080
100%
Radeon 680M:
32.4  fps
low 1920x1080
100%
Radeon 680M:
26.4  fps
med. 1920x1080
100%
Radeon 680M:
19.5  fps
high 1920x1080
100%
Radeon 680M:
16.6  fps
ultra 1920x1080
100%
Radeon 680M:
13.1  fps
low 1920x1080
100%
Radeon 680M:
31.6  fps
med. 1920x1080
100%
Radeon 680M:
25.6  fps
high 1920x1080
100%
Radeon 680M:
21.8  fps
ultra 1920x1080
100%
Radeon 680M:
13.6  fps
low 1920x1080
100%
Radeon 680M:
52.5  fps
med. 1920x1080
100%
Radeon 680M:
46.6  fps
low 1920x1080
100%
Radeon 680M:
33.7  fps
med. 1920x1080
100%
Radeon 680M:
24.9  fps
high 1920x1080
100%
Radeon 680M:
23.6  fps
ultra 1920x1080
100%
Radeon 680M:
23.3  fps
low 1920x1080
100%
Radeon 680M:
47.2  fps
med. 1920x1080
100%
Radeon 680M:
36.8  fps
high 1920x1080
100%
Radeon 680M:
20.3  fps
ultra 1920x1080
100%
Radeon 680M:
16.9  fps
Returnal

Returnal

2023
low 1920x1080
100%
Radeon 680M:
23  fps
med. 1920x1080
100%
Radeon 680M:
19  fps
high 1920x1080
100%
Radeon 680M:
17  fps
ultra 1920x1080
100%
Radeon 680M:
14  fps
low 1920x1080
100%
Radeon 680M:
34.1  fps
med. 1920x1080
100%
Radeon 680M:
21.8  fps
high 1920x1080
100%
Radeon 680M:
19.6  fps
ultra 1920x1080
100%
Radeon 680M:
14.2  fps
low 1920x1080
100%
Radeon 680M:
42.5 43.3 44.7 ~ 44 fps
med. 1920x1080
100%
Radeon 680M:
33.3 35.7 38.9 ~ 36 fps
high 1920x1080
100%
Radeon 680M:
28.7 30.2 35.1 ~ 31 fps
ultra 1920x1080
100%
Radeon 680M:
24.5 24.5 29.3 ~ 26 fps
QHD 2560x1440
100%
Radeon 680M:
16.4  fps
4K 3840x2160
100%
Radeon 680M:
8.3  fps
low 1920x1080
100%
Radeon 680M:
63.1  fps
med. 1920x1080
100%
Radeon 680M:
45  fps
high 1920x1080
100%
Radeon 680M:
33.8  fps
ultra 1920x1080
100%
Radeon 680M:
25.7  fps
low 1920x1080
100%
Radeon 680M:
29.6 40 ~ 35 fps
med. 1920x1080
100%
Radeon 680M:
19.4 27.3 ~ 23 fps
high 1920x1080
100%
Radeon 680M:
10.8 17.5 ~ 14 fps
ultra 1920x1080
100%
Radeon 680M:
11.7 17 ~ 14 fps
low 1920x1080
100%
Radeon 680M:
49.4  fps
med. 1920x1080
100%
Radeon 680M:
41  fps
high 1920x1080
100%
Radeon 680M:
31.7  fps
ultra 1920x1080
100%
Radeon 680M:
27.5  fps
low 1920x1080
100%
Radeon 680M:
33.4 43 ~ 38 fps
med. 1920x1080
100%
Radeon 680M:
28.8 36.7 ~ 33 fps
high 1920x1080
100%
Radeon 680M:
23.8 33.6 ~ 29 fps
ultra 1920x1080
100%
Radeon 680M:
21.1 30.2 ~ 26 fps
low 1920x1080
100%
Radeon 680M:
54 61 ~ 58 fps
med. 1920x1080
100%
Radeon 680M:
46 54 ~ 50 fps
high 1920x1080
100%
Radeon 680M:
37 38 ~ 38 fps
ultra 1920x1080
100%
Radeon 680M:
34 34 ~ 34 fps
low 1920x1080
100%
Radeon 680M:
28.5  fps
med. 1920x1080
100%
Radeon 680M:
26.5  fps
high 1920x1080
100%
Radeon 680M:
23.1  fps
ultra 1920x1080
100%
Radeon 680M:
22  fps
low 1920x1080
100%
Radeon 680M:
20.7 23.8 ~ 22 fps
med. 1920x1080
100%
Radeon 680M:
18.4 19.3 ~ 19 fps
high 1920x1080
100%
Radeon 680M:
14.3 16.3 ~ 15 fps
ultra 1920x1080
100%
Radeon 680M:
13.9 14.2 ~ 14 fps
FIFA 23

FIFA 23

2022
low 1920x1080
100%
Radeon 680M:
79.9 83 ~ 81 fps
med. 1920x1080
100%
Radeon 680M:
71.6 73 ~ 72 fps
high 1920x1080
100%
Radeon 680M:
44.5 51 ~ 48 fps
ultra 1920x1080
100%
Radeon 680M:
44.4 53 ~ 49 fps
low 1920x1080
100%
Radeon 680M:
31.8 38.3 ~ 35 fps
med. 1920x1080
100%
Radeon 680M:
23.7 27.8 ~ 26 fps
high 1920x1080
100%
Radeon 680M:
17.4 21.9 ~ 20 fps
ultra 1920x1080
100%
Radeon 680M:
12  fps
F1 22

F1 22

2022
low 1920x1080
100%
Radeon 680M:
44.1 45.6 49.7 53.1 66.5 66.7 71.4 72.1 74.3 77.1 77.3 78.1 78.4 79.8 80 80.1 80.2 80.2 80.3 80.8 82 82.6 83.1 85.4 ~ 73 fps
med. 1920x1080
100%
Radeon 680M:
38 40.6 46.1 49.1 55.4 60.3 61.1 62.8 65.4 65.4 66.9 69 69.5 69.9 70.1 70.3 70.4 70.4 70.5 71.6 72 72.9 74.1 74.6 ~ 64 fps
high 1920x1080
100%
Radeon 680M:
30 32.1 34.8 35.4 36.9 42.3 44.5 45.6 48.4 50.1 50.5 50.5 51.5 51.7 52 52 52.2 52.3 52.5 52.9 53.8 54.7 54.9 55 ~ 47 fps
ultra 1920x1080
100%
Radeon 680M:
0 (!) 7.9 7.9 8.3 8.9 9.2 9.3 9.4 11.2 11.3 11.9 12.2 12.3 12.3 12.6 13 13.1 13.2 13.2 13.9 13.9 14.1 ~ 11 fps
low 1920x1080
100%
Radeon 680M:
92  fps
med. 1920x1080
100%
Radeon 680M:
61.7  fps
high 1920x1080
100%
Radeon 680M:
55.6  fps
low 1920x1080
100%
Radeon 680M:
41.3  fps
med. 1920x1080
100%
Radeon 680M:
18.8 41 ~ 30 fps
high 1920x1080
100%
Radeon 680M:
20 40.6 ~ 30 fps
ultra 1920x1080
100%
Radeon 680M:
18.6 39.2 ~ 29 fps
QHD 2560x1440
100%
Radeon 680M:
24.5  fps
4K 3840x2160
100%
Radeon 680M:
11  fps
low 1920x1080
100%
Radeon 680M:
37.7 37.9 38.6 39.3 44.7 45.2 47.3 51.9 54.7 56.2 57.3 57.9 58.6 59.5 60.3 61 65.8 ~ 51 fps
136%
T1000:
69.2  fps
med. 1920x1080
100%
Radeon 680M:
28.2 28.4 30 30.6 32.7 34.8 35.3 35.5 40.5 42.2 44 44 44.2 44.4 44.9 45.1 47.1 ~ 38 fps
146%
T1000:
55.6  fps
high 1920x1080
100%
Radeon 680M:
19.8 20.2 20.5 21.8 23.1 23.4 23.5 24.4 28.2 28.3 28.6 28.8 29.8 29.9 30.1 30.2 31.2 ~ 26 fps
136%
T1000:
35.3  fps
ultra 1920x1080
100%
Radeon 680M:
16 16.2 18.1 18.4 18.4 18.5 18.7 20.5 20.7 22.3 22.5 22.6 23.1 23.1 23.5 24.4 24.4 ~ 21 fps
131%
T1000:
27.6  fps
QHD 2560x1440
100%
Radeon 680M:
13.6  fps
4K 3840x2160
100%
Radeon 680M:
6.6  fps
low 1920x1080
100%
Radeon 680M:
26 31.4 32 34 34 35.8 36.9 37.7 40 40.8 40.8 43 43.3 43.4 50.6 ~ 38 fps
med. 1920x1080
100%
Radeon 680M:
20.1 24 24.4 25 25.8 26 27.4 28.1 28.9 31.8 33 33.1 33.1 33.1 41.8 ~ 29 fps
high 1920x1080
100%
Radeon 680M:
16.3 18 19 19 19 20 20.2 21 21.3 21.6 21.8 22.3 23.4 23.9 33.6 ~ 21 fps
ultra 1920x1080
100%
Radeon 680M:
14 14.7 15 15.7 16.7 16.7 17.2 17.5 17.5 17.6 18.9 19 19.1 19.2 23.8 ~ 18 fps
QHD 2560x1440
100%
Radeon 680M:
9.9 10.7 ~ 10 fps
4K 3840x2160
100%
Radeon 680M:
3.4 4.3 ~ 4 fps
Elex 2

Elex 2

2022
low 1920x1080
100%
Radeon 680M:
37.8  fps
med. 1920x1080
100%
Radeon 680M:
31.3  fps
high 1920x1080
100%
Radeon 680M:
26.4  fps
ultra 1920x1080
100%
Radeon 680M:
22.6  fps
low 1920x1080
100%
Radeon 680M:
24.4 35.5 58.2 61.2 62.1 66.5 76.9 81.1 84.5 91 91.9 93.5 114 ~ 72 fps
174%
T1000:
125.4  fps
med. 1920x1080
100%
Radeon 680M:
29.5 45 47.4 47.4 50 60.6 62.9 63.4 66.7 69.6 70.7 82.2 ~ 58 fps
157%
T1000:
91.3  fps
high 1920x1080
100%
Radeon 680M:
24.4 34.2 36.7 37.3 44.1 47 48 48.2 51.9 51.9 53.3 64.9 ~ 45 fps
155%
T1000:
69.6  fps
ultra 1920x1080
100%
Radeon 680M:
21.2 26.6 26.9 29.8 30.5 37.9 38 38.4 38.4 40.6 41.7 46.3 ~ 35 fps
142%
T1000:
49.7  fps
low 1920x1080
100%
Radeon 680M:
52.7  fps
med. 1920x1080
100%
Radeon 680M:
41.5  fps
high 1920x1080
100%
Radeon 680M:
37.2  fps
ultra 1920x1080
100%
Radeon 680M:
31.5  fps
low 1920x1080
100%
Radeon 680M:
29.4  fps
med. 1920x1080
100%
Radeon 680M:
23.9  fps
high 1920x1080
100%
Radeon 680M:
20.4  fps
low 1920x1080
100%
Radeon 680M:
53 115 ~ 84 fps
med. 1920x1080
100%
Radeon 680M:
39 105 ~ 72 fps
high 1920x1080
100%
Radeon 680M:
37 102 ~ 70 fps
ultra 1920x1080
100%
Radeon 680M:
28 87 ~ 58 fps
low 1920x1080
100%
Radeon 680M:
19.5 20.2 20.4 24.9 25.2 33.4 34 35.9 37.5 37.6 37.9 48.6 ~ 31 fps
167%
T1000:
51.8  fps
med. 1920x1080
100%
Radeon 680M:
15.9 16.1 16.5 18.6 20.3 22 23.6 27.6 27.9 30.5 30.6 30.6 ~ 23 fps
185%
T1000:
42.5  fps
high 1920x1080
100%
Radeon 680M:
11.7 11.9 12.2 12.5 16.2 18.2 18.4 21.8 22.9 23.8 24.2 25 ~ 18 fps
186%
T1000:
33.5  fps
ultra 1920x1080
100%
Radeon 680M:
8.9 8.9 9 11.5 12.2 13.4 15.1 15.2 16.5 17.5 18.1 ~ 13 fps
165%
T1000:
21.4  fps
low 1280x720
100%
Radeon 680M:
75.3  fps
med. 1920x1080
100%
Radeon 680M:
37.8  fps
high 1920x1080
100%
Radeon 680M:
31.1  fps
ultra 1920x1080
100%
Radeon 680M:
29.3  fps
low 1280x720
100%
Radeon 680M:
86 121 123 145 ~ 119 fps
med. 1920x1080
100%
Radeon 680M:
40 61 62 85.4 ~ 62 fps
high 1920x1080
100%
Radeon 680M:
30 48 49 72.5 ~ 50 fps
ultra 1920x1080
100%
Radeon 680M:
27 43 44 53 ~ 42 fps
low 1280x720
100%
Radeon 680M:
77.5  fps
med. 1920x1080
100%
Radeon 680M:
39.4  fps
high 1920x1080
100%
Radeon 680M:
31.1  fps
ultra 1920x1080
100%
Radeon 680M:
26.6  fps
low 1280x720
100%
Radeon 680M:
92 148 ~ 120 fps
med. 1920x1080
100%
Radeon 680M:
44 60 ~ 52 fps
high 1920x1080
100%
Radeon 680M:
38 53 ~ 46 fps
ultra 1920x1080
100%
Radeon 680M:
27  fps
low 1280x720
100%
Radeon 680M:
55 74 ~ 65 fps
med. 1920x1080
100%
Radeon 680M:
33 43 ~ 38 fps
high 1920x1080
100%
Radeon 680M:
25 34 ~ 30 fps
ultra 1920x1080
100%
Radeon 680M:
23 28 ~ 26 fps
low 1280x720
Radeon 680M:
0 (!)  fps
med. 1920x1080
Radeon 680M:
0 (!)  fps
high 1920x1080
Radeon 680M:
0 (!)  fps
ultra 1920x1080
Radeon 680M:
0 (!)  fps
low 1280x720
100%
Radeon 680M:
167  fps
med. 1920x1080
100%
Radeon 680M:
65.2  fps
high 1920x1080
100%
Radeon 680M:
54.4  fps
ultra 1920x1080
100%
Radeon 680M:
49.3  fps
Far Cry 6

Far Cry 6

2021
low 1280x720
100%
Radeon 680M:
29.6 55.1 60.6 67.2 69.7 71.8 75.4 77.9 78.4 80.5 82 ~ 68 fps
162%
T1000:
110.4  fps
med. 1920x1080
100%
Radeon 680M:
18.8 32.2 34.7 35.8 38.7 39 40.6 41.8 44 45.2 46 ~ 38 fps
150%
T1000:
56.9  fps
high 1920x1080
100%
Radeon 680M:
16.1 27.8 30.2 33.1 34.1 34.5 34.8 35.3 37 38 38.4 ~ 33 fps
144%
T1000:
47.4  fps
ultra 1920x1080
100%
Radeon 680M:
13.3 26.3 27.2 28.6 29.7 29.7 31 32 33.2 ~ 28 fps
144%
T1000:
40.3  fps
QHD 2560x1440
100%
Radeon 680M:
21.5  fps
4K 3840x2160
100%
Radeon 680M:
9.6  fps
low 1280x720
100%
Radeon 680M:
64.9  fps
med. 1920x1080
100%
Radeon 680M:
44.2  fps
high 1920x1080
100%
Radeon 680M:
34.7  fps
New World

New World

2021
low 1280x720
100%
Radeon 680M:
70.4  fps
med. 1920x1080
100%
Radeon 680M:
29.7  fps
high 1920x1080
100%
Radeon 680M:
28.3  fps
ultra 1920x1080
100%
Radeon 680M:
22.9  fps
Deathloop

Deathloop

2021
low 1280x720
100%
Radeon 680M:
80.1  fps
med. 1920x1080
100%
Radeon 680M:
38.1  fps
high 1920x1080
100%
Radeon 680M:
29.5  fps
ultra 1920x1080
100%
Radeon 680M:
24.5  fps
F1 2021

F1 2021

2021
low 1280x720
100%
Radeon 680M:
97 99.6 103.2 133.1 133.3 140.5 152.9 155.3 155.7 156.3 156.5 163.8 168.1 169.1 175.3 184.4 184.5 186.3 191.6 193 ~ 155 fps
med. 1920x1080
100%
Radeon 680M:
49.7 49.8 57.8 67.7 70.8 73.4 75.1 76.7 77.8 79.3 82.1 82.1 82.9 83.5 85 86 88.4 90.5 92 92.3 ~ 77 fps
high 1920x1080
100%
Radeon 680M:
26.8 36.4 37 45.5 51.6 54.9 55.1 57.7 58.6 58.9 59.8 60.3 63.5 63.8 63.9 64.2 64.4 67 67.5 67.5 69 ~ 57 fps
ultra 1920x1080
100%
Radeon 680M:
16.1 16.7 19.9 20.7 21.2 23 24.5 24.7 25.6 25.9 26.3 26.3 26.6 27.1 27.3 28 28.9 29.1 ~ 24 fps
QHD 2560x1440
100%
Radeon 680M:
15.8 16.9 17 ~ 17 fps
Days Gone

Days Gone

2021
low 1280x720
100%
Radeon 680M:
75.7  fps
med. 1920x1080
100%
Radeon 680M:
36.4  fps
high 1920x1080
100%
Radeon 680M:
32.2  fps
ultra 1920x1080
100%
Radeon 680M:
24.6  fps
low 1280x720
100%
Radeon 680M:
91.1  fps
ultra 1920x1080
100%
Radeon 680M:
57.8  fps
low 1280x720
100%
Radeon 680M:
114  fps
med. 1920x1080
100%
Radeon 680M:
54  fps
high 1920x1080
100%
Radeon 680M:
49.7  fps
ultra 1920x1080
100%
Radeon 680M:
44.6  fps
Outriders

Outriders

2021
low 1280x720
100%
Radeon 680M:
91.9  fps
med. 1920x1080
100%
Radeon 680M:
41.4  fps
high 1920x1080
100%
Radeon 680M:
31  fps
ultra 1920x1080
100%
Radeon 680M:
29.3  fps
Hitman 3

Hitman 3

2021
low 1280x720
100%
Radeon 680M:
134 137.8 ~ 136 fps
med. 1920x1080
100%
Radeon 680M:
55.2 57 ~ 56 fps
high 1920x1080
100%
Radeon 680M:
48.6 50.5 ~ 50 fps
ultra 1920x1080
100%
Radeon 680M:
44.2 45.9 ~ 45 fps
QHD 2560x1440
100%
Radeon 680M:
27.8  fps
4K 3840x2160
100%
Radeon 680M:
14.4  fps
low 1280x720
T500 Laptop GPU:
27.8 34.3 ~ 31 fps
med. 1920x1080
T500 Laptop GPU:
14.4 19.3 ~ 17 fps
high 1920x1080
T500 Laptop GPU:
10.9 15 ~ 13 fps
ultra 1920x1080
T500 Laptop GPU:
10.1  fps
low 1280x720
T500 Laptop GPU:
65  fps
med. 1920x1080
T500 Laptop GPU:
35  fps
high 1920x1080
T500 Laptop GPU:
29  fps
ultra 1920x1080
T500 Laptop GPU:
24  fps
low 1280x720
100%
Radeon 680M:
89.1  fps
med. 1920x1080
100%
Radeon 680M:
32.1  fps
high 1920x1080
100%
Radeon 680M:
30.1  fps
ultra 1920x1080
100%
Radeon 680M:
27  fps
low 1280x720
100%
Radeon 680M:
74  fps
med. 1920x1080
100%
Radeon 680M:
38  fps
high 1920x1080
100%
Radeon 680M:
31  fps
ultra 1920x1080
100%
Radeon 680M:
27  fps
Dirt 5

Dirt 5

2020
low 1280x720
100%
Radeon 680M:
103  fps
med. 1920x1080
100%
Radeon 680M:
45.1  fps
high 1920x1080
100%
Radeon 680M:
34.2  fps
ultra 1920x1080
100%
Radeon 680M:
27.3  fps
low 1280x720
100%
Radeon 680M:
60  fps
med. 1920x1080
100%
Radeon 680M:
39  fps
high 1920x1080
100%
Radeon 680M:
33  fps
ultra 1920x1080
100%
Radeon 680M:
18  fps
low 1280x720
100%
Radeon 680M:
191  fps
med. 1920x1080
100%
Radeon 680M:
91  fps
60%
T500 Laptop GPU:
54.7  fps
high 1920x1080
100%
Radeon 680M:
79.2  fps
60%
T500 Laptop GPU:
47.2  fps
ultra 1920x1080
100%
Radeon 680M:
69.3  fps
61%
T500 Laptop GPU:
42.4  fps
low 1280x720
100%
Radeon 680M:
64.3  fps
med. 1920x1080
100%
Radeon 680M:
29.1  fps
high 1920x1080
100%
Radeon 680M:
26.7  fps
low 1280x720
100%
Radeon 680M:
106  fps
low 1280x720
100%
Radeon 680M:
108  fps
med. 1920x1080
100%
Radeon 680M:
50.4  fps
high 1920x1080
100%
Radeon 680M:
12.9  fps
ultra 1920x1080
100%
Radeon 680M:
11.9  fps
low 1280x720
100%
Radeon 680M:
78  fps
med. 1920x1080
100%
Radeon 680M:
37  fps
high 1920x1080
100%
Radeon 680M:
32  fps
ultra 1920x1080
100%
Radeon 680M:
27  fps
low 1280x720
100%
Radeon 680M:
88.6  fps
med. 1920x1080
100%
Radeon 680M:
49.4  fps
high 1920x1080
100%
Radeon 680M:
44.7  fps
ultra 1920x1080
100%
Radeon 680M:
44.1  fps
F1 2020

F1 2020

2020
low 1280x720
100%
Radeon 680M:
92.3 96.9 137.4 140.4 152.2 154.1 157.2 158 164 165.3 166.9 174.3 177 ~ 149 fps
67%
T500 Laptop GPU:
100  fps
med. 1920x1080
100%
Radeon 680M:
49.8 52.4 66.3 67 73.8 78.3 79.2 80.5 80.9 82.5 84.6 86.3 87.4 ~ 75 fps
80%
T500 Laptop GPU:
59.8  fps
high 1920x1080
100%
Radeon 680M:
39.1 44.5 49.7 52.7 57.8 60.1 60.9 62.4 63.7 64.5 66.4 67.2 67.6 ~ 58 fps
76%
T500 Laptop GPU:
44  fps
ultra 1920x1080
100%
Radeon 680M:
27.5 31.4 32.5 36 38.7 40.5 42.8 43 43.9 44.7 45.4 46.4 46.7 ~ 40 fps
73%
T500 Laptop GPU:
29.3  fps
low 1280x720
100%
Radeon 680M:
136.2 197 ~ 167 fps
med. 1920x1080
100%
Radeon 680M:
53.9 68.1 ~ 61 fps
high 1920x1080
100%
Radeon 680M:
33.3 45.8 ~ 40 fps
ultra 1920x1080
100%
Radeon 680M:
21.2 31.3 ~ 26 fps
low 1280x720
100%
Radeon 680M:
293  fps
med. 1920x1080
100%
Radeon 680M:
161  fps
high 1920x1080
100%
Radeon 680M:
147  fps
ultra 1920x1080
100%
Radeon 680M:
146  fps
low 1280x720
100%
Radeon 680M:
95.8  fps
med. 1920x1080
100%
Radeon 680M:
38  fps
high 1920x1080
100%
Radeon 680M:
29.5  fps
low 1280x720
100%
Radeon 680M:
38.3 53.7 58.2 66.4 78.8 78.8 82.1 83.6 84.9 85.5 85.9 86.6 90.7 ~ 75 fps
201%
T1000:
151  fps
med. 1920x1080
100%
Radeon 680M:
23.8 24.8 27.6 28 28.7 30.7 34.8 38.5 38.7 39.6 40 42.5 45.6 ~ 34 fps
176%
T1000:
60  fps
high 1920x1080
100%
Radeon 680M:
15.7 16.9 17.7 17.8 18 20.2 24.1 24.5 25.6 26.2 26.4 26.5 28.4 ~ 22 fps
174%
T1000:
38.2  fps
ultra 1920x1080
100%
Radeon 680M:
12.5 13.7 14.5 14.5 14.9 15.9 19.3 19.6 20.1 20.3 20.8 21.9 22.4 ~ 18 fps
159%
T1000:
28.6  fps
QHD 2560x1440
100%
Radeon 680M:
14.3  fps
4K 3840x2160
100%
Radeon 680M:
6.8  fps
Control

Control

2019
low 1280x720
100%
Radeon 680M:
79.9  fps
med. 1920x1080
100%
Radeon 680M:
28.2  fps
high 1920x1080
100%
Radeon 680M:
20.5  fps
QHD 2560x1440
100%
Radeon 680M:
13.3  fps
4K 3840x2160
100%
Radeon 680M:
6.5  fps
low 1280x720
100%
Radeon 680M:
118.2  fps
166%
T1000:
195.9  fps
med. 1920x1080
100%
Radeon 680M:
54.5  fps
110%
T1000:
60  fps
high 1920x1080
100%
Radeon 680M:
45.3  fps
82%
T1000:
37.3  fps
ultra 1920x1080
100%
Radeon 680M:
37.1  fps
65%
T1000:
24.1  fps
low 1280x720
100%
Radeon 680M:
81  fps
med. 1920x1080
100%
Radeon 680M:
35  fps
high 1920x1080
100%
Radeon 680M:
29  fps
ultra 1920x1080
100%
Radeon 680M:
22  fps
low 1280x720
100%
Radeon 680M:
36 40 52 58 58 60 61 62 63 64 65 66 ~ 57 fps
205%
T1000:
117  fps
med. 1920x1080
100%
Radeon 680M:
23 25 30 31 34 38 39 39 39 39 41 42 ~ 35 fps
177%
T1000:
62  fps
high 1920x1080
100%
Radeon 680M:
21 23 29 32 35 36 37 37 37 37 39 40 ~ 34 fps
171%
T1000:
58  fps
ultra 1920x1080
100%
Radeon 680M:
20 21 26 26 32 33 34 34 34 34 36 37 ~ 31 fps
171%
T1000:
53  fps
low 1280x720
100%
Radeon 680M:
41.9 43.1 52.8 54.5 57.6 57.8 57.8 65.8 69.8 72.2 72.3 73 76.2 ~ 61 fps
168%
T1000:
102.3  fps
med. 1920x1080
100%
Radeon 680M:
17.6 24.3 24.7 25.2 26 27.2 28.2 29.2 29.3 29.8 30.4 30.6 31 ~ 27 fps
170%
T1000:
45.9  fps
high 1920x1080
100%
Radeon 680M:
13.8 18.7 18.8 19.2 19.9 20.2 22.1 22.3 22.9 23.2 23.4 23.4 24.1 ~ 21 fps
157%
T1000:
33  fps
ultra 1920x1080
100%
Radeon 680M:
11.7 15.1 15.5 15.5 16.4 17.4 18 18.1 18.8 19 19.4 19.5 19.8 ~ 17 fps
154%
T1000:
26.1  fps
low 1280x720
100%
Radeon 680M:
53.3 53.6 56.9 70.6 81 85.7 85.9 90 91.3 92 92.7 92.9 ~ 79 fps
med. 1920x1080
100%
Radeon 680M:
20.7 21.8 23.9 26.4 29.8 30.8 33 36.1 38.8 39.2 39.8 40.5 ~ 32 fps
high 1920x1080
100%
Radeon 680M:
18.7 19.8 20.6 25.2 27.5 28 30 33.9 35.2 35.4 35.6 36.9 ~ 29 fps
ultra 1920x1080
100%
Radeon 680M:
16.4 16.4 17.3 22.9 23.3 24.4 25 28.8 29.8 29.9 30.5 31.9 ~ 25 fps
Strange Brigade

Strange Brigade

2018
low 1280x720
100%
Radeon 680M:
72.9 78.2 78.4 84.5 106.8 115.6 125.1 128.9 131.3 132.2 133.5 133.7 135.7 137.5 137.8 139 140.4 140.5 140.6 140.9 141.9 142.4 143 143.5 145.7 146.2 147.3 148.3 148.9 149.9 155.8 167.5 ~ 132 fps
171%
T1000:
226  fps
84%
T500 Laptop GPU:
108 113 ~ 111 fps
med. 1920x1080
100%
Radeon 680M:
30 31.1 31.4 46.2 49 49.1 54.2 54.2 54.3 54.4 54.7 54.7 55.2 55.3 55.8 56 56.4 56.4 56.7 57 57.4 57.5 57.7 57.8 57.8 58 58.4 59 59.7 60.5 61.7 63 ~ 54 fps
161%
T1000:
87.2  fps
63%
T500 Laptop GPU:
33.6 33.8 ~ 34 fps
high 1920x1080
100%
Radeon 680M:
25.3 26.4 26.7 39.4 39.9 40.9 41.8 43.2 44.8 44.9 45 45.1 45.4 45.9 46 46.5 46.6 46.8 47 47.1 47.8 47.9 48 48 48.1 48.5 48.6 49.1 49.5 50 50.6 53.1 ~ 44 fps
158%
T1000:
69.4  fps
66%
T500 Laptop GPU:
28.8 29.2 ~ 29 fps
ultra 1920x1080
100%
Radeon 680M:
22 22.6 23.1 33.2 34.1 34.1 34.2 34.3 36.4 38.3 38.9 39.1 39.2 39.9 40.1 40.2 40.4 40.7 40.9 41 41 41.3 41.5 41.6 41.8 41.9 42.5 42.5 42.7 43 43.4 44.2 ~ 38 fps
158%
T1000:
59.9  fps
66%
T500 Laptop GPU:
24.5 25.6 ~ 25 fps
QHD 2560x1440
100%
Radeon 680M:
25.3 26.8 27.8 ~ 27 fps
66%
T500 Laptop GPU:
17.9  fps
4K 3840x2160
100%
Radeon 680M:
14.4  fps
67%
T500 Laptop GPU:
9.6  fps
Far Cry 5

Far Cry 5

2018
low 1280x720
100%
Radeon 680M:
37 39 41 46 53 55 56 57 58 59 60 62 66 67 67 68 69 70 71 72 72 73 75 77 82 ~ 62 fps
205%
T1000:
127  fps
84%
T500 Laptop GPU:
31 72 ~ 52 fps
med. 1920x1080
100%
Radeon 680M:
21 23 25 25 26 33 33 34 36 36 38 38 38 39 41 41 41 41 41 43 43 43 44 45 45 ~ 37 fps
168%
T1000:
62  fps
81%
T500 Laptop GPU:
25 34 ~ 30 fps
high 1920x1080
100%
Radeon 680M:
18 21 22 24 26 30 31 31 33 34 34 35 35 35 36 37 38 38 38 38 38 39 40 41 41 ~ 33 fps
173%
T1000:
57  fps
85%
T500 Laptop GPU:
22 33 ~ 28 fps
ultra 1920x1080
100%
Radeon 680M:
20 21 23 24 28 28 29 31 31 32 33 33 34 34 35 36 36 36 36 36 37 38 39 40 ~ 32 fps
166%
T1000:
53  fps
84%
T500 Laptop GPU:
21 32 ~ 27 fps
QHD 2560x1440
100%
Radeon 680M:
21  fps
low 1280x720
100%
Radeon 680M:
26.8 40.1 41.4 46.9 48.2 48.9 49.8 50.7 50.7 51.8 52 53.1 53.8 54.2 54.6 54.8 55.3 56.2 56.2 56.7 56.7 57.1 57.2 60 60.6 62.7 63.5 64.3 64.8 65.1 65.2 66.1 66.4 66.7 ~ 55 fps
384%
T1000:
211  fps
127%
T500 Laptop GPU:
47.4 75.6 76.1 81.1 ~ 70 fps
med. 1920x1080
100%
Radeon 680M:
21.1 32.4 32.4 36.6 38.2 38.6 39 39.3 39.5 39.7 39.8 40.6 41.4 41.9 42.8 43.2 43.7 44 44 45 45.4 45.7 46.1 47 49.8 50.2 50.7 51 52.3 52.6 52.8 52.8 52.9 53.1 ~ 44 fps
331%
T1000:
145.8  fps
143%
T500 Laptop GPU:
48.1 64.2 69 71.2 ~ 63 fps
high 1920x1080
100%
Radeon 680M:
16.6 28.9 29.3 30.2 31.2 31.5 31.9 33.5 33.5 33.5 33.6 33.8 34.3 34.6 35.1 35.4 35.5 35.7 35.9 35.9 36 36.2 36.3 37 41 41.1 41.3 41.6 41.8 42.2 42.2 42.4 43 43.1 ~ 36 fps
361%
T1000:
130.1  fps
153%
T500 Laptop GPU:
38.6 56.4 60 65.1 ~ 55 fps
4K 3840x2160
100%
Radeon 680M:
26.3 35.9 ~ 31 fps
95%
T500 Laptop GPU:
29.4  fps
low 1280x720
100%
Radeon 680M:
34.4 37.5 39.2 45.7 47.9 48.2 57.1 57.9 57.9 58.7 59.3 59.5 59.8 60.1 60.5 61.3 62 62.1 62.2 63.1 63.4 63.6 63.8 64.7 65.4 66.7 67.6 68.1 68.5 68.5 70.7 74.7 ~ 59 fps
172%
T1000:
101.3  fps
85%
T500 Laptop GPU:
49.1 50.5 51.1 ~ 50 fps
med. 1920x1080
100%
Radeon 680M:
18.3 19.4 20.5 22 22.4 26.7 27.2 28.6 28.9 30.4 30.5 31 31.6 32.3 32.3 32.4 32.5 32.7 32.8 33 33 33.1 33.2 33.5 33.6 34 34.7 34.7 34.9 35.5 35.8 36.1 36.9 ~ 31 fps
159%
T1000:
49.3  fps
77%
T500 Laptop GPU:
23.6 23.9 25.2 ~ 24 fps
high 1920x1080
100%
Radeon 680M:
12.9 14.6 14.8 15.6 16.2 19.3 19.3 20.4 20.9 21.7 21.7 21.9 22.4 23 23 23.4 23.4 23.5 23.6 23.6 23.8 23.9 23.9 24.1 24.2 24.5 24.6 24.7 24.8 25.4 25.7 25.9 26.2 ~ 22 fps
165%
T1000:
36.2  fps
77%
T500 Laptop GPU:
16.5 16.7 16.7 ~ 17 fps
QHD 2560x1440
100%
Radeon 680M:
16.3 17 18.4 ~ 17 fps
73%
T500 Laptop GPU:
12.4  fps
4K 3840x2160
T500 Laptop GPU:
5.7  fps
low 1280x720
100%
Radeon 680M:
34.4 37.2 62.4 90.2 93.7 107.7 108.3 108.9 109.1 110.2 110.3 110.5 111.2 111.4 112.9 113.1 114.6 115.8 116.5 118.8 119.9 120.2 124 125.7 132.9 133.4 136.8 137.9 140.9 141.2 141.9 142.2 143 143.3 ~ 114 fps
216%
T1000:
246.2  fps
112%
T500 Laptop GPU:
97.5 133 134 146 ~ 128 fps
med. 1366x768
100%
Radeon 680M:
33.3 36.7 57.3 82.5 83.5 84.7 86.7 87.4 89.6 90.4 91.4 91.8 93.6 96 96.3 96.9 97.2 97.6 98 100.1 101.7 102.8 104 104.5 104.7 110.4 111.3 112.7 113.4 113.5 113.5 114.6 115.1 121.4 ~ 95 fps
229%
T1000:
217.7  fps
124%
T500 Laptop GPU:
117 117 117 120 ~ 118 fps
high 1920x1080
100%
Radeon 680M:
33.2 36.2 44.8 54.9 55 60.5 66.3 66.8 67.4 69.2 69.6 69.7 69.8 71.7 72.2 72.3 72.8 73 73.3 74 76.4 76.6 78.6 79.5 80.9 81.3 81.6 82.2 83.9 84.2 84.3 85.3 89.1 89.1 ~ 71 fps
212%
T1000:
150.4  fps
127%
T500 Laptop GPU:
77.1 79.2 101 104 ~ 90 fps
ultra 1920x1080
100%
Radeon 680M:
33.2 36 42 47.4 48 53.1 56.6 57.7 57.8 60.2 60.5 60.6 61 62.2 62.7 63.1 63.1 64.2 65 65.7 67.2 69.2 69.7 70.2 70.2 70.9 71.4 71.8 72.8 73.1 73.6 73.7 75.2 84.9 ~ 63 fps
217%
T1000:
136.5  fps
125%
T500 Laptop GPU:
70.5 71.4 77.8 96.2 ~ 79 fps
4K 3840x2160
100%
Radeon 680M:
9.8 9.8 26.5 ~ 15 fps
185%
T500 Laptop GPU:
27.7  fps
low 1024x768
100%
Radeon 680M:
67.4 73 74 94.2 94.3 97.3 104.3 107.7 108 108.2 111.1 113.9 115.6 116.4 117 119.3 119.6 119.7 121.6 123 125 126 130.7 131 131.8 132.8 133 138.1 139.2 150 ~ 115 fps
164%
T1000:
188.8  fps
83%
T500 Laptop GPU:
79.2 96.2 114 ~ 96 fps
med. 1366x768
100%
Radeon 680M:
44.5 46.7 47.2 47.7 51.4 58.5 63.8 65.8 66 72.7 75.9 76 76.6 77 78 79 79.8 81.4 82.9 84 85 85.1 85.3 ~ 70 fps
163%
T1000:
113.8  fps
74%
T500 Laptop GPU:
50 50.4 56.9 ~ 52 fps
high 1920x1080
100%
Radeon 680M:
22.3 23 23.7 24.2 29.3 32.1 32.7 33 35.1 36 36.3 37.5 37.9 39.3 39.4 40 40 40.1 40.2 40.5 41 41 41.2 41.3 41.7 42.4 42.6 42.6 43 43.3 46 48 ~ 37 fps
173%
T1000:
63.9  fps
78%
T500 Laptop GPU:
27.6 28.4 31.4 ~ 29 fps
ultra 1920x1080
100%
Radeon 680M:
14.3 14.6 14.9 15.6 18.3 19.9 20.1 20.3 22 22.7 22.7 22.8 23 23.1 23.5 23.9 24 24.5 24.5 24.8 25 25.2 25.4 25.5 25.8 26.3 26.8 27 27 27.1 27.1 27.1 ~ 23 fps
153%
T1000:
35.2  fps
87%
T500 Laptop GPU:
16.9 17 21.9 22.3 ~ 20 fps
QHD 2560x1440
100%
Radeon 680M:
16.7  fps
4K 3840x2160
100%
Radeon 680M:
12.8  fps
GTA V

GTA V

2015
low 1024x768
100%
Radeon 680M:
67.7 87.7 95.5 106.6 122.2 123.2 125.5 131.1 131.3 133.6 136.1 136.6 136.9 138.5 138.6 140.3 142.8 144.2 145.3 145.8 147.3 147.5 149.3 151.6 152.1 152.3 152.3 152.6 155.4 ~ 134 fps
140%
T1000:
187.4  fps
105%
T500 Laptop GPU:
133 148 ~ 141 fps
med. 1366x768
100%
Radeon 680M:
60.7 61.7 78.3 85.7 108.3 110.2 115.4 116.4 119.6 119.7 120.1 120.4 122.7 127.6 130.4 130.5 131.4 134.5 136.8 138 138.1 139.1 139.1 139.7 140.4 143.9 ~ 120 fps
156%
T1000:
187.1  fps
81%
T500 Laptop GPU:
76.1 118 ~ 97 fps
high 1920x1080
100%
Radeon 680M:
25.9 28.2 34 44.1 44.2 46.4 46.8 47 47.5 47.6 47.6 48.7 48.7 49.2 49.3 49.5 49.6 50.5 51.4 51.8 51.9 51.9 52.2 52.9 53 53.4 53.5 53.9 99.1 ~ 49 fps
211%
T1000:
103.5  fps
86%
T500 Laptop GPU:
41.1 42.1 ~ 42 fps
ultra 1920x1080
100%
Radeon 680M:
11.3 12.7 18.8 19 19.4 19.6 20 20.4 20.5 20.6 20.9 21.3 21.7 22.2 22.3 22.7 22.8 23.1 23.2 23.5 23.5 23.7 23.7 23.8 24 24.1 24.2 24.5 24.8 ~ 21 fps
239%
T1000:
50.2  fps
100%
T500 Laptop GPU:
19 23.2 ~ 21 fps
QHD 2560x1440
100%
Radeon 680M:
17  fps
78%
T500 Laptop GPU:
13.2  fps
4K 3840x2160
T500 Laptop GPU:
14  fps

Average Gaming AMD Radeon 680M → 100%

Average Gaming 30-70 fps → 100%

Average Gaming NVIDIA T1000 → 166%

Average Gaming 30-70 fps → 151%

Average Gaming NVIDIA T500 Laptop GPU → 90%

Average Gaming 30-70 fps → 85%

NVIDIA T1000lowmed.highultraQHD4K
F1 2498.482.658.8
Avatar Frontiers of Pandora22191510
Total War Pharaoh138.690.850.639.8
Assassin's Creed Mirage444038
Cyberpunk 2077 2.1 Phantom Liberty45.134.228.323.8
Baldur's Gate 34535.230.229.5
F1 23108.396.563.6
Tiny Tina's Wonderlands69.255.635.327.6
GRID Legends125.491.369.649.7
God of War51.842.533.521.4
Far Cry 6110.456.947.440.3
Borderlands 31516038.228.6
Total War: Three Kingdoms195.96037.324.1
Far Cry New Dawn117625853
Metro Exodus102.345.93326.1
Strange Brigade22687.269.459.9
Far Cry 5127625753
X-Plane 11.11211145.8130.1
Final Fantasy XV Benchmark101.349.336.2
Dota 2 Reborn246.2217.7150.4136.5
The Witcher 3188.8113.863.935.2
GTA V187.4187.1103.550.2
< 30 fps
< 60 fps
< 120 fps
≥ 120 fps
1
4
7
10
1
8
10
3
2
13
5
2
8
8

1


AMD Radeon 680Mlowmed.highultraQHD4K
Prince of Persia The Lost Crown1329591
Alan Wake 218.31614.9
Lords of the Fallen24.318.312.38.65
Total War Pharaoh69574438
Assassin's Creed Mirage34323024
EA Sports FC 2480.357.94239.5
Cyberpunk 2077 2.1 Phantom Liberty3427211910.43.98
Lies of P42.537.232.729.2
The Crew Motorfest29282420
Starfield23.219.414.812.7
Armored Core 632.331.43025.3
Immortals of Aveum17.414.710.4
Atlas Fallen3634.83224.9
Baldur's Gate 336282322
Ratchet & Clank Rift Apart29.925.521.118
F1 2368604310
Diablo 445.843.539.132.8
Star Wars Jedi Survivor40.227.319.715.4
Dead Island 262.451.639.532.4
The Last of Us26.419.516.613.1
Resident Evil 4 Remake31.625.621.813.6
Company of Heroes 352.546.6
Sons of the Forest33.724.923.623.3
Atomic Heart47.236.820.316.9
Returnal23191714
Hogwarts Legacy34.121.819.614.2
The Witcher 3 v4.004436312616.48.28
High On Life63.14533.825.7
The Callisto Protocol35231414
Need for Speed Unbound49.44131.727.5
Spider-Man Miles Morales38332926
Call of Duty Modern Warfare 2 202258503834
Uncharted Legacy of Thieves Collection28.526.523.122
A Plague Tale Requiem22191514
FIFA 2381724849
The Quarry35262012
F1 2273644711
Vampire Bloodhunt9261.755.6
Ghostwire Tokyo41.330302924.511
Tiny Tina's Wonderlands5138262113.66.6
Cyberpunk 2077 1.638292118104
Elex 237.831.326.422.6
GRID Legends72584535
Elden Ring52.741.537.231.5
Dying Light 229.423.920.4
Rainbow Six Extraction84727058
God of War31231813
Halo Infinite75.337.831.129.3
Farming Simulator 22119625042
Battlefield 204277.539.431.126.6
Forza Horizon 5120524627
Riders Republic65383026
Guardians of the Galaxy
Back 4 Blood16765.254.449.3
Far Cry 66838332821.59.58
Alan Wake Remastered64.944.234.7
New World70.429.728.322.9
Deathloop80.138.129.524.5
F1 202115577572417
Days Gone75.736.432.224.6
Mass Effect Legendary Edition91.157.8
Resident Evil Village1145449.744.6
Outriders91.941.43129.3
Hitman 313656504527.814.4
Yakuza Like a Dragon89.132.130.127
Assassin´s Creed Valhalla74383127
Dirt 510345.134.227.3
Watch Dogs Legion60393318
Star Wars Squadrons1919179.269.3
Mafia Definitive Edition64.329.126.7
Serious Sam 4106
Crysis Remastered10850.412.911.9
Horizon Zero Dawn78373227
Death Stranding88.649.444.744.1
F1 2020149755840
Gears Tactics167614026
Doom Eternal293161147146
Hunt Showdown95.83829.5
Borderlands 37534221814.36.8
Control79.928.220.513.36.54
Total War: Three Kingdoms118.254.545.337.1
The Division 281352922
Far Cry New Dawn57353431
Metro Exodus61272117
Shadow of the Tomb Raider79322925
Strange Brigade1325444382714.4
Far Cry 56237333221
X-Plane 11.1155443631
Final Fantasy XV Benchmark59312217
Dota 2 Reborn11495716315
The Witcher 311570372316.712.8
GTA V134120492117
< 30 fps
< 60 fps
< 120 fps
≥ 120 fps
11
28
41
10
24
48
13
3
36
47
4
1
56
20
3
1
15


12
1

NVIDIA T500 Laptop GPUlowmed.highultraQHD4K
Cyberpunk 2077 1.031171310.1
Immortals Fenyx Rising65352924
Star Wars Squadrons54.747.242.4
F1 202010059.84429.3
Strange Brigade11134292517.99.6
Far Cry 552302827
X-Plane 11.1170635529.4
Final Fantasy XV Benchmark50241712.45.73
Dota 2 Reborn128118907927.7
The Witcher 396522920
GTA V14197422113.214
< 30 fps
< 60 fps
< 120 fps
≥ 120 fps

3
5
2
2
6
3
6
4
1
7
1
1
3


5


Eine Liste mit weiteren Spielen und allen Grafikkarten finden Sie auf unserer Seite: Welches Spiel ist mit welcher Grafikkarte spielbar?

v1.28
log 23. 06:28:36

#0 ran 0s before starting gpusingle class +0s ... 0s

#1 checking url part for id 11124 +0s ... 0s

#2 checking url part for id 12782 +0s ... 0s

#3 checking url part for id 10605 +0s ... 0s

#4 redirected to Ajax server, took 1727065715s time from redirect:0 +0s ... 0s

#5 did not recreate cache, as it is less than 5 days old! Created at Sun, 22 Sep 2024 05:16:22 +0200 +0s ... 0s

#6 composed specs +0.003s ... 0.004s

#7 did output specs +0s ... 0.004s

#8 start showIntegratedCPUs +0s ... 0.004s

#9 getting avg benchmarks for device 11124 +0.011s ... 0.015s

#10 got single benchmarks 11124 +0.006s ... 0.021s

#11 getting avg benchmarks for device 12782 +0.004s ... 0.025s

#12 got single benchmarks 12782 +0.005s ... 0.03s

#13 getting avg benchmarks for device 10605 +0.001s ... 0.031s

#14 got single benchmarks 10605 +0.001s ... 0.032s

#15 got avg benchmarks for devices +0s ... 0.032s

#16 min, max, avg, median took s +0.068s ... 0.099s

#17 before gaming benchmark output +0s ... 0.1s

#18 Got 2132 rows for game benchmarks. +0.105s ... 0.204s

#19 composed SQL query for gamebenchmarks +0s ... 0.204s

#20 got data and put it in $dataArray +0.009s ... 0.213s

#21 benchmarks composed for output. +0.036s ... 0.249s

#22 calculated avg scores. +0s ... 0.249s

#23 return log +0.003s ... 0.251s

Teilen Sie diesen Artikel, um uns zu unterstützen. Jeder Link hilft!
> Notebook Test, Laptop Test und News > Benchmarks / Technik > Benchmarks / Technik > Grafikkarten Vergleich - Head 2 Head
Autor: Klaus Hinum,  8.09.2017 (Update:  1.07.2023)