AMD Radeon 660M vs Intel HD Graphics 5500 vs Intel HD Graphics (Bay Trail)
AMD Radeon 660M ► remove from comparison
Die AMD Radeon 660M (oder RX 660M) ist eine integrierte Grafikkarte (iGPU) für Notebooks. Sie befindet sich in den Einstiegs-Rembrandt-APUs (Ryzen 6000 Mobile) und bietet nur 6 (384 Shader) der 12 CUs. Sie nutzt die aktuelle RDNA 2 Architektur (wie die RX 6000M Serie). Die Taktrate ist abhängig vom CPU-Modell und rangiert beim Launch von 1,5 - 1,9 GHz (maximaler Boost-Takt). Die GPU hat keinen eigenen Grafikspeicher, sondern nutzt den gemeinsamen Hauptspeicher (bis zu LPDDR5 6400 MT/s oder DDR5 4800 MT/s). Als erste iGPU neben der 680M, unterstützt die 660M Raytracing in Hardware, ist jedoch bei aktuellen Spielen zu langsam um dieses Feature sinnvoll nutzen zu können.
Die Leistung der GPU ist abhängig von der CPU, dem konfiguriertem TDP (15 - 45W+), der Kühlung und dem verbautem Hauptspeicher. Die Performance sollte durch die geringere CU-Anzahl und geringere Taktung deutlich hinter der Radeon 680M liegen und wohl nur auf dem Level der alten Vega 7 iGPUs .
Der Stromverbrauch ist dank 6nm Prozess und ausgeklügelten Stromsparmechanismen relativ gering (laut AMD) und daher eignet sich die Grafikkarte auch für dünne und leichte Notebooks (vor allem die 15W Varianten).
Intel HD Graphics 5500 ► remove from comparison
Die Intel HD Graphics 5500 (GT2) ist eine Prozessorgrafikkarte in den CPUs der Broadwell- Generation. Die GPU wird in einigen ULV-Modellen (15 Watt) der Core-i3-, Core-i5- und Core-i7-Serie verbaut und verfügt im Regelfall über 24 EUs (Core i3: 23 EUs). Die maximale Turbo-Taktrate der Grafikkarte hängt vom konkreten Modell ab und liegt zwischen 850 und 950 MHz.
Architektur und Features
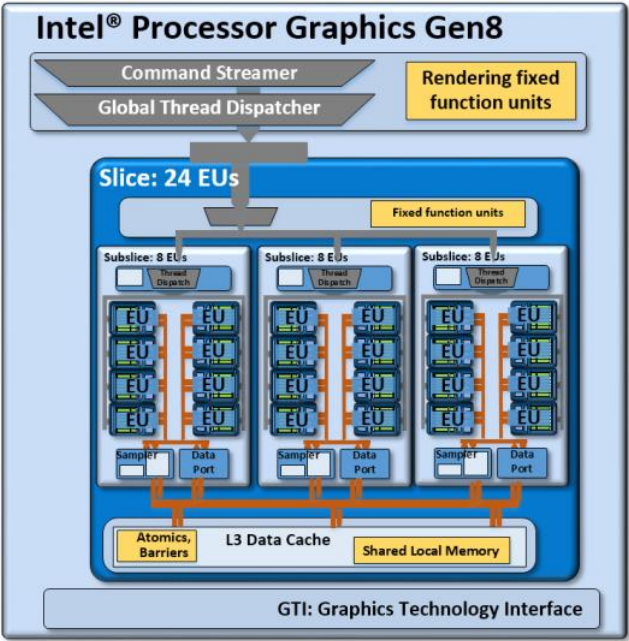
Broadwell integriert eine Grafikeinheit auf Basis der Intel-Gen8-Architektur, die gegenüber dem Vorgänger Intel Gen7.5 (Haswell) in verschiedenen Punkten weiterentwickelt wurde. So hat Intel unter anderem die "Subslice" genannten Shader-Arrays umorganisiert, die nun jeweils 8 Execution Units (EUs) beinhalten. Drei Subslices bilden wiederum einen Slice mit insgesamt 24 EUs. Hinzu kommen größere L1-Caches und Verbesserungen im Front-End, die die Leistung zusätzlich steigern sollen.
Die HD Graphics 5500 repräsentiert die mittlere, auch "GT2" bezeichnete Ausbaustufe mit einem Slice und 24 EUs. Eine Ausnahme bilden die Core-i3-Modelle, bei denen – mutmaßlich zur Steigerung der Ausbeute – lediglich 23 EUs aktiviert sind. Daneben existieren auch eine teildeaktivierte GT1-Variante (12 EUs) sowie die GT3/GT3e (48 EUs) ohne/mit zusätzlichem eDRAM-Cache.
Alle Broadwell-GPUs unterstützen OpenCL 2.0 sowie DirectX 12 (FL 11_1) . Zudem kann der Videodecoder nun auch den H.265-Codec verarbeiten, greift dafür allerdings nur teilweise auf besonders sparsame Fixed-Function-Einheiten zurück. Die Bildausgabe erfolgt über DP 1.2/eDP 1.3 (max. 3.840 x 2.160 @ 60 Hz) oder HDMI 1.4a (max. 3.840 x 2.160 @ 24 Hz), HDMI 2.0 steht dagegen nicht zur Verfügung. Es können maximal drei Displays parallel angesteuert werden.
Performance
Je nach Modell liegt der maximale GPU-Takt zwischen 850 und 950 MHz, der aufgrund der niedrigen TDP jedoch nicht immer vollständig ausgeschöpft werden kann. Einen ebenfalls großen Einfluss auf die Performance hat die Speicheranbindung: Ohne schnellen DDR3-1600-RAM im Dual-Channel-Modus kann die Leistung mehr als 20 Prozent schlechter ausfallen.
Mit Dual-Channel-Speicher übertrifft die HD Graphics 5500 die HD Graphics 4400 (Haswell, 20 EUs) um etwa 20 bis 25 Prozent und schlägt sogar die HD Graphics 5000 (Haswell, 40 EUs). Allerdings rechnet bereits eine dedizierte Low-End-Karte wie die GeForce 820M je nach Spiel zwischen 10 und 30 Prozent schneller. Aktuelle Spiele des Jahres 2014/2015 werden zumeist nur in niedrigsten Einstellungen flüssig dargestellt.
Leistungsaufnahme
Die TDP des gesamten Chips liegt standardmäßig bei 15 Watt, sodass die HD Graphics 5500 vor allem in kompakten Ultrabooks zu finden ist. Abhängig vom jeweiligen Modell kann die TDP auch auf noch niedrigere Werte (7,5 oder 10 Watt) abgesenkt werden, was sich jedoch negativ auf die Leistungsfähigkeit auswirkt.
Intel HD Graphics (Bay Trail) ► remove from comparison
Die Intel HD Graphics (Bay Trail) ist eine in den Tablet- (z.B. Z3770 ), Nettop- (z.B. J2850 ) und Notebook-SoCs (z.B. N3510 ) der Bay-Trail-Serie integrierte Grafikeinheit. Sie ist in verschiedenen Atom-, Celeron- und Pentium-Modellen zu finden und basiert auf der DirectX-11-tauglichen GPU der Ivy-Bridge-Generation . Taktrate und Einheitenzahl fallen allerdings deutlich niedriger aus, sodass sich die Performance nur im Low-End-Segment ansiedelt.
Im Vergleich zu Ivy Bridge, dessen Gen-7-GPU entweder 6 oder 16 Executions Units bietet, kommt die HD Graphics (Bay Trail) nur mit lediglich 4 EUs daher. Abhängig von Temperatur und Leistungsaufnahme kann die niedrige Basisfrequenz dynamisch bis auf den maximalen Turbo-Takt angehoben werden, der ja nach Modell bei bis zu 896 MHz liegt. Ebenfalls modellabhängig ist das Speicherinterface, welches im Single- oder Dual-Channel-Betrieb sowie mit verschiedene Speicherstandards (DDR3(L), DDR3L-RS, LPDDR3) arbeiten kann. Insbesondere Varianten mit einem nur 32 Bit breiten Interface (Atom Z3735G ) verlieren teils erheblich an Performance.
Die schnellsten Notebook-Modelle erreichen knapp die Performance der HD Graphics (Sandy Bridge) sowie der Radeon HD 6310 . Das reicht, um einige ältere und sehr anspruchslose Windows-Spiele wie World of Warcraft oder Half-Life 2 in niedrigen Einstellungen flüssig darzustellen. Für aktuelle Windows-Titel ist die GPU dagegen praktisch nicht geeignet.
Verglichen mit konkurrierenden ARM-SoCs ordnet sich die Grafikeinheit dagegen im unteren High-End-Segment ein und übertrifft knapp die Adreno 320 , die in verschiedenen Qualcomm-SoCs wie dem Snapdragon 600 zu finden ist. Damit entspricht Grafik-Performance in etwa Nvidias Tegra 4 . Auch sehr aufwändige Android-Spiele werden damit in hohen Auflösungen flüssig bewältigt (Stand 2013).
Der integrierte Videodecoder unterstützt alle gängigen Codecs wie MPEG2, H.264, VC1, MVC oder VP8 und ist für Auflösungen bis 4K (maximal 100 Mbit/s) geeignet. Das Bildsignal kann per HDMI 1.4 (max. 1.920 x 1.080) oder DisplayPort 1.2 (max. 2.560 x 1.600) an bis zu zwei Displays ausgegeben werden. Eine weitere Neuerung ist die Unterstützung von Wireless Display sowie Quick Sync , Intels schnellem und sparsamen H-264-Hardwareencoder. Einige dieser Features sind jedoch nicht bei allen Modellen verfügbar.
Je nach Modell liegt die Leistungsaufnahme des gesamten SoCs zwischen rund 2 und 10 Watt. Die besonders sparsamen Versionen sind damit auch für passiv gekühlte Tablets geeignet, andere werden in größeren (Sub-) Notebooks mit aktiver Kühlung eingesetzt.
AMD Radeon 660M Intel HD Graphics 5500 Intel HD Graphics (Bay Trail) HD Graphics Serie Codename RDNA 2 Rembrandt Broadwell GT2 Bay Trail Architektur RDNA 2 Gen. 8 Broadwell Gen. 7 Ivy Bridge Pipelines 384 - unified 24 - unified 4 - unified Kerntakt 1900 (Boost) MHz 300 - 950 (Boost) MHz 311 - 896 (Boost) MHz Shared Memory nein ja ja API DirectX 12_1 DirectX 12 (FL 11_1), OpenGL 4.3 DirectX 11, Shader 5.0, OpenGL 4.0, ES 3.0 Stromverbrauch 45 Watt Herstellungsprozess 6 nm 14 nm 22 nm Features Tiled Rasterization, Shared Memory (up to Dual-Channel DDR4-3200) Quick Sync Erscheinungsdatum 04.01.2022 05.01.2015 11.09.2013 Speicherbandbreite 64/128 Bit 32/64/128 Bit Transistors 1.3 Billion
CPU in Radeon 660M GPU Base Speed GPU Boost / Turbo AMD Ryzen 5 PRO 6650H 6 x 3300 MHz, 45 W ? MHz 1900 MHz AMD Ryzen 5 6600H 6 x 3300 MHz, 45 W ? MHz 1900 MHz AMD Ryzen 5 PRO 6650HS 6 x 3300 MHz, 35 W ? MHz 1900 MHz » show 6 more AMD Ryzen 5 7535HS 6 x 3300 MHz, 35 W ? MHz 1900 MHz AMD Ryzen 5 6600HS 6 x 3300 MHz, 35 W ? MHz 1900 MHz AMD Ryzen 5 PRO 6650U 6 x 2900 MHz, 28 W ? MHz 1900 MHz AMD Ryzen 5 7535U 6 x 2900 MHz, 28 W ? MHz 1900 MHz AMD Ryzen 5 6600U 6 x 2900 MHz, 28 W ? MHz 1900 MHz AMD Ryzen 3 7335U 4 x 3000 MHz, 28 W ? MHz 1800 MHz min. - max. ? MHz 1800 - 1900 MHz
CPU in HD Graphics 5500 GPU Base Speed GPU Boost / Turbo Intel Core i7-5600U 2 x 2600 MHz, 15 W 300 MHz 950 MHz Intel Core i7-5500U 2 x 2400 MHz, 15 W 300 MHz 950 MHz Intel Core i5-5300U 2 x 2300 MHz, 15 W 300 MHz 900 MHz » show 5 more Intel Core i5-5200U 2 x 2200 MHz, 15 W 300 MHz 900 MHz Intel Core i3-5020U 2 x 2200 MHz, 15 W 300 MHz 900 MHz Intel Core i3-5010U 2 x 2100 MHz, 15 W 300 MHz 900 MHz Intel Core i3-5015U 2 x 2100 MHz, 15 W 300 MHz 850 MHz Intel Core i3-5005U 2 x 2000 MHz, 15 W 300 MHz 850 MHz min. - max. 300 - ? MHz 850 - 1900 MHz
CPU in HD Graphics (Bay Trail) GPU Base Speed GPU Boost / Turbo Intel Pentium N3540 4 x 2160 MHz, 7.5 W 313 MHz 896 MHz Intel Pentium J2900 4 x 2410 MHz, 10 W 688 MHz 896 MHz Intel Pentium N3530 4 x 2160 MHz, 7.5 W 313 MHz 896 MHz » show 43 more Intel Pentium J2850 4 x 2400 MHz, 10 W 688 MHz 792 MHz Intel Pentium N3520 4 x 2167 MHz, 7.5 W 313 MHz 854 MHz Intel Celeron J1900 4 x 2000 MHz, 10 W 688 MHz 854 MHz Intel Atom Z3795 4 x 1590 MHz, 4 W 311 MHz 778 MHz Intel Atom Z3785 4 x 1490 MHz, 4 W 313 MHz 833 MHz Intel Atom Z3775 4 x 1460 MHz, 4 W 311 MHz 778 MHz Intel Atom Z3775D 4 x 1490 MHz, 4 W 311 MHz 792 MHz Intel Atom Z3770 4 x 1460 MHz, 4 W 311 MHz 667 MHz Intel Atom Z3770D 4 x 1500 MHz, 4 W 313 MHz 688 MHz Intel Celeron N2940 4 x 1830 MHz, 7.5 W 313 MHz 854 MHz Intel Celeron N2930 4 x 1830 MHz, 7.5 W 313 MHz 854 MHz Intel Celeron J1850 4 x 2000 MHz, 10 W 688 MHz 792 MHz Intel Pentium N3510 4 x 2000 MHz, 7.5 W 313 MHz 750 MHz Intel Celeron N2920 4 x 1860 MHz, 7.5 W 313 MHz 854 MHz Intel Atom E3845 4 x 1910 MHz, 10 W 542 MHz 792 MHz Intel Atom Z3736F 4 x 1330 MHz, 4 W 313 MHz 646 MHz Intel Atom Z3736G 4 x 1330 MHz, 4 W 313 MHz 646 MHz Intel Atom Z3745 4 x 1330 MHz, 4 W 311 MHz 778 MHz Intel Atom Z3745D 4 x 1330 MHz, 4 W 311 MHz 792 MHz Intel Atom Z3740 4 x 1330 MHz, 4 W 311 MHz 667 MHz Intel Atom Z3740D 4 x 1330 MHz, 4 W 313 MHz 688 MHz Intel Atom Z3735D 4 x 1330 MHz, 4 W 311 MHz 646 MHz Intel Atom Z3735E 4 x 1330 MHz, 4 W 311 MHz 646 MHz Intel Atom Z3735F 4 x 1330 MHz, 4 W 311 MHz 646 MHz Intel Atom Z3735G 4 x 1330 MHz, 4 W 311 MHz 646 MHz Intel Celeron J1800 2 x 2410 MHz, 10 W 688 MHz 792 MHz Intel Celeron N2840 2 x 2160 MHz, 7.5 W 313 MHz 792 MHz Intel Celeron J1750 2 x 2410 MHz, 10 W 688 MHz 750 MHz Intel Celeron N2910 4 x 1600 MHz, 7.5 W 313 MHz 756 MHz Intel Celeron N2830 2 x 2160 MHz, 7.5 W 313 MHz 750 MHz Intel Celeron N2820 2 x 2170 MHz, 7.5 W 313 MHz 756 MHz Intel Celeron N2815 2 x 1860 MHz, 7.5 W 313 MHz 756 MHz Intel Celeron N2810 2 x 2000 MHz, 7.5 W 313 MHz 756 MHz Intel Atom Z3680 2 x 1330 MHz, 4 W 311 MHz 667 MHz Intel Atom Z3680D 2 x 1330 MHz, 4 W 313 MHz 688 MHz Intel Celeron N2808 2 x 1580 MHz, 4.3 W 313 MHz 792 MHz Intel Celeron N2807 2 x 1580 MHz, 4.3 W 313 MHz 750 MHz Intel Celeron N2806 2 x 1580 MHz, 4.5 W 313 MHz 756 MHz Intel Atom E3827 2 x 1750 MHz, 8 W 542 MHz 792 MHz Intel Atom E3826 2 x 1460 MHz, 7 W 533 MHz 667 MHz Intel Celeron N2805 2 x 1460 MHz, 4.3 W 313 MHz 667 MHz Intel Atom E3825 2 x 1330 MHz, 6 W ? MHz 533 MHz Intel Atom E3815 1 x 1460 MHz, 5 W ? MHz 400 MHz min. - max. 300 - ? MHz 400 - 1900 MHz
Benchmarks Performance Rating - 3DMark 11 + Fire Strike + Time Spy - Radeon 660M
2.1 pt (6%)
...
...
max:
Performance Rating - 3DMark 11 + Fire Strike + Time Spy - HD Graphics 5500
0.3 pt (1%)
...
...
max:
Performance Rating - 3DMark 11 + Fire Strike + Time Spy - HD Graphics (Bay Trail)
0.1 pt (0%)
Intel HD Graphics (Bay Trail)
...
max:
3DMark - 3DMark Time Spy Score
min: 1153 avg: 1631 median: 1714.5 (5%) max: 1793 Points
GPU TDP ? TDP 30 W 91% 100%
289 Points (1%)
GPU TDP ? TDP 30 W 83% 100%
3DMark - 3DMark Time Spy Graphics
min: 1016 avg: 1442 median: 1544 (4%) max: 1588 Points
GPU TDP ? TDP 30 W 90% 100%
255 Points (1%)
GPU TDP ? TDP 30 W 82% 100%
3DMark - 3DMark Ice Storm Unlimited Graphics
283076 Points (29%)
min: 43391 avg: 58343 median: 58776 (6%) max: 68877 Points
min: 11835 avg: 14513 median: 14748.5 (1%) max: 17613 Points
3DMark - 3DMark Ice Storm Extreme Graphics
102211 Points (12%)
min: 27084 avg: 33172 median: 31022.5 (4%) max: 40670 Points
min: 4751 avg: 7342 median: 7498 (1%) max: 9234 Points
3DMark - 3DMark Cloud Gate Score
min: 18216 avg: 22289 median: 22811 (22%) max: 24842 Points
GPU TDP ? TDP 30 W 93% 100%
min: 3351 avg: 4777 median: 4790.5 (5%) max: 6106 Points
GPU TDP ? TDP 30 W 26% 100%
min: 354 avg: 1182 median: 1188 (1%) max: 1703 Points
GPU TDP ? TDP 30 W 16% 100%
3DMark - 3DMark Cloud Gate Graphics
min: 21857 avg: 30318 median: 31514.5 (8%) max: 33949 Points
GPU TDP ? TDP 30 W 91% 100%
min: 4571 avg: 5864 median: 5544 (1%) max: 7789 Points
GPU TDP ? TDP 30 W 25% 100%
min: 362 avg: 1230 median: 1228.5 (0%) max: 1670 Points
GPU TDP ? TDP 30 W 14% 100%
3DMark - 3DMark Fire Strike Standard Score
min: 3216 avg: 4184 median: 4472 (8%) max: 4664 Points
GPU TDP ? TDP 30 W 92% 100%
min: 500 avg: 648 median: 634.5 (1%) max: 868 Points
GPU TDP ? TDP 30 W 23% 100%
min: 83 avg: 185 median: 147 (0%) max: 495 Points
GPU TDP ? TDP 30 W 22% 100%
3DMark - 3DMark Fire Strike Standard Graphics
min: 3447 avg: 4521 median: 4848 (5%) max: 4993 Points
GPU TDP ? TDP 30 W 92% 100%
min: 535 avg: 694 median: 663 (1%) max: 927 Points
GPU TDP ? TDP 30 W 24% 100%
min: 90 avg: 149.1 median: 149 (0%) max: 200 Points
GPU TDP ? TDP 30 W 21% 100%
3DMark - 3DMark Ice Storm Graphics
min: 156497 avg: 205151 median: 195922 (22%) max: 272265 Points
min: 33288 avg: 50089 median: 48637 (5%) max: 70409 Points
min: 5056 avg: 15391 median: 16047 (2%) max: 21351 Points
3DMark - 3DMark Sling Shot (ES 3.0)
0 Points (0%)
3DMark - 3DMark Sling Shot Extreme (ES 3.1)
0 Points (0%)
3DMark 11 - 3DM11 Performance Score
min: 4904 avg: 6712 median: 7067 (9%) max: 7680 Points
GPU TDP ? TDP 30 W 89% 100%
min: 758 avg: 1088 median: 1079.5 (1%) max: 1434 Points
GPU TDP ? TDP 30 W 22% 100%
min: 143 avg: 222.6 median: 216 (0%) max: 280 Points
GPU TDP ? TDP 30 W 12% 100%
3DMark 11 - 3DM11 Performance GPU
min: 4636 avg: 6332 median: 6743 (6%) max: 7184 Points
GPU TDP ? TDP 30 W 89% 100%
min: 667 avg: 979 median: 979 (1%) max: 1265 Points
GPU TDP ? TDP 30 W 22% 100%
min: 122 avg: 192.1 median: 186.5 (0%) max: 237 Points
GPU TDP ? TDP 30 W 12% 100%
3DMark Vantage + AMD Radeon 660M 3DMark Vantage - 3DM Vant. Perf. total
min: 22854 avg: 23222 median: 23222 (7%) max: 23590 Points
3DM Vant. Perf. total + Intel HD Graphics 5500
min: 3574 avg: 4501 median: 4798 (1%) max: 5124 Points
3DM Vant. Perf. total + Intel HD Graphics (Bay Trail) min: 507 avg: 666 median: 637 (0%) max: 846 Points
3DM Vant. Perf. GPU no PhysX + AMD Radeon 660M 3DMark Vantage - 3DM Vant. Perf. GPU no PhysX
min: 20168 avg: 20571 median: 20570.5 (11%) max: 20973 Points
3DM Vant. Perf. GPU no PhysX + Intel HD Graphics 5500
min: 3057 avg: 3804 median: 3987 (2%) max: 4351 Points
3DM Vant. Perf. GPU no PhysX + Intel HD Graphics (Bay Trail) min: 395 avg: 512 median: 503 (0%) max: 667 Points
3DMark 2001SE - 3DMark 2001 - Standard
7727 Points (8%)
3DMark 03 - 3DMark 03 - Standard
min: 4226 avg: 4997 median: 5220 (3%) max: 5323 Points
3DMark 05 - 3DMark 05 - Standard
43616 Points (48%)
min: 2666 avg: 3195 median: 3331 (4%) max: 3445 Points
3DMark 06 3DMark 06 - Standard 1280x1024 + AMD Radeon 660M
min: 27171 avg: 27876 median: 27876 (36%) max: 28581 Points
3DMark 06 - Standard 1280x1024 + Intel HD Graphics 5500
min: 5458 avg: 6875 median: 6998 (9%) max: 7950 Points
3DMark 06 - Standard 1280x1024 + Intel HD Graphics (Bay Trail)
min: 814 avg: 1785 median: 1866 (2%) max: 2151 Points
3DMark 06 - Standard 1280x800 + Intel HD Graphics 5500
7725 Points (10%)
3DMark 06 - Standard 1280x800 + Intel HD Graphics (Bay Trail)
2087 Points (3%)
3DMark 06 - Score Unknown Settings + Intel HD Graphics (Bay Trail)
2108 Points (3%)
Unigine Valley 1.0 - Unigine Valley 1.0 DX
10.9 fps (3%)
Unigine Heaven 3.0 - Unigine Heaven 3.0 DX 11
9.3 fps (3%)
3.6 fps (1%)
Unigine Heaven 3.0 - Unigine Heaven 3.0 OpenGL
9.8 fps (4%)
Unigine Heaven 2.1 - Heaven 2.1 high
min: 12.4 avg: 15.5 median: 15.7 (3%) max: 17.9 fps
min: 2.4 avg: 2.8 median: 2.8 (1%) max: 3.4 fps
Blender - Blender 3.3 Classroom HIP *
min: 438 avg: 561 median: 548 (45%) max: 755 Seconds
GPU TDP ? TDP 30 W 100% 123%
SPECviewperf 11 + Intel HD Graphics 5500 SPECviewperf 11 - specvp11 snx-01
min: 1.89 avg: 2.1 median: 2 (1%) max: 2.29 fps
specvp11 tcvis-02 + Intel HD Graphics 5500 SPECviewperf 11 - specvp11 tcvis-02
min: 2.42 avg: 2.6 median: 2.6 (1%) max: 2.9 fps
specvp11 sw-02 + Intel HD Graphics 5500 SPECviewperf 11 - specvp11 sw-02
min: 11.6 avg: 13 median: 12.5 (9%) max: 14.7 fps
specvp11 proe-05 + Intel HD Graphics 5500 SPECviewperf 11 - specvp11 proe-05
min: 2.14 avg: 2.3 median: 2.3 (3%) max: 2.53 fps
specvp11 maya-03 + Intel HD Graphics 5500 SPECviewperf 11 - specvp11 maya-03
min: 8.07 avg: 13.6 median: 14.7 (11%) max: 18.15 fps
specvp11 lightwave-01 + Intel HD Graphics 5500 SPECviewperf 11 - specvp11 lightwave-01
min: 14.7 avg: 18.4 median: 18.6 (20%) max: 21.44 fps
specvp11 ensight-04 + Intel HD Graphics 5500 SPECviewperf 11 - specvp11 ensight-04
min: 1.67 avg: 2.5 median: 2.6 (1%) max: 2.88 fps
SPECviewperf 12 + AMD Radeon 660M SPECviewperf 12 - specvp12 sw-03
74.6 fps (19%)
specvp12 sw-03 + Intel HD Graphics 5500
min: 2.12 avg: 9.9 median: 12.3 (3%) max: 15.6 fps
specvp12 snx-02 + AMD Radeon 660M SPECviewperf 12 - specvp12 snx-02
42.4 fps (6%)
specvp12 snx-02 + Intel HD Graphics 5500 min: 1.37 avg: 2.3 median: 2.4 (0%) max: 2.7 fps
specvp12 showcase-01 + AMD Radeon 660M SPECviewperf 12 - specvp12 showcase-01
22.8 fps (5%)
specvp12 showcase-01 + Intel HD Graphics 5500
min: 2.63 avg: 7 median: 4.2 (1%) max: 14.14 fps
specvp12 mediacal-01 + AMD Radeon 660M SPECviewperf 12 - specvp12 mediacal-01
25.8 fps (7%)
specvp12 mediacal-01 + Intel HD Graphics 5500
min: 0.95 avg: 1.4 median: 1 (0%) max: 2.36 fps
specvp12 maya-04 + AMD Radeon 660M SPECviewperf 12 - specvp12 maya-04
44.4 fps (12%)
specvp12 maya-04 + Intel HD Graphics 5500
min: 2.49 avg: 6.3 median: 2.6 (1%) max: 12.31 fps
specvp12 energy-01 + AMD Radeon 660M SPECviewperf 12 - specvp12 energy-01
51.1 fps (46%)
specvp12 energy-01 + Intel HD Graphics 5500
min: 0.06 avg: 6.9 median: 0.1 (0%) max: 17.35 fps
specvp12 creo-01 + AMD Radeon 660M SPECviewperf 12 - specvp12 creo-01
39.3 fps (16%)
specvp12 creo-01 + Intel HD Graphics 5500
min: 2.49 avg: 5.7 median: 6.5 (3%) max: 8.99 fps
specvp12 catia-04 + AMD Radeon 660M SPECviewperf 12 - specvp12 catia-04
45 fps (7%)
specvp12 catia-04 + Intel HD Graphics 5500
min: 6.86 avg: 7.7 median: 7.1 (1%) max: 9.69 fps
specvp12 3dsmax-05 + AMD Radeon 660M SPECviewperf 12 - specvp12 3dsmax-05
55.8 fps (10%)
SPECviewperf 13 specvp13 sw-04 + AMD Radeon 660M SPECviewperf 13 - specvp13 sw-04
66.6 fps (18%)
specvp13 snx-03 + AMD Radeon 660M SPECviewperf 13 - specvp13 snx-03
72.7 fps (8%)
specvp13 showcase-02 + AMD Radeon 660M SPECviewperf 13 - specvp13 showcase-02
23.9 fps (5%)
specvp13 medical-02 + AMD Radeon 660M SPECviewperf 13 - specvp13 medical-02
24.9 fps (5%)
specvp13 maya-05 + AMD Radeon 660M SPECviewperf 13 - specvp13 maya-05
62.6 fps (7%)
specvp13 energy-02 + AMD Radeon 660M SPECviewperf 13 - specvp13 energy-02
6.2 fps (2%)
specvp13 creo-02 + AMD Radeon 660M SPECviewperf 13 - specvp13 creo-02
53.8 fps (8%)
specvp13 catia-05 + AMD Radeon 660M SPECviewperf 13 - specvp13 catia-05
56.9 fps (6%)
specvp13 3dsmax-06 + AMD Radeon 660M SPECviewperf 13 - specvp13 3dsmax-06
51.7 fps (9%)
SPECviewperf 2020 specvp2020 snx-04 4k + AMD Radeon 660M SPECviewperf 2020 - specvp2020 snx-04 4k
42.1 fps (4%)
specvp2020 medical-03 4k + AMD Radeon 660M SPECviewperf 2020 - specvp2020 medical-03 4k
5.2 fps (5%)
specvp2020 maya-06 4k + AMD Radeon 660M SPECviewperf 2020 - specvp2020 maya-06 4k
27 fps (4%)
specvp2020 energy-03 4k + AMD Radeon 660M SPECviewperf 2020 - specvp2020 energy-03 4k
4.7 fps (1%)
specvp2020 creo-03 4k + AMD Radeon 660M SPECviewperf 2020 - specvp2020 creo-03 4k
19.8 fps (9%)
specvp2020 catia-06 4k + AMD Radeon 660M SPECviewperf 2020 - specvp2020 catia-06 4k
14.2 fps (9%)
specvp2020 3dsmax-07 4k + AMD Radeon 660M SPECviewperf 2020 - specvp2020 3dsmax-07 4k
10.8 fps (5%)
Cinebench R10 Cinebench R10 Shading (32bit) + AMD Radeon 660M Cinebench R10 - Cinebench R10 Shading (32bit)
min: 12942 avg: 13243 median: 13243 (9%) max: 13544 Points
Cinebench R10 Shading (32bit) + Intel HD Graphics 5500
min: 3045 avg: 5408 median: 5270.5 (4%) max: 8571 Points
Cinebench R10 Shading (32bit) + Intel HD Graphics (Bay Trail)
min: 898 avg: 2014 median: 1991.5 (1%) max: 2889 Points
Cinebench R11.5 Cinebench R11.5 OpenGL 64 Bit + AMD Radeon 660M Cinebench R11.5 - Cinebench R11.5 OpenGL 64 Bit
114.4 fps (38%)
Cinebench R11.5 OpenGL 64 Bit + Intel HD Graphics 5500
min: 13.54 avg: 21.2 median: 20.3 (7%) max: 35.03 fps
Cinebench R11.5 OpenGL 64 Bit + Intel HD Graphics (Bay Trail)
min: 0.37 avg: 6.2 median: 6.4 (2%) max: 7.69 fps
Cinebench R15 + AMD Radeon 660M Cinebench R15 - Cinebench R15 OpenGL 64 Bit
min: 93.3 avg: 120.8 median: 121.3 (7%) max: 154.4 fps
GPU TDP ? TDP 30 W 92% 100%
Cinebench R15 OpenGL 64 Bit + Intel HD Graphics 5500
min: 16.42 avg: 26.3 median: 25.4 (1%) max: 35.04 fps
GPU TDP ? TDP 30 W 28% 100%
Cinebench R15 OpenGL 64 Bit + Intel HD Graphics (Bay Trail) min: 2.88 avg: 5 median: 5.5 (0%) max: 6.55 fps
GPU TDP ? TDP 30 W 19% 100%
Cinebench R15 OpenGL Ref. Match 64 Bit + AMD Radeon 660M Cinebench R15 - Cinebench R15 OpenGL Ref. Match 64 Bit
min: 97.9 avg: 97.9 median: 97.9 (98%) max: 98 %
GPU TDP ? TDP 30 W 100% 100%
Cinebench R15 OpenGL Ref. Match 64 Bit + Intel HD Graphics 5500
min: 98 avg: 98 median: 98 (98%) max: 99.6 %
GPU TDP ? TDP 30 W 100% 100%
Cinebench R15 OpenGL Ref. Match 64 Bit + Intel HD Graphics (Bay Trail)
min: 63 avg: 96.1 median: 97.8 (98%) max: 97.8 %
GPU TDP ? TDP 30 W 99% 100%
GFXBench - GFXBench 5.0 4K Aztec Ruins High Tier Offscreen
min: 10.6 avg: 14.7 median: 14.7 (6%) max: 18.7 fps
GPU TDP ? TDP 30 W 57% 100%
GFXBench - GFXBench 5.0 Aztec Ruins High Tier Offscreen
min: 22.9 avg: 33.5 median: 33.5 (6%) max: 44.1 fps
GPU TDP ? TDP 30 W 52% 100%
GFXBench - GFXBench 5.0 Aztec Ruins Normal Tier Offscreen
min: 63.9 avg: 86 median: 86 (6%) max: 108.1 fps
GPU TDP ? TDP 30 W 59% 100%
GFXBench - GFXBench Car Chase Offscreen
69.4 fps (8%)
GFXBench 3.1 - GFXBench Manhattan ES 3.1 Offscreen
93.3 fps (2%)
5.2 fps (0%)
GFXBench 3.0 - GFXBench 3.0 Manhattan Offscreen
104.3 fps (6%)
min: 26.9 avg: 32.4 median: 30.6 (2%) max: 44.6 fps
min: 6 avg: 9.7 median: 8.8 (1%) max: 16 fps
GFXBench (DX / GLBenchmark) 2.7 + AMD Radeon 660M GFXBench (DX / GLBenchmark) 2.7 - GFXBench T-Rex HD Offscreen C24Z16
258.5 fps (2%)
GFXBench T-Rex HD Offscreen C24Z16 + Intel HD Graphics 5500
min: 60.9 avg: 70.9 median: 70.9 (1%) max: 87.6 fps
GFXBench T-Rex HD Offscreen C24Z16 + Intel HD Graphics (Bay Trail) min: 6 avg: 15.7 median: 16 (0%) max: 20.2 fps
Basemark ES 2.0 - Basemark ES 2.0
min: 45.08 avg: 49.1 median: 49.1 (81%) max: 53.1 fps
Basemark X 1.0 - Basemark X 1.0 Off-Screen
10.1 fps (48%)
Basemark X 1.1 - Basemark X 1.1 High Quality
min: 3008 avg: 6663 median: 8456 (19%) max: 8524 Points
Basemark X 1.1 - Basemark X 1.1 Medium Quality
min: 4802 avg: 12880 median: 14509 (32%) max: 17701 Points
Basemark GPU 1.2 - Basemark GPU 1.2 Vulkan Official Medium Offscreen 1080
min: 104.6 avg: 128.2 median: 114.6 (1%) max: 178.9 fps
GPU TDP ? TDP 30 W 100% 77%
105 fps (1%)
GPU TDP ? TDP 30 W 100% 82%
Basemark GPU 1.2 - Basemark GPU 1.2 Vulkan Official High Offscreen 2160
3.6 fps (1%)
NenaMark2 - NenaMark2 Score
min: 59 avg: 59.4 median: 59.4 (88%) max: 59.7 fps
Geekbench 6.3 - Geekbench 6.3 GPU OpenCL
min: 13189 avg: 14723 median: 15012 (4%) max: 15678 Points
GPU TDP ? TDP 30 W 93% 100%
Geekbench 6.3 - Geekbench 6.3 GPU Vulkan
min: 14297 avg: 16531 median: 16743.5 (5%) max: 18338 Points
GPU TDP ? TDP 30 W 100% 96%
LuxMark v2.0 64Bit - LuxMark v2.0 Room GPU
min: 187 avg: 270 median: 270 (1%) max: 353 Samples/s
min: 128 avg: 166.7 median: 149 (1%) max: 306 Samples/s
min: 25 avg: 28.5 median: 27 (0%) max: 35 Samples/s
LuxMark v2.0 64Bit - LuxMark v2.0 Sala GPU
min: 785 avg: 822 median: 822 (1%) max: 859 Samples/s
min: 134 avg: 311.5 median: 328 (1%) max: 409 Samples/s
min: 26 avg: 29 median: 29 (0%) max: 34 Samples/s
ComputeMark v2.1 - ComputeMark v2.1 Result
min: 3416 avg: 3428 median: 3427.5 (4%) max: 3439 Points
min: 643 avg: 689 median: 695 (1%) max: 734 Points
min: 160 avg: 172.8 median: 174 (0%) max: 192 Points
PassMark PerformanceTest Mobile V1 - PerformanceTest Mobile V1 2D Graphics Tests
min: 3822 avg: 4036 median: 3866 (1%) max: 4588 Points
PassMark PerformanceTest Mobile V1 - PerformanceTest Mobile V1 3D Graphics Tests
min: 1058 avg: 1251 median: 1228 (2%) max: 1488 Points
Smartbench 2012 - Smartbench 2012 Gaming Index
min: 2679 avg: 3414 median: 3385 (74%) max: 4274 Points
Power Consumption - Furmark Stress Test Power Consumption - external Monitor *
min: 28.3 avg: 40.4 median: 40.7 (6%) max: 54.7 Watt
GPU TDP ? TDP 30 W 100% 101%
min: 27.2 avg: 27.8 median: 27.8 (4%) max: 28.3 Watt
GPU TDP ? TDP 30 W 100% 100%
Power Consumption - The Witcher 3 Power Consumption - external Monitor *
min: 24.8 avg: 37.5 median: 38.4 (5%) max: 47.3 Watt
26.5 Watt (4%)
Power Consumption - Witcher 3 Power Consumption *
min: 27.6 avg: 38.3 median: 39.7 (9%) max: 47.3 Watt
Power Consumption - Witcher 3 ultra Power Efficiency
min: 0.3575 avg: 0.4 median: 0.4 (34%) max: 0.4565 fps per Watt
Power Consumption - Witcher 3 ultra Power Efficiency - external Monitor
min: 0.3158 avg: 0.4 median: 0.4 (32%) max: 0.508 fps per Watt
Power Consumption - Cyberpunk 2077 Power Consumption 150cd *
min: 36.6 avg: 38.1 median: 38.1 (12%) max: 39.6 Watt
GPU TDP ? TDP 30 W 100% 101%
Power Consumption - Cyberpunk 2077 Power Consumption - external Monitor *
min: 35.6 avg: 38 median: 38 (5%) max: 40.4 Watt
GPU TDP ? TDP 30 W 100% 101%
Power Consumption - Cyberpunk 2077 ultra Power Efficiency
0.2 fps per Watt (28%)
Emissions Witcher 3 Fan Noise + AMD Radeon 660M Emissions - Witcher 3 Fan Noise
min: 35 avg: 38.6 median: 38 (61%) max: 48.5 dB(A)
Witcher 3 Fan Noise + Intel HD Graphics 5500
37.5 dB(A) (60%)
Clock Speed - GPU Clock Witcher 3 ultra
1900 MHz (75%)
898 MHz (35%)
Clock Speed - GPU Clock Speed Furmark
749 MHz (30%)
Average Benchmarks AMD Radeon 660M → 100% n=21 Average Benchmarks Intel HD Graphics 5500 → 28% n=21 Average Benchmarks Intel HD Graphics (Bay Trail) → 10% n=21
- Bereich der Benchmarkergebnisse für diese Grafikkarte
- Durchschnittliche Benchmarkergebnisse für diese Grafikkarte
* Smaller numbers mean a higher performance
1 This benchmark is not used for the average calculation
Spiele-Benchmarks Die folgenden Benchmarks basieren auf unseren Spieletests mit Testnotebooks. Die Performance dieser Grafikkarte bei den gelisteten Spielen ist abhängig von der verwendeten CPU, Speicherausstattung, Treiber und auch Betriebssystem. Dadurch müssen die untenstehenden Werte nicht repräsentativ sein. Detaillierte Informationen über das verwendete System sehen Sie nach einem Klick auf den fps-Wert.
100%
Radeon 660M:
49.6 [X] Acer Nitro 16 AN16-41-R7YE 1012607
AMD Ryzen 5 7535HS 3.3GHz
Radeon 660M
min:
39 fps, P1:
39 fps, max:
57 fps
fps
100%
Radeon 660M:
42.7 [X] Acer Nitro 16 AN16-41-R7YE 1012607
AMD Ryzen 5 7535HS 3.3GHz
Radeon 660M
min:
35 fps, P1:
33 fps, max:
48 fps
fps
100%
Radeon 660M:
29.2 [X] Acer Nitro 16 AN16-41-R7YE 1012607
AMD Ryzen 5 7535HS 3.3GHz
Radeon 660M
min:
25 fps, P1:
24 fps, max:
33 fps
fps
100%
Radeon 660M:
34.6 [X] Acer Nitro 16 AN16-41-R7YE AMD Ryzen 5 7535HS 3.3GHz
Radeon 660M
min:
18.8 fps, P0.1:
20.4 fps, P1:
26.1 fps, max:
42.7 fps
fps
100%
Radeon 660M:
27.6 [X] Acer Nitro 16 AN16-41-R7YE AMD Ryzen 5 7535HS 3.3GHz
Radeon 660M
min:
1.652 fps, P0.1:
1.665 fps, P1:
20.5 fps, max:
110.9 fps
fps
100%
Radeon 660M:
26 [X] Acer Nitro 16 AN16-41-R7YE AMD Ryzen 5 7535HS 3.3GHz
Radeon 660M
min:
1.564 fps, P0.1:
3.2 fps, P1:
15.7 fps, max:
180.2 fps
fps
100%
Radeon 660M:
23.9 [X] Acer Nitro 16 AN16-41-R7YE AMD Ryzen 5 7535HS 3.3GHz
Radeon 660M
min:
13.1 fps, P0.1:
13.1 fps, P1:
15.3 fps, max:
198.6 fps
fps
100%
Radeon 660M:
11.5 [X] Acer Nitro 16 AN16-41-R7YE AMD Ryzen 5 7535HS 3.3GHz
Radeon 660M
min:
8.55 fps, P0.1:
8.62 fps, P1:
8.88 fps, max:
13.2 fps
fps
100%
Radeon 660M:
10.2 [X] Acer Nitro 16 AN16-41-R7YE AMD Ryzen 5 7535HS 3.3GHz
Radeon 660M
min:
7.47 fps, P0.1:
7.48 fps, P1:
7.86 fps, max:
12.4 fps
fps
100%
Radeon 660M:
36.8 [X] Acer Nitro 16 AN16-41-R7YE AMD Ryzen 5 7535HS 3.3GHz
Radeon 660M
min:
15.6 fps, P0.1:
16.5 fps, P1:
17.8 fps, max:
240 fps
fps
100%
Radeon 660M:
30.1 [X] Acer Nitro 16 AN16-41-R7YE AMD Ryzen 5 7535HS 3.3GHz
Radeon 660M
min:
8.67 fps, P0.1:
10.7 fps, P1:
14.8 fps, max:
223 fps
fps
100%
Radeon 660M:
22.3 [X] Acer Nitro 16 AN16-41-R7YE AMD Ryzen 5 7535HS 3.3GHz
Radeon 660M
min:
10.2 fps, P0.1:
10.3 fps, P1:
10.5 fps, max:
172.5 fps
fps
100%
Radeon 660M:
14.6 [X] Acer Nitro 16 AN16-41-R7YE AMD Ryzen 5 7535HS 3.3GHz
Radeon 660M
min:
5.51 fps, P0.1:
5.73 fps, P1:
6.51 fps, max:
133.9 fps
fps
100%
Radeon 660M:
17.7 [X] Acer Nitro 16 AN16-41-R7YE AMD Ryzen 5 7535HS 3.3GHz
Radeon 660M
min:
12.9 fps, P0.1:
13.2 fps, P1:
13.3 fps, max:
24.5 fps
fps
100%
Radeon 660M:
13.2 [X] Acer Nitro 16 AN16-41-R7YE AMD Ryzen 5 7535HS 3.3GHz
Radeon 660M
min:
9.5 fps, P0.1:
9.66 fps, P1:
10.3 fps, max:
17.4 fps
fps
100%
Radeon 660M:
11.1 [X] Acer Nitro 16 AN16-41-R7YE AMD Ryzen 5 7535HS 3.3GHz
Radeon 660M
min:
9 fps, P0.1:
9.03 fps, P1:
9.19 fps, max:
14.1 fps
fps
100%
Radeon 660M:
20.1 [X] Acer Nitro 16 AN16-41-R7YE AMD Ryzen 5 7535HS 3.3GHz
Radeon 660M
min:
11.3 fps, P0.1:
12.6 fps, P1:
15.7 fps, max:
32.2 fps
fps
100%
Radeon 660M:
14.7 [X] Acer Nitro 16 AN16-41-R7YE AMD Ryzen 5 7535HS 3.3GHz
Radeon 660M
min:
1.582 fps, P0.1:
2.84 fps, P1:
11.3 fps, max:
22.6 fps
fps
Radeon 660M:
0 (!) [X] Acer Nitro 16 AN16-41-R7YE AMD Ryzen 5 7535HS 3.3GHz
Radeon 660M
fps
100%
Radeon 660M:
23.7 [X] Acer Nitro 16 AN16-41-R7YE AMD Ryzen 5 7535HS 3.3GHz
Radeon 660M
P0.1:
17.9 fpsP1:
19.8 fps
fps
100%
Radeon 660M:
22 [X] Acer Nitro 16 AN16-41-R7YE AMD Ryzen 5 7535HS 3.3GHz
Radeon 660M
P0.1:
15.5 fpsP1:
17.8 fps
fps
100%
Radeon 660M:
15.9 [X] Acer Nitro 16 AN16-41-R7YE AMD Ryzen 5 7535HS 3.3GHz
Radeon 660M
P0.1:
9.6 fpsP1:
12.7 fps
fps
100%
Radeon 660M:
24.7 [X] Acer Nitro 16 AN16-41-R7YE AMD Ryzen 5 7535HS 3.3GHz
Radeon 660M
min:
18.4 fps, P0.1:
19.5 fps, P1:
20.6 fps, max:
35.6 fps
fps
100%
Radeon 660M:
16.7 [X] Acer Nitro 16 AN16-41-R7YE AMD Ryzen 5 7535HS 3.3GHz
Radeon 660M
min:
12.9 fps, P0.1:
13.2 fps, P1:
13.8 fps, max:
24.9 fps
fps
100%
Radeon 660M:
15.3 [X] Acer Nitro 16 AN16-41-R7YE AMD Ryzen 5 7535HS 3.3GHz
Radeon 660M
min:
11.4 fps, P0.1:
11.5 fps, P1:
12.1 fps, max:
22.5 fps
fps
100%
Radeon 660M:
14.8 [X] Acer Nitro 16 AN16-41-R7YE AMD Ryzen 5 7535HS 3.3GHz
Radeon 660M
min:
2.59 fps, P0.1:
5.13 fps, P1:
12.3 fps, max:
51.6 fps
fps
100%
Radeon 660M:
29 [X] Acer Nitro 16 AN16-41-R7YE AMD Ryzen 5 7535HS 3.3GHz
Radeon 660M
min:
22.6 fps, P0.1:
23.4 fps, P1:
24.1 fps, max:
35.9 fps
fps
100%
Radeon 660M:
22.9 [X] Acer Nitro 16 AN16-41-R7YE AMD Ryzen 5 7535HS 3.3GHz
Radeon 660M
min:
18.7 fps, P0.1:
19.7 fps, P1:
20.6 fps, max:
26.7 fps
fps
100%
Radeon 660M:
13 [X] Acer Nitro 16 AN16-41-R7YE AMD Ryzen 5 7535HS 3.3GHz
Radeon 660M
min:
11.1 fps, P0.1:
11.2 fps, P1:
11.7 fps, max:
14.9 fps
fps
100%
Radeon 660M:
10.2 [X] Acer Nitro 16 AN16-41-R7YE AMD Ryzen 5 7535HS 3.3GHz
Radeon 660M
min:
9.18 fps, P0.1:
9.2 fps, P1:
9.3 fps, max:
11.5 fps
fps
100%
Radeon 660M:
16 [X] Acer Nitro 16 AN16-41-R7YE AMD Ryzen 5 7535HS 3.3GHz
Radeon 660M
min:
8 fps, max:
58 fps
fps
100%
Radeon 660M:
15 [X] Acer Nitro 16 AN16-41-R7YE AMD Ryzen 5 7535HS 3.3GHz
Radeon 660M
min:
7 fps, max:
25 fps
fps
100%
Radeon 660M:
13 [X] Acer Nitro 16 AN16-41-R7YE AMD Ryzen 5 7535HS 3.3GHz
Radeon 660M
min:
4 fps, max:
23 fps
fps
100%
Radeon 660M:
23.3 [X] Acer Nitro 16 AN16-41-R7YE AMD Ryzen 5 7535HS 3.3GHz
Radeon 660M
min:
16.2 fps, P0.1:
17.4 fps, P1:
19.4 fps, max:
35.7 fps
fps
100%
Radeon 660M:
17.2 [X] Acer Nitro 16 AN16-41-R7YE AMD Ryzen 5 7535HS 3.3GHz
Radeon 660M
min:
11.5 fps, P0.1:
11.8 fps, P1:
14 fps, max:
26.1 fps
fps
100%
Radeon 660M:
12.8 [X] Acer Nitro 16 AN16-41-R7YE AMD Ryzen 5 7535HS 3.3GHz
Radeon 660M
min:
9.14 fps, P0.1:
9.27 fps, P1:
9.98 fps, max:
16.3 fps
fps
100%
Radeon 660M:
10.3 [X] Acer Nitro 16 AN16-41-R7YE AMD Ryzen 5 7535HS 3.3GHz
Radeon 660M
min:
7.79 fps, P0.1:
7.81 fps, P1:
8.12 fps, max:
13.6 fps
fps
100%
Radeon 660M:
31.8 [X] Acer Nitro 16 AN16-41-R7YE AMD Ryzen 5 7535HS 3.3GHz
Radeon 660M
min:
10.8 fps, P0.1:
17.1 fps, P1:
25 fps, max:
157.4 fps
fps
100%
Radeon 660M:
25.3 [X] Acer Nitro 16 AN16-41-R7YE AMD Ryzen 5 7535HS 3.3GHz
Radeon 660M
min:
11 fps, P0.1:
17.7 fps, P1:
20.4 fps, max:
100.5 fps
fps
100%
Radeon 660M:
10.1 [X] Acer Nitro 16 AN16-41-R7YE AMD Ryzen 5 7535HS 3.3GHz
Radeon 660M
min:
7.03 fps, P0.1:
8.25 fps, P1:
8.95 fps, max:
12.4 fps
fps
100%
Radeon 660M:
37.8 [X] Acer Nitro 16 AN16-41-R7YE AMD Ryzen 5 7535HS 3.3GHz
Radeon 660M
min:
15.2 fps, P0.1:
16.4 fps, P1:
17.7 fps, max:
245 fps
fps
100%
Radeon 660M:
23.3 [X] Acer Nitro 16 AN16-41-R7YE AMD Ryzen 5 7535HS 3.3GHz
Radeon 660M
min:
8.8 fps, P0.1:
9.08 fps, P1:
10.6 fps, max:
177.2 fps
fps
100%
Radeon 660M:
19.2 [X] Acer Nitro 16 AN16-41-R7YE AMD Ryzen 5 7535HS 3.3GHz
Radeon 660M
min:
7.92 fps, P0.1:
8.59 fps, P1:
9.66 fps, max:
139.8 fps
fps
100%
Radeon 660M:
14.5 [X] Acer Nitro 16 AN16-41-R7YE AMD Ryzen 5 7535HS 3.3GHz
Radeon 660M
min:
5.64 fps, P0.1:
5.88 fps, P1:
6.83 fps, max:
133.7 fps
fps
100%
Radeon 660M:
26.7 [X] Acer Nitro 16 AN16-41-R7YE AMD Ryzen 5 7535HS 3.3GHz
Radeon 660M
fps
100%
Radeon 660M:
18.5 [X] Acer Nitro 16 AN16-41-R7YE AMD Ryzen 5 7535HS 3.3GHz
Radeon 660M
fps
100%
Radeon 660M:
17.9 [X] Acer Nitro 16 AN16-41-R7YE AMD Ryzen 5 7535HS 3.3GHz
Radeon 660M
fps
100%
Radeon 660M:
10.3 [X] Acer Nitro 16 AN16-41-R7YE AMD Ryzen 5 7535HS 3.3GHz
Radeon 660M
fps
100%
Radeon 660M:
29.3 [X] Acer Nitro 16 AN16-41-R7YE AMD Ryzen 5 7535HS 3.3GHz
Radeon 660M
min:
14.7 fps, P0.1:
21.9 fps, P1:
23.4 fps, max:
88 fps
fps
100%
Radeon 660M:
24.1 [X] Acer Nitro 16 AN16-41-R7YE AMD Ryzen 5 7535HS 3.3GHz
Radeon 660M
min:
17.6 fps, P0.1:
18.2 fps, P1:
20.5 fps, max:
31.4 fps
fps
100%
Radeon 660M:
18.6 [X] Acer Nitro 16 AN16-41-R7YE AMD Ryzen 5 7535HS 3.3GHz
Radeon 660M
min:
4.49 fps, P0.1:
5.08 fps, P1:
15 fps, max:
52.3 fps
fps
100%
Radeon 660M:
17.6 [X] Acer Nitro 16 AN16-41-R7YE AMD Ryzen 5 7535HS 3.3GHz
Radeon 660M
min:
10.2 fps, P0.1:
11.8 fps, P1:
13.7 fps, max:
41.5 fps
fps
100%
Radeon 660M:
27.3 [X] Acer Nitro 16 AN16-41-R7YE AMD Ryzen 5 7535HS 3.3GHz
Radeon 660M
min:
22.2 fps, P0.1:
22.3 fps, P1:
23.5 fps, max:
41.2 fps
fps
100%
Radeon 660M:
22.6 [X] Acer Nitro 16 AN16-41-R7YE AMD Ryzen 5 7535HS 3.3GHz
Radeon 660M
min:
18.4 fps, P0.1:
18.7 fps, P1:
19.7 fps, max:
26.2 fps
fps
100%
Radeon 660M:
20.2 [X] Acer Nitro 16 AN16-41-R7YE AMD Ryzen 5 7535HS 3.3GHz
Radeon 660M
min:
16.5 fps, P0.1:
16.6 fps, P1:
17.6 fps, max:
35.5 fps
fps
100%
Radeon 660M:
25 28 [X] Acer Nitro 16 AN16-41-R7YE AMD Ryzen 5 7535HS 3.3GHz
Radeon 660M
min:
17 fps
~ 27 fps
100%
Radeon 660M:
21 26 [X] Acer Nitro 16 AN16-41-R7YE AMD Ryzen 5 7535HS 3.3GHz
Radeon 660M
min:
16 fps
~ 24 fps
100%
Radeon 660M:
15 19 [X] Acer Nitro 16 AN16-41-R7YE AMD Ryzen 5 7535HS 3.3GHz
Radeon 660M
min:
9 fps
~ 17 fps
100%
Radeon 660M:
14 17 [X] Acer Nitro 16 AN16-41-R7YE AMD Ryzen 5 7535HS 3.3GHz
Radeon 660M
min:
8 fps
~ 16 fps
100%
Radeon 660M:
12.3 fps
100%
Radeon 660M:
11.4 fps
100%
Radeon 660M:
24.5 fps
100%
Radeon 660M:
14.4 fps
100%
Radeon 660M:
5.1 5.9 8.4 [X] GMK NucBox M6 959964
AMD Ryzen 5 6600H 3.3GHz
Radeon 660M
min:
6 fps, P1:
6 fps, max:
10 fps
~ 6 fps
100%
Radeon 660M:
22.4 fps
100%
Radeon 660M:
23.9 fps
100%
Radeon 660M:
20.3 [X] Acer Nitro 16 AN16-41-R7YE AMD Ryzen 5 7535HS 3.3GHz
Radeon 660M
min:
15.7 fps, max:
25.5 fps
27 ~ 24 fps
100%
Radeon 660M:
15 [X] Acer Nitro 16 AN16-41-R7YE AMD Ryzen 5 7535HS 3.3GHz
Radeon 660M
min:
10.9 fps, max:
19.5 fps
24 ~ 20 fps
100%
Radeon 660M:
12.2 [X] Acer Nitro 16 AN16-41-R7YE AMD Ryzen 5 7535HS 3.3GHz
Radeon 660M
min:
9.4 fps, max:
16.3 fps
15 ~ 14 fps
100%
Radeon 660M:
49.6 71 ~ 60 fps
100%
Radeon 660M:
19.5 fps
100%
Radeon 660M:
39.6 fps
100%
Radeon 660M:
29.9 fps
100%
Radeon 660M:
26.9 fps
100%
Radeon 660M:
19.7 fps
100%
Radeon 660M:
15.4 fps
100%
Radeon 660M:
12.4 fps
100%
Radeon 660M:
10.8 fps
100%
Radeon 660M:
39.6 fps
100%
Radeon 660M:
20.3 fps
100%
Radeon 660M:
17.1 fps
100%
Radeon 660M:
57.1 fps
100%
Radeon 660M:
38.9 fps
100%
Radeon 660M:
104.3 fps
100%
Radeon 660M:
40.4 fps
100%
Radeon 660M:
34.3 fps
100%
Radeon 660M:
50 58.5 ~ 54 fps
100%
Radeon 660M:
21 25.6 ~ 23 fps
100%
Radeon 660M:
18 21.8 ~ 20 fps
100%
Radeon 660M:
18.3 fps
100%
Radeon 660M:
53.6 fps
100%
Radeon 660M:
32.7 fps
100%
Radeon 660M:
26.4 fps
100%
Radeon 660M:
45.5 fps
100%
Radeon 660M:
23.3 fps
100%
Radeon 660M:
18.1 fps
100%
Radeon 660M:
35.2 36 ~ 36 fps
100%
Radeon 660M:
25.3 fps
100%
Radeon 660M:
22.2 fps
100%
Radeon 660M:
38.9 fps
100%
Radeon 660M:
75.3 fps
100%
Radeon 660M:
33.4 fps
100%
Radeon 660M:
29.9 fps
100%
Radeon 660M:
35.3 fps
100%
Radeon 660M:
30.4 fps
100%
Radeon 660M:
27.9 fps
100%
Radeon 660M:
91.1 fps
100%
Radeon 660M:
34.5 fps
100%
Radeon 660M:
30.5 fps
100%
Radeon 660M:
64.7 fps
100%
Radeon 660M:
21.2 fps
100%
Radeon 660M:
21.1 fps
100%
Radeon 660M:
68.6 fps
100%
Radeon 660M:
24.2 fps
100%
Radeon 660M:
17.8 fps
100%
Radeon 660M:
170.4 fps
100%
Radeon 660M:
66.6 fps
100%
Radeon 660M:
57.4 fps
100%
Radeon 660M:
48.2 fps
100%
Radeon 660M:
20.7 fps
100%
Radeon 660M:
19.1 fps
100%
Radeon 660M:
29.2 fps
100%
Radeon 660M:
24.1 fps
100%
Radeon 660M:
88.1 fps
100%
Radeon 660M:
39.2 fps
100%
Radeon 660M:
10.9 fps
100%
Radeon 660M:
41.6 [X] Acer Nitro 16 AN16-41-R7YE AMD Ryzen 5 7535HS 3.3GHz
Radeon 660M
min:
28.9 fps, P0.1:
31.4 fps, P1:
34.9 fps, max:
62.1 fps
fps
100%
Radeon 660M:
14.2 [X] Acer Nitro 16 AN16-41-R7YE AMD Ryzen 5 7535HS 3.3GHz
Radeon 660M
min:
12.1 fps, P0.1:
12.5 fps, P1:
12.9 fps, max:
16.5 fps
fps
100%
Radeon 660M:
10.4 [X] Acer Nitro 16 AN16-41-R7YE AMD Ryzen 5 7535HS 3.3GHz
Radeon 660M
min:
8.82 fps, P0.1:
8.87 fps, P1:
9.15 fps, max:
12.9 fps
fps
100%
Radeon 660M:
58.1 fps
100%
Radeon 660M:
30.6 fps
100%
Radeon 660M:
29.1 fps
100%
Radeon 660M:
102.1 fps
100%
Radeon 660M:
44.6 fps
100%
Radeon 660M:
32.3 fps
100%
Radeon 660M:
22.2 fps
100%
Radeon 660M:
47.4 fps
100%
Radeon 660M:
28.5 fps
100%
Radeon 660M:
86.9 fps
100%
Radeon 660M:
36.2 fps
100%
Radeon 660M:
34.2 fps
100%
Radeon 660M:
70.8 fps
13%
HD Graphics 5500:
9.4 [X] Asus F555LF-XO029H Intel Core i5-5200U 2.2GHz
HD Graphics 5500
fps
100%
Radeon 660M:
24.2 fps
100%
Radeon 660M:
19.2 fps
HD Graphics 5500:
12.8 [X] Asus F555LF-XO029H Intel Core i5-5200U 2.2GHz
HD Graphics 5500
fps
HD Graphics 5500:
29.3 fps
HD Graphics 5500:
6.1 [X] Asus F555LF-XO029H Intel Core i5-5200U 2.2GHz
HD Graphics 5500
fps
HD Graphics 5500:
10.1 [X] Asus F555LF-XO029H Intel Core i5-5200U 2.2GHz
HD Graphics 5500
fps
HD Graphics 5500:
41.4 [X] Asus F555LF-XO029H Intel Core i5-5200U 2.2GHz
HD Graphics 5500
fps
28%
HD Graphics 5500:
13.9 [X] Asus F555LF-XO029H Intel Core i5-5200U 2.2GHz
HD Graphics 5500
fps
100%
Radeon 660M:
20.5 fps
100%
Radeon 660M:
13.6 fps
100%
Radeon 660M:
10.7 fps
HD Graphics 5500:
12.1 [X] Asus F555LF-XO029H Intel Core i5-5200U 2.2GHz
HD Graphics 5500
fps
HD Graphics 5500:
21.4 21.5 [X] Asus F555LF-XO029H Intel Core i5-5200U 2.2GHz
HD Graphics 5500
~ 21 fps
HD Graphics 5500:
15.5 [X] Asus F555LF-XO029H Intel Core i5-5200U 2.2GHz
HD Graphics 5500
min:
13 fps, max:
17 fps
18.3 ~ 17 fps
HD Graphics 5500:
14.9 [X] Asus F555LF-XO029H Intel Core i5-5200U 2.2GHz
HD Graphics 5500
fps
HD Graphics 5500:
15 [X] Asus F555LF-XO029H Intel Core i5-5200U 2.2GHz
HD Graphics 5500
fps
HD Graphics 5500:
29.5 [X] Asus F555LF-XO029H Intel Core i5-5200U 2.2GHz
HD Graphics 5500
fps
HD Graphics 5500:
6 [X] Asus F555LF-XO029H Intel Core i5-5200U 2.2GHz
HD Graphics 5500
fps
16%
HD Graphics 5500:
9 [X] Asus F555LF-XO029H Intel Core i5-5200U 2.2GHz
HD Graphics 5500
fps
10%
HD Graphics 5500:
5 [X] Asus F555LF-XO029H Intel Core i5-5200U 2.2GHz
HD Graphics 5500
fps
100%
Radeon 660M:
18.8 fps
100%
Radeon 660M:
14.4 fps
100%
Radeon 660M:
11.2 fps
HD Graphics 5500:
19.8 [X] Asus F555LF-XO029H Intel Core i5-5200U 2.2GHz
HD Graphics 5500
fps
HD Graphics 5500:
11.1 [X] Asus F555LF-XO029H Intel Core i5-5200U 2.2GHz
HD Graphics 5500
fps
HD Graphics 5500:
20 [X] Asus F555LF-XO029H Intel Core i5-5200U 2.2GHz
HD Graphics 5500
fps
HD Graphics 5500:
17.1 [X] Asus F555LF-XO029H Intel Core i5-5200U 2.2GHz
HD Graphics 5500
fps
HD Graphics 5500:
44.6 [X] Asus F555LF-XO029H Intel Core i5-5200U 2.2GHz
HD Graphics 5500
fps
HD Graphics 5500:
12.2 [X] Asus F555LF-XO029H Intel Core i5-5200U 2.2GHz
HD Graphics 5500
fps
HD Graphics 5500:
9.5 [X] Asus F555LF-XO029H Intel Core i5-5200U 2.2GHz
HD Graphics 5500
fps
HD Graphics 5500:
13.4 [X] Asus F555LF-XO029H Intel Core i5-5200U 2.2GHz
HD Graphics 5500
fps
HD Graphics 5500:
0 (!) [X] Asus F555LF-XO029H Intel Core i5-5200U 2.2GHz
HD Graphics 5500
fps
HD Graphics 5500:
7 [X] Asus F555LF-XO029H Intel Core i5-5200U 2.2GHz
HD Graphics 5500
fps
HD Graphics 5500:
42.9 (!) [X] Asus F555LF-XO029H Intel Core i5-5200U 2.2GHz
HD Graphics 5500
fps
100%
Radeon 660M:
69.3 77 ~ 73 fps
14%
HD Graphics 5500:
10 [X] Asus F555LF-XO029H Intel Core i5-5200U 2.2GHz
HD Graphics 5500
fps
100%
Radeon 660M:
22.2 29 ~ 26 fps
100%
Radeon 660M:
17.3 27 ~ 22 fps
100%
Radeon 660M:
13.4 23 ~ 18 fps
0%
HD Graphics 5500:
0 (!) [X] HP 250 G5 i3-5005U MX500 Intel Core i3-5005U 2GHz
HD Graphics 5500
fps
HD Graphics 5500:
19 [X] Asus F555LF-XO029H Intel Core i5-5200U 2.2GHz
HD Graphics 5500
fps
HD Graphics 5500:
8.9 [X] Asus F555LF-XO029H Intel Core i5-5200U 2.2GHz
HD Graphics 5500
fps
HD Graphics 5500:
14.3 [X] Asus F555LF-XO029H Intel Core i5-5200U 2.2GHz
HD Graphics 5500
fps
19%
HD Graphics 5500:
11 [X] Asus F555LF-XO029H Intel Core i5-5200U 2.2GHz
HD Graphics 5500
fps
HD Graphics 5500:
131.8 [X] Asus F555LF-XO029H Intel Core i5-5200U 2.2GHz
HD Graphics 5500
fps
HD Graphics 5500:
14.8 [X] Asus F555LF-XO029H Intel Core i5-5200U 2.2GHz
HD Graphics 5500
fps
36%
HD Graphics 5500:
14 [X] HP 250 G5 i3-5005U MX500 Intel Core i3-5005U 2GHz
HD Graphics 5500
17.1 18 [X] Asus F555LF-XO029H Intel Core i5-5200U 2.2GHz
HD Graphics 5500
~ 16 fps
34%
HD Graphics 5500:
9.3 [X] HP 250 G5 i3-5005U MX500 Intel Core i3-5005U 2GHz
HD Graphics 5500
11.8 ~ 11 fps
32%
HD Graphics 5500:
8.2 [X] HP 250 G5 i3-5005U MX500 Intel Core i3-5005U 2GHz
HD Graphics 5500
10.5 ~ 9 fps
HD Graphics 5500:
12.1 [X] Asus F555LF-XO029H Intel Core i5-5200U 2.2GHz
HD Graphics 5500
fps
27%
HD Graphics 5500:
6.9 [X] HP 250 G5 i3-5005U MX500 1.3
Intel Core i3-5005U 2GHz
HD Graphics 5500
16.1 [X] Asus F555LF-XO029H Intel Core i5-5200U 2.2GHz
HD Graphics 5500
~ 12 fps
HD Graphics 5500:
72.6 [X] Asus F555LF-XO029H Intel Core i5-5200U 2.2GHz
HD Graphics 5500
fps
HD Graphics 5500:
15.5 [X] Asus F555LF-XO029H Intel Core i5-5200U 2.2GHz
HD Graphics 5500
fps
HD Graphics 5500:
23.6 [X] Asus F555LF-XO029H Intel Core i5-5200U 2.2GHz
HD Graphics 5500
fps
HD Graphics 5500:
6 [X] Asus F555LF-XO029H Intel Core i5-5200U 2.2GHz
HD Graphics 5500
fps
HD Graphics 5500:
11.2 [X] Asus F555LF-XO029H Intel Core i5-5200U 2.2GHz
HD Graphics 5500
fps
HD Graphics 5500:
9.8 [X] Asus F555LF-XO029H Intel Core i5-5200U 2.2GHz
HD Graphics 5500
fps
HD Graphics 5500:
14 [X] Asus F555LF-XO029H Intel Core i5-5200U 2.2GHz
HD Graphics 5500
fps
HD Graphics 5500:
56.1 [X] Asus F555LF-XO029H Intel Core i5-5200U 2.2GHz
HD Graphics 5500
fps
HD Graphics 5500:
10.9 [X] Asus F555LF-XO029H Intel Core i5-5200U 2.2GHz
HD Graphics 5500
fps
HD Graphics 5500:
23 [X] Asus F555LF-XO029H Intel Core i5-5200U 2.2GHz
HD Graphics 5500
fps
HD Graphics (Bay Trail):
26.7 [X] Intel NUC Kit DN2820FYKH Intel Celeron N2820 2.2GHz
HD Graphics (Bay Trail)
min:
23 fps
fps
HD Graphics (Bay Trail):
23.4 [X] Intel NUC Kit DN2820FYKH Intel Celeron N2820 2.2GHz
HD Graphics (Bay Trail)
min:
21 fps
fps
HD Graphics 5500:
36.4 (!) [X] Intel NUC5i3RYK Intel Core i3-5010U 2.1GHz
HD Graphics 5500
min:
31 fps
fps
HD Graphics 5500:
14 (!) [X] Intel NUC5i3RYK Intel Core i3-5010U 2.1GHz
HD Graphics 5500
min:
13 fps
fps
HD Graphics 5500:
34.2 fps
HD Graphics (Bay Trail):
6 [X] Intel NUC Kit DN2820FYKH Intel Celeron N2820 2.2GHz
HD Graphics (Bay Trail)
fps
HD Graphics 5500:
63.7 fps
HD Graphics (Bay Trail):
12.6 [X] Intel NUC Kit DN2820FYKH Intel Celeron N2820 2.2GHz
HD Graphics (Bay Trail)
min:
7 fps, max:
15 fps
fps
HD Graphics 5500:
21.7 [X] Asus F555LF-XO029H Intel Core i5-5200U 2.2GHz
HD Graphics 5500
fps
HD Graphics 5500:
11.2 [X] Asus F555LF-XO029H Intel Core i5-5200U 2.2GHz
HD Graphics 5500
fps
HD Graphics 5500:
25 [X] Asus F555LF-XO029H Intel Core i5-5200U 2.2GHz
HD Graphics 5500
fps
HD Graphics 5500:
30.8 [X] Asus F555LF-XO029H Intel Core i5-5200U 2.2GHz
HD Graphics 5500
fps
HD Graphics 5500:
21.6 [X] Asus F555LF-XO029H Intel Core i5-5200U 2.2GHz
HD Graphics 5500
fps
HD Graphics 5500:
60.7 fps
HD Graphics 5500:
20.7 [X] Asus F555LF-XO029H Intel Core i5-5200U 2.2GHz
HD Graphics 5500
fps
HD Graphics 5500:
13.3 [X] Asus F555LF-XO029H Intel Core i5-5200U 2.2GHz
HD Graphics 5500
fps
HD Graphics 5500:
21.5 fps
HD Graphics 5500:
12.6 fps
HD Graphics 5500:
31.6 fps
HD Graphics 5500:
0 (!) [X] Intel NUC5i3RYK Intel Core i3-5010U 2.1GHz
HD Graphics 5500
18.4 [X] Asus F555LF-XO029H Intel Core i5-5200U 2.2GHz
HD Graphics 5500
~ 9 fps
HD Graphics 5500:
14.7 [X] Asus F555LF-XO029H Intel Core i5-5200U 2.2GHz
HD Graphics 5500
fps
HD Graphics 5500:
11.4 fps
HD Graphics 5500:
24.6 27 ~ 26 fps
HD Graphics 5500:
16.3 fps
HD Graphics 5500:
14.4 fps
HD Graphics 5500:
16.4 [X] Intel NUC Kit NUC5i3RYH Intel Core i3-5010U 2.1GHz
HD Graphics 5500
min:
9 fps
fps
HD Graphics 5500:
9.7 [X] Intel NUC Kit NUC5i3RYH Intel Core i3-5010U 2.1GHz
HD Graphics 5500
min:
6 fps
fps
HD Graphics 5500:
0 (!) [X] Intel NUC Kit NUC5i3RYH Intel Core i3-5010U 2.1GHz
HD Graphics 5500
fps
HD Graphics 5500:
25.1 [X] Intel NUC Kit NUC5i3RYH Intel Core i3-5010U 2.1GHz
HD Graphics 5500
min:
22 fps
fps
HD Graphics (Bay Trail):
0 (!) [X] Intel NUC Kit DN2820FYKH Intel Celeron N2820 2.2GHz
HD Graphics (Bay Trail)
fps
HD Graphics 5500:
15.1 [X] Intel NUC Kit NUC5i3RYH Intel Core i3-5010U 2.1GHz
HD Graphics 5500
min:
13 fps
fps
HD Graphics 5500:
7.3 [X] Intel NUC Kit NUC5i3RYH Intel Core i3-5010U 2.1GHz
HD Graphics 5500
min:
5 fps
fps
HD Graphics 5500:
8.3 [X] Intel NUC Kit NUC5i3RYH Intel Core i3-5010U 2.1GHz
HD Graphics 5500
min:
7 fps
fps
HD Graphics 5500:
5 [X] Intel NUC Kit NUC5i3RYH Intel Core i3-5010U 2.1GHz
HD Graphics 5500
min:
1 fps
fps
HD Graphics 5500:
2.8 [X] Intel NUC Kit NUC5i3RYH Intel Core i3-5010U 2.1GHz
HD Graphics 5500
min:
1 fps
fps
HD Graphics 5500:
42.4 55.9 [X] Intel NUC Kit NUC5i3RYH Intel Core i3-5010U 2.1GHz
HD Graphics 5500
min:
50 fps
~ 49 fps
HD Graphics 5500:
33.8 35.7 [X] Intel NUC Kit NUC5i3RYH Intel Core i3-5010U 2.1GHz
HD Graphics 5500
min:
31 fps
~ 35 fps
HD Graphics 5500:
17.2 18.1 [X] Intel NUC Kit NUC5i3RYH Intel Core i3-5010U 2.1GHz
HD Graphics 5500
min:
7 fps
~ 18 fps
HD Graphics 5500:
48.6 49.6 [X] Intel NUC5i3RYK 0.5.0.0
Intel Core i3-5010U 2.1GHz
HD Graphics 5500
min:
28 fps, max:
66 fps
~ 49 fps
HD Graphics (Bay Trail):
12.1 [X] Intel NUC Kit DN2820FYKH Intel Celeron N2820 2.2GHz
HD Graphics (Bay Trail)
min:
5 fps, max:
18 fps
fps
HD Graphics 5500:
17.9 fps
HD Graphics 5500:
13 13.2 [X] Intel NUC5i3RYK 0.5.0.0
Intel Core i3-5010U 2.1GHz
HD Graphics 5500
min:
8 fps, max:
22 fps
~ 13 fps
HD Graphics 5500:
27.8 33.5 37.1 [X] Intel NUC Kit NUC5i3RYH Intel Core i3-5010U 2.1GHz
HD Graphics 5500
min:
33 fps
~ 33 fps
HD Graphics (Bay Trail):
10.8 [X] Intel NUC Kit DN2820FYKH Intel Celeron N2820 2.2GHz
HD Graphics (Bay Trail)
min:
10 fps, max:
12 fps
fps
HD Graphics 5500:
18.9 21.1 25.4 [X] Intel NUC Kit NUC5i3RYH Intel Core i3-5010U 2.1GHz
HD Graphics 5500
min:
23 fps
~ 22 fps
HD Graphics 5500:
8.7 9.4 [X] Intel NUC Kit NUC5i3RYH Intel Core i3-5010U 2.1GHz
HD Graphics 5500
min:
8 fps
~ 9 fps
HD Graphics 5500:
16.2 18 [X] Intel NUC Kit NUC5i3RYH Intel Core i3-5010U 2.1GHz
HD Graphics 5500
min:
15 fps
~ 17 fps
HD Graphics 5500:
7.9 8.3 [X] Intel NUC Kit NUC5i3RYH Intel Core i3-5010U 2.1GHz
HD Graphics 5500
min:
7 fps
~ 8 fps
HD Graphics 5500:
7.4 [X] Intel NUC Kit NUC5i3RYH Intel Core i3-5010U 2.1GHz
HD Graphics 5500
min:
6 fps
fps
55%
HD Graphics 5500:
52 [X] HP 250 G5 i3-5005U MX500 Intel Core i3-5005U 2GHz
HD Graphics 5500
min:
47 fps, max:
-1 fps
74 ~ 63 fps
21%
HD Graphics (Bay Trail):
24.7 [X] Intel NUC Kit DN2820FYKH Intel Celeron N2820 2.2GHz
HD Graphics (Bay Trail)
min:
22.2 fps
fps
37%
HD Graphics 5500:
29.9 [X] HP 250 G5 i3-5005U MX500 Intel Core i3-5005U 2GHz
HD Graphics 5500
min:
27.3 fps, max:
-1 fps
37.6 ~ 34 fps
11%
HD Graphics (Bay Trail):
9.7 [X] Intel NUC Kit DN2820FYKH Intel Celeron N2820 2.2GHz
HD Graphics (Bay Trail)
min:
8.8 fps
fps
25%
HD Graphics 5500:
13 [X] HP 250 G5 i3-5005U MX500 Intel Core i3-5005U 2GHz
HD Graphics 5500
min:
12.3 fps, max:
-1 fps
15.7 ~ 14 fps
10%
HD Graphics (Bay Trail):
5.5 [X] Intel NUC Kit DN2820FYKH Intel Celeron N2820 2.2GHz
HD Graphics (Bay Trail)
min:
-1.4 fps
fps
27%
HD Graphics 5500:
11.9 [X] HP 250 G5 i3-5005U MX500 Intel Core i3-5005U 2GHz
HD Graphics 5500
min:
11.3 fps, max:
-1 fps
13.4 13.9 ~ 13 fps
11%
HD Graphics (Bay Trail):
5.4 [X] Intel NUC Kit DN2820FYKH Intel Celeron N2820 2.2GHz
HD Graphics (Bay Trail)
min:
-3 fps
fps
HD Graphics 5500:
11 [X] Intel NUC Kit NUC5i3RYH Intel Core i3-5010U 2.1GHz
HD Graphics 5500
min:
8 fps
12 ~ 12 fps
HD Graphics 5500:
9 [X] Intel NUC Kit NUC5i3RYH Intel Core i3-5010U 2.1GHz
HD Graphics 5500
min:
7 fps
10 ~ 10 fps
15%
HD Graphics 5500:
11.4 [X] Intel NUC Kit NUC5i3RYH 1.07
Intel Core i3-5010U 2.1GHz
HD Graphics 5500
min:
7 fps, max:
16 fps
13.6 ~ 13 fps
18%
HD Graphics 5500:
8.6 fps
16%
HD Graphics 5500:
3.9 fps
13%
HD Graphics 5500:
1.9 fps
HD Graphics 5500:
58.1 63.8 66.1 69.6 80.4 [X] Intel NUC Kit NUC5i3RYH Intel Core i3-5010U 2.1GHz
HD Graphics 5500
min:
67 fps
88 99 ~ 75 fps
HD Graphics (Bay Trail):
22 [X] Intel NUC Kit DN2820FYKH Intel Celeron N2820 2.2GHz
HD Graphics (Bay Trail)
min:
16 fps, max:
33 fps
24.2 ~ 23 fps
HD Graphics (Bay Trail):
0 (!) [X] Intel NUC Kit DN2820FYKH Intel Celeron N2820 2.2GHz
HD Graphics (Bay Trail)
12.5 ~ 6 fps
HD Graphics 5500:
12.5 [X] Intel NUC Kit NUC5i3RYH Intel Core i3-5010U 2.1GHz
HD Graphics 5500
min:
12 fps
12.5 12.5 12.5 12.5 ~ 13 fps
HD Graphics 5500:
12.5 [X] Intel NUC Kit NUC5i3RYH Intel Core i3-5010U 2.1GHz
HD Graphics 5500
min:
12 fps
12.5 12.5 12.5 ~ 13 fps
19%
HD Graphics 5500:
23.1 fps
18%
HD Graphics 5500:
19.1 fps
16%
HD Graphics 5500:
5.5 fps
19%
HD Graphics 5500:
2.8 fps
HD Graphics 5500:
19.7 21.9 27.7 37.9 [X] Intel NUC Kit NUC5i3RYH Intel Core i3-5010U 2.1GHz
HD Graphics 5500
min:
32 fps, max:
46 fps
~ 27 fps
HD Graphics (Bay Trail):
7.3 fps
HD Graphics 5500:
13.7 19.7 25 [X] Intel NUC Kit NUC5i3RYH Intel Core i3-5010U 2.1GHz
HD Graphics 5500
min:
21 fps, max:
32 fps
~ 19 fps
HD Graphics (Bay Trail):
5.1 fps
HD Graphics 5500:
5.5 8.1 9.1 [X] Intel NUC Kit NUC5i3RYH Intel Core i3-5010U 2.1GHz
HD Graphics 5500
min:
7 fps, max:
12 fps
~ 8 fps
HD Graphics 5500:
2.9 4.9 ~ 4 fps
HD Graphics (Bay Trail):
3.2 fps
HD Graphics (Bay Trail):
1.7 fps
HD Graphics 5500:
6 6.9 ~ 6 fps
HD Graphics (Bay Trail):
8.1 fps
HD Graphics (Bay Trail):
4.7 fps
HD Graphics 5500:
2.8 3.1 ~ 3 fps
HD Graphics 5500:
22.5 23.4 [X] Intel NUC Kit NUC5i3RYH Intel Core i3-5010U 2.1GHz
HD Graphics 5500
min:
18 fps
28 ~ 25 fps
HD Graphics (Bay Trail):
7 fps
HD Graphics 5500:
15.3 16 [X] Intel NUC Kit NUC5i3RYH Intel Core i3-5010U 2.1GHz
HD Graphics 5500
min:
12.4 fps
18.6 ~ 17 fps
HD Graphics (Bay Trail):
4.6 fps
HD Graphics 5500:
5.7 [X] Intel NUC Kit NUC5i3RYH Intel Core i3-5010U 2.1GHz
HD Graphics 5500
min:
4.4 fps
6.6 9 ~ 7 fps
HD Graphics 5500:
3.9 5.5 ~ 5 fps
HD Graphics (Bay Trail):
5.6 fps
HD Graphics (Bay Trail):
3.8 fps
HD Graphics 5500:
8.2 8.6 ~ 8 fps
HD Graphics (Bay Trail):
4.3 fps
HD Graphics 5500:
5.9 6.2 ~ 6 fps
HD Graphics (Bay Trail):
2.4 fps
HD Graphics 5500:
3 3.1 ~ 3 fps
HD Graphics (Bay Trail):
9.6 11.5 ~ 11 fps
HD Graphics (Bay Trail):
4.3 fps
HD Graphics 5500:
38 39 42 47 [X] Dell Latitude E7450 Intel Core i5-5300U 2.3GHz
HD Graphics 5500
51 54 56 ~ 47 fps
HD Graphics (Bay Trail):
12 14 ~ 13 fps
HD Graphics 5500:
25 27 28 32 [X] Dell Latitude E7450 Intel Core i5-5300U 2.3GHz
HD Graphics 5500
33 33 37 ~ 31 fps
HD Graphics (Bay Trail):
12 fps
HD Graphics 5500:
14 18 18 22 [X] Dell Latitude E7450 Intel Core i5-5300U 2.3GHz
HD Graphics 5500
22 23 23 ~ 20 fps
HD Graphics 5500:
12 12 12 13 [X] Dell Latitude E7450 Intel Core i5-5300U 2.3GHz
HD Graphics 5500
13 13 13 ~ 13 fps
HD Graphics (Bay Trail):
5.2 fps
HD Graphics 5500:
10.3 13 ~ 12 fps
HD Graphics (Bay Trail):
3.6 fps
HD Graphics (Bay Trail):
3.7 fps
HD Graphics (Bay Trail):
2.5 fps
HD Graphics 5500:
4 4.2 ~ 4 fps
HD Graphics 5500:
3.3 3.8 ~ 4 fps
HD Graphics 5500:
26.6 29.7 [X] Dell Latitude E7450 Intel Core i5-5300U 2.3GHz
HD Graphics 5500
33.1 35.6 ~ 31 fps
HD Graphics (Bay Trail):
9.1 fps
HD Graphics 5500:
18.3 21.5 [X] Dell Latitude E7450 Intel Core i5-5300U 2.3GHz
HD Graphics 5500
22 23.1 ~ 21 fps
HD Graphics (Bay Trail):
5.1 fps
HD Graphics 5500:
9.8 11.2 [X] Dell Latitude E7450 Intel Core i5-5300U 2.3GHz
HD Graphics 5500
12.3 ~ 11 fps
HD Graphics 5500:
8 8.3 [X] Dell Latitude E7450 Intel Core i5-5300U 2.3GHz
HD Graphics 5500
8.8 ~ 8 fps
HD Graphics 5500:
16.2 17.6 18.8 [X] Dell Latitude E7450 Intel Core i5-5300U 2.3GHz
HD Graphics 5500
21.9 22 ~ 19 fps
HD Graphics (Bay Trail):
8.5 fps
HD Graphics 5500:
11.4 11.6 12.5 [X] Dell Latitude E7450 Intel Core i5-5300U 2.3GHz
HD Graphics 5500
15 15.8 ~ 13 fps
HD Graphics (Bay Trail):
6.1 fps
HD Graphics 5500:
6.1 6.3 6.8 [X] Dell Latitude E7450 Intel Core i5-5300U 2.3GHz
HD Graphics 5500
8 8.3 ~ 7 fps
HD Graphics 5500:
3.9 4.9 5.9 [X] Dell Latitude E7450 Intel Core i5-5300U 2.3GHz
HD Graphics 5500
~ 5 fps
HD Graphics (Bay Trail):
12.4 fps
HD Graphics (Bay Trail):
8.5 fps
HD Graphics 5500:
124 129.4 172.2 [X] Dell Latitude E7450 Intel Core i5-5300U 2.3GHz
HD Graphics 5500
173.3 ~ 150 fps
HD Graphics (Bay Trail):
53.7 56 ~ 55 fps
HD Graphics 5500:
31.7 32.1 40.9 [X] Dell Latitude E7450 Intel Core i5-5300U 2.3GHz
HD Graphics 5500
41.4 ~ 37 fps
HD Graphics (Bay Trail):
6.6 7 ~ 7 fps
HD Graphics 5500:
15.8 16.2 18.7 [X] Dell Latitude E7450 Intel Core i5-5300U 2.3GHz
HD Graphics 5500
19.4 ~ 18 fps
HD Graphics 5500:
9.6 10.2 12.9 [X] Dell Latitude E7450 Intel Core i5-5300U 2.3GHz
HD Graphics 5500
~ 11 fps
HD Graphics (Bay Trail):
8.4 fps
HD Graphics (Bay Trail):
5.9 fps
HD Graphics (Bay Trail):
31.6 41.8 ~ 37 fps
HD Graphics (Bay Trail):
12.5 12.5 ~ 13 fps
HD Graphics (Bay Trail):
8.3 fps
HD Graphics (Bay Trail):
4.6 fps
HD Graphics 5500:
4.4 6.9 ~ 6 fps
HD Graphics (Bay Trail):
11.1 fps
HD Graphics (Bay Trail):
9.6 fps
HD Graphics (Bay Trail):
25.2 fps
HD Graphics (Bay Trail):
9.2 fps
HD Graphics 5500:
10.9 11.9 12 12.5 13 13.3 13.4 [X] Lenovo ThinkPad E450 20DCW048PB Intel Core i5-5200U 2.2GHz
HD Graphics 5500
13.5 13.7 14.1 [X] Dell Latitude E7450 Intel Core i5-5300U 2.3GHz
HD Graphics 5500
14.7 [X] Toshiba Portege Z30-B-10Q Intel Core i7-5500U 2.4GHz
HD Graphics 5500
15.7 [X] HP EliteBook Folio 1040 G2 H7W22EA Intel Core i5-5300U 2.3GHz
HD Graphics 5500
16 16.3 16.6 17.1 17.3 17.3 17.4 17.4 [X] Lenovo ThinkPad Yoga 12 20DK002EPB Intel Core i7-5600U 2.6GHz
HD Graphics 5500
20.2 [X] Lenovo ThinkPad T450 20BVG733PB Intel Core i7-5600U 2.6GHz
HD Graphics 5500
20.6 ~ 15 fps
HD Graphics (Bay Trail):
3.1 5.1 ~ 4 fps
HD Graphics 5500:
5.7 6.8 8.2 9 9 9 9.1 9.2 9.3 [X] Lenovo ThinkPad E450 20DCW048PB Intel Core i5-5200U 2.2GHz
HD Graphics 5500
9.6 [X] Toshiba Portege Z30-B-10Q Intel Core i7-5500U 2.4GHz
HD Graphics 5500
10 [X] HP EliteBook Folio 1040 G2 H7W22EA Intel Core i5-5300U 2.3GHz
HD Graphics 5500
10.1 [X] Dell Latitude E7450 Intel Core i5-5300U 2.3GHz
HD Graphics 5500
10.7 11 11.3 11.3 11.5 11.8 [X] Lenovo ThinkPad Yoga 12 20DK002EPB Intel Core i7-5600U 2.6GHz
HD Graphics 5500
12.5 [X] Lenovo ThinkPad T450 20BVG733PB Intel Core i7-5600U 2.6GHz
HD Graphics 5500
12.6 ~ 10 fps
HD Graphics (Bay Trail):
3.3 fps
HD Graphics 5500:
3.9 4.3 6.3 [X] HP EliteBook Folio 1040 G2 H7W22EA Intel Core i5-5300U 2.3GHz
HD Graphics 5500
6.6 7 7.3 7.3 7.4 7.5 7.7 [X] Toshiba Portege Z30-B-10Q Intel Core i7-5500U 2.4GHz
HD Graphics 5500
8.9 [X] Dell Latitude E7450 Intel Core i5-5300U 2.3GHz
HD Graphics 5500
8.9 9.2 9.2 9.2 9.5 9.8 [X] Lenovo ThinkPad Yoga 12 20DK002EPB Intel Core i7-5600U 2.6GHz
HD Graphics 5500
10.1 10.3 [X] Lenovo ThinkPad T450 20BVG733PB Intel Core i7-5600U 2.6GHz
HD Graphics 5500
~ 8 fps
HD Graphics 5500:
2.4 2.4 2.8 3.2 3.4 3.6 3.6 [X] Toshiba Portege Z30-B-10Q Intel Core i7-5500U 2.4GHz
HD Graphics 5500
4 4.3 4.3 4.3 4.4 [X] Dell Latitude E7450 Intel Core i5-5300U 2.3GHz
HD Graphics 5500
4.6 4.7 [X] Lenovo ThinkPad Yoga 12 20DK002EPB Intel Core i7-5600U 2.6GHz
HD Graphics 5500
~ 4 fps
HD Graphics 5500:
20.1 fps
HD Graphics (Bay Trail):
8.7 fps
HD Graphics 5500:
14.1 fps
HD Graphics (Bay Trail):
5.8 fps
HD Graphics 5500:
29.7 37.3 [X] Intel NUC Kit NUC5i3RYH Intel Core i3-5010U 2.1GHz
HD Graphics 5500
~ 34 fps
HD Graphics (Bay Trail):
12.8 fps
HD Graphics 5500:
12.8 14 [X] Intel NUC Kit NUC5i3RYH Intel Core i3-5010U 2.1GHz
HD Graphics 5500
~ 13 fps
HD Graphics (Bay Trail):
6 fps
HD Graphics 5500:
4.9 6.9 [X] Intel NUC Kit NUC5i3RYH Intel Core i3-5010U 2.1GHz
HD Graphics 5500
~ 6 fps
HD Graphics 5500:
16.8 fps
HD Graphics 5500:
10.7 fps
HD Graphics 5500:
24.8 fps
HD Graphics (Bay Trail):
7.3 fps
HD Graphics 5500:
3.7 4.3 ~ 4 fps
HD Graphics (Bay Trail):
14 fps
HD Graphics (Bay Trail):
8 fps
HD Graphics (Bay Trail):
12 fps
HD Graphics 5500:
67 71.4 ~ 69 fps
HD Graphics 5500:
37 40.3 ~ 39 fps
HD Graphics 5500:
26 31.9 35.9 38 39.1 [X] HP EliteBook Folio 1040 G2 H7W22EA Intel Core i5-5300U 2.3GHz
HD Graphics 5500
~ 34 fps
HD Graphics (Bay Trail):
7.7 fps
HD Graphics 5500:
19 23.2 26 26.7 27.9 [X] HP EliteBook Folio 1040 G2 H7W22EA Intel Core i5-5300U 2.3GHz
HD Graphics 5500
30 ~ 25 fps
HD Graphics 5500:
16 17.9 20.8 21 [X] HP EliteBook Folio 1040 G2 H7W22EA Intel Core i5-5300U 2.3GHz
HD Graphics 5500
21 22 ~ 20 fps
HD Graphics 5500:
5.5 6 8 10 ~ 7 fps
HD Graphics 5500:
17.6 fps
HD Graphics (Bay Trail):
6.3 fps
HD Graphics 5500:
13.6 fps
HD Graphics 5500:
16.6 fps
HD Graphics (Bay Trail):
10.2 fps
HD Graphics 5500:
13.9 fps
HD Graphics (Bay Trail):
6.1 fps
HD Graphics 5500:
10.8 fps
HD Graphics 5500:
23.2 fps
HD Graphics (Bay Trail):
11 fps
HD Graphics 5500:
13.5 fps
HD Graphics (Bay Trail):
7.8 fps
HD Graphics 5500:
44.8 54.4 56.3 56.3 58.3 65.6 [X] Dell Latitude E7450 Intel Core i5-5300U 2.3GHz
HD Graphics 5500
74 77.4 [X] Toshiba Portege Z30-B-10Q Intel Core i7-5500U 2.4GHz
HD Graphics 5500
85.2 [X] Lenovo ThinkPad E450 20DCW048PB Intel Core i5-5200U 2.2GHz
HD Graphics 5500
~ 64 fps
HD Graphics (Bay Trail):
18.2 20.8 28.4 31.9 [X] Asus Transformer Book T200TA PL Intel Atom Z3775 1.5GHz
HD Graphics (Bay Trail)
~ 25 fps
HD Graphics 5500:
27 31.9 31.9 [X] Toshiba Portege Z30-B-10Q Intel Core i7-5500U 2.4GHz
HD Graphics 5500
32.1 33.2 33.7 37.3 [X] Dell Latitude E7450 Intel Core i5-5300U 2.3GHz
HD Graphics 5500
38 [X] Lenovo ThinkPad E450 20DCW048PB Intel Core i5-5200U 2.2GHz
HD Graphics 5500
42 ~ 34 fps
HD Graphics (Bay Trail):
9.5 10.4 13.7 19.4 [X] Asus Transformer Book T200TA PL Intel Atom Z3775 1.5GHz
HD Graphics (Bay Trail)
~ 13 fps
HD Graphics 5500:
13 14.3 14.4 14.8 17.7 [X] Dell Latitude E7450 Intel Core i5-5300U 2.3GHz
HD Graphics 5500
21.9 26.8 [X] Toshiba Portege Z30-B-10Q Intel Core i7-5500U 2.4GHz
HD Graphics 5500
~ 18 fps
HD Graphics (Bay Trail):
4.4 fps
HD Graphics 5500:
7.4 7.8 ~ 8 fps
HD Graphics 5500:
2.8 3 ~ 3 fps
HD Graphics (Bay Trail):
12.5 12.6 ~ 13 fps
HD Graphics (Bay Trail):
5 fps
HD Graphics (Bay Trail):
3.5 5.3 5.6 5.7 6.3 6.8 6.9 [X] Toshiba Satellite Click 2 L30W-BST2N23 Intel Pentium N3530 2.2GHz
HD Graphics (Bay Trail)
7.1 ~ 6 fps
HD Graphics (Bay Trail):
2.1 4.8 4.9 5.8 [X] Toshiba Satellite Click 2 L30W-BST2N23 Intel Pentium N3530 2.2GHz
HD Graphics (Bay Trail)
5.9 6.2 ~ 5 fps
HD Graphics 5500:
4.3 4.4 4.6 4.6 4.7 [X] HP EliteBook 850 G2 J7B56EA Intel Core i5-5300U 2.3GHz
HD Graphics 5500
4.7 4.7 5.4 5.6 [X] Lenovo ThinkPad X1 Carbon 2015 Intel Core i7-5500U 2.4GHz
HD Graphics 5500
5.9 6 [X] Lenovo ThinkPad Yoga 12 20DK002EPB Intel Core i7-5600U 2.6GHz
HD Graphics 5500
6.1 9 ~ 5 fps
HD Graphics (Bay Trail):
1.2 fps
HD Graphics 5500:
114.6 [X] Eurocom Armadillo 2 Intel Core i5-5200U 2.2GHz
HD Graphics 5500
116.6 127.6 130.1 [X] Dell Latitude E5550 Broadwell Dual-Channel
Intel Core i5-5300U 2.3GHz
HD Graphics 5500
~ 122 fps
HD Graphics (Bay Trail):
39 56.2 69 [X] Baytrail Reference Tablet Intel Atom Z3770 1.5GHz
HD Graphics (Bay Trail)
~ 55 fps
HD Graphics 5500:
36.2 38.9 44.1 [X] Dell Latitude E5550 Broadwell Dual-Channel
Intel Core i5-5300U 2.3GHz
HD Graphics 5500
44.1 [X] Eurocom Armadillo 2 Intel Core i5-5200U 2.2GHz
HD Graphics 5500
~ 41 fps
HD Graphics (Bay Trail):
12.3 12.8 14 [X] Baytrail Reference Tablet Intel Atom Z3770 1.5GHz
HD Graphics (Bay Trail)
min:
8 fps
~ 13 fps
HD Graphics 5500:
20.2 21.3 23.5 [X] Dell Latitude E5550 Broadwell Dual-Channel
Intel Core i5-5300U 2.3GHz
HD Graphics 5500
25.2 [X] Eurocom Armadillo 2 Intel Core i5-5200U 2.2GHz
HD Graphics 5500
~ 23 fps
HD Graphics 5500:
7.1 8.3 [X] Dell Latitude E5550 Broadwell Dual-Channel
Intel Core i5-5300U 2.3GHz
HD Graphics 5500
9.1 [X] Eurocom Armadillo 2 Intel Core i5-5200U 2.2GHz
HD Graphics 5500
~ 8 fps
HD Graphics 5500:
44.1 [X] Acer Aspire E5-571G-520X Intel Core i5-5200U 2.2GHz
HD Graphics 5500
fps
HD Graphics 5500:
23.3 [X] Acer Aspire E5-571G-520X Intel Core i5-5200U 2.2GHz
HD Graphics 5500
fps
HD Graphics 5500:
14.8 [X] Acer Aspire E5-571G-520X Intel Core i5-5200U 2.2GHz
HD Graphics 5500
fps
HD Graphics (Bay Trail):
0.3 fps
HD Graphics 5500:
1.9 2.8 ~ 2 fps
HD Graphics 5500:
55.1 fps
HD Graphics (Bay Trail):
15.1 23.6 ~ 19 fps
HD Graphics 5500:
24.9 fps
HD Graphics (Bay Trail):
5.2 9.7 ~ 7 fps
HD Graphics 5500:
20.7 fps
HD Graphics 5500:
10.7 fps
HD Graphics 5500:
30.4 [X] Acer Aspire E5-571G-520X Intel Core i5-5200U 2.2GHz
HD Graphics 5500
fps
HD Graphics (Bay Trail):
10.3 fps
HD Graphics 5500:
20.1 [X] Acer Aspire E5-571G-520X Intel Core i5-5200U 2.2GHz
HD Graphics 5500
fps
HD Graphics (Bay Trail):
6.2 fps
HD Graphics 5500:
10.4 [X] Acer Aspire E5-571G-520X Intel Core i5-5200U 2.2GHz
HD Graphics 5500
fps
HD Graphics 5500:
15.9 [X] Acer Aspire E5-571G-520X Intel Core i5-5200U 2.2GHz
HD Graphics 5500
fps
HD Graphics 5500:
14.1 [X] Acer Aspire E5-571G-520X Intel Core i5-5200U 2.2GHz
HD Graphics 5500
fps
HD Graphics (Bay Trail):
10.1 fps
HD Graphics 5500:
12.9 fps
HD Graphics (Bay Trail):
6 fps
HD Graphics 5500:
43.7 fps
HD Graphics (Bay Trail):
12.4 fps
HD Graphics 5500:
31.3 fps
HD Graphics (Bay Trail):
7.3 fps
HD Graphics 5500:
17.4 fps
HD Graphics 5500:
28.7 [X] Acer Aspire E5-571G-520X Intel Core i5-5200U 2.2GHz
HD Graphics 5500
fps
HD Graphics 5500:
20.4 [X] Acer Aspire E5-571G-520X Intel Core i5-5200U 2.2GHz
HD Graphics 5500
fps
HD Graphics 5500:
16.4 [X] Acer Aspire E5-571G-520X Intel Core i5-5200U 2.2GHz
HD Graphics 5500
fps
HD Graphics 5500:
37.7 [X] Acer Aspire E5-771G-71PT Intel Core i7-5500U 2.4GHz
HD Graphics 5500
fps
HD Graphics (Bay Trail):
12.5 14.3 ~ 13 fps
HD Graphics 5500:
29.2 [X] Acer Aspire E5-771G-71PT Intel Core i7-5500U 2.4GHz
HD Graphics 5500
fps
HD Graphics (Bay Trail):
9.8 11.2 ~ 11 fps
HD Graphics 5500:
26.1 [X] Acer Aspire E5-771G-71PT Intel Core i7-5500U 2.4GHz
HD Graphics 5500
fps
HD Graphics (Bay Trail):
42 fps
HD Graphics 5500:
42.6 [X] Eurocom Armadillo 2 Intel Core i5-5200U 2.2GHz
HD Graphics 5500
fps
HD Graphics 5500:
14.3 [X] Eurocom Armadillo 2 Intel Core i5-5200U 2.2GHz
HD Graphics 5500
fps
HD Graphics 5500:
6.1 [X] Eurocom Armadillo 2 Intel Core i5-5200U 2.2GHz
HD Graphics 5500
fps
HD Graphics 5500:
61 71 87.2 [X] Dell Latitude E7450 Intel Core i5-5300U 2.3GHz
HD Graphics 5500
~ 73 fps
HD Graphics (Bay Trail):
26.1 [X] Intel NUC Kit DN2820FYKH Intel Celeron N2820 2.2GHz
HD Graphics (Bay Trail)
min:
16 fps, max:
38 fps
46.6 ~ 36 fps
HD Graphics 5500:
41 51.3 67.4 [X] Dell Latitude E7450 Intel Core i5-5300U 2.3GHz
HD Graphics 5500
~ 53 fps
HD Graphics (Bay Trail):
20 [X] Intel NUC Kit DN2820FYKH Intel Celeron N2820 2.2GHz
HD Graphics (Bay Trail)
min:
13 fps, max:
29 fps
23.9 ~ 22 fps
HD Graphics 5500:
32.3 36.2 42.9 [X] Dell Latitude E7450 Intel Core i5-5300U 2.3GHz
HD Graphics 5500
~ 37 fps
HD Graphics 5500:
17.4 19.7 25 [X] Dell Latitude E7450 Intel Core i5-5300U 2.3GHz
HD Graphics 5500
~ 21 fps
HD Graphics (Bay Trail):
12.9 13.2 ~ 13 fps
HD Graphics (Bay Trail):
7.5 8.1 ~ 8 fps
HD Graphics 5500:
21 [X] Acer Aspire E5-571G-520X Intel Core i5-5200U 2.2GHz
HD Graphics 5500
fps
HD Graphics 5500:
51.4 [X] Acer Aspire E5-771G-71PT Intel Core i7-5500U 2.4GHz
HD Graphics 5500
fps
HD Graphics (Bay Trail):
28 fps
HD Graphics 5500:
30 [X] Acer Aspire E5-771G-71PT Intel Core i7-5500U 2.4GHz
HD Graphics 5500
fps
HD Graphics 5500:
21.9 [X] Acer Aspire E5-771G-71PT Intel Core i7-5500U 2.4GHz
HD Graphics 5500
fps
HD Graphics 5500:
47.1 52.8 54 68.6 [X] Dell Latitude E7450 Intel Core i5-5300U 2.3GHz
HD Graphics 5500
~ 56 fps
HD Graphics (Bay Trail):
9.2 10.7 14.8 [X] Dell Venue 11 Pro 5130 Intel Atom Z3770 1.5GHz
HD Graphics (Bay Trail)
15.6 16.5 18.4 19.3 [X] Intel NUC Kit DN2820FYKH Intel Celeron N2820 2.2GHz
HD Graphics (Bay Trail)
min:
14 fps, max:
23 fps
~ 15 fps
HD Graphics 5500:
30.1 34.8 35.6 45.3 [X] Dell Latitude E7450 Intel Core i5-5300U 2.3GHz
HD Graphics 5500
~ 36 fps
HD Graphics (Bay Trail):
6 9.5 10.3 11.4 [X] Dell Venue 11 Pro 5130 Intel Atom Z3770 1.5GHz
HD Graphics (Bay Trail)
12 ~ 10 fps
HD Graphics 5500:
24 27.8 28.6 37 [X] Dell Latitude E7450 Intel Core i5-5300U 2.3GHz
HD Graphics 5500
~ 29 fps
HD Graphics (Bay Trail):
7.9 9.6 [X] Dell Venue 11 Pro 5130 Intel Atom Z3770 1.5GHz
HD Graphics (Bay Trail)
~ 9 fps
HD Graphics 5500:
15.2 16.9 17.3 22.3 [X] Dell Latitude E7450 Intel Core i5-5300U 2.3GHz
HD Graphics 5500
~ 18 fps
HD Graphics (Bay Trail):
5 5.9 [X] Dell Venue 11 Pro 5130 Intel Atom Z3770 1.5GHz
HD Graphics (Bay Trail)
~ 5 fps
HD Graphics 5500:
36.1 [X] Acer Aspire E5-571G-520X Intel Core i5-5200U 2.2GHz
HD Graphics 5500
fps
HD Graphics (Bay Trail):
8.5 12.4 ~ 10 fps
HD Graphics 5500:
26.6 [X] Acer Aspire E5-571G-520X Intel Core i5-5200U 2.2GHz
HD Graphics 5500
fps
HD Graphics (Bay Trail):
8.1 fps
HD Graphics 5500:
18.4 [X] Acer Aspire E5-771G-71PT Intel Core i7-5500U 2.4GHz
HD Graphics 5500
fps
HD Graphics (Bay Trail):
5.8 fps
HD Graphics 5500:
9.8 [X] Acer Aspire E5-771G-71PT Intel Core i7-5500U 2.4GHz
HD Graphics 5500
fps
HD Graphics (Bay Trail):
2.3 fps
HD Graphics 5500:
15.9 16.3 16.4 17 19.8 [X] HP Pavilion 14t-ab000 K9E07AV Intel Core i3-5010U 2.1GHz
HD Graphics 5500
22.8 ~ 18 fps
HD Graphics (Bay Trail):
3.6 [X] Acer Aspire E1-510P-2671 Intel Celeron N2920 1.9GHz
HD Graphics (Bay Trail)
4 4 4.1 5.5 ~ 4 fps
HD Graphics (Bay Trail):
1.1 fps
HD Graphics (Bay Trail):
11 11.8 ~ 11 fps
HD Graphics (Bay Trail):
10 fps
HD Graphics (Bay Trail):
8 fps
HD Graphics (Bay Trail):
4.8 fps
HD Graphics 5500:
13 [X] Lenovo ThinkPad T450 20BVG733PB Intel Core i7-5600U 2.6GHz
HD Graphics 5500
37 ~ 25 fps
HD Graphics 5500:
10 [X] Lenovo ThinkPad T450 20BVG733PB Intel Core i7-5600U 2.6GHz
HD Graphics 5500
29 ~ 20 fps
HD Graphics 5500:
44.6 fps
HD Graphics (Bay Trail):
19.7 fps
HD Graphics 5500:
25.7 fps
HD Graphics 5500:
11.3 fps
HD Graphics 5500:
27 78.1 [X] Acer Aspire E5-771G-71PT Intel Core i7-5500U 2.4GHz
HD Graphics 5500
~ 53 fps
HD Graphics (Bay Trail):
24.1 36.9 ~ 31 fps
HD Graphics 5500:
18.9 42.4 [X] Acer Aspire E5-771G-71PT Intel Core i7-5500U 2.4GHz
HD Graphics 5500
~ 31 fps
HD Graphics (Bay Trail):
12.9 13.3 ~ 13 fps
HD Graphics 5500:
16.7 29.2 [X] Acer Aspire E5-771G-71PT Intel Core i7-5500U 2.4GHz
HD Graphics 5500
~ 23 fps
HD Graphics 5500:
12.9 [X] Acer Aspire E5-771G-71PT Intel Core i7-5500U 2.4GHz
HD Graphics 5500
12.9 ~ 13 fps
HD Graphics 5500:
96.1 [X] Acer Aspire E5-571G-520X Intel Core i5-5200U 2.2GHz
HD Graphics 5500
fps
HD Graphics (Bay Trail):
9.3 fps
HD Graphics 5500:
28.7 [X] Lenovo ThinkPad E450 20DCW048PB Intel Core i5-5200U 2.2GHz
HD Graphics 5500
30.6 [X] Toshiba Portege Z30-B-10Q Intel Core i7-5500U 2.4GHz
HD Graphics 5500
30.9 [X] HP EliteBook Folio 1040 G2 H7W22EA Intel Core i5-5300U 2.3GHz
HD Graphics 5500
39 [X] Lenovo ThinkPad Yoga 12 20DK002EPB Intel Core i7-5600U 2.6GHz
HD Graphics 5500
39.3 [X] Lenovo ThinkPad T450 20BVG733PB Intel Core i7-5600U 2.6GHz
HD Graphics 5500
~ 34 fps
HD Graphics (Bay Trail):
5 10.5 [X] Asus Transformer Book T200TA PL Intel Atom Z3775 1.5GHz
HD Graphics (Bay Trail)
~ 8 fps
HD Graphics 5500:
21.2 [X] Lenovo ThinkPad E450 20DCW048PB Intel Core i5-5200U 2.2GHz
HD Graphics 5500
22.6 [X] Toshiba Portege Z30-B-10Q Intel Core i7-5500U 2.4GHz
HD Graphics 5500
24.3 [X] HP EliteBook Folio 1040 G2 H7W22EA Intel Core i5-5300U 2.3GHz
HD Graphics 5500
28.9 [X] Lenovo ThinkPad T450 20BVG733PB Intel Core i7-5600U 2.6GHz
HD Graphics 5500
30.4 [X] Lenovo ThinkPad Yoga 12 20DK002EPB Intel Core i7-5600U 2.6GHz
HD Graphics 5500
~ 25 fps
HD Graphics (Bay Trail):
5.6 [X] Asus Transformer Book T200TA PL Intel Atom Z3775 1.5GHz
HD Graphics (Bay Trail)
fps
HD Graphics 5500:
19 [X] Toshiba Portege Z30-B-10Q Intel Core i7-5500U 2.4GHz
HD Graphics 5500
20.5 [X] HP EliteBook Folio 1040 G2 H7W22EA Intel Core i5-5300U 2.3GHz
HD Graphics 5500
24.8 [X] Lenovo ThinkPad Yoga 12 20DK002EPB Intel Core i7-5600U 2.6GHz
HD Graphics 5500
25 [X] Lenovo ThinkPad T450 20BVG733PB Intel Core i7-5600U 2.6GHz
HD Graphics 5500
~ 22 fps
HD Graphics (Bay Trail):
3.7 [X] Asus Transformer Book T200TA PL Intel Atom Z3775 1.5GHz
HD Graphics (Bay Trail)
fps
HD Graphics 5500:
11 [X] Toshiba Portege Z30-B-10Q Intel Core i7-5500U 2.4GHz
HD Graphics 5500
14.8 [X] Lenovo ThinkPad Yoga 12 20DK002EPB Intel Core i7-5600U 2.6GHz
HD Graphics 5500
~ 13 fps
HD Graphics (Bay Trail):
6 9 9 ~ 8 fps
HD Graphics (Bay Trail):
3 fps
HD Graphics (Bay Trail):
12 [X] Asus Transformer Book T200TA PL Intel Atom Z3775 1.5GHz
HD Graphics (Bay Trail)
fps
HD Graphics (Bay Trail):
9 [X] Asus Transformer Book T200TA PL Intel Atom Z3775 1.5GHz
HD Graphics (Bay Trail)
fps
HD Graphics 5500:
13.3 fps
HD Graphics 5500:
111.2 [X] Acer Aspire E5-771G-71PT Intel Core i7-5500U 2.4GHz
HD Graphics 5500
fps
HD Graphics (Bay Trail):
12.8 fps
HD Graphics 5500:
83.7 [X] Acer Aspire E5-771G-71PT Intel Core i7-5500U 2.4GHz
HD Graphics 5500
fps
HD Graphics (Bay Trail):
9 fps
HD Graphics 5500:
61.3 [X] Acer Aspire E5-771G-71PT Intel Core i7-5500U 2.4GHz
HD Graphics 5500
fps
HD Graphics 5500:
84 [X] Acer Aspire E5-771G-71PT Intel Core i7-5500U 2.4GHz
HD Graphics 5500
fps
HD Graphics 5500:
36 [X] Acer Aspire E5-771G-71PT Intel Core i7-5500U 2.4GHz
HD Graphics 5500
fps
HD Graphics 5500:
16.4 [X] Acer Aspire E5-771G-71PT Intel Core i7-5500U 2.4GHz
HD Graphics 5500
fps
HD Graphics 5500:
78.7 [X] Acer Aspire E5-771G-71PT Intel Core i7-5500U 2.4GHz
HD Graphics 5500
fps
HD Graphics 5500:
33.7 [X] Acer Aspire E5-771G-71PT Intel Core i7-5500U 2.4GHz
HD Graphics 5500
fps
HD Graphics (Bay Trail):
6.4 7.7 ~ 7 fps
HD Graphics (Bay Trail):
18.9 19 ~ 19 fps
HD Graphics (Bay Trail):
7.6 8.7 ~ 8 fps
HD Graphics (Bay Trail):
33 33 35 38 [X] MSI S100 Intel Atom Z3740D 1.3GHz
HD Graphics (Bay Trail)
44 46.2 47 48 49 49 [X] Intel NUC Kit DN2820FYKH Intel Celeron N2820 2.2GHz
HD Graphics (Bay Trail)
min:
39 fps, max:
59 fps
50 [X] Baytrail Reference Tablet Intel Atom Z3770 1.5GHz
HD Graphics (Bay Trail)
min:
36 fps
52 ~ 44 fps
HD Graphics (Bay Trail):
9.6 [X] Intel NUC Kit DN2820FYKH Intel Celeron N2820 2.2GHz
HD Graphics (Bay Trail)
min:
3 fps, max:
13 fps
11.5 [X] Baytrail Reference Tablet Intel Atom Z3770 1.5GHz
HD Graphics (Bay Trail)
min:
8 fps
20 22 23 25.3 26 26 28 [X] MSI S100 Intel Atom Z3740D 1.3GHz
HD Graphics (Bay Trail)
34 ~ 23 fps
HD Graphics (Bay Trail):
12 12 13.5 ~ 13 fps
HD Graphics (Bay Trail):
5.6 7 ~ 6 fps
HD Graphics (Bay Trail):
190 [X] Baytrail Reference Tablet Intel Atom Z3770 1.5GHz
HD Graphics (Bay Trail)
fps
Average Gaming AMD Radeon 660M → 100% Average Gaming 30-70 fps → 100%
Average Gaming Intel HD Graphics 5500 → 22% Average Gaming 30-70 fps → 46%
Average Gaming Intel HD Graphics (Bay Trail) → 13% v1.28
log 18. 17:47:40
#0 ran 0s before starting gpusingle class +0s ... 0s
#1 checking url part for id 11126 +0s ... 0s
#2 checking url part for id 5941 +0s ... 0s
#3 checking url part for id 4922 +0s ... 0s
#4 redirected to Ajax server, took 1731948459s time from redirect:0 +0s ... 0s
#5 did not recreate cache, as it is less than 5 days old! Created at Sat, 16 Nov 2024 05:17:01 +0100 +0s ... 0s
#6 composed specs +0.007s ... 0.007s
#7 did output specs +0s ... 0.007s
#8 start showIntegratedCPUs +0s ... 0.007s
#9 getting avg benchmarks for device 11126 +0.016s ... 0.023s
#10 got single benchmarks 11126 +0.002s ... 0.025s
#11 getting avg benchmarks for device 5941 +0.003s ... 0.028s
#12 got single benchmarks 5941 +0.031s ... 0.059s
#13 getting avg benchmarks for device 4922 +0.003s ... 0.062s
#14 got single benchmarks 4922 +0.075s ... 0.136s
#15 got avg benchmarks for devices +0s ... 0.136s
#16 No cached benchmark found, getting uncached values +0.015s ... 0.151s
#17 No cached benchmark found, getting uncached values +0s ... 0.152s
#18 min, max, avg, median took s +0.053s ... 0.205s
#19 before gaming benchmark output +0s ... 0.205s
#20 Got 1995 rows for game benchmarks. +0.085s ... 0.29s
#21 composed SQL query for gamebenchmarks +0s ... 0.29s
#22 got data and put it in $dataArray +0.013s ... 0.303s
#23 benchmarks composed for output. +0.065s ... 0.368s
#24 calculated avg scores. +0s ... 0.368s
#25 return log +0.002s ... 0.371s
Autor: Klaus Hinum, 8.09.2017 (Update: 1.07.2023)
 Deutsch
 English
 Español
 Français
 Italiano
 Nederlands
 Polski
 Português
 Русский
 Türkçe
 Svenska
 Chinese
 Magyar