Notebookcheck Logo

AMD Radeon 610M vs Intel HD Graphics P530 vs Intel HD Graphics 5600

AMD Radeon 610M

► remove from comparison AMD Radeon 610M

Die AMD Radeon 610M (oder RX 610M) ist eine integrierte Grafikkarte (iGPU) für Notebooks. Sie befindet sich in den Einstiegs-Mendocino-APUs (Ryzen 7020 Serie) und bietet nur 2 CUs (128 Shader) . Sie nutzt die aktuelle RDNA 2 Architektur (wie die RX 6000M Serie). Die Taktrate ist abhängig vom CPU-Modell. Die GPU hat keinen eigenen Grafikspeicher, sondern nutzt den gemeinsamen Hauptspeicher (LPDDR5). Die 610M unterstützt vier Displayoutputs und kann AV1 Videos dekodieren.

Die Leistung der GPU ist abhängig von der CPU, dem konfiguriertem TDP (8 - 15W), der Kühlung und dem verbautem Hauptspeicher. 

Der Stromverbrauch ist dank 6nm Prozess und ausgeklügelten Stromsparmechanismen relativ gering (laut AMD) und daher eignet sich die Grafikkarte auch für sehr dünne und leichte Notebooks.

Intel HD Graphics P530

► remove from comparison Intel HD Graphics P530

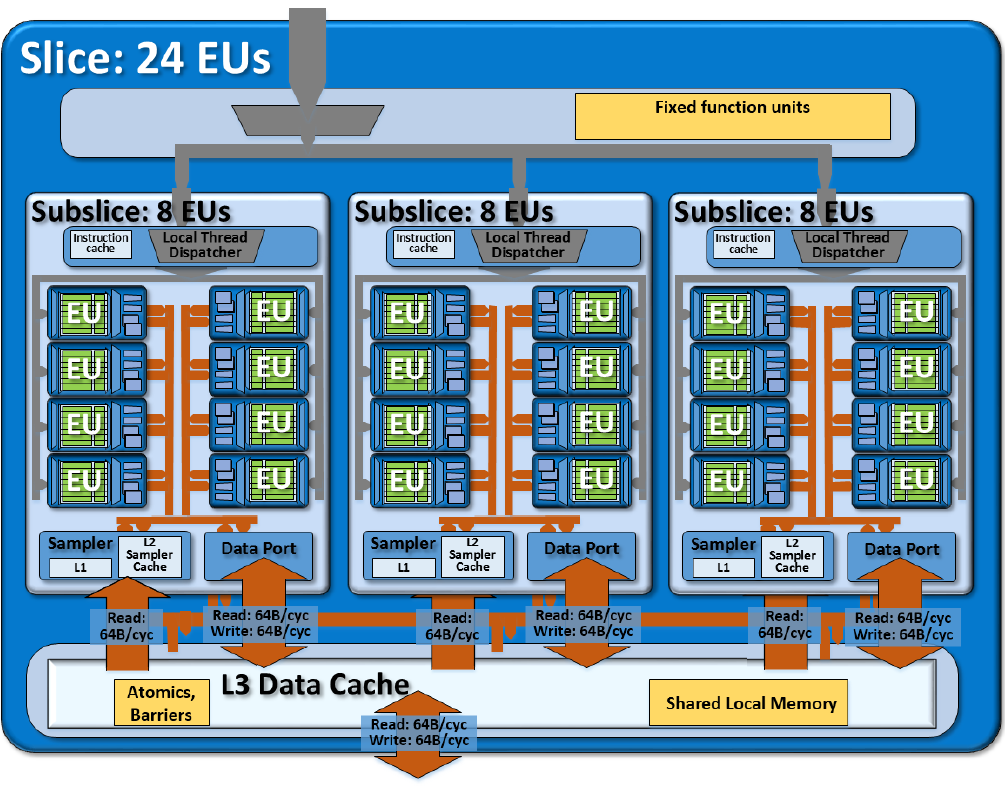
Die Intel HD Graphics P530 (GT2) ist eine integrierte Grafikeinheit, die in Skylake-Prozessoren der Xeon-Baureihe für Workstation-Notebooks verbaut wird. Die mittlere, auch "GT2" genannte Ausbaustufe verfügt über 24 EUs (Execution Units bzw. Ausführungseinheiten) und taktet je nach Modell mit bis zu 1.050 MHz (Turbo). Mangels eigenem Grafikspeicher oder eDRAM-Cache greift die HD Graphics P530 über das Interface des Prozessors auf den System-RAM zu (2x 64 Bit DDR3L-1600/DDR4-2133).

Performance

Die Leistung der HD Graphics P530 dürfte entsprechend der identischen technischen Daten genau auf dem Niveau der HD Graphics 530 liegen. Je nach Spiel kann die GPU damit in etwa mit einer dedizierten GeForce 920M konkurrieren und aktuelle Spiele (Stand 2015) zumeist in niedrigen, selten auch mittleren Einstellungen flüssig darstellen.

Features

Der überarbeitete Videodecoder decodiert nun auch H.265-/HEVC-Videos vollständig in Hardware und arbeitet dadurch deutlich effizienter als bislang. Die Bildausgabe erfolgt über DP 1.2/eDP 1.3 (max. 3.840 x 2.160 @ 60 Hz), wohingegen HDMI nur in der älteren Version 1.4a angeboten wird. Ein HDMI-2.0-Anschluss kann aber mittels Konverter von DisplayPort ergänzt werden. Maximal lassen sich drei Displays parallel angesteuern.

Leistungsaufnahme

Mobile Xeon-Modelle wie der E3-1535M v5 werden von Intel mit einer TDP von 45 Watt spezifiziert, sodass die HD Graphics P530 vor allem in größeren Notebooks ab etwa 15 Zoll zu finden ist.

Intel HD Graphics 5600

► remove from comparison Intel HD Graphics 5600

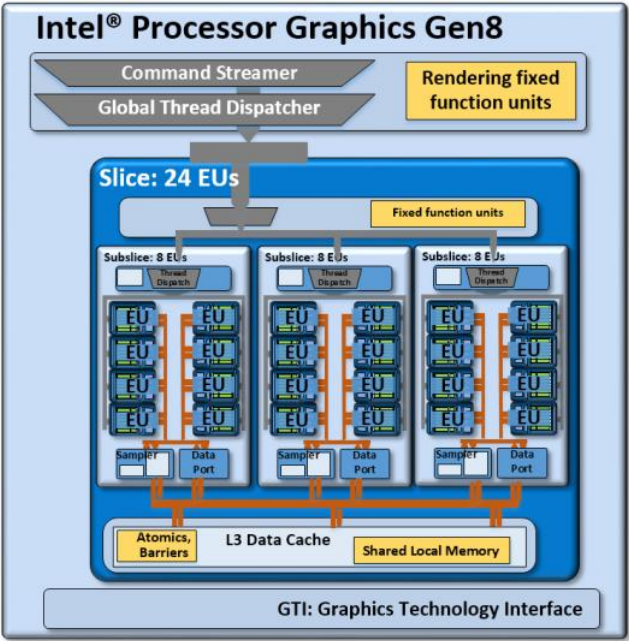
Die Intel HD Graphics 5600 (GT2) ist eine Prozessorgrafikkarte in den CPUs der Broadwell-Generation. Die GPU wird in Standard-Voltage-Modellen der Core-Serie verbaut und bietet 24 EUs (Execution Units bzw. Ausführungseinheiten). Die Kerntaktrate des bislang einzigen Modells (Core i7-5700HQ) liegt bei max. 1.050 MHz mit Turbo.

Architektur und Features

Broadwell integriert eine Grafikeinheit auf Basis der Intel-Gen8-Architektur, die gegenüber dem Vorgänger Intel Gen7.5 (Haswell) in verschiedenen Punkten weiterentwickelt wurde. So hat Intel unter anderem die "Subslice" genannten Shader-Arrays umorganisiert, die nun jeweils 8 Execution Units (EUs) beinhalten. Drei Subslices bilden wiederum einen Slice mit insgesamt 24 EUs. Hinzu kommen größere L1-Caches und Verbesserungen im Front-End, die die Leistung zusätzlich steigern sollen.

Die HD Graphics 5600 repräsentiert die mittlere, auch "GT2" bezeichnete Ausbaustufe der Broadwell-GPU mit einem Slice und 24 EUs. Daneben existieren auch eine teildeaktivierte GT1-Variante (12 EUs) sowie die GT3/GT3e (48 EUs) ohne/mit zusätzlichem eDRAM-Cache.

Alle Broadwell-GPUs unterstützen OpenCL 2.0 sowie DirectX 12 (FL 11_1). Zudem kann der Videodecoder nun auch den H.265-Codec verarbeiten, greift dafür allerdings nur teilweise auf besonders sparsame Fixed-Function-Einheiten zurück. Die Bildausgabe erfolgt über DP 1.2/eDP 1.3 (max. 3.840 x 2.160 @ 60 Hz) oder HDMI 1.4a (max. 3.840 x 2.160 @ 24 Hz), HDMI 2.0 steht dagegen nicht zur Verfügung. Es können maximal drei Displays parallel angesteuert werden.

Performance

Dank zusätzlicher Ausführungseinheiten sowie der verbesserten Architektur liegt die Performance der HD Graphics 5600 etwa 20 Prozent oberhalb des Vorgängers HD Graphics 4600. Dennoch ordnet sich die GPU weiterhin im Low-End-Segment ein und kommt nicht ganz an dedizierte Einstiegsbeschleuniger wie die GeForce 920M oder Radeon R7 M360 heran. Spiele des Jahres 2014/2015 werden darum meist nur in niedrigen Einstellungen flüssig wiedergegeben, einige besonders anspruchsvolle Titel wie The Witcher 3 teilweise nicht einmal das.

Leistungsaufnahme

Die TDP des gesamten Chips liegt standardmäßig bei 47 Watt (i7-5700HQ), sodass die HD Graphics 5600 vor allem in größeren Notebooks ab 14 oder 15 Zoll zu finden ist. Laut HWInfo braucht der GPU Part in einem i7-5700HQ (MSI GP62) auf dem Windows Desktop etwa 0,04 Watt, bei World of Warships 9,6 Watt (41 Watt die gesamte CPU). Verwendet man die dedizierte 940M im GP62, verringern sich die Werte auf 0,4 Watt bzw. 29 Watt für die gesamte CPU.

AMD Radeon 610MIntel HD Graphics P530Intel HD Graphics 5600
HD Graphics Serie
Radeon 680M 768 @ 2.4 GHz
Radeon 660M 384 @ 1.9 GHz
Radeon Graphics (Ryzen 7000) 128 @ 2.2 GHz
Radeon 610M 128 @ 0.4 - 2.2 GHz
HD Graphics P530 24 @ 0.35 - 1.05 GHz64/128 Bit
HD Graphics 5600 24 @ 0.3 - 1.05 GHz64/128 Bit
HD Graphics 6000 48 @ 0.3 - 1 GHz64/128 Bit
HD Graphics 4600 20 @ 0.2 - 1.35 GHz64/128 Bit
HD Graphics 5500 24 @ 0.3 - 0.95 GHz64/128 Bit
HD Graphics 5000 40 @ 0.2 - 1.1 GHz64/128 Bit
HD Graphics 4400 20 @ 0.2 - 1.1 GHz64/128 Bit
HD Graphics 5300 24 @ 0.1 - 0.9 GHz64/128 Bit
HD Graphics 4000 16 @ 0.35 - 1.35 GHz64/128 Bit
HD Graphics (Broadwell) 12 @ 0.1 - 0.85 GHz64/128 Bit
HD Graphics 4200 20 @ 0.2 - 0.85 GHz64/128 Bit
HD Graphics (Skylake) 12 @ 0.3 - 0.8 GHz64/128 Bit
HD Graphics 405 (Braswell) 16 @ 0.32 - 0.7 GHz64/128 Bit
HD Graphics (Braswell) 16 @ 0.32 - 0.7 GHz64/128 Bit
HD Graphics 400 (Braswell) 12 @ 0.32 - 0.64 GHz64/128 Bit
HD Graphics (Haswell) 10 @ 0.2 - 1 GHz64/128 Bit
HD Graphics (Cherry Trail) 16 @ 0.2 - 0.6 GHz64/128 Bit
HD Graphics 3000 12 @ 0.35 - 1.35 GHz64/128 Bit
HD Graphics 2500 6 @ 0.65 - 1.15 GHz64/128 Bit
HD Graphics (Ivy Bridge) 6 @ 0.35 - 1.1 GHz64/128 Bit
HD Graphics 2000 6 @ 0.85 - 1.35 GHz64/128 Bit
HD Graphics (Sandy Bridge) 6 @ 0.35 - 1.1 GHz64/128 Bit
HD Graphics (Bay Trail) 4 @ 0.31 - 0.9 GHz32/64/128 Bit
CodenameRDNA 2Skylake GT2Broadwell GT2
ArchitekturRDNA 2Gen. 9 SkylakeGen. 8 Broadwell
Pipelines128 - unified24 - unified24 - unified
TMUs8
ROPs4
Raytracing Cores2
Kerntakt400 - 2200 (Boost) MHz350 - 1050 (Boost) MHz300 - 1050 (Boost) MHz
Shared Memoryneinjaja
APIDirectX 12_2, Shader 6.7, OpenGL 4.6, OpenCL 2.1, Vulkan 1.3DirectX 12_1, OpenGL 4.4DirectX 12 (FL 11_1), OpenGL 4.3
Stromverbrauch15 Watt
Herstellungsprozess6 nm14 nm14 nm
FeaturesTiled Rasterization, Shared Memory (up to Dual-Channel LPDDR5)QuickSyncQuickSync
Erscheinungsdatum20.09.2022 01.09.2015 02.06.2015
Speicherbandbreite64/128 Bit64/128 Bit
SpeichertypDDR3/DDR4
CPU in Radeon 610MGPU Base SpeedGPU Boost / Turbo
AMD Ryzen 9 7945HX3D16 x 2300 MHz, 55 W400 MHz2200 MHz
AMD Ryzen 9 7945HX16 x 2500 MHz, 55 W400 MHz2200 MHz
AMD Ryzen 9 7940HX16 x 2400 MHz, 55 W400 MHz2200 MHz
min. - max.? - 400 MHz1900 - 2200 MHz
CPU in HD Graphics P530GPU Base SpeedGPU Boost / Turbo
Intel Xeon E3-1535M v54 x 2900 MHz, 45 W350 MHz1050 MHz
Intel Xeon E3-1505M v54 x 2800 MHz, 45 W350 MHz1050 MHz
min. - max.350 - 400 MHz1050 - 2200 MHz
CPU in HD Graphics 5600GPU Base SpeedGPU Boost / Turbo
Intel Core i7-5700HQ4 x 2700 MHz, 47 W300 MHz1050 MHz

Benchmarks

Performance Rating - 3DMark 11 + Fire Strike + Time Spy - Radeon 610M
0.9 pt (3%)
Performance Rating - 3DMark 11 + Fire Strike + Time Spy - HD Graphics 5600
0.4 pt (1%)
3DMark - 3DMark Time Spy Score
min: 261     avg: 593     median: 665 (2%)     max: 779 Points
3DMark - 3DMark Time Spy Graphics
min: 224     avg: 511     median: 575.5 (2%)     max: 669 Points
3DMark - 3DMark Ice Storm Unlimited Graphics
min: 160598     avg: 164666     median: 164666 (17%)     max: 168733 Points
3DMark - 3DMark Ice Storm Extreme Graphics
min: 52873     avg: 58478     median: 55839 (7%)     max: 66722 Points
3DMark - 3DMark Cloud Gate Score
min: 9212     avg: 14055     median: 14915.5 (16%)     max: 17177 Points
7499 Points (8%)
3DMark - 3DMark Cloud Gate Graphics
min: 11389     avg: 13772     median: 13897.5 (4%)     max: 15902 Points
7757 Points (2%)
3DMark - 3DMark Fire Strike Standard Score
min: 760     avg: 1655     median: 1851 (3%)     max: 2156 Points
944 Points (2%)
3DMark - 3DMark Fire Strike Standard Graphics
min: 781     avg: 1754     median: 1965 (2%)     max: 2305 Points
991 Points (1%)
3DMark - 3DMark Ice Storm Graphics
min: 37716     avg: 77947     median: 78111.5 (9%)     max: 117848 Points
79039 Points (9%)
3DMark - 3DMark Night Raid
10405 Points (10%)
3DMark - 3DMark Night Raid Graphics Score
9640 Points (4%)
3DMark 11 - 3DM11 Performance Score
min: 1227     avg: 2916     median: 3254.5 (5%)     max: 3929 Points
1651 Points (2%)
3DMark 11 - 3DM11 Performance GPU
min: 1029     avg: 2539     median: 2863 (2%)     max: 3399 Points
1431 Points (1%)
3DMark Vantage
3DM Vant. Perf. total + AMD Radeon 610M
3DMark Vantage - 3DM Vant. Perf. total
min: 3575     avg: 9244     median: 12065 (3%)     max: 12092 Points
3DM Vant. Perf. GPU no PhysX + AMD Radeon 610M
3DMark Vantage - 3DM Vant. Perf. GPU no PhysX
min: 2705     avg: 7128     median: 9322 (5%)     max: 9358 Points
3DMark 05 - 3DMark 05 - Standard
36628 Points (40%)
3DMark 06 3DMark 06 - Standard 1280x1024 + AMD Radeon 610M
3DMark 06
min: 7195     avg: 16168     median: 20555 (27%)     max: 20755 Points
Unigine Valley 1.0 - Unigine Valley 1.0 DX
10 fps (3%)
SPECviewperf 12
specvp12 sw-03 + AMD Radeon 610M
SPECviewperf 12 - specvp12 sw-03
68.6 fps (17%)
specvp12 snx-02 + AMD Radeon 610M
SPECviewperf 12 - specvp12 snx-02
30.1 fps (4%)
specvp12 showcase-01 + AMD Radeon 610M
SPECviewperf 12 - specvp12 showcase-01
13.8 fps (3%)
specvp12 mediacal-01 + AMD Radeon 610M
SPECviewperf 12 - specvp12 mediacal-01
10.1 fps (3%)
specvp12 maya-04 + AMD Radeon 610M
SPECviewperf 12 - specvp12 maya-04
24.7 fps (7%)
specvp12 catia-04 + AMD Radeon 610M
SPECviewperf 12 - specvp12 catia-04
27.6 fps (5%)
specvp12 3dsmax-05 + AMD Radeon 610M
SPECviewperf 12 - specvp12 3dsmax-05
27 fps (5%)
SPECviewperf 13 specvp13 sw-04 + AMD Radeon 610M
SPECviewperf 13 - specvp13 sw-04
74 fps (20%)
specvp13 snx-03 + AMD Radeon 610M
SPECviewperf 13 - specvp13 snx-03
55.3 fps (6%)
specvp13 showcase-02 + AMD Radeon 610M
SPECviewperf 13 - specvp13 showcase-02
13.8 fps (3%)
specvp13 maya-05 + AMD Radeon 610M
SPECviewperf 13 - specvp13 maya-05
41.1 fps (5%)
specvp13 energy-02 + AMD Radeon 610M
SPECviewperf 13 - specvp13 energy-02
2.4 fps (1%)
specvp13 catia-05 + AMD Radeon 610M
SPECviewperf 13 - specvp13 catia-05
36.7 fps (4%)
specvp13 3dsmax-06 + AMD Radeon 610M
SPECviewperf 13 - specvp13 3dsmax-06
26.7 fps (5%)
SPECviewperf 2020 specvp2020 snx-04 1080p + AMD Radeon 610M
SPECviewperf 2020 - specvp2020 snx-04 1080p
54.1 fps (9%)
specvp2020 medical-03 1080p + AMD Radeon 610M
SPECviewperf 2020 - specvp2020 medical-03 1080p
6.1 fps (4%)
specvp2020 maya-06 1080p + AMD Radeon 610M
SPECviewperf 2020 - specvp2020 maya-06 1080p
46.5 fps (5%)
specvp2020 energy-03 1080p + AMD Radeon 610M
SPECviewperf 2020 - specvp2020 energy-03 1080p
2.5 fps (2%)
specvp2020 creo-03 1080p + AMD Radeon 610M
SPECviewperf 2020 - specvp2020 creo-03 1080p
27.2 fps (13%)
specvp2020 catia-06 1080p + AMD Radeon 610M
SPECviewperf 2020 - specvp2020 catia-06 1080p
14 fps (9%)
specvp2020 3dsmax-07 1080p + AMD Radeon 610M
SPECviewperf 2020 - specvp2020 3dsmax-07 1080p
11.2 fps (4%)
specvp2020 snx-04 4k + AMD Radeon 610M
SPECviewperf 2020 - specvp2020 snx-04 4k
30.6 fps (3%)
specvp2020 medical-03 4k + AMD Radeon 610M
SPECviewperf 2020 - specvp2020 medical-03 4k
1.8 fps (2%)
specvp2020 energy-03 4k + AMD Radeon 610M
SPECviewperf 2020 - specvp2020 energy-03 4k
1.6 fps (0%)
specvp2020 creo-03 4k + AMD Radeon 610M
SPECviewperf 2020 - specvp2020 creo-03 4k
12.9 fps (6%)
specvp2020 catia-06 4k + AMD Radeon 610M
SPECviewperf 2020 - specvp2020 catia-06 4k
11.1 fps (7%)
Cinebench R10 Cinebench R10 Shading (32bit) + AMD Radeon 610M
Cinebench R10 - Cinebench R10 Shading (32bit)
min: 11925     avg: 14363     median: 15509 (11%)     max: 15655 Points
Cinebench R10 Shading (32bit) + Intel HD Graphics 5600
7445 Points (5%)
Cinebench R11.5 Cinebench R11.5 OpenGL 64 Bit + Intel HD Graphics 5600
Cinebench R11.5 - Cinebench R11.5 OpenGL 64 Bit
41.2 fps (14%)
Cinebench R15
Cinebench R15 OpenGL 64 Bit + AMD Radeon 610M
Cinebench R15 - Cinebench R15 OpenGL 64 Bit
min: 61.8     avg: 85.5     median: 92.7 (5%)     max: 94.82 fps
Cinebench R15 OpenGL 64 Bit + Intel HD Graphics 5600
37.9 fps (2%)
Cinebench R15 OpenGL Ref. Match 64 Bit + AMD Radeon 610M
Cinebench R15 - Cinebench R15 OpenGL Ref. Match 64 Bit
min: 97.8     avg: 97.9     median: 97.9 (98%)     max: 97.9 %
Basemark GPU 1.2 - Basemark GPU 1.2 Vulkan Official Medium Offscreen 1080
min: 85.9     avg: 98.4     median: 104.6 (1%)     max: 104.6 fps
Basemark GPU 1.2 - Basemark GPU 1.2 Vulkan Official High Offscreen 2160
min: 3.64     avg: 4.7     median: 4.7 (1%)     max: 5.7 fps
Geekbench 6.2 - Geekbench 6.2 GPU OpenCL
min: 5686     avg: 5838     median: 5838 (2%)     max: 5990 Points
Geekbench 6.2 - Geekbench 6.2 GPU Vulkan
min: 7866     avg: 7914     median: 7914 (2%)     max: 7962 Points
LuxMark v2.0 64Bit - LuxMark v2.0 Room GPU
min: 82     avg: 190.7     median: 120 (1%)     max: 370 Samples/s
LuxMark v2.0 64Bit - LuxMark v2.0 Sala GPU
min: 142     avg: 325     median: 233 (0%)     max: 600 Samples/s
ComputeMark v2.1 - ComputeMark v2.1 Result
min: 517     avg: 1259     median: 1629 (2%)     max: 1632 Points
Power Consumption - Furmark Stress Test Power Consumption - external Monitor *
min: 20.3     avg: 50.1     median: 50.1 (7%)     max: 79.9 Watt
57.8 Watt (8%)
Power Consumption - The Witcher 3 Power Consumption - external Monitor *
min: 17.3     avg: 48.6     median: 59.4 (8%)     max: 69 Watt
44.6 Watt (6%)
Power Consumption - Witcher 3 Power Consumption *
20.5 Watt (5%)
Power Consumption - Witcher 3 ultra Power Efficiency
0.3 fps per Watt (24%)
Power Consumption - Witcher 3 ultra Power Efficiency - external Monitor
min: 0.113     avg: 0.2     median: 0.1 (12%)     max: 0.3156 fps per Watt
Power Consumption - Cyberpunk 2077 Power Consumption - external Monitor *
81.2 Watt (10%)
Emissions Witcher 3 Fan Noise + AMD Radeon 610M
Emissions - Witcher 3 Fan Noise
36.1 dB(A) (58%)

Average Benchmarks AMD Radeon 610M → 0% n=0

Average Benchmarks Intel HD Graphics 5600 → 0% n=0

- Bereich der Benchmarkergebnisse für diese Grafikkarte
- Durchschnittliche Benchmarkergebnisse für diese Grafikkarte
* Smaller numbers mean a higher performance
1 This benchmark is not used for the average calculation

Spiele-Benchmarks

Die folgenden Benchmarks basieren auf unseren Spieletests mit Testnotebooks. Die Performance dieser Grafikkarte bei den gelisteten Spielen ist abhängig von der verwendeten CPU, Speicherausstattung, Treiber und auch Betriebssystem. Dadurch müssen die untenstehenden Werte nicht repräsentativ sein. Detaillierte Informationen über das verwendete System sehen Sie nach einem Klick auf den fps-Wert.

low 1920x1080
100%
Radeon 610M:
10.5  fps
med. 1920x1080
100%
Radeon 610M:
7.3  fps
low 1920x1080
100%
Radeon 610M:
10.5  fps
med. 1920x1080
100%
Radeon 610M:
8.2  fps
low 1920x1080
100%
Radeon 610M:
16.3 18.1 ~ 17 fps
med. 1920x1080
100%
Radeon 610M:
12.8 14.5 ~ 14 fps
high 1920x1080
100%
Radeon 610M:
8.4 9.2 ~ 9 fps
ultra 1920x1080
100%
Radeon 610M:
6.9  fps
low 1280x720
100%
Radeon 610M:
38.1 40.3 ~ 39 fps
med. 1920x1080
100%
Radeon 610M:
14.3 14.9 ~ 15 fps
high 1920x1080
100%
Radeon 610M:
8.4 9 ~ 9 fps
ultra 1920x1080
100%
Radeon 610M:
6.4 6.5 ~ 6 fps
low 1280x720
100%
Radeon 610M:
32 35 ~ 34 fps
med. 1920x1080
100%
Radeon 610M:
15 17 ~ 16 fps
high 1920x1080
100%
Radeon 610M:
14 16 ~ 15 fps
ultra 1920x1080
100%
Radeon 610M:
12 14 ~ 13 fps
low 1280x720
100%
Radeon 610M:
25.1 28.4 ~ 27 fps
med. 1920x1080
100%
Radeon 610M:
10.6 11.8 ~ 11 fps
high 1920x1080
100%
Radeon 610M:
7.7 8.4 ~ 8 fps
ultra 1920x1080
100%
Radeon 610M:
6.4 7 ~ 7 fps
low 1280x720
HD Graphics 5600:
15.1  fps
Hitman 2

Hitman 2

2018
low 1280x720
HD Graphics 5600:
10.4  fps
low 1280x720
100%
Radeon 610M:
35.7 40 ~ 38 fps
med. 1920x1080
100%
Radeon 610M:
12.5 14 ~ 13 fps
high 1920x1080
100%
Radeon 610M:
11.5 12.6 ~ 12 fps
ultra 1920x1080
100%
Radeon 610M:
9.4 10.5 ~ 10 fps
Strange Brigade

Strange Brigade

2018
low 1280x720
100%
Radeon 610M:
20.9 38.9 67.7 ~ 43 fps
med. 1920x1080
100%
Radeon 610M:
13.4 18.8 21.4 ~ 18 fps
high 1920x1080
100%
Radeon 610M:
10.8 14.3 17 ~ 14 fps
ultra 1920x1080
100%
Radeon 610M:
9.6 12 ~ 11 fps
Far Cry 5

Far Cry 5

2018
low 1280x720
100%
Radeon 610M:
25 34 ~ 30 fps
med. 1920x1080
100%
Radeon 610M:
13 15 ~ 14 fps
high 1920x1080
100%
Radeon 610M:
12 14 ~ 13 fps
ultra 1920x1080
100%
Radeon 610M:
11 13 ~ 12 fps
low 1280x720
100%
Radeon 610M:
26.7 39.8 44.7 ~ 37 fps
med. 1920x1080
100%
Radeon 610M:
17.7 23.5 26.2 ~ 22 fps
high 1920x1080
100%
Radeon 610M:
14.8 20.8 22.9 ~ 20 fps
low 1280x720
100%
Radeon 610M:
25.6 25.9 26.8 ~ 26 fps
33%
HD Graphics 5600:
8.7  fps
med. 1920x1080
100%
Radeon 610M:
11.4 12.3 ~ 12 fps
high 1920x1080
100%
Radeon 610M:
8 8.8 ~ 8 fps
FIFA 18

FIFA 18

2017
low 1280x720
HD Graphics 5600:
71  fps
med. 1920x1080
HD Graphics 5600:
0 (!)  fps
low 1280x720
HD Graphics 5600:
103  fps
med. 1366x768
HD Graphics 5600:
94  fps
high 1920x1080
HD Graphics 5600:
42  fps
ultra 1920x1080
HD Graphics 5600:
15.4  fps
Dirt 4

Dirt 4

2017
low 1280x720
HD Graphics 5600:
39.7  fps
low 1280x720
HD Graphics 5600:
55.2  fps
med. 1920x1080
HD Graphics 5600:
28.6  fps
low 1280x720
HD Graphics 5600:
17.1  fps
For Honor

For Honor

2017
low 1280x720
HD Graphics 5600:
21.9  fps
med. 1920x1080
HD Graphics 5600:
8.5  fps
low 1280x720
HD Graphics 5600:
14.9  fps
med. 1366x768
HD Graphics 5600:
12.3  fps
low 1280x720
HD Graphics 5600:
0 (!)  fps
med. 1366x768
HD Graphics 5600:
45.5  fps
high 1920x1080
HD Graphics 5600:
18.1  fps
low 1280x720
HD Graphics 5600:
29.8  fps
med. 1366x768
HD Graphics 5600:
19.3  fps
high 1920x1080
HD Graphics 5600:
8.8  fps
ultra 1920x1080
HD Graphics 5600:
7.6  fps
Mafia 3

Mafia 3

2016
low 1280x720
HD Graphics 5600:
8.3  fps
FIFA 17

FIFA 17

2016
low 1280x720
HD Graphics 5600:
68 (!)  fps
med. 1366x768
HD Graphics 5600:
50.4 (!)  fps
high 1920x1080
HD Graphics 5600:
28.1 (!)  fps
Overwatch

Overwatch

2016
low 1280x720
HD Graphics 5600:
40  fps
med. 1366x768
HD Graphics 5600:
28  fps
low 1280x768
HD Graphics 5600:
5.8  fps
low 1280x720
HD Graphics 5600:
17.4  fps
low 1280x720
HD Graphics 5600:
16  fps
med. 1920x1080
HD Graphics 5600:
8  fps
XCOM 2

XCOM 2

2016
low 1280x720
HD Graphics 5600:
15.8  fps
low 1024x768
HD Graphics 5600:
0 (!)  fps
low 1024x768
HD Graphics 5600:
0 (!)  fps
Fallout 4

Fallout 4

2015
low 1280x720
HD Graphics 5600:
17.9  fps
low 1024x768
HD Graphics 5600:
31.2  fps
med. 1366x768
HD Graphics 5600:
18.5  fps
FIFA 16

FIFA 16

2015
low 1280x720
HD Graphics 5600:
70  fps
high 1366x768
HD Graphics 5600:
39.8  fps
ultra 1920x1080
HD Graphics 5600:
20.8  fps
low 1366x768
HD Graphics 5600:
74  fps
med. 1366x768
HD Graphics 5600:
48  fps
high 1920x1080
HD Graphics 5600:
22.9  fps
ultra 1920x1080
HD Graphics 5600:
16.5  fps
low 1024x768
HD Graphics 5600:
31.2  fps
med. 1366x768
HD Graphics 5600:
20.7  fps
high 1920x1080
HD Graphics 5600:
7.2  fps
Mad Max

Mad Max

2015
med. 1366x768
HD Graphics 5600:
16.4  fps
high 1920x1080
HD Graphics 5600:
7.6  fps
low 1280x720
100%
Radeon 610M:
81.6  fps
med. 1366x768
100%
Radeon 610M:
50.9  fps
high 1920x1080
100%
Radeon 610M:
23.4  fps
ultra 1920x1080
100%
Radeon 610M:
23  fps
low 1280x720
HD Graphics 5600:
12  fps
med. 1366x768
HD Graphics 5600:
9  fps
high 1920x1080
HD Graphics 5600:
5  fps
low 1024x768
100%
Radeon 610M:
26.5 44 44.5 ~ 38 fps
39%
HD Graphics 5600:
14.7  fps
med. 1366x768
100%
Radeon 610M:
17.5 26.2 27 ~ 24 fps
40%
HD Graphics 5600:
9.6  fps
high 1920x1080
100%
Radeon 610M:
7.6 13.5 13.9 ~ 12 fps
47%
HD Graphics 5600:
5.6  fps
ultra 1920x1080
100%
Radeon 610M:
5.5 7.8 8.5 ~ 7 fps
44%
HD Graphics 5600:
3.1  fps
low 1024x768
HD Graphics 5600:
112.7  fps
med. 1366x768
HD Graphics 5600:
27.4  fps
high 1920x1080
HD Graphics 5600:
12.9  fps
ultra 1920x1080
HD Graphics 5600:
12.5  fps
GTA V

GTA V

2015
low 1024x768
100%
Radeon 610M:
57.2 62.7 119.9 131.2 134.5 ~ 101 fps
med. 1366x768
100%
Radeon 610M:
49.8 99.5 101.9 ~ 84 fps
high 1920x1080
100%
Radeon 610M:
12.7 21.6 23.1 ~ 19 fps
ultra 1920x1080
100%
Radeon 610M:
4.9 9.6 10.5 ~ 8 fps
low 1024x768
HD Graphics 5600:
37.8  fps
med. 1366x768
HD Graphics 5600:
26.8  fps
high 1920x1080
HD Graphics 5600:
10.8  fps
ultra 1920x1080
HD Graphics 5600:
6  fps
Evolve

Evolve

2015
low 1024x768
HD Graphics 5600:
19  fps
med. 1366x768
HD Graphics 5600:
13.5  fps
high 1920x1080
HD Graphics 5600:
7.7  fps
ultra 1920x1080
HD Graphics 5600:
6.7  fps
low 1024x768
HD Graphics 5600:
32.1  fps
med. 1366x768
HD Graphics 5600:
20.3  fps
high 1920x1080
HD Graphics 5600:
7.2  fps
ultra 1920x1080
HD Graphics 5600:
4.2  fps
Far Cry 4

Far Cry 4

2014
low 1024x768
HD Graphics 5600:
22.5  fps
med. 1366x768
HD Graphics 5600:
16.3  fps
high 1920x1080
HD Graphics 5600:
8.4  fps
ultra 1920x1080
HD Graphics 5600:
6.3  fps
low 1024x768
HD Graphics 5600:
0 (!)  fps
med. 1366x768
HD Graphics 5600:
0 (!)  fps
high 1920x1080
HD Graphics 5600:
0 (!)  fps
ultra 1920x1080
HD Graphics 5600:
0 (!)  fps
low 1024x768
HD Graphics 5600:
44.6  fps
med. 1366x768
HD Graphics 5600:
21.8  fps
high 1920x1080
HD Graphics 5600:
9.9  fps
ultra 1920x1080
HD Graphics 5600:
5.2  fps
F1 2014

F1 2014

2014
low 1024x768
HD Graphics 5600:
74  fps
med. 1366x768
HD Graphics 5600:
49  fps
high 1920x1080
HD Graphics 5600:
25  fps
ultra 1920x1080
HD Graphics 5600:
15  fps
low 1024x768
HD Graphics 5600:
21.8  fps
med. 1366x768
HD Graphics 5600:
14  fps
high 1920x1080
HD Graphics 5600:
6.7  fps
ultra 1920x1080
HD Graphics 5600:
6.3  fps
low 1024x768
HD Graphics 5600:
45.3  fps
med. 1366x768
HD Graphics 5600:
28.3  fps
high 1920x1080
HD Graphics 5600:
14.4  fps
ultra 1920x1080
HD Graphics 5600:
10.5  fps
low 1280x720
HD Graphics 5600:
32  fps
med. 1344x756
HD Graphics 5600:
19.9  fps
high 1920x1080
HD Graphics 5600:
10.5  fps
ultra 1920x1080
HD Graphics 5600:
8.3  fps
Fifa 15

Fifa 15

2014
low 1280x720
HD Graphics 5600:
65.3  fps
high 1366x768
HD Graphics 5600:
45.7  fps
ultra 1920x1080
HD Graphics 5600:
24.7  fps
Sims 4

Sims 4

2014
low 1024x768
HD Graphics 5600:
187.4  fps
med. 1366x768
HD Graphics 5600:
52.6  fps
high 1920x1080
HD Graphics 5600:
25.2  fps
ultra 1920x1080
HD Graphics 5600:
16.8  fps
low 1024x768
HD Graphics 5600:
101.1  fps
med. 1366x768
HD Graphics 5600:
44.9  fps
high 1920x1080
HD Graphics 5600:
22.9  fps
ultra 1920x1080
HD Graphics 5600:
12.5  fps
low 1024x768
HD Graphics 5600:
30.3  fps
med. 1366x768
HD Graphics 5600:
17.9  fps
high 1920x1080
HD Graphics 5600:
5.9  fps
ultra 1920x1080
HD Graphics 5600:
3.8  fps
Thief

Thief

2014
low 1024x768
HD Graphics 5600:
27.7  fps
med. 1366x768
HD Graphics 5600:
15.9  fps
high 1366x768
HD Graphics 5600:
12.7  fps
ultra 1920x1080
HD Graphics 5600:
6.1  fps
low 1024x768
HD Graphics 5600:
46.9  fps
med. 1366x768
HD Graphics 5600:
30.9  fps
high 1366x768
HD Graphics 5600:
18.6  fps
ultra 1920x1080
HD Graphics 5600:
6  fps
low 1024x768
HD Graphics 5600:
32.9  fps
med. 1366x768
HD Graphics 5600:
24  fps
high 1366x768
HD Graphics 5600:
15.8  fps
ultra 1920x1080
HD Graphics 5600:
7.5  fps
low 1280x720
HD Graphics 5600:
57.6  fps
med. 1366x768
HD Graphics 5600:
30.3  fps
high 1366x768
HD Graphics 5600:
25  fps
ultra 1920x1080
HD Graphics 5600:
7.5  fps
low 1024x768
HD Graphics 5600:
81.6  fps
med. 1366x768
HD Graphics 5600:
39.4  fps
high 1366x768
HD Graphics 5600:
25  fps
ultra 1920x1080
HD Graphics 5600:
11.4  fps
Crysis 3

Crysis 3

2013
low 1024x768
HD Graphics 5600:
30.8  fps
med. 1366x768
HD Graphics 5600:
18.8  fps
high 1366x768
HD Graphics 5600:
12.4  fps
ultra 1920x1080
HD Graphics 5600:
4.7  fps

Average Gaming AMD Radeon 610M → 100%

Average Gaming 30-70 fps → 100%

Average Gaming Intel HD Graphics 5600 → 41%

AMD Radeon 610Mlowmed.highultraQHD4K
Cyberpunk 2077 2.1 Phantom Liberty10.57.27
Baldur's Gate 310.58.18
Tiny Tina's Wonderlands171496.92
Borderlands 3391596
Far Cry New Dawn34161513
Metro Exodus271187
Shadow of the Tomb Raider38131210
Strange Brigade43181411
Far Cry 530141312
X-Plane 11.11372220
Final Fantasy XV Benchmark26128
Dota 2 Reborn81.650.923.423
The Witcher 33824127
GTA V10184198
< 30 fps
< 60 fps
< 120 fps
≥ 120 fps
5
7
2
12
1
1
12


10


Intel HD Graphics 5600lowmed.highultraQHD4K
Fallout 7615.1
Hitman 210.4
Final Fantasy XV Benchmark8.7
FIFA 1871
Team Fortress 2103944215.4
Dirt 439.7
Rocket League55.228.6
Mass Effect Andromeda17.1
For Honor21.98.5
Watch Dogs 214.912.3
Dishonored 2
Farming Simulator 1745.518.1
Battlefield 129.819.38.87.6
Mafia 38.3
FIFA 176850.428.1
Overwatch4028
Ashes of the Singularity5.8
The Division17.4
Far Cry Primal168
XCOM 215.8
Rise of the Tomb Raider0
Just Cause 30
Fallout 417.9
Call of Duty: Black Ops 331.218.5
FIFA 167039.820.8
World of Warships744822.916.5
Metal Gear Solid V31.220.77.2
Mad Max16.47.6
Batman: Arkham Knight1295
The Witcher 314.79.65.63.1
Dirt Rally112.727.412.912.5
Battlefield Hardline37.826.810.86
Evolve1913.57.76.7
Dragon Age: Inquisition32.120.37.24.2
Far Cry 422.516.38.46.3
Assassin's Creed Unity0000
Call of Duty: Advanced Warfare44.621.89.95.2
F1 201474492515
Ryse: Son of Rome21.8146.76.3
Alien: Isolation45.328.314.410.5
Middle-earth: Shadow of Mordor3219.910.58.3
Fifa 1565.345.724.7
Sims 4187.452.625.216.8
GRID: Autosport101.144.922.912.5
Watch Dogs30.317.95.93.8
Thief27.715.912.76.1
Battlefield 446.930.918.66
Metro: Last Light32.92415.87.5
BioShock Infinite57.630.3257.5
Tomb Raider81.639.42511.4
Crysis 330.818.812.44.7
< 30 fps
< 60 fps
< 120 fps
≥ 120 fps
19
15
10
1
24
9
1
27
3

25


Eine Liste mit weiteren Spielen und allen Grafikkarten finden Sie auf unserer Seite: Welches Spiel ist mit welcher Grafikkarte spielbar?

v1.28
log 18. 06:33:48

#0 ran 0s before starting gpusingle class +0s ... 0s

#1 checking url part for id 11423 +0s ... 0s

#2 checking url part for id 6452 +0s ... 0s

#3 checking url part for id 5949 +0s ... 0s

#4 redirected to Ajax server, took 1729226028s time from redirect:0 +0s ... 0s

#5 did not recreate cache, as it is less than 5 days old! Created at Wed, 16 Oct 2024 05:17:20 +0200 +0s ... 0s

#6 composed specs +0.004s ... 0.004s

#7 did output specs +0s ... 0.004s

#8 start showIntegratedCPUs +0s ... 0.004s

#9 getting avg benchmarks for device 11423 +0.012s ... 0.017s

#10 got single benchmarks 11423 +0.001s ... 0.018s

#11 getting avg benchmarks for device 6452 +0s ... 0.018s

#12 got single benchmarks 6452 +0s ... 0.018s

#13 getting avg benchmarks for device 5949 +0.001s ... 0.019s

#14 got single benchmarks 5949 +0s ... 0.019s

#15 got avg benchmarks for devices +0s ... 0.019s

#16 min, max, avg, median took s +0.019s ... 0.039s

#17 before gaming benchmark output +0s ... 0.039s

#18 Got 250 rows for game benchmarks. +0.012s ... 0.05s

#19 composed SQL query for gamebenchmarks +0s ... 0.05s

#20 got data and put it in $dataArray +0.002s ... 0.052s

#21 benchmarks composed for output. +0.016s ... 0.069s

#22 calculated avg scores. +0s ... 0.069s

#23 return log +0s ... 0.069s

Teilen Sie diesen Artikel, um uns zu unterstützen. Jeder Link hilft!
> Notebook Test, Laptop Test und News > Benchmarks / Technik > Benchmarks / Technik > Grafikkarten Vergleich - Head 2 Head
Autor: Klaus Hinum,  8.09.2017 (Update:  1.07.2023)