Notebookcheck Logo

AMD Radeon 610M vs Intel HD Graphics 2500 vs AMD Radeon Graphics (Ryzen 7000)

AMD Radeon 610M

► remove from comparison AMD Radeon 610M

Die AMD Radeon 610M (oder RX 610M) ist eine integrierte Grafikkarte (iGPU) für Notebooks. Sie befindet sich in den Einstiegs-Mendocino-APUs (Ryzen 7020 Serie) und bietet nur 2 CUs (128 Shader) . Sie nutzt die aktuelle RDNA 2 Architektur (wie die RX 6000M Serie). Die Taktrate ist abhängig vom CPU-Modell. Die GPU hat keinen eigenen Grafikspeicher, sondern nutzt den gemeinsamen Hauptspeicher (LPDDR5). Die 610M unterstützt vier Displayoutputs und kann AV1 Videos dekodieren.

Die Leistung der GPU ist abhängig von der CPU, dem konfiguriertem TDP (8 - 15W), der Kühlung und dem verbautem Hauptspeicher. 

Der Stromverbrauch ist dank 6nm Prozess und ausgeklügelten Stromsparmechanismen relativ gering (laut AMD) und daher eignet sich die Grafikkarte auch für sehr dünne und leichte Notebooks.

Intel HD Graphics 2500

► remove from comparison Intel HD Graphics 2500

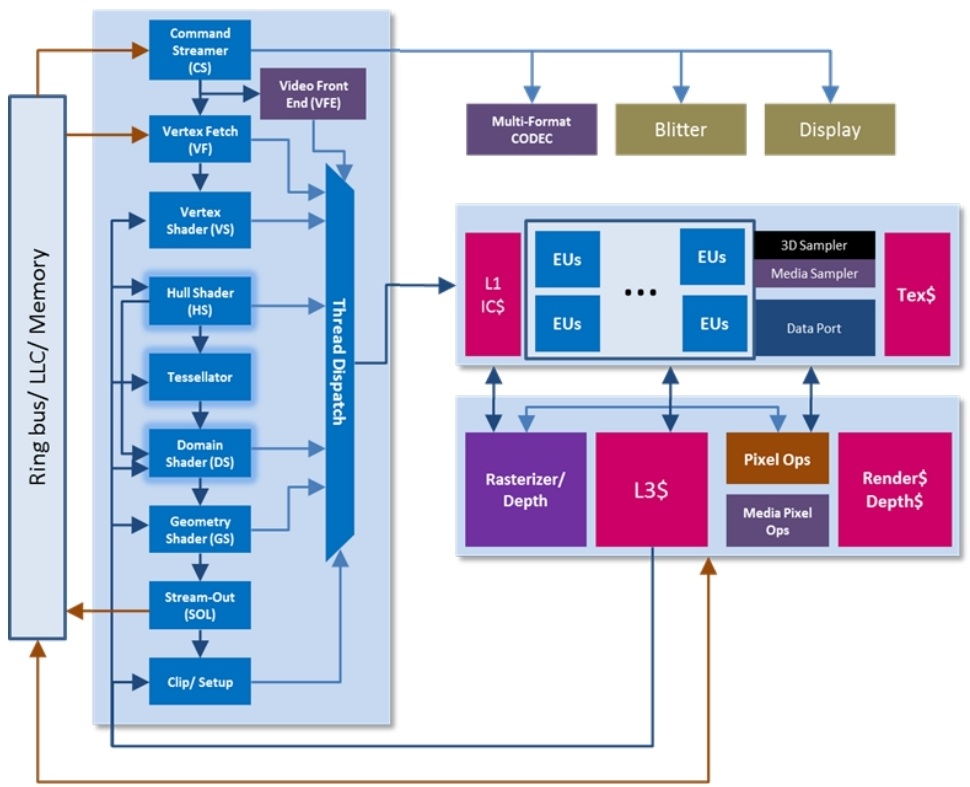
Die Intel HD Graphics 2500 (oder Ivy Bridge GT1) ist eine in den Ivy Bridge Prozessoren integrierte Grafikkarte. Sie kommt ausschließlich in Desktop CPUs zum Einsatz. Das mobile Pendant nennt sich schlicht Intel HD Graphics. Im Vergleich zur stärkeren Intel HD Graphics 4000 ist die HD 2500 deutlich abgespeckt und bietet weniger Execution Units (6 EUs) und Texture Sampler (nur einer). Daher ist die Performance deutlich geringer und nur etwas oberhalb der alten Intel HD Graphics 2000. Je nach Prozessor weist die HD Graphics 2500 eine unterschiedliche Basis- und Turbo-Taktrate auf.

Da die Leistung nur zwischen der HD Graphics 2000 und 3000 liegt (siehe Benchmarks), reicht die HD Graphics 2500 nur für ältere und anspruchslose Spiele aus. Im Konkurrenzvergleich entspricht die Performance etwa den integrierten Einstiegslösungen von AMD, zum Beispiel der Radeon HD 8210.

Eine Besonderheit der Ivy Bride Grafikkerne ist, das nur 4x MSAA von der Hardware unterstützt wird. 2x MSAA wird per Software berechnet und geht durch die 4x MSAA Pipeline. Daher empfiehlt sich der Einsatz des gleich schnellen 4x MSAA. 

Auch der integrierte Videodecoder genannt Multi Format Codec Engine (MFX) wurde kräftig überarbeitet und soll nun sogar mehrere 4K Videos parallel dekodieren können (ev. nur in den High-End Modellen). DXVA Checker gibt weiterhin die Formate MPEG2, VC1, WMV9 und H264 als unterstütz an. QuickSync zum schnellen Transkodieren von Videos wurde ebenfalls verbessert und soll nun schneller bei gleichzeitig höherer Qualität laufen.

Ebenfalls neu ist die Unterstützung für drei unabhängige Bildschirme. Bis Sandy Bridge waren nur zwei möglich und lediglich die AMD Grafikkarten mit Eyefinity Support bieten mehr als zwei Anschlüsse für Notebooks (jedoch nur mit DisplayPorts). 

Aufgrund der Integration in den mit 22nm gefertigten Prozessor und die halbierte Shaderzahl ist der Stromverbrauch relativ gering.

AMD Radeon Graphics (Ryzen 7000)

► remove from comparison AMD Radeon Graphics (Ryzen 7000)

Die AMD Radeon Graphics der Ryzen 7000 Desktop CPUs ist eine integrierte Grafikkarte (iGPU) mit 2 CUs (128 Shader). Sie befindet sich in den Ryzen 7000 Prozessoren und nutzt wie die Radeon 610M die aktuelle RDNA 2 Architektur. Je nach Prozessormodell taktet sie von 400 - 2200 MHz. Weiters integriert die GPU auch eine AMD Video Coding Engine (VCE) um H.264 und H.265 10/8bpc enkodieren und AV1, VP9, H.265, H.264 in 10 und 8bpc dekodieren zu können.

AMD Radeon 610MIntel HD Graphics 2500AMD Radeon Graphics (Ryzen 7000)
AMD Radeon 600M Serie
Radeon 680M 768 @ 2.4 GHz
Radeon 660M 384 @ 1.9 GHz
Radeon Graphics (Ryzen 7000) 128 @ 2.2 GHz
Radeon 610M 128 @ 0.4 - 2.2 GHz
HD Graphics P530 24 @ 0.35 - 1.05 GHz64/128 Bit
HD Graphics 5600 24 @ 0.3 - 1.05 GHz64/128 Bit
HD Graphics 6000 48 @ 0.3 - 1 GHz64/128 Bit
HD Graphics 4600 20 @ 0.2 - 1.35 GHz64/128 Bit
HD Graphics 5500 24 @ 0.3 - 0.95 GHz64/128 Bit
HD Graphics 5000 40 @ 0.2 - 1.1 GHz64/128 Bit
HD Graphics 4400 20 @ 0.2 - 1.1 GHz64/128 Bit
HD Graphics 5300 24 @ 0.1 - 0.9 GHz64/128 Bit
HD Graphics 4000 16 @ 0.35 - 1.35 GHz64/128 Bit
HD Graphics (Broadwell) 12 @ 0.1 - 0.85 GHz64/128 Bit
HD Graphics 4200 20 @ 0.2 - 0.85 GHz64/128 Bit
HD Graphics (Skylake) 12 @ 0.3 - 0.8 GHz64/128 Bit
HD Graphics 405 (Braswell) 16 @ 0.32 - 0.7 GHz64/128 Bit
HD Graphics (Braswell) 16 @ 0.32 - 0.7 GHz64/128 Bit
HD Graphics 400 (Braswell) 12 @ 0.32 - 0.64 GHz64/128 Bit
HD Graphics (Haswell) 10 @ 0.2 - 1 GHz64/128 Bit
HD Graphics (Cherry Trail) 16 @ 0.2 - 0.6 GHz64/128 Bit
HD Graphics 3000 12 @ 0.35 - 1.35 GHz64/128 Bit
HD Graphics 2500 6 @ 0.65 - 1.15 GHz64/128 Bit
HD Graphics (Ivy Bridge) 6 @ 0.35 - 1.1 GHz64/128 Bit
HD Graphics 2000 6 @ 0.85 - 1.35 GHz64/128 Bit
HD Graphics (Sandy Bridge) 6 @ 0.35 - 1.1 GHz64/128 Bit
HD Graphics (Bay Trail) 4 @ 0.31 - 0.9 GHz32/64/128 Bit
Radeon 680M 768 @ 2.4 GHz
Radeon 660M 384 @ 1.9 GHz
Radeon Graphics (Ryzen 7000) 128 @ 2.2 GHz
Radeon 610M 128 @ 0.4 - 2.2 GHz
CodenameRDNA 2Ivy Bridge GT1Raphael
ArchitekturRDNA 2Gen. 7 Ivy BridgeRDNA 2
Pipelines128 - unified6 - unified128 - unified
TMUs88
ROPs44
Raytracing Cores21
Kerntakt400 - 2200 (Boost) MHz650 - 1150 (Boost) MHz2200 (Boost) MHz
Shared Memoryneinjaja
APIDirectX 12_2, Shader 6.7, OpenGL 4.6, OpenCL 2.1, Vulkan 1.3DirectX 11.0, Shader 5.0DirectX 12_2, OpenGL 4.6
Stromverbrauch15 Watt
Herstellungsprozess6 nm22 nm6 nm
FeaturesTiled Rasterization, Shared Memory (up to Dual-Channel LPDDR5)
Erscheinungsdatum20.09.2022 01.04.2012 26.09.2022
Speicherbandbreite64/128 Bit
Notebookgrößegroß (17" z.B.)
Transistors3.4 Billion
Die Size 122 mm²
CPU in Radeon 610MGPU Base SpeedGPU Boost / Turbo
AMD Ryzen 9 7945HX3D16 x 2300 MHz, 55 W400 MHz2200 MHz
AMD Ryzen 9 7945HX16 x 2500 MHz, 55 W400 MHz2200 MHz
AMD Ryzen 9 7940HX16 x 2400 MHz, 55 W400 MHz2200 MHz
min. - max.? - 400 MHz1900 - 2200 MHz
CPU in HD Graphics 2500GPU Base SpeedGPU Boost / Turbo
Intel Core i5-35504 x 3300 MHz, 77 W650 MHz1150 MHz
Intel Core i5-34704 x 3200 MHz, 77 W650 MHz1100 MHz
Intel Core i3-32202 x 3300 MHz, 55 W650 MHz1050 MHz
min. - max.650 MHz1050 - 2200 MHz
CPU in Radeon Graphics (Ryzen 7000)GPU Base SpeedGPU Boost / Turbo
AMD Ryzen 9 7950X16 x 4500 MHz, 170 W400 MHz2200 MHz
AMD Ryzen 9 7950X3D16 x 4200 MHz, 120 W400 MHz2200 MHz
AMD Ryzen 9 7900X12 x 4700 MHz, 170 W? MHz? MHz
min. - max.400 - 650 MHz2200 MHz

Benchmarks

Performance Rating - 3DMark 11 + Fire Strike + Time Spy - Radeon 610M
0.9 pt (3%)
Performance Rating - 3DMark 11 + Fire Strike + Time Spy - HD Graphics 2500
0.1 pt (0%)
Performance Rating - 3DMark 11 + Fire Strike + Time Spy - Radeon Graphics (Ryzen 7000)
1.1 pt (3%)
3DMark - 3DMark Time Spy Score
min: 261     avg: 593     median: 665 (2%)     max: 779 Points
min: 817     avg: 831     median: 831 (2%)     max: 845 Points
3DMark - 3DMark Time Spy Graphics
min: 224     avg: 511     median: 575.5 (2%)     max: 669 Points
min: 705     avg: 715     median: 715 (2%)     max: 725 Points
3DMark - 3DMark Ice Storm Unlimited Graphics
min: 160598     avg: 164666     median: 164666 (17%)     max: 168733 Points
159603 Points (16%)
3DMark - 3DMark Ice Storm Extreme Graphics
min: 52873     avg: 58478     median: 55839 (7%)     max: 66722 Points
min: 59739     avg: 64109     median: 66294 (8%)     max: 66294 Points
3DMark - 3DMark Cloud Gate Score
min: 9212     avg: 14055     median: 14915.5 (16%)     max: 17177 Points
min: 1906     avg: 2659     median: 2817 (3%)     max: 3095 Points
min: 15883     avg: 16468     median: 16760 (18%)     max: 16760 Points
3DMark - 3DMark Cloud Gate Graphics
min: 11389     avg: 13772     median: 13897.5 (4%)     max: 15902 Points
min: 2301     avg: 2584     median: 2604.5 (1%)     max: 2825 Points
min: 14990     avg: 15161     median: 15247 (4%)     max: 15247 Points
3DMark - 3DMark Fire Strike Standard Score
min: 760     avg: 1655     median: 1851 (3%)     max: 2156 Points
min: 257     avg: 293.3     median: 294.5 (1%)     max: 327 Points
min: 2183     avg: 2211     median: 2211 (4%)     max: 2239 Points
3DMark - 3DMark Fire Strike Standard Graphics
min: 781     avg: 1754     median: 1965 (2%)     max: 2305 Points
min: 289     avg: 319.5     median: 318 (0%)     max: 353 Points
min: 2287     avg: 2338     median: 2337.5 (3%)     max: 2388 Points
3DMark - 3DMark Ice Storm Graphics
min: 37716     avg: 77947     median: 78111.5 (9%)     max: 117848 Points
min: 21978     avg: 23693     median: 24058 (3%)     max: 24676 Points
min: 90272     avg: 97292     median: 100802 (12%)     max: 100802 Points
3DMark - 3DMark Night Raid
10405 Points (10%)
10411 Points (10%)
3DMark - 3DMark Night Raid Graphics Score
9640 Points (4%)
10021 Points (4%)
3DMark 11 - 3DM11 Performance Score
min: 1227     avg: 2916     median: 3254.5 (5%)     max: 3929 Points
min: 374     avg: 419     median: 430 (1%)     max: 449 Points
min: 3466     avg: 3636     median: 3466 (5%)     max: 3977 Points
3DMark 11 - 3DM11 Performance GPU
min: 1029     avg: 2539     median: 2863 (2%)     max: 3399 Points
min: 321     avg: 349     median: 350.5 (0%)     max: 374 Points
min: 3026     avg: 3170     median: 3026 (3%)     max: 3458 Points
3DMark Vantage
3DM Vant. Perf. total + AMD Radeon 610M
3DMark Vantage - 3DM Vant. Perf. total
min: 3575     avg: 9244     median: 12065 (3%)     max: 12092 Points
3DM Vant. Perf. total + Intel HD Graphics 2500
min: 1375     avg: 1849     median: 1930.5 (1%)     max: 2068 Points
3DM Vant. Perf. total + AMD Radeon Graphics (Ryzen 7000)
min: 11455     avg: 11703     median: 11703 (3%)     max: 11951 Points
3DM Vant. Perf. GPU no PhysX + AMD Radeon 610M
3DMark Vantage - 3DM Vant. Perf. GPU no PhysX
min: 2705     avg: 7128     median: 9322 (5%)     max: 9358 Points
3DM Vant. Perf. GPU no PhysX + Intel HD Graphics 2500
min: 1115     avg: 1369     median: 1400.5 (1%)     max: 1561 Points
3DM Vant. Perf. GPU no PhysX + AMD Radeon Graphics (Ryzen 7000)
min: 8837     avg: 9054     median: 9053.5 (5%)     max: 9270 Points
3DMark 2001SE - 3DMark 2001 - Standard
20814 Points (22%)
3DMark 03 - 3DMark 03 - Standard
10138 Points (5%)
3DMark 05 - 3DMark 05 - Standard
36628 Points (40%)
min: 6341     avg: 6627     median: 6627 (7%)     max: 6913 Points
min: 36694     avg: 37469     median: 37468.5 (41%)     max: 38243 Points
3DMark 06 3DMark 06 - Standard 1280x1024 + AMD Radeon 610M
3DMark 06
min: 7195     avg: 16168     median: 20555 (27%)     max: 20755 Points
3DMark 06 - Standard 1280x1024 + Intel HD Graphics 2500
min: 3300     avg: 3933     median: 3816 (5%)     max: 4442 Points
3DMark 06 - Standard 1280x1024 + AMD Radeon Graphics (Ryzen 7000)
min: 20707     avg: 21111     median: 21110.5 (28%)     max: 21514 Points
Unigine Valley 1.0 - Unigine Valley 1.0 DX
10 fps (3%)
9.9 fps (3%)
SPECviewperf 11
specvp11 snx-01 + Intel HD Graphics 2500
SPECviewperf 11 - specvp11 snx-01
1.6 fps (1%)
specvp11 tcvis-02 + Intel HD Graphics 2500
SPECviewperf 11 - specvp11 tcvis-02
2.7 fps (2%)
specvp11 sw-02 + Intel HD Graphics 2500
SPECviewperf 11 - specvp11 sw-02
6.8 fps (5%)
specvp11 proe-05 + Intel HD Graphics 2500
SPECviewperf 11 - specvp11 proe-05
1.9 fps (2%)
specvp11 maya-03 + Intel HD Graphics 2500
SPECviewperf 11 - specvp11 maya-03
12.9 fps (10%)
specvp11 lightwave-01 + Intel HD Graphics 2500
SPECviewperf 11 - specvp11 lightwave-01
15.6 fps (17%)
specvp11 ensight-04 + Intel HD Graphics 2500
SPECviewperf 11 - specvp11 ensight-04
2.4 fps (1%)
specvp11 catia-03 + Intel HD Graphics 2500
SPECviewperf 11 - specvp11 catia-03
0 fps (0%)
SPECviewperf 12
specvp12 sw-03 + AMD Radeon 610M
SPECviewperf 12 - specvp12 sw-03
68.6 fps (17%)
specvp12 snx-02 + AMD Radeon 610M
SPECviewperf 12 - specvp12 snx-02
30.1 fps (4%)
specvp12 showcase-01 + AMD Radeon 610M
SPECviewperf 12 - specvp12 showcase-01
13.8 fps (3%)
specvp12 mediacal-01 + AMD Radeon 610M
SPECviewperf 12 - specvp12 mediacal-01
10.1 fps (3%)
specvp12 maya-04 + AMD Radeon 610M
SPECviewperf 12 - specvp12 maya-04
24.7 fps (7%)
specvp12 catia-04 + AMD Radeon 610M
SPECviewperf 12 - specvp12 catia-04
27.6 fps (5%)
specvp12 3dsmax-05 + AMD Radeon 610M
SPECviewperf 12 - specvp12 3dsmax-05
27 fps (5%)
SPECviewperf 13 specvp13 sw-04 + AMD Radeon 610M
SPECviewperf 13 - specvp13 sw-04
74 fps (20%)
specvp13 snx-03 + AMD Radeon 610M
SPECviewperf 13 - specvp13 snx-03
55.3 fps (6%)
specvp13 showcase-02 + AMD Radeon 610M
SPECviewperf 13 - specvp13 showcase-02
13.8 fps (3%)
specvp13 maya-05 + AMD Radeon 610M
SPECviewperf 13 - specvp13 maya-05
41.1 fps (5%)
specvp13 energy-02 + AMD Radeon 610M
SPECviewperf 13 - specvp13 energy-02
2.4 fps (1%)
specvp13 catia-05 + AMD Radeon 610M
SPECviewperf 13 - specvp13 catia-05
36.7 fps (4%)
specvp13 3dsmax-06 + AMD Radeon 610M
SPECviewperf 13 - specvp13 3dsmax-06
26.7 fps (5%)
SPECviewperf 2020 specvp2020 snx-04 1080p + AMD Radeon 610M
SPECviewperf 2020 - specvp2020 snx-04 1080p
54.1 fps (9%)
specvp2020 medical-03 1080p + AMD Radeon 610M
SPECviewperf 2020 - specvp2020 medical-03 1080p
6.1 fps (4%)
specvp2020 maya-06 1080p + AMD Radeon 610M
SPECviewperf 2020 - specvp2020 maya-06 1080p
46.5 fps (5%)
specvp2020 energy-03 1080p + AMD Radeon 610M
SPECviewperf 2020 - specvp2020 energy-03 1080p
2.5 fps (2%)
specvp2020 creo-03 1080p + AMD Radeon 610M
SPECviewperf 2020 - specvp2020 creo-03 1080p
27.2 fps (13%)
specvp2020 catia-06 1080p + AMD Radeon 610M
SPECviewperf 2020 - specvp2020 catia-06 1080p
14 fps (9%)
specvp2020 3dsmax-07 1080p + AMD Radeon 610M
SPECviewperf 2020 - specvp2020 3dsmax-07 1080p
11.2 fps (4%)
specvp2020 snx-04 4k + AMD Radeon 610M
SPECviewperf 2020 - specvp2020 snx-04 4k
30.6 fps (3%)
specvp2020 medical-03 4k + AMD Radeon 610M
SPECviewperf 2020 - specvp2020 medical-03 4k
1.8 fps (2%)
specvp2020 energy-03 4k + AMD Radeon 610M
SPECviewperf 2020 - specvp2020 energy-03 4k
1.6 fps (0%)
specvp2020 creo-03 4k + AMD Radeon 610M
SPECviewperf 2020 - specvp2020 creo-03 4k
12.9 fps (6%)
specvp2020 catia-06 4k + AMD Radeon 610M
SPECviewperf 2020 - specvp2020 catia-06 4k
11.1 fps (7%)
Cinebench R10 Cinebench R10 Shading (32bit) + AMD Radeon 610M
Cinebench R10 - Cinebench R10 Shading (32bit)
min: 11925     avg: 14363     median: 15509 (11%)     max: 15655 Points
Cinebench R10 Shading (32bit) + Intel HD Graphics 2500
min: 3409     avg: 5543     median: 6037 (4%)     max: 6687 Points
Cinebench R10 Shading (32bit) + AMD Radeon Graphics (Ryzen 7000)
min: 6826     avg: 15239     median: 17737.5 (13%)     max: 18855 Points
Cinebench R11.5 Cinebench R11.5 OpenGL 64 Bit + Intel HD Graphics 2500
Cinebench R11.5 - Cinebench R11.5 OpenGL 64 Bit
min: 9.09     avg: 10.6     median: 10.8 (4%)     max: 11.98 fps
Cinebench R11.5 OpenGL 64 Bit + AMD Radeon Graphics (Ryzen 7000)
min: 198.52     avg: 203     median: 205 (67%)     max: 205.43 fps
Cinebench R15
Cinebench R15 OpenGL 64 Bit + AMD Radeon 610M
Cinebench R15 - Cinebench R15 OpenGL 64 Bit
min: 61.8     avg: 85.5     median: 92.7 (5%)     max: 94.82 fps
Cinebench R15 OpenGL 64 Bit + AMD Radeon Graphics (Ryzen 7000)
min: 97.22     avg: 158.8     median: 101.4 (6%)     max: 359.59 fps
Cinebench R15 OpenGL Ref. Match 64 Bit + AMD Radeon 610M
Cinebench R15 - Cinebench R15 OpenGL Ref. Match 64 Bit
min: 97.8     avg: 97.9     median: 97.9 (98%)     max: 97.9 %
Cinebench R15 OpenGL Ref. Match 64 Bit + AMD Radeon Graphics (Ryzen 7000)
min: 97.9     avg: 98.3     median: 97.9 (98%)     max: 99.6 %
Basemark GPU 1.2 - Basemark GPU 1.2 Vulkan Official Medium Offscreen 1080
min: 85.9     avg: 98.4     median: 104.6 (1%)     max: 104.6 fps
1992 fps (13%)
Basemark GPU 1.2 - Basemark GPU 1.2 Vulkan Official High Offscreen 2160
min: 3.64     avg: 4.7     median: 4.7 (1%)     max: 5.7 fps
176.8 fps (40%)
Geekbench 6.2 - Geekbench 6.2 GPU OpenCL
min: 5686     avg: 5838     median: 5838 (2%)     max: 5990 Points
6167 Points (2%)
Geekbench 6.2 - Geekbench 6.2 GPU Vulkan
min: 7866     avg: 7914     median: 7914 (2%)     max: 7962 Points
8032 Points (2%)
LuxMark v2.0 64Bit - LuxMark v2.0 Room GPU
min: 82     avg: 190.7     median: 120 (1%)     max: 370 Samples/s
min: 30     avg: 31     median: 31 (0%)     max: 32 Samples/s
257 Samples/s (1%)
LuxMark v2.0 64Bit - LuxMark v2.0 Sala GPU
min: 142     avg: 325     median: 233 (0%)     max: 600 Samples/s
min: 47     avg: 50     median: 50 (0%)     max: 53 Samples/s
583 Samples/s (1%)
ComputeMark v2.1 - ComputeMark v2.1 Result
min: 517     avg: 1259     median: 1629 (2%)     max: 1632 Points
min: 282     avg: 287.3     median: 286 (0%)     max: 294 Points
1616 Points (2%)
Power Consumption - Furmark Stress Test Power Consumption - external Monitor *
min: 20.3     avg: 50.1     median: 50.1 (7%)     max: 79.9 Watt
Power Consumption - The Witcher 3 Power Consumption - external Monitor *
min: 17.3     avg: 48.6     median: 59.4 (8%)     max: 69 Watt
Power Consumption - Witcher 3 Power Consumption *
20.5 Watt (5%)
Power Consumption - Witcher 3 ultra Power Efficiency
0.3 fps per Watt (24%)
Power Consumption - Witcher 3 ultra Power Efficiency - external Monitor
min: 0.113     avg: 0.2     median: 0.1 (12%)     max: 0.3156 fps per Watt
Power Consumption - Cyberpunk 2077 Power Consumption - external Monitor *
81.2 Watt (10%)
Emissions Witcher 3 Fan Noise + AMD Radeon 610M
Emissions - Witcher 3 Fan Noise
36.1 dB(A) (58%)

Average Benchmarks AMD Radeon 610M → 100% n=15

Average Benchmarks Intel HD Graphics 2500 → 20% n=15

Average Benchmarks AMD Radeon Graphics (Ryzen 7000) → 125% n=15

- Bereich der Benchmarkergebnisse für diese Grafikkarte
- Durchschnittliche Benchmarkergebnisse für diese Grafikkarte
* Smaller numbers mean a higher performance
1 This benchmark is not used for the average calculation

Spiele-Benchmarks

Die folgenden Benchmarks basieren auf unseren Spieletests mit Testnotebooks. Die Performance dieser Grafikkarte bei den gelisteten Spielen ist abhängig von der verwendeten CPU, Speicherausstattung, Treiber und auch Betriebssystem. Dadurch müssen die untenstehenden Werte nicht repräsentativ sein. Detaillierte Informationen über das verwendete System sehen Sie nach einem Klick auf den fps-Wert.

low 1920x1080
100%
Radeon 610M:
10.5  fps
med. 1920x1080
100%
Radeon 610M:
7.3  fps
low 1920x1080
100%
Radeon 610M:
10.5  fps
med. 1920x1080
100%
Radeon 610M:
8.2  fps
low 1920x1080
100%
Radeon 610M:
16.3 18.1 ~ 17 fps
med. 1920x1080
100%
Radeon 610M:
12.8 14.5 ~ 14 fps
high 1920x1080
100%
Radeon 610M:
8.4 9.2 ~ 9 fps
ultra 1920x1080
100%
Radeon 610M:
6.9  fps
F1 2021

F1 2021

2021
low 1280x720
Radeon Graphics (Ryzen 7000):
46.3  fps
med. 1920x1080
Radeon Graphics (Ryzen 7000):
18.3  fps
high 1920x1080
Radeon Graphics (Ryzen 7000):
15  fps
ultra 1920x1080
Radeon Graphics (Ryzen 7000):
5.7  fps
F1 2020

F1 2020

2020
low 1280x720
Radeon Graphics (Ryzen 7000):
49.7  fps
med. 1920x1080
Radeon Graphics (Ryzen 7000):
18.7  fps
high 1920x1080
Radeon Graphics (Ryzen 7000):
13.7  fps
ultra 1920x1080
Radeon Graphics (Ryzen 7000):
8.7  fps
low 1280x720
100%
Radeon 610M:
38.1 40.3 ~ 39 fps
med. 1920x1080
100%
Radeon 610M:
14.3 14.9 ~ 15 fps
high 1920x1080
100%
Radeon 610M:
8.4 9 ~ 9 fps
ultra 1920x1080
100%
Radeon 610M:
6.4 6.5 ~ 6 fps
low 1280x720
100%
Radeon 610M:
32 35 ~ 34 fps
med. 1920x1080
100%
Radeon 610M:
15 17 ~ 16 fps
high 1920x1080
100%
Radeon 610M:
14 16 ~ 15 fps
ultra 1920x1080
100%
Radeon 610M:
12 14 ~ 13 fps
low 1280x720
100%
Radeon 610M:
25.1 28.4 ~ 27 fps
med. 1920x1080
100%
Radeon 610M:
10.6 11.8 ~ 11 fps
high 1920x1080
100%
Radeon 610M:
7.7 8.4 ~ 8 fps
ultra 1920x1080
100%
Radeon 610M:
6.4 7 ~ 7 fps
low 1280x720
100%
Radeon 610M:
35.7 40 ~ 38 fps
med. 1920x1080
100%
Radeon 610M:
12.5 14 ~ 13 fps
high 1920x1080
100%
Radeon 610M:
11.5 12.6 ~ 12 fps
ultra 1920x1080
100%
Radeon 610M:
9.4 10.5 ~ 10 fps
Strange Brigade

Strange Brigade

2018
low 1280x720
100%
Radeon 610M:
20.9 38.9 67.7 ~ 43 fps
126%
Radeon Graphics (Ryzen 7000):
54  fps
med. 1920x1080
100%
Radeon 610M:
13.4 18.8 21.4 ~ 18 fps
97%
Radeon Graphics (Ryzen 7000):
17.4  fps
high 1920x1080
100%
Radeon 610M:
10.8 14.3 17 ~ 14 fps
81%
Radeon Graphics (Ryzen 7000):
11.4  fps
ultra 1920x1080
100%
Radeon 610M:
9.6 12 ~ 11 fps
82%
Radeon Graphics (Ryzen 7000):
9  fps
Far Cry 5

Far Cry 5

2018
low 1280x720
100%
Radeon 610M:
25 34 ~ 30 fps
med. 1920x1080
100%
Radeon 610M:
13 15 ~ 14 fps
high 1920x1080
100%
Radeon 610M:
12 14 ~ 13 fps
ultra 1920x1080
100%
Radeon 610M:
11 13 ~ 12 fps
low 1280x720
100%
Radeon 610M:
26.7 39.8 44.7 ~ 37 fps
116%
Radeon Graphics (Ryzen 7000):
35.9 49.8 ~ 43 fps
med. 1920x1080
100%
Radeon 610M:
17.7 23.5 26.2 ~ 22 fps
118%
Radeon Graphics (Ryzen 7000):
23 29.2 ~ 26 fps
high 1920x1080
100%
Radeon 610M:
14.8 20.8 22.9 ~ 20 fps
115%
Radeon Graphics (Ryzen 7000):
20.5 25.9 ~ 23 fps
low 1280x720
100%
Radeon 610M:
25.6 25.9 26.8 ~ 26 fps
88%
Radeon Graphics (Ryzen 7000):
19.3 26.1 ~ 23 fps
med. 1920x1080
100%
Radeon 610M:
11.4 12.3 ~ 12 fps
133%
Radeon Graphics (Ryzen 7000):
12.2 19.3 ~ 16 fps
high 1920x1080
100%
Radeon 610M:
8 8.8 ~ 8 fps
88%
Radeon Graphics (Ryzen 7000):
5.7 8.9 ~ 7 fps
low 1280x720
100%
Radeon 610M:
81.6  fps
232%
Radeon Graphics (Ryzen 7000):
157.8 219.5 ~ 189 fps
med. 1366x768
100%
Radeon 610M:
50.9  fps
149%
Radeon Graphics (Ryzen 7000):
61.8 89.9 ~ 76 fps
high 1920x1080
100%
Radeon 610M:
23.4  fps
137%
Radeon Graphics (Ryzen 7000):
25.7 38.8 ~ 32 fps
ultra 1920x1080
100%
Radeon 610M:
23  fps
126%
Radeon Graphics (Ryzen 7000):
23.6 35 ~ 29 fps
low 1024x768
100%
Radeon 610M:
26.5 44 44.5 ~ 38 fps
med. 1366x768
100%
Radeon 610M:
17.5 26.2 27 ~ 24 fps
high 1920x1080
100%
Radeon 610M:
7.6 13.5 13.9 ~ 12 fps
ultra 1920x1080
100%
Radeon 610M:
5.5 7.8 8.5 ~ 7 fps
GTA V

GTA V

2015
low 1024x768
100%
Radeon 610M:
57.2 62.7 119.9 131.2 134.5 ~ 101 fps
med. 1366x768
100%
Radeon 610M:
49.8 99.5 101.9 ~ 84 fps
high 1920x1080
100%
Radeon 610M:
12.7 21.6 23.1 ~ 19 fps
ultra 1920x1080
100%
Radeon 610M:
4.9 9.6 10.5 ~ 8 fps
low 1024x768
HD Graphics 2500:
11.1  fps
med. 1366x768
HD Graphics 2500:
9.8  fps
high 1366x768
HD Graphics 2500:
9.6  fps
low 1280x720
HD Graphics 2500:
17.7  fps
med. 1366x768
HD Graphics 2500:
8  fps
high 1366x768
HD Graphics 2500:
7  fps
low 1024x768
HD Graphics 2500:
145  fps
med. 1366x768
HD Graphics 2500:
26  fps
high 1366x768
HD Graphics 2500:
13.7  fps
ultra 1920x1080
HD Graphics 2500:
4.3  fps
SimCity

SimCity

2013
low 1024x768
HD Graphics 2500:
14.8  fps
med. 1366x768
HD Graphics 2500:
8  fps
low 1024x768
HD Graphics 2500:
20.1  fps
med. 1366x768
HD Graphics 2500:
10.9  fps
high 1366x768
HD Graphics 2500:
7.1  fps
Crysis 3

Crysis 3

2013
low 1024x768
HD Graphics 2500:
13.8  fps
low 1024x768
HD Graphics 2500:
43 46.2 ~ 45 fps
med. 1366x768
HD Graphics 2500:
18.8  fps
high 1366x768
HD Graphics 2500:
13.5  fps
ultra 1920x1080
HD Graphics 2500:
7.3  fps
Far Cry 3

Far Cry 3

2012
low 1024x768
HD Graphics 2500:
18 20.5 ~ 19 fps
med. 1366x768
HD Graphics 2500:
11.9  fps
med. 1366x768
HD Graphics 2500:
13.8  fps
low 1024x768
HD Graphics 2500:
18.4 20.1 ~ 19 fps
med. 1366x768
HD Graphics 2500:
10.7 11.6 ~ 11 fps
high 1366x768
HD Graphics 2500:
3.8  fps
ultra 1920x1080
HD Graphics 2500:
1.9  fps
low 1024x768
HD Graphics 2500:
18  fps
Fifa 13

Fifa 13

2012
low 1024x768
HD Graphics 2500:
29.7 99 101 ~ 77 fps
med. 1366x768
HD Graphics 2500:
23.6 51 52 60 ~ 47 fps
high 1366x768
HD Graphics 2500:
17.2 28 31.2 32 ~ 27 fps
ultra 1920x1080
HD Graphics 2500:
14.5  fps
F1 2012

F1 2012

2012
low 1024x768
HD Graphics 2500:
37 40 ~ 39 fps
med. 1366x768
HD Graphics 2500:
21 26 ~ 24 fps
high 1366x768
HD Graphics 2500:
21 22 ~ 22 fps
ultra 1920x1080
HD Graphics 2500:
12 12 ~ 12 fps
low 1024x768
HD Graphics 2500:
37  fps
high 1366x768
HD Graphics 2500:
8  fps
low 1024x768
HD Graphics 2500:
77 82 ~ 80 fps
med. 1366x768
HD Graphics 2500:
36 39 ~ 38 fps
high 1366x768
HD Graphics 2500:
18 20.6 ~ 19 fps
ultra 1920x1080
HD Graphics 2500:
11.7  fps
low 1024x768
HD Graphics 2500:
21.7  fps
med. 1366x768
HD Graphics 2500:
15.5  fps
Anno 2070

Anno 2070

2011
low 1024x768
HD Graphics 2500:
23.2  fps
med. 1366x768
HD Graphics 2500:
9.8  fps
high 1366x768
HD Graphics 2500:
5.2  fps
low 1024x768
HD Graphics 2500:
16.8  fps
med. 1366x768
HD Graphics 2500:
11  fps
Supreme Commander - FA Bench

Supreme Commander - FA Bench

2007
low 1024x768
HD Graphics 2500:
46  fps
med. 1024x768
HD Graphics 2500:
22.2  fps
high 1024x768
HD Graphics 2500:
18.7  fps
ultra 1920x1080
HD Graphics 2500:
7.6  fps
Crysis - GPU Benchmark

Crysis - GPU Benchmark

2007
low 1024x768
HD Graphics 2500:
48.8 52.8 ~ 51 fps
med. 1024x768
HD Graphics 2500:
20.2 21.6 ~ 21 fps
high 1024x768
HD Graphics 2500:
12  fps
ultra 1920x1080
HD Graphics 2500:
3  fps
World of Warcraft

World of Warcraft

2005
low 800x600
HD Graphics 2500:
104  fps
med. 1024x768
HD Graphics 2500:
29  fps

Average Gaming AMD Radeon 610M → 100%

Average Gaming 30-70 fps → 100%

Average Gaming AMD Radeon Graphics (Ryzen 7000) → 121%

Average Gaming 30-70 fps → 126%

AMD Radeon 610Mlowmed.highultraQHD4K
Cyberpunk 2077 2.1 Phantom Liberty10.57.27
Baldur's Gate 310.58.18
Tiny Tina's Wonderlands171496.92
Borderlands 3391596
Far Cry New Dawn34161513
Metro Exodus271187
Shadow of the Tomb Raider38131210
Strange Brigade43181411
Far Cry 530141312
X-Plane 11.11372220
Final Fantasy XV Benchmark26128
Dota 2 Reborn81.650.923.423
The Witcher 33824127
GTA V10184198
< 30 fps
< 60 fps
< 120 fps
≥ 120 fps
5
7
2
12
1
1
12


10


AMD Radeon Graphics (Ryzen 7000)lowmed.highultraQHD4K
F1 202146.318.3155.66
F1 202049.718.713.78.67
Strange Brigade5417.411.49
X-Plane 11.11432623
Final Fantasy XV Benchmark23167
Dota 2 Reborn189763229
< 30 fps
< 60 fps
< 120 fps
≥ 120 fps
1
4

1
5

1
5
1

4


Intel HD Graphics 2500lowmed.highultraQHD4K
Metro: Last Light11.079.849.64
BioShock Infinite17.6686.96
StarCraft II: Heart of the Swarm1452613.74.3
SimCity14.88
Tomb Raider20.110.97.1
Crysis 313.8
Dead Space 34518.813.57.3
Far Cry 31911.9
Assassin´s Creed III13.8
Hitman: Absolution19113.81.9
Call of Duty: Black Ops 218
Fifa 1377472714.5
F1 201239242212
Guild Wars 2378
Counter-Strike: GO80381911.7
Sleeping Dogs21.715.5
Anno 207023.159.785.23
Battlefield 316.811
Supreme Commander - FA Bench4622.218.77.6
Crysis - GPU Benchmark5121123
World of Warcraft10429
< 30 fps
< 60 fps
< 120 fps
≥ 120 fps
11
5
3
1
16
2

13


8


Eine Liste mit weiteren Spielen und allen Grafikkarten finden Sie auf unserer Seite: Welches Spiel ist mit welcher Grafikkarte spielbar?

v1.28
log 18. 06:30:45

#0 ran 0s before starting gpusingle class +0s ... 0s

#1 checking url part for id 11423 +0s ... 0s

#2 checking url part for id 2887 +0s ... 0s

#3 checking url part for id 11422 +0s ... 0s

#4 redirected to Ajax server, took 1729225845s time from redirect:0 +0s ... 0s

#5 did not recreate cache, as it is less than 5 days old! Created at Wed, 16 Oct 2024 05:17:20 +0200 +0s ... 0s

#6 composed specs +0.003s ... 0.003s

#7 did output specs +0s ... 0.003s

#8 start showIntegratedCPUs +0s ... 0.003s

#9 getting avg benchmarks for device 11423 +0.013s ... 0.016s

#10 got single benchmarks 11423 +0.001s ... 0.017s

#11 getting avg benchmarks for device 2887 +0.001s ... 0.019s

#12 got single benchmarks 2887 +0.001s ... 0.019s

#13 getting avg benchmarks for device 11422 +0.004s ... 0.023s

#14 got single benchmarks 11422 +0.008s ... 0.031s

#15 got avg benchmarks for devices +0s ... 0.031s

#16 No cached benchmark found, getting uncached values +0.019s ... 0.05s

#17 min, max, avg, median took s +0.02s ... 0.07s

#18 before gaming benchmark output +0s ... 0.07s

#19 Got 220 rows for game benchmarks. +0.013s ... 0.083s

#20 composed SQL query for gamebenchmarks +0s ... 0.083s

#21 got data and put it in $dataArray +0.001s ... 0.084s

#22 benchmarks composed for output. +0.011s ... 0.095s

#23 calculated avg scores. +0s ... 0.095s

#24 return log +0.001s ... 0.096s

Teilen Sie diesen Artikel, um uns zu unterstützen. Jeder Link hilft!
> Notebook Test, Laptop Test und News > Benchmarks / Technik > Benchmarks / Technik > Grafikkarten Vergleich - Head 2 Head
Autor: Klaus Hinum,  8.09.2017 (Update:  1.07.2023)