Notebookcheck Logo

NVIDIA RTX A500 Laptop GPU vs NVIDIA GeForce GTX 1070 Max-Q vs NVIDIA GeForce GTX 1070 Ti (Desktop)

NVIDIA RTX A500 Laptop GPU

► remove from comparison NVIDIA RTX A500 Laptop GPU

Die Nvidia RTX A500 Laptop GPU oder A500 Mobile (für Laptops) ist eine professionelle Grafikkarte für mobile Workstations. Sie basiert wie die RTX A1000 auf die Consumer RTX 3050, jedoch wurde der Speicherbus auf 64-Bit limitiert. Im Vergleich zu einer günstigeren GeForce RTX 3050 Laptop GPU mit Studio Treibern, bietet die RTX A500 zertifizierte Treiber für zahlreiche professionelle Applikationen.

Wie auch die GeForce RTX 3050 Mobile, ist auch die RTX A2000 in verschiedenen TGP-Versionen erhältlich. Diese rangieren bei der A2000 von 20 - 60 Watt. Je nach verbauter Variante unterscheiden sich die Taktraten von Chip und Speicher und damit auch deutlich die Performance.

Es gibt nun keine Max-Q Variante mehr (die 35+ Versionen heissen auch nur "Laptop GPU"), aber jede TGP-Version kann die Max-Q Technologien nutzen (Dynamic Boost, WhisperMode).

Die professionellen Grafikkarten von Nvidia bieten zertifizierte Treiber, welche auf Stabiltität und Performance bei professionellen Anwendungen (CAD-, DCC-, Medizin-, Prospektions-, Visualisierungsanwendungen) optimiert sind.

Die Leistung ist abhängig von der TGP-Variante und der verwendeten Kühlung. Bei gleichem TGP sollte sie durch den kleineren Speicherbus und geringere Taktraten etwas unterhalb der RTX A1000 liegen.

Der GA107 Chip bietet 2.560 FP32 ALUs wovon die Hälfte auch INT32 Befehle ausführen können (also 1.280 INT32 ALUs). Bei Turing konnten noch alle Shader FP32 oder INT32 ausführen. Die Raytracing und Tensor Kerne auf dem Chip wurden laut Nvidia ebenfalls verbessert. Weiters integriert der Ampere Chip einen Hardware Video-Encoder (NVENC 5. Generation für H.264 und H.265) und Decoder (7. Generation für zahlreiche Formate inklusive AV1).

Der GA107 Chip wird bei Samsung im 8nm (8N) Verfahren welches mit dem 7nm Verfahren von TSMC nicht ganz mithalten kann (z.B. von AMD genutzt, aber auch für den professionellen GA100 Ampere Chip).

NVIDIA GeForce GTX 1070 Max-Q

► remove from comparison NVIDIA GeForce GTX 1070 Max-Q

Die Nvidia GeForce GTX 1070 mit Max-Q Design ist eine mobile High-End-GPU der Pascal-Serie. Sie ist gedacht für dünne und leichte Notebook und je nach Kühlungsdesign etwa 10-15% langsamer als eine normale GTX 1070 für Laptops. Der Basistakt liegt mit 1101 - 1215 MHz deutlich unterhalb der normalen GTX 1070 (1433 MHz -10%) und auch der Boost erreicht mit 1265 - 1379 MHz (mind. -6%) bei weitem nicht die 1645 MHz der regulären GTX 1070. Der Speichertakt ist jedoch gleich.

Im Vergleich zur normalen GTX 1070 gibt es noch weitere Unterschiede als den Takt. Der Treiber wurde auf Effizienz (und nicht Leistung) optimiert (nur für die Max-Q Modelle), optimierte Spannungswandler für 1V Betreib, high-end Kühlungsmethoden und eine 40 dB Grenze für die Lüfterlautstärke (mit Taktanpasssungen um dies jederzeit zu gewährleisten) zeichnen die Max-Q Variante aus.

Features

Der GP104-Chip wird in einem 16nm-FinFET-Prozess bei TSMC gefertigt und bietet eine Reihe neuer Features, unter anderem Support für DisplayPort 1.4 (ready), HDMI 2.0b, HDR, Simultaneous Multi-Projection (SMP) sowie verbessertes H.265 Video De- und Encoding (PlayReady 3.0). Eine genaue Auflistung der Verbesserungen und Features der neuen Pascal Desktop-GPUs finden Sie in unserem Pascal-Architektur-Artikel.

Der Stromverbrauch der Max-Q Variante ist deutlich reduziert und beträgt je nach Laptopmodell zwischen 80 und 90 Watt (TGP).

NVIDIA GeForce GTX 1070 Ti (Desktop)

► remove from comparison NVIDIA GeForce GTX 1070 Ti (Desktop)

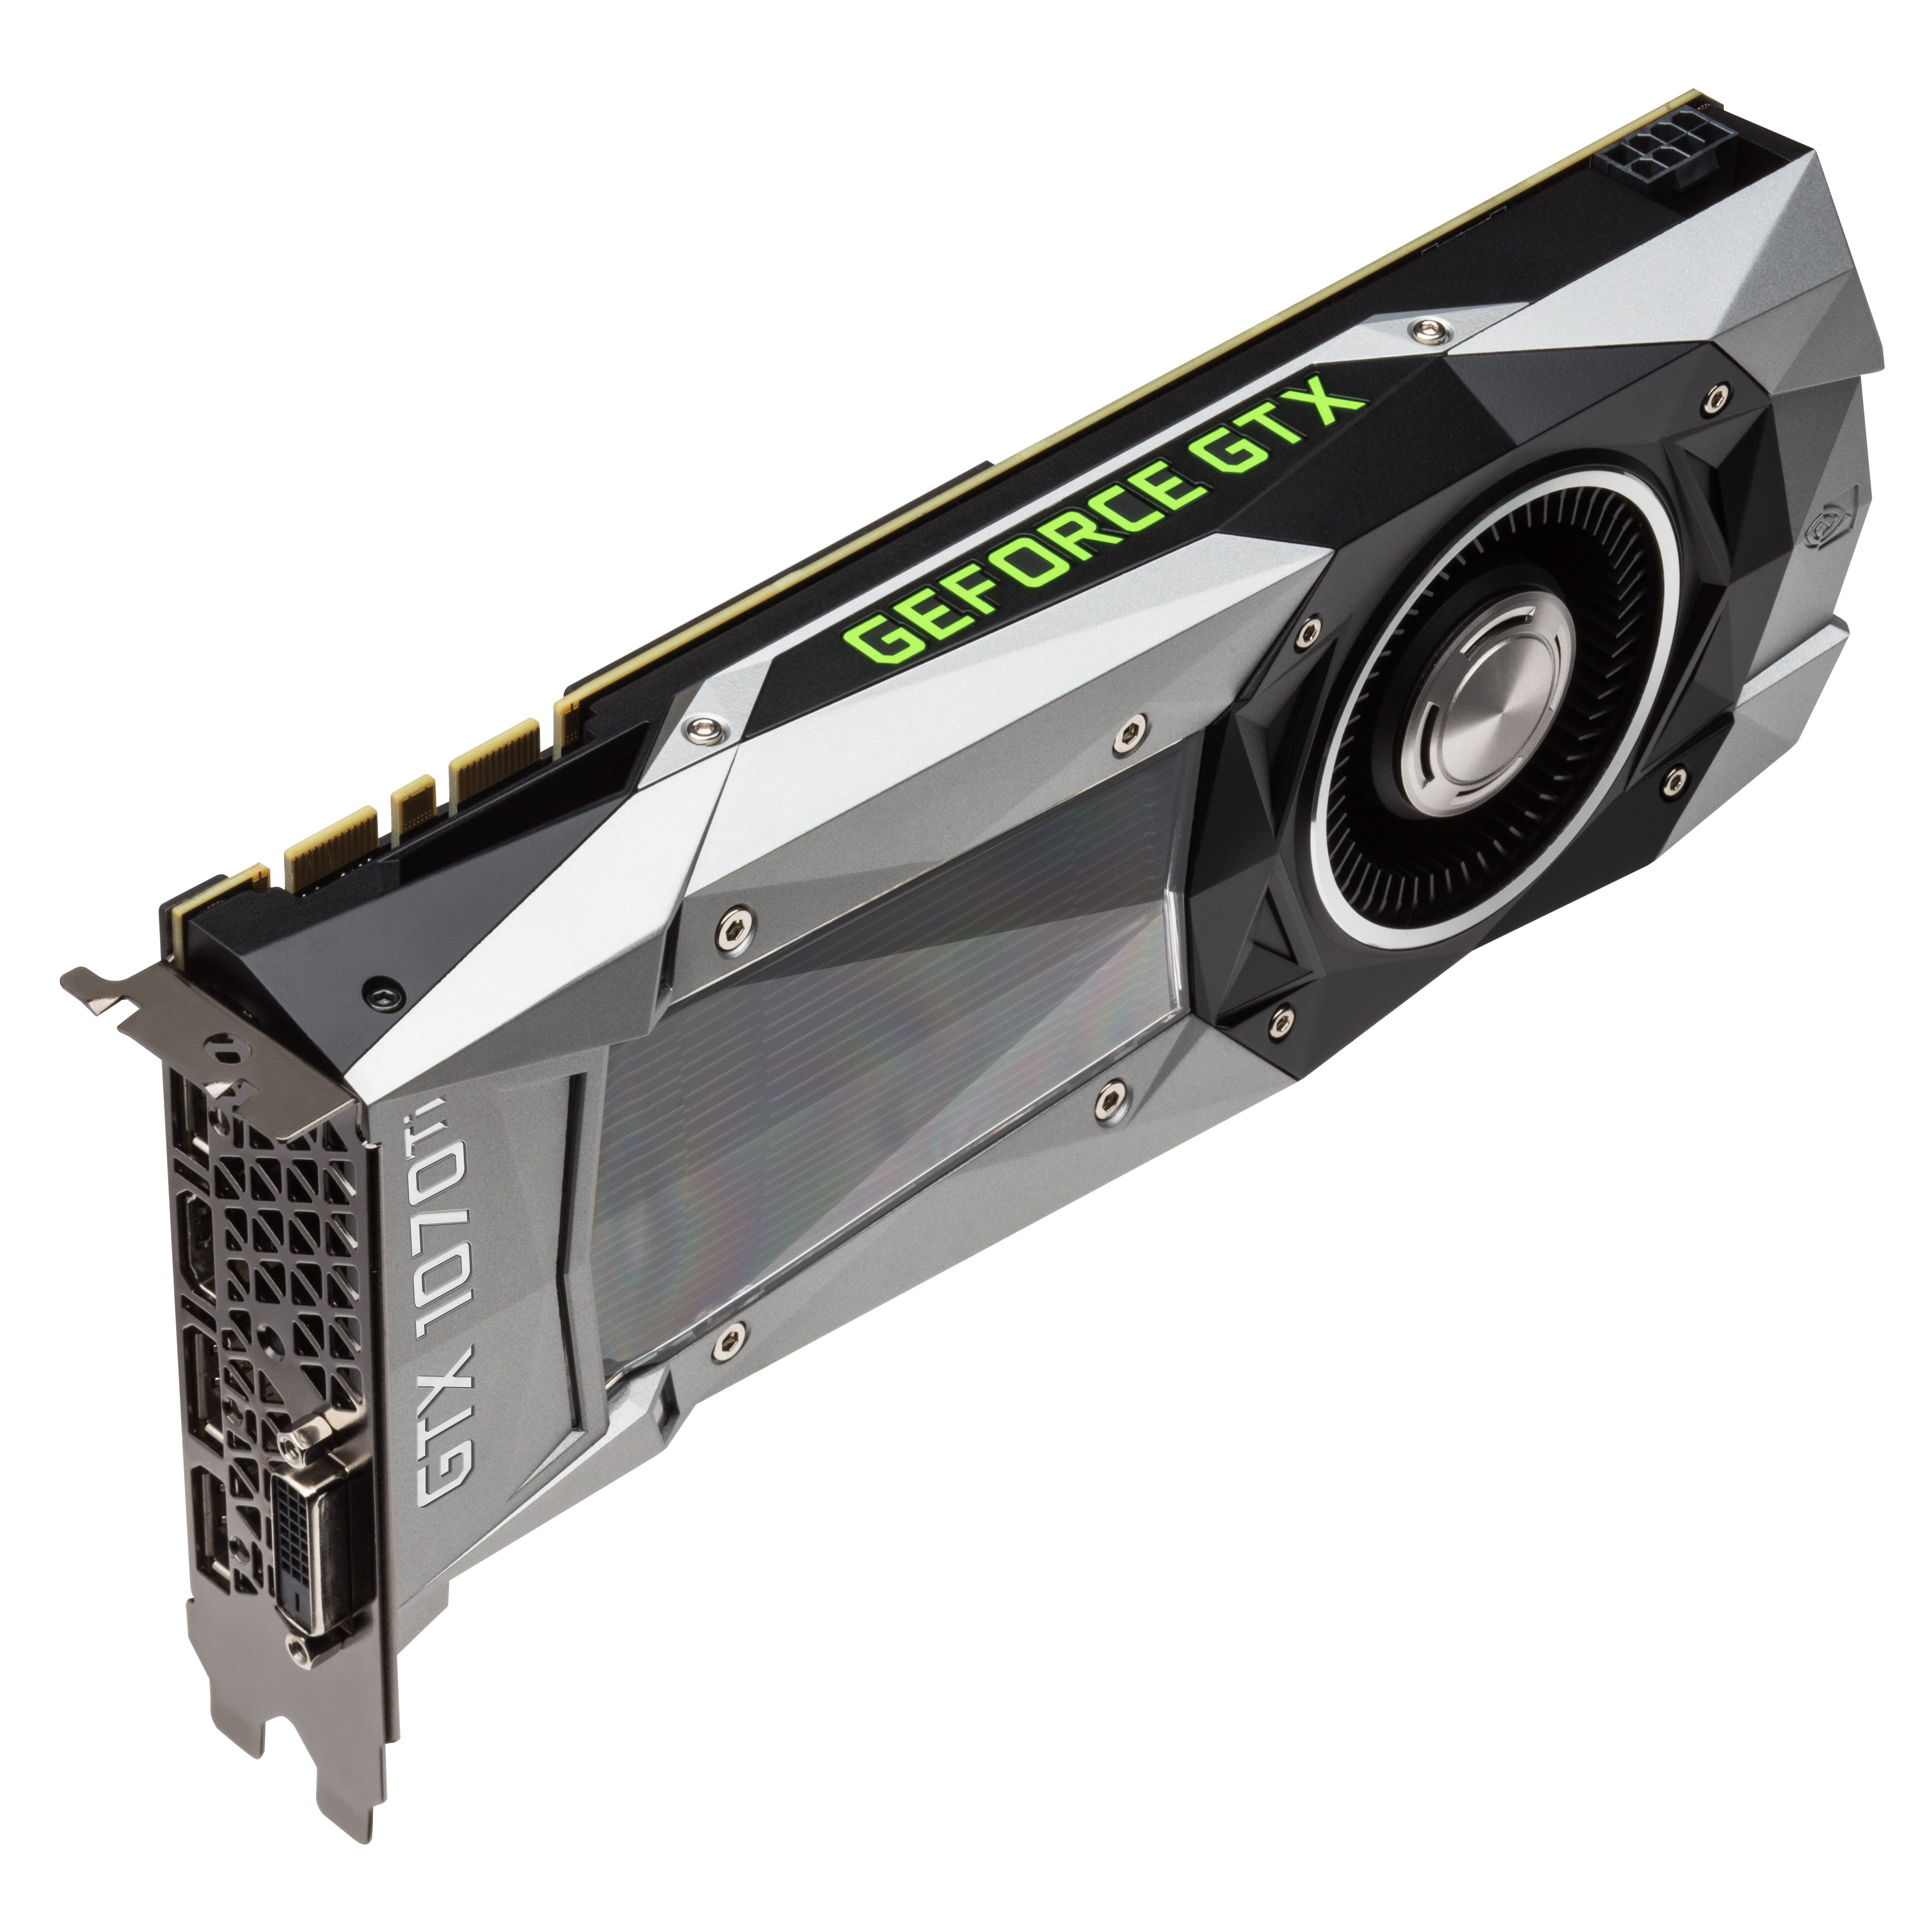
Die Nvidia GeForce GTX 1070 Ti ist eine schnelle Desktop Grafikkarte der Pascal Generation. Sie positioniert sich zwischen GTX 1070 und GTX 1080 und wurde als Konter zur Radeon Vega 56 positioniert. Die Vorstellung war im November 2017. Im Vergleich zur GTX 1070 bietet die GTX 1070 Ti mehr Shader (2.432 versus 1.920) bei gleichem Boost Takt. Der 8 GB große Grafikspeicher ist wie bei der GTX 1070 vom Typ GDDR5 und nicht GDDR5X wie bei der GTX 1080. 

Features

Der GP104-Chip wird in einem 16nm-FinFET-Prozess bei TSMC gefertigt und bietet eine Reihe neuer Features, unter anderem Support für DisplayPort 1.4 (ready), HDMI 2.0b, HDR, Simultaneous Multi-Projection (SMP) sowie verbessertes H.265 Video De- und Encoding (PlayReady 3.0). Eine genaue Auflistung der Verbesserungen und Features der neuen Pascal Desktop-GPUs finden Sie in unserem Pascal-Architektur-Artikel.

Performance

Die GeForce GTX 1070 Ti positioniert sich wenig überraschend zwischen GTX 1070 und GTX 1080. Damit eignet sich die Grafikkarte am besten für 2560x1440 mit maximalen Details für aktuelle Spiele. Anspruchslosere Spiele können auch in 4K flüssig gespielt werden.

Leistungsaufnahme

Die Leistungsaufnahme der GeForce GTX 1070 Ti wird vom Hersteller mit 180 Watt beziffert und liegt damit in einer ähnlichen Größenordnung wie die GTX 1080. In unseren Tests positioniert sich die Karte leicht darunter aber auch deutlich über der GTX 1070 (150 Watt TDP).

NVIDIA RTX A500 Laptop GPUNVIDIA GeForce GTX 1070 Max-QNVIDIA GeForce GTX 1070 Ti (Desktop)
GeForce GTX 1000 Serie
RTX A5500 Laptop GPU 7424 256 Bit @ 16000 MHz
RTX A4500 Laptop GPU 5888 @ 0.93 - 1.5 GHz256 Bit @ 16000 MHz
RTX A5000 Laptop GPU 6144 @ 1.22 - 1.77 GHz256 Bit @ 14000 MHz
RTX A4000 Laptop GPU 5120 @ 0.78 - 1.68 GHz256 Bit @ 12000 MHz
RTX A3000 Laptop GPU 4096 @ 1.08 - 1.56 GHz192 Bit @ 14000 MHz
RTX A2000 3328 @ 0.56 - 1.2 GHz192 Bit @ 12000 MHz
RTX A2000 Laptop GPU 2560 @ 0.89 - 1.69 GHz128 Bit @ 14000 MHz
RTX A1000 Laptop GPU 2048 128 Bit @ 14000 MHz
RTX A500 Laptop GPU 2048 64 Bit @ 14000 MHz
GeForce GTX 1080 Ti 3584 @ 1.48 - 1.6 GHz352 Bit @ 11000 MHz
GeForce GTX 1080 SLI (Laptop) 5120 @ 1.56 - 1.73 GHz256 Bit @ 10000 MHz
GeForce GTX 1070 SLI (Desktop) 3840 @ 1.51 - 1.68 GHz256 Bit @ 8000 MHz
GeForce GTX 1070 SLI (Laptop) 4096 @ 1.44 - 1.65 GHz256 Bit @ 8000 MHz
GeForce GTX 1080 (Desktop) 2560 @ 1.61 - 1.73 GHz256 Bit @ 10000 MHz
GeForce GTX 1080 Mobile 2560 @ 1.57 - 1.73 GHz256 Bit @ 10000 MHz
GeForce GTX 1070 Ti (Desktop) 2432 @ 1.61 - 1.68 GHz256 Bit @ 8000 MHz
GeForce GTX 1070 (Desktop) 1920 @ 1.51 - 1.68 GHz256 Bit @ 8000 MHz
GeForce GTX 1080 Max-Q 2560 @ 1.1 - 1.28 GHz256 Bit @ 10000 MHz
GeForce GTX 1070 Mobile 2048 @ 1.44 - 1.65 GHz256 Bit @ 8000 MHz
GeForce GTX 1070 Max-Q 2048 @ 1.1 - 1.27 GHz256 Bit @ 8000 MHz
GeForce GTX 1060 (Desktop) 1280 @ 1.51 - 1.71 GHz192 Bit @ 8000 MHz
GeForce GTX 1060 Mobile 1280 @ 1.4 - 1.67 GHz192 Bit @ 8000 MHz
GeForce GTX 1060 Max-Q 1280 @ 1.06 - 1.34 GHz192 Bit @ 8000 MHz
GeForce GTX 1050 Ti Mobile 768 @ 1.49 - 1.62 GHz128 Bit @ 7000 MHz
GeForce GTX 1050 Ti (Desktop) 768 @ 1.29 - 1.39 GHz128 Bit @ 7008 MHz
GeForce GTX 1050 Ti Max-Q 768 @ 1.15 - 1.29 GHz128 Bit @ 7000 MHz
GeForce GTX 1050 (Desktop) 640 @ 1.35 - 1.46 GHz128 Bit @ 7008 MHz
GeForce GTX 1050 Mobile 640 @ 1.35 - 1.49 GHz128 Bit @ 7000 MHz
GeForce GTX 1050 Max-Q 640 @ 1 - 1.14 GHz128 Bit @ 7000 MHz
GeForce GT 1030 (Desktop) 384 @ 1.23 - 1.67 GHz64 Bit @ 6000 MHz
CodenameGA107N17E-G2 Max-QPascal GP104
ArchitekturAmperePascalPascal
Pipelines2048 - unified2048 - unified2432 - unified
Raytracing Cores16
Tensor / AI Cores64
Theoretical Performance7.3 TFLOPS FP32
Speichertakt14000 MHz8000 MHz8000 MHz
Speicherbandbreite64 Bit256 Bit256 Bit
SpeichertypGDDR6GDDR5GDDR5
Max. Speichergröße4 GB8 GB8 GB
Shared Memoryneinneinnein
Memory Bandwidth112 GB/s
APIDirectX 12_2, Shader 6.7, OpenGL 4.6DirectX 12_1, OpenGL 4.5DirectX 12_1, OpenGL 4.5
Stromverbrauch60 Watt (20 - 60 Watt TGP)180 Watt
Herstellungsprozess8 nm16 nm16 nm
PCIe4
Erscheinungsdatum30.03.2022 30.05.2017 02.11.2017
Herstellerseitenvdam.widen.netwww.nvidia.at
Kerntakt1101 - 1215 - 1265 - 1379 (Boost) MHz1607 - 1683 (Boost) MHz
Transistors7.2 Billion7.2 Billion
FeaturesMulti-Projection, VR Ready, G-SYNC, Vulkan, Multi MonitorMulti-Projection, VR Ready, G-SYNC, Vulkan, Multi Monitor
Notebookgrößegroß (17" z.B.)

Benchmarks

Performance Rating - 3DMark 11 + Fire Strike + Time Spy - RTX A500 Laptop GPU
3.4 pt (10%)
Performance Rating - 3DMark 11 + Fire Strike + Time Spy - GeForce GTX 1070 Max-Q
6.5 pt (19%)
3DMark - 3DMark Time Spy Score
min: 3127     avg: 3273     median: 3273 (9%)     max: 3419 Points
min: 4396     avg: 4641     median: 4616 (13%)     max: 4856 Points
6177 Points (18%)
3DMark - 3DMark Time Spy Graphics
min: 2873     avg: 2995     median: 2994.5 (8%)     max: 3116 Points
min: 4548     avg: 4687     median: 4708 (12%)     max: 4795 Points
6531 Points (17%)
3DMark - 3DMark Ice Storm Unlimited Graphics
min: 328292     avg: 351332     median: 334256 (34%)     max: 398350 Points
442105 Points (45%)
3DMark - 3DMark Ice Storm Extreme Graphics
min: 91895     avg: 209959     median: 215087 (27%)     max: 312206 Points
3DMark - 3DMark Cloud Gate Score
min: 27001     avg: 28765     median: 28764.5 (31%)     max: 30528 Points
min: 24117     avg: 29752     median: 28582.5 (31%)     max: 35886 Points
29364 Points (31%)
3DMark - 3DMark Cloud Gate Graphics
min: 46927     avg: 48496     median: 48495.5 (13%)     max: 50064 Points
min: 73739     avg: 97317     median: 99551.5 (26%)     max: 107807 Points
88161 Points (23%)
3DMark - 3DMark Fire Strike Standard Score
min: 6899     avg: 6955     median: 6954.5 (12%)     max: 7010 Points
min: 11857     avg: 12627     median: 12598.5 (22%)     max: 14119 Points
15061 Points (27%)
3DMark - 3DMark Fire Strike Standard Graphics
min: 7578     avg: 7598     median: 7597.5 (9%)     max: 7617 Points
min: 14146     avg: 14910     median: 14678.5 (17%)     max: 16165 Points
18405 Points (21%)
3DMark - 3DMark Ice Storm Graphics
88367 Points (10%)
min: 92053     avg: 245427     median: 241124 (28%)     max: 357428 Points
3DMark 11 - 3DM11 Performance Score
min: 11213     avg: 11289     median: 11288.5 (16%)     max: 11364 Points
min: 13513     avg: 15401     median: 15409 (21%)     max: 17408 Points
20106 Points (28%)
3DMark 11 - 3DM11 Performance GPU
min: 10748     avg: 10818     median: 10818 (9%)     max: 10888 Points
min: 17680     avg: 19016     median: 18688 (16%)     max: 20829 Points
27503 Points (24%)
3DMark Vantage
3DM Vant. Perf. total + NVIDIA RTX A500 Laptop GPU
3DMark Vantage - 3DM Vant. Perf. total
40923 Points (12%)
3DM Vant. Perf. total + NVIDIA GeForce GTX 1070 Max-Q
44090 Points (13%)
3DM Vant. Perf. GPU no PhysX + NVIDIA RTX A500 Laptop GPU
3DMark Vantage - 3DM Vant. Perf. GPU no PhysX
39319 Points (21%)
3DM Vant. Perf. GPU no PhysX + NVIDIA GeForce GTX 1070 Max-Q
47227 Points (26%)
3DMark 06 3DMark 06 - Standard 1280x1024 + NVIDIA RTX A500 Laptop GPU
3DMark 06
40862 Points (53%)
3DMark 06 - Standard 1280x1024 + NVIDIA GeForce GTX 1070 Max-Q
min: 26805     avg: 30843     median: 30648.5 (40%)     max: 35269 Points
3DMark 06 - Standard 1280x1024 + NVIDIA GeForce GTX 1070 Ti (Desktop)
36475 Points (48%)
Blender - Blender 3.3 Classroom CUDA *
min: 142     avg: 146     median: 146 (22%)     max: 150 Seconds
Blender - Blender 3.3 Classroom OPTIX *
min: 88     avg: 91.5     median: 91.5 (34%)     max: 95 Seconds
SPECviewperf 11
specvp11 snx-01 + NVIDIA GeForce GTX 1070 Max-Q
SPECviewperf 11 - specvp11 snx-01
11.8 fps (7%)
specvp11 tcvis-02 + NVIDIA GeForce GTX 1070 Max-Q
SPECviewperf 11 - specvp11 tcvis-02
3.4 fps (2%)
specvp11 sw-02 + NVIDIA GeForce GTX 1070 Max-Q
SPECviewperf 11 - specvp11 sw-02
19.9 fps (15%)
specvp11 proe-05 + NVIDIA GeForce GTX 1070 Max-Q
SPECviewperf 11 - specvp11 proe-05
2.9 fps (3%)
specvp11 maya-03 + NVIDIA GeForce GTX 1070 Max-Q
SPECviewperf 11 - specvp11 maya-03
18.6 fps (14%)
specvp11 lightwave-01 + NVIDIA GeForce GTX 1070 Max-Q
SPECviewperf 11 - specvp11 lightwave-01
21 fps (23%)
specvp11 ensight-04 + NVIDIA GeForce GTX 1070 Max-Q
SPECviewperf 11 - specvp11 ensight-04
160.3 fps (77%)
specvp11 catia-03 + NVIDIA GeForce GTX 1070 Max-Q
SPECviewperf 11 - specvp11 catia-03
20.3 fps (11%)
SPECviewperf 12
specvp12 sw-03 + NVIDIA RTX A500 Laptop GPU
SPECviewperf 12 - specvp12 sw-03
126.4 fps (31%)
specvp12 sw-03 + NVIDIA GeForce GTX 1070 Max-Q
min: 44.79     avg: 47.9     median: 47.8 (12%)     max: 50.9 fps
specvp12 snx-02 + NVIDIA RTX A500 Laptop GPU
SPECviewperf 12 - specvp12 snx-02
88.4 fps (13%)
specvp12 snx-02 + NVIDIA GeForce GTX 1070 Max-Q
min: 6.72     avg: 6.8     median: 6.8 (1%)     max: 6.96 fps
specvp12 showcase-01 + NVIDIA RTX A500 Laptop GPU
SPECviewperf 12 - specvp12 showcase-01
31.8 fps (7%)
specvp12 showcase-01 + NVIDIA GeForce GTX 1070 Max-Q
min: 71.6     avg: 75.2     median: 75.2 (16%)     max: 78.8 fps
specvp12 maya-04 + NVIDIA RTX A500 Laptop GPU
SPECviewperf 12 - specvp12 maya-04
76.9 fps (21%)
specvp12 maya-04 + NVIDIA GeForce GTX 1070 Max-Q
min: 83.4     avg: 92.4     median: 92.4 (25%)     max: 101.4 fps
specvp12 creo-01 + NVIDIA RTX A500 Laptop GPU
SPECviewperf 12 - specvp12 creo-01
88 fps (35%)
specvp12 creo-01 + NVIDIA GeForce GTX 1070 Max-Q
min: 45.05     avg: 45.2     median: 45.2 (18%)     max: 45.43 fps
specvp12 catia-04 + NVIDIA RTX A500 Laptop GPU
SPECviewperf 12 - specvp12 catia-04
108.2 fps (18%)
specvp12 catia-04 + NVIDIA GeForce GTX 1070 Max-Q
min: 62.7     avg: 63.3     median: 63.3 (10%)     max: 63.9 fps
specvp12 mediacal-01 + NVIDIA GeForce GTX 1070 Max-Q
SPECviewperf 12 - specvp12 mediacal-01
min: 32.67     avg: 34.4     median: 34.4 (9%)     max: 36.03 fps
specvp12 energy-01 + NVIDIA GeForce GTX 1070 Max-Q
SPECviewperf 12 - specvp12 energy-01
6.9 fps (6%)
specvp12 3dsmax-05 + NVIDIA GeForce GTX 1070 Max-Q
SPECviewperf 12 - specvp12 3dsmax-05
97.4 fps (17%)
SPECviewperf 13 specvp13 sw-04 + NVIDIA RTX A500 Laptop GPU
SPECviewperf 13 - specvp13 sw-04
min: 127.43     avg: 129.5     median: 129.5 (35%)     max: 131.64 fps
specvp13 snx-03 + NVIDIA RTX A500 Laptop GPU
SPECviewperf 13 - specvp13 snx-03
min: 145.61     avg: 153.2     median: 153.2 (17%)     max: 160.83 fps
specvp13 showcase-02 + NVIDIA RTX A500 Laptop GPU
SPECviewperf 13 - specvp13 showcase-02
min: 31.69     avg: 34.6     median: 34.6 (8%)     max: 37.51 fps
specvp13 medical-02 + NVIDIA RTX A500 Laptop GPU
SPECviewperf 13 - specvp13 medical-02
min: 73.93     avg: 78.3     median: 78.3 (16%)     max: 82.72 fps
specvp13 maya-05 + NVIDIA RTX A500 Laptop GPU
SPECviewperf 13 - specvp13 maya-05
min: 121.4     avg: 123.5     median: 123.5 (14%)     max: 125.67 fps
specvp13 energy-02 + NVIDIA RTX A500 Laptop GPU
SPECviewperf 13 - specvp13 energy-02
min: 20.53     avg: 21.4     median: 21.4 (7%)     max: 22.26 fps
specvp13 creo-02 + NVIDIA RTX A500 Laptop GPU
SPECviewperf 13 - specvp13 creo-02
min: 120.07     avg: 121.6     median: 121.6 (18%)     max: 123.09 fps
specvp13 catia-05 + NVIDIA RTX A500 Laptop GPU
SPECviewperf 13 - specvp13 catia-05
min: 146.08     avg: 154.4     median: 154.4 (17%)     max: 162.65 fps
specvp13 3dsmax-06 + NVIDIA RTX A500 Laptop GPU
SPECviewperf 13 - specvp13 3dsmax-06
min: 80.81     avg: 84     median: 84 (15%)     max: 87.19 fps
SPECviewperf 2020 specvp2020 solidworks-07 4k + NVIDIA RTX A500 Laptop GPU
SPECviewperf 2020 - specvp2020 solidworks-07 4k
10.8 fps (3%)
specvp2020 solidworks-07 1080p + NVIDIA RTX A500 Laptop GPU
SPECviewperf 2020 - specvp2020 solidworks-07 1080p
88.5 fps (24%)
specvp2020 solidworks-05 1080p + NVIDIA RTX A500 Laptop GPU
SPECviewperf 2020 - specvp2020 solidworks-05 1080p
79.9 fps (16%)
specvp2020 snx-04 1080p + NVIDIA RTX A500 Laptop GPU
SPECviewperf 2020 - specvp2020 snx-04 1080p
min: 139.98     avg: 148.5     median: 148.5 (24%)     max: 157.04 fps
specvp2020 medical-03 1080p + NVIDIA RTX A500 Laptop GPU
SPECviewperf 2020 - specvp2020 medical-03 1080p
min: 27.58     avg: 28.3     median: 28.3 (20%)     max: 28.96 fps
specvp2020 maya-06 1080p + NVIDIA RTX A500 Laptop GPU
SPECviewperf 2020 - specvp2020 maya-06 1080p
min: 143.05     avg: 143.6     median: 143.6 (16%)     max: 144.17 fps
specvp2020 energy-03 1080p + NVIDIA RTX A500 Laptop GPU
SPECviewperf 2020 - specvp2020 energy-03 1080p
min: 20.44     avg: 21.4     median: 21.4 (14%)     max: 22.29 fps
specvp2020 creo-03 1080p + NVIDIA RTX A500 Laptop GPU
SPECviewperf 2020 - specvp2020 creo-03 1080p
min: 50.44     avg: 61.4     median: 61.4 (30%)     max: 72.31 fps
specvp2020 catia-06 1080p + NVIDIA RTX A500 Laptop GPU
SPECviewperf 2020 - specvp2020 catia-06 1080p
min: 34.65     avg: 36.9     median: 36.9 (23%)     max: 39.09 fps
specvp2020 3dsmax-07 1080p + NVIDIA RTX A500 Laptop GPU
SPECviewperf 2020 - specvp2020 3dsmax-07 1080p
min: 32.99     avg: 35.4     median: 35.4 (11%)     max: 37.79 fps
specvp2020 snx-04 4k + NVIDIA RTX A500 Laptop GPU
SPECviewperf 2020 - specvp2020 snx-04 4k
98.2 fps (10%)
specvp2020 medical-03 4k + NVIDIA RTX A500 Laptop GPU
SPECviewperf 2020 - specvp2020 medical-03 4k
11.9 fps (11%)
specvp2020 maya-06 4k + NVIDIA RTX A500 Laptop GPU
SPECviewperf 2020 - specvp2020 maya-06 4k
66.7 fps (11%)
specvp2020 energy-03 4k + NVIDIA RTX A500 Laptop GPU
SPECviewperf 2020 - specvp2020 energy-03 4k
143.3 fps (31%)
specvp2020 creo-03 4k + NVIDIA RTX A500 Laptop GPU
SPECviewperf 2020 - specvp2020 creo-03 4k
37.6 fps (18%)
specvp2020 catia-06 4k + NVIDIA RTX A500 Laptop GPU
SPECviewperf 2020 - specvp2020 catia-06 4k
12.9 fps (8%)
specvp2020 3dsmax-07 4k + NVIDIA RTX A500 Laptop GPU
SPECviewperf 2020 - specvp2020 3dsmax-07 4k
17.1 fps (7%)
Cinebench R10 Cinebench R10 Shading (32bit) + NVIDIA RTX A500 Laptop GPU
Cinebench R10 - Cinebench R10 Shading (32bit)
6844 Points (5%)
Cinebench R10 Shading (32bit) + NVIDIA GeForce GTX 1070 Max-Q
min: 6820     avg: 9726     median: 10777 (8%)     max: 11810 Points
Cinebench R11.5 Cinebench R11.5 OpenGL 64 Bit + NVIDIA RTX A500 Laptop GPU
Cinebench R11.5 - Cinebench R11.5 OpenGL 64 Bit
212.8 fps (70%)
Cinebench R11.5 OpenGL 64 Bit + NVIDIA GeForce GTX 1070 Max-Q
min: 62.7     avg: 68.5     median: 67.2 (22%)     max: 76.3 fps
Cinebench R15
Cinebench R15 OpenGL 64 Bit + NVIDIA RTX A500 Laptop GPU
Cinebench R15 - Cinebench R15 OpenGL 64 Bit
min: 232     avg: 247     median: 247 (14%)     max: 262 fps
Cinebench R15 OpenGL 64 Bit + NVIDIA GeForce GTX 1070 Max-Q
min: 95.9     avg: 104.6     median: 102.1 (6%)     max: 118.5 fps
Cinebench R15 OpenGL Ref. Match 64 Bit + NVIDIA RTX A500 Laptop GPU
Cinebench R15 - Cinebench R15 OpenGL Ref. Match 64 Bit
99.6 % (100%)
Cinebench R15 OpenGL Ref. Match 64 Bit + NVIDIA GeForce GTX 1070 Max-Q
99.6 % (100%)
GFXBench - GFXBench 5.0 4K Aztec Ruins High Tier Offscreen
28.5 fps (12%)
GFXBench - GFXBench 5.0 Aztec Ruins High Tier Offscreen
64.7 fps (12%)
GFXBench - GFXBench 5.0 Aztec Ruins Normal Tier Offscreen
166.1 fps (12%)
GFXBench - GFXBench Car Chase Offscreen
174.1 fps (20%)
GFXBench 3.1 - GFXBench Manhattan ES 3.1 Offscreen
232.7 fps (5%)
GFXBench 3.0 - GFXBench 3.0 Manhattan Offscreen
321.7 fps (19%)
459 fps (27%)
GFXBench (DX / GLBenchmark) 2.7
GFXBench T-Rex HD Offscreen C24Z16 + NVIDIA RTX A500 Laptop GPU
GFXBench (DX / GLBenchmark) 2.7 - GFXBench T-Rex HD Offscreen C24Z16
554 fps (4%)
Basemark GPU 1.2 - Basemark GPU 1.2 Vulkan Official Medium Offscreen 1080
104.6 fps (1%)
Basemark GPU 1.2 - Basemark GPU 1.2 Vulkan Official High Offscreen 2160
3.6 fps (1%)
Geekbench 6.2 - Geekbench 6.2 GPU OpenCL
min: 40215     avg: 41313     median: 41313 (12%)     max: 42411 Points
Geekbench 6.2 - Geekbench 6.2 GPU Vulkan
min: 20666     avg: 30177     median: 30176.5 (9%)     max: 39687 Points
LuxMark v2.0 64Bit - LuxMark v2.0 Room GPU
1023 Samples/s (5%)
min: 2460     avg: 2523     median: 2523 (11%)     max: 2586 Samples/s
2542 Samples/s (11%)
LuxMark v2.0 64Bit - LuxMark v2.0 Sala GPU
2268 Samples/s (4%)
min: 4877     avg: 4938     median: 4937.5 (9%)     max: 4998 Samples/s
5159 Samples/s (9%)
ComputeMark v2.1 - ComputeMark v2.1 Result
8197 Points (9%)
min: 10798     avg: 10998     median: 10917 (12%)     max: 11390 Points
15488 Points (17%)
Power Consumption - Furmark Stress Test Power Consumption - external Monitor *
min: 49.1     avg: 51.7     median: 51.7 (7%)     max: 54.3 Watt
291 Watt (41%)
Power Consumption - The Witcher 3 Power Consumption - external Monitor *
54.5 Watt (8%)
290 Watt (41%)
Power Consumption - Witcher 3 Power Consumption *
56.5 Watt (12%)
min: 120     avg: 136.2     median: 134.2 (29%)     max: 154 Watt
Power Consumption - Witcher 3 ultra Power Efficiency
0.6 fps per Watt (50%)
min: 0.3221     avg: 0.4     median: 0.4 (34%)     max: 0.4389 fps per Watt
Power Consumption - Witcher 3 ultra Power Efficiency - external Monitor
0.6 fps per Watt (47%)
0.2 fps per Watt (21%)
Power Consumption - Cyberpunk 2077 Power Consumption 150cd *
63.4 Watt (20%)
Power Consumption - Cyberpunk 2077 Power Consumption - external Monitor *
58.1 Watt (7%)
Emissions Witcher 3 Fan Noise + NVIDIA RTX A500 Laptop GPU
Emissions - Witcher 3 Fan Noise
46 dB(A) (74%)
Witcher 3 Fan Noise + NVIDIA GeForce GTX 1070 Max-Q
min: 41.7     avg: 46.1     median: 45 (72%)     max: 55 dB(A)
Clock Speed - GPU Clock Witcher 3 ultra
min: 1228     avg: 1344     median: 1342 (53%)     max: 1480 MHz
1810 MHz (71%)
Clock Speed - GPU Clock Speed Furmark
1677 MHz (66%)

Average Benchmarks NVIDIA RTX A500 Laptop GPU → 100% n=12

Average Benchmarks NVIDIA GeForce GTX 1070 Max-Q → 163% n=12

Average Benchmarks NVIDIA GeForce GTX 1070 Ti (Desktop) → 195% n=12

- Bereich der Benchmarkergebnisse für diese Grafikkarte
- Durchschnittliche Benchmarkergebnisse für diese Grafikkarte
* Smaller numbers mean a higher performance
1 This benchmark is not used for the average calculation

Spiele-Benchmarks

Die folgenden Benchmarks basieren auf unseren Spieletests mit Testnotebooks. Die Performance dieser Grafikkarte bei den gelisteten Spielen ist abhängig von der verwendeten CPU, Speicherausstattung, Treiber und auch Betriebssystem. Dadurch müssen die untenstehenden Werte nicht repräsentativ sein. Detaillierte Informationen über das verwendete System sehen Sie nach einem Klick auf den fps-Wert.

F1 24

F1 24

2024
low 1920x1080
100%
RTX A500 Laptop GPU:
82.4  fps
med. 1920x1080
100%
RTX A500 Laptop GPU:
71.9  fps
high 1920x1080
100%
RTX A500 Laptop GPU:
32.9  fps
ultra 1920x1080
100%
RTX A500 Laptop GPU:
11.7  fps
low 1920x1080
100%
RTX A500 Laptop GPU:
34.6  fps
med. 1920x1080
100%
RTX A500 Laptop GPU:
27.5  fps
high 1920x1080
100%
RTX A500 Laptop GPU:
19.1  fps
ultra 1920x1080
100%
RTX A500 Laptop GPU:
14.1  fps
low 1920x1080
100%
RTX A500 Laptop GPU:
23.6  fps
high 1920x1080
100%
RTX A500 Laptop GPU:
14.5  fps
low 1920x1080
100%
RTX A500 Laptop GPU:
80.1  fps
med. 1920x1080
100%
RTX A500 Laptop GPU:
68.6  fps
high 1920x1080
100%
RTX A500 Laptop GPU:
58.6  fps
ultra 1920x1080
100%
RTX A500 Laptop GPU:
43.8  fps
low 1920x1080
100%
RTX A500 Laptop GPU:
76.7  fps
med. 1920x1080
100%
RTX A500 Laptop GPU:
58.2  fps
high 1920x1080
100%
RTX A500 Laptop GPU:
49.3  fps
ultra 1920x1080
100%
RTX A500 Laptop GPU:
33.3  fps
low 1920x1080
100%
RTX A500 Laptop GPU:
19.5  fps
med. 1920x1080
100%
RTX A500 Laptop GPU:
12.8  fps
high 1920x1080
100%
RTX A500 Laptop GPU:
12  fps
ultra 1920x1080
100%
RTX A500 Laptop GPU:
10.9  fps
low 1920x1080
100%
RTX A500 Laptop GPU:
24.4  fps
med. 1920x1080
100%
RTX A500 Laptop GPU:
18.7  fps
high 1920x1080
100%
RTX A500 Laptop GPU:
14.3  fps
ultra 1920x1080
100%
RTX A500 Laptop GPU:
8.3  fps
low 1920x1080
100%
RTX A500 Laptop GPU:
39.8 43.3 ~ 42 fps
med. 1920x1080
100%
RTX A500 Laptop GPU:
31.1 32.1 ~ 32 fps
high 1920x1080
100%
RTX A500 Laptop GPU:
23.6 25.1 ~ 24 fps
ultra 1920x1080
100%
RTX A500 Laptop GPU:
19.6 20.4 ~ 20 fps
QHD 2560x1440
100%
RTX A500 Laptop GPU:
10.4  fps
4K 3840x2160
100%
RTX A500 Laptop GPU:
4.3  fps
low 1920x1080
100%
RTX A500 Laptop GPU:
39.2 39.9 ~ 40 fps
med. 1920x1080
100%
RTX A500 Laptop GPU:
30.8 34.5 ~ 33 fps
high 1920x1080
100%
RTX A500 Laptop GPU:
26.2 31.2 ~ 29 fps
ultra 1920x1080
100%
RTX A500 Laptop GPU:
25.8 30.2 ~ 28 fps
QHD 2560x1440
100%
RTX A500 Laptop GPU:
17.8  fps
F1 23

F1 23

2023
low 1920x1080
100%
RTX A500 Laptop GPU:
57  fps
med. 1920x1080
100%
RTX A500 Laptop GPU:
56.3  fps
high 1920x1080
100%
RTX A500 Laptop GPU:
43.1  fps
ultra 1920x1080
100%
RTX A500 Laptop GPU:
10.9  fps
QHD 2560x1440
100%
RTX A500 Laptop GPU:
6.6  fps
low 1920x1080
100%
RTX A500 Laptop GPU:
23  fps
med. 1920x1080
100%
RTX A500 Laptop GPU:
19.6  fps
high 1920x1080
100%
RTX A500 Laptop GPU:
10.6  fps
ultra 1920x1080
100%
RTX A500 Laptop GPU:
5.4  fps
F1 22

F1 22

2022
low 1920x1080
100%
RTX A500 Laptop GPU:
92.5  fps
med. 1920x1080
100%
RTX A500 Laptop GPU:
85.2  fps
high 1920x1080
100%
RTX A500 Laptop GPU:
57.8  fps
ultra 1920x1080
100%
RTX A500 Laptop GPU:
16.9  fps
low 1920x1080
100%
RTX A500 Laptop GPU:
66.2  fps
med. 1920x1080
100%
RTX A500 Laptop GPU:
53.5  fps
high 1920x1080
100%
RTX A500 Laptop GPU:
36.2  fps
ultra 1920x1080
100%
RTX A500 Laptop GPU:
27.6  fps
Control

Control

2019
low 1280x720
GeForce GTX 1070 Ti (Desktop):
200  fps
med. 1920x1080
GeForce GTX 1070 Ti (Desktop):
78  fps
high 1920x1080
GeForce GTX 1070 Ti (Desktop):
58.5  fps
QHD 2560x1440
GeForce GTX 1070 Ti (Desktop):
37.1  fps
4K 3840x2160
GeForce GTX 1070 Ti (Desktop):
17.9  fps
F1 2019

F1 2019

2019
low 1280x720
GeForce GTX 1070 Ti (Desktop):
244  fps
med. 1920x1080
GeForce GTX 1070 Ti (Desktop):
183  fps
high 1920x1080
GeForce GTX 1070 Ti (Desktop):
164  fps
ultra 1920x1080
GeForce GTX 1070 Ti (Desktop):
120  fps
QHD 2560x1440
GeForce GTX 1070 Ti (Desktop):
94  fps
4K 3840x2160
GeForce GTX 1070 Ti (Desktop):
57  fps
low 1280x720
GeForce GTX 1070 Ti (Desktop):
271  fps
med. 1920x1080
GeForce GTX 1070 Ti (Desktop):
249  fps
high 1920x1080
GeForce GTX 1070 Ti (Desktop):
241  fps
ultra 1920x1080
GeForce GTX 1070 Ti (Desktop):
219  fps
QHD 2560x1440
GeForce GTX 1070 Ti (Desktop):
222  fps
4K 3840x2160
GeForce GTX 1070 Ti (Desktop):
221  fps
high 1920x1080
GeForce GTX 1070 Ti (Desktop):
86.6  fps
ultra 1920x1080
GeForce GTX 1070 Ti (Desktop):
63.4  fps
QHD 2560x1440
GeForce GTX 1070 Ti (Desktop):
41.2  fps
4K 3840x2160
GeForce GTX 1070 Ti (Desktop):
20.3  fps
Anno 1800

Anno 1800

2019
ultra 1920x1080
GeForce GTX 1070 Ti (Desktop):
46  fps
QHD 2560x1440
GeForce GTX 1070 Ti (Desktop):
40.4  fps
4K 3840x2160
GeForce GTX 1070 Ti (Desktop):
24.1  fps
low 1280x720
GeForce GTX 1070 Ti (Desktop):
121  fps
med. 1920x1080
GeForce GTX 1070 Ti (Desktop):
107  fps
high 1920x1080
GeForce GTX 1070 Ti (Desktop):
103  fps
ultra 1920x1080
GeForce GTX 1070 Ti (Desktop):
93  fps
QHD 2560x1440
GeForce GTX 1070 Ti (Desktop):
76  fps
4K 3840x2160
GeForce GTX 1070 Ti (Desktop):
42  fps
low 1280x720
GeForce GTX 1070 Ti (Desktop):
147  fps
med. 1920x1080
GeForce GTX 1070 Ti (Desktop):
83  fps
high 1920x1080
GeForce GTX 1070 Ti (Desktop):
63  fps
ultra 1920x1080
GeForce GTX 1070 Ti (Desktop):
52.3  fps
QHD 2560x1440
GeForce GTX 1070 Ti (Desktop):
40.2  fps
4K 3840x2160
GeForce GTX 1070 Ti (Desktop):
24.6  fps
low 1280x720
GeForce GTX 1070 Ti (Desktop):
144  fps
med. 1920x1080
GeForce GTX 1070 Ti (Desktop):
138  fps
high 1920x1080
GeForce GTX 1070 Ti (Desktop):
123  fps
ultra 1920x1080
GeForce GTX 1070 Ti (Desktop):
121  fps
QHD 2560x1440
GeForce GTX 1070 Ti (Desktop):
81  fps
4K 3840x2160
GeForce GTX 1070 Ti (Desktop):
42.4  fps
low 1280x720
GeForce GTX 1070 Max-Q:
126.1  fps
med. 1920x1080
GeForce GTX 1070 Max-Q:
86.1  fps
high 1920x1080
GeForce GTX 1070 Max-Q:
78.8  fps
ultra 1920x1080
GeForce GTX 1070 Max-Q:
75.7  fps
GeForce GTX 1070 Ti (Desktop):
88  fps
QHD 2560x1440
GeForce GTX 1070 Ti (Desktop):
64  fps
4K 3840x2160
GeForce GTX 1070 Ti (Desktop):
35.3  fps
low 1280x720
GeForce GTX 1070 Max-Q:
169.2  fps
med. 1920x1080
GeForce GTX 1070 Max-Q:
83.9  fps
high 1920x1080
GeForce GTX 1070 Max-Q:
68.3  fps
ultra 1920x1080
GeForce GTX 1070 Max-Q:
59.7  fps
GeForce GTX 1070 Ti (Desktop):
110  fps
QHD 2560x1440
GeForce GTX 1070 Ti (Desktop):
74  fps
4K 3840x2160
GeForce GTX 1070 Ti (Desktop):
35.4  fps
low 1280x720
GeForce GTX 1070 Max-Q:
140.7  fps
med. 1920x1080
GeForce GTX 1070 Max-Q:
80.6  fps
high 1920x1080
GeForce GTX 1070 Max-Q:
70 91.7 ~ 81 fps
ultra 1920x1080
GeForce GTX 1070 Max-Q:
64.7 85.2 ~ 75 fps
GeForce GTX 1070 Ti (Desktop):
111  fps
QHD 2560x1440
GeForce GTX 1070 Ti (Desktop):
83  fps
4K 3840x2160
GeForce GTX 1070 Ti (Desktop):
47.1  fps
low 1280x720
GeForce GTX 1070 Max-Q:
214.4  fps
med. 1920x1080
GeForce GTX 1070 Max-Q:
167.6  fps
high 1920x1080
GeForce GTX 1070 Max-Q:
110.4  fps
ultra 1920x1080
GeForce GTX 1070 Max-Q:
89.6  fps
high 1920x1080
GeForce GTX 1070 Max-Q:
60  fps
ultra 1920x1080
GeForce GTX 1070 Max-Q:
60  fps
Hitman 2

Hitman 2

2018
low 1280x720
GeForce GTX 1070 Max-Q:
92  fps
med. 1920x1080
GeForce GTX 1070 Max-Q:
80.5  fps
high 1920x1080
GeForce GTX 1070 Max-Q:
68.1 74.8 ~ 71 fps
ultra 1920x1080
GeForce GTX 1070 Max-Q:
66.3 68.8 ~ 68 fps
low 1280x720
GeForce GTX 1070 Max-Q:
169.8  fps
med. 1920x1080
GeForce GTX 1070 Max-Q:
105  fps
high 1920x1080
GeForce GTX 1070 Max-Q:
91.4 98.9 ~ 95 fps
ultra 1920x1080
GeForce GTX 1070 Max-Q:
84.7 93.3 ~ 89 fps
GeForce GTX 1070 Ti (Desktop):
120  fps
QHD 2560x1440
GeForce GTX 1070 Ti (Desktop):
80  fps
4K 3840x2160
GeForce GTX 1070 Ti (Desktop):
40.1  fps
low 1280x720
GeForce GTX 1070 Max-Q:
64  fps
med. 1920x1080
GeForce GTX 1070 Max-Q:
62  fps
high 1920x1080
GeForce GTX 1070 Max-Q:
52 61 ~ 57 fps
ultra 1920x1080
GeForce GTX 1070 Max-Q:
39 44 ~ 42 fps
GeForce GTX 1070 Ti (Desktop):
63  fps
QHD 2560x1440
GeForce GTX 1070 Ti (Desktop):
48  fps
4K 3840x2160
GeForce GTX 1070 Max-Q:
21  fps
GeForce GTX 1070 Ti (Desktop):
27  fps
low 1280x720
GeForce GTX 1070 Max-Q:
127  fps
med. 1920x1080
GeForce GTX 1070 Max-Q:
101  fps
high 1920x1080
GeForce GTX 1070 Max-Q:
95 99 ~ 97 fps
ultra 1920x1080
GeForce GTX 1070 Max-Q:
78 80 ~ 79 fps
GeForce GTX 1070 Ti (Desktop):
100  fps
QHD 2560x1440
GeForce GTX 1070 Ti (Desktop):
81  fps
4K 3840x2160
GeForce GTX 1070 Max-Q:
43  fps
GeForce GTX 1070 Ti (Desktop):
55  fps
FIFA 19

FIFA 19

2018
high 1920x1080
GeForce GTX 1070 Max-Q:
199  fps
ultra 1920x1080
GeForce GTX 1070 Max-Q:
194  fps
GeForce GTX 1070 Ti (Desktop):
267  fps
4K 3840x2160
GeForce GTX 1070 Ti (Desktop):
141  fps
low 1280x720
GeForce GTX 1070 Max-Q:
91 130 ~ 111 fps
med. 1920x1080
GeForce GTX 1070 Max-Q:
65 78 ~ 72 fps
high 1920x1080
GeForce GTX 1070 Max-Q:
62 67 72 ~ 67 fps
ultra 1920x1080
GeForce GTX 1070 Max-Q:
58 58 61 ~ 59 fps
GeForce GTX 1070 Ti (Desktop):
84  fps
QHD 2560x1440
GeForce GTX 1070 Ti (Desktop):
51  fps
4K 3840x2160
GeForce GTX 1070 Max-Q:
20  fps
GeForce GTX 1070 Ti (Desktop):
28  fps
Strange Brigade

Strange Brigade

2018
low 1280x720
100%
RTX A500 Laptop GPU:
168.9 183.5 ~ 176 fps
med. 1920x1080
100%
RTX A500 Laptop GPU:
74.9 76.5 ~ 76 fps
high 1920x1080
100%
RTX A500 Laptop GPU:
61.9 62.5 ~ 62 fps
ultra 1920x1080
100%
RTX A500 Laptop GPU:
53.6 54.5 ~ 54 fps
QHD 2560x1440
100%
RTX A500 Laptop GPU:
39.2  fps
F1 2018

F1 2018

2018
low 1280x720
GeForce GTX 1070 Max-Q:
163  fps
med. 1920x1080
GeForce GTX 1070 Max-Q:
130  fps
high 1920x1080
GeForce GTX 1070 Max-Q:
100 108 110 ~ 106 fps
ultra 1920x1080
GeForce GTX 1070 Max-Q:
70 76 76 ~ 74 fps
GeForce GTX 1070 Ti (Desktop):
97  fps
QHD 2560x1440
GeForce GTX 1070 Ti (Desktop):
78  fps
4K 3840x2160
GeForce GTX 1070 Max-Q:
59  fps
GeForce GTX 1070 Ti (Desktop):
49  fps
low 1280x720
GeForce GTX 1070 Max-Q:
156.5  fps
med. 1920x1080
GeForce GTX 1070 Max-Q:
88.4  fps
high 1920x1080
GeForce GTX 1070 Max-Q:
74.8 80.4 ~ 78 fps
ultra 1920x1080
GeForce GTX 1070 Max-Q:
56.9 60.3 ~ 59 fps
GeForce GTX 1070 Ti (Desktop):
78  fps
QHD 2560x1440
GeForce GTX 1070 Ti (Desktop):
48.5  fps
4K 3840x2160
GeForce GTX 1070 Ti (Desktop):
23.8  fps
high 1920x1080
GeForce GTX 1070 Max-Q:
60 60 ~ 60 fps
ultra 1920x1080
GeForce GTX 1070 Max-Q:
60 60 ~ 60 fps
Far Cry 5

Far Cry 5

2018
low 1280x720
100%
RTX A500 Laptop GPU:
81 83 ~ 82 fps
126%
GeForce GTX 1070 Max-Q:
103  fps
165%
GeForce GTX 1070 Ti (Desktop):
135  fps
med. 1920x1080
100%
RTX A500 Laptop GPU:
51 57 ~ 54 fps
150%
GeForce GTX 1070 Max-Q:
81  fps
211%
GeForce GTX 1070 Ti (Desktop):
114  fps
high 1920x1080
100%
RTX A500 Laptop GPU:
46 50 ~ 48 fps
165%
GeForce GTX 1070 Max-Q:
76 77 79 83 ~ 79 fps
225%
GeForce GTX 1070 Ti (Desktop):
108  fps
ultra 1920x1080
100%
RTX A500 Laptop GPU:
44 44 ~ 44 fps
170%
GeForce GTX 1070 Max-Q:
72 74 75 78 ~ 75 fps
232%
GeForce GTX 1070 Ti (Desktop):
102  fps
QHD 2560x1440
GeForce GTX 1070 Ti (Desktop):
75  fps
4K 3840x2160
GeForce GTX 1070 Max-Q:
27  fps
GeForce GTX 1070 Ti (Desktop):
39  fps
low 1280x720
100%
RTX A500 Laptop GPU:
113.3 117.7 ~ 116 fps
94%
GeForce GTX 1070 Max-Q:
109  fps
87%
GeForce GTX 1070 Ti (Desktop):
101  fps
med. 1920x1080
100%
RTX A500 Laptop GPU:
89.2 98 ~ 94 fps
103%
GeForce GTX 1070 Max-Q:
96.5  fps
95%
GeForce GTX 1070 Ti (Desktop):
89  fps
high 1920x1080
100%
RTX A500 Laptop GPU:
73.9 81.6 ~ 78 fps
104%
GeForce GTX 1070 Max-Q:
81.1  fps
96%
GeForce GTX 1070 Ti (Desktop):
74.5  fps
4K 3840x2160
GeForce GTX 1070 Ti (Desktop):
66.7  fps
low 1280x720
GeForce GTX 1070 Ti (Desktop):
154  fps
med. 1920x1080
GeForce GTX 1070 Ti (Desktop):
100  fps
high 1920x1080
GeForce GTX 1070 Max-Q:
64.8 70.2 71.2 ~ 69 fps
GeForce GTX 1070 Ti (Desktop):
82  fps
ultra 1920x1080
GeForce GTX 1070 Max-Q:
50.2 53.3 54.2 ~ 53 fps
GeForce GTX 1070 Ti (Desktop):
59.1  fps
QHD 2560x1440
GeForce GTX 1070 Ti (Desktop):
42.4  fps
4K 3840x2160
GeForce GTX 1070 Ti (Desktop):
22.7  fps
low 1280x720
100%
RTX A500 Laptop GPU:
78.6 90.4 ~ 85 fps
172%
GeForce GTX 1070 Ti (Desktop):
146  fps
med. 1920x1080
100%
RTX A500 Laptop GPU:
44.2 45.8 ~ 45 fps
193%
GeForce GTX 1070 Ti (Desktop):
87  fps
high 1920x1080
100%
RTX A500 Laptop GPU:
31.4 32.9 ~ 32 fps
156%
GeForce GTX 1070 Max-Q:
47.8 49.5 51.7 ~ 50 fps
197%
GeForce GTX 1070 Ti (Desktop):
63  fps
QHD 2560x1440
100%
RTX A500 Laptop GPU:
23.3  fps
4K 3840x2160
GeForce GTX 1070 Ti (Desktop):
27.7  fps
Fortnite

Fortnite

2018
high 1920x1080
GeForce GTX 1070 Max-Q:
113 122 127 ~ 121 fps
ultra 1920x1080
GeForce GTX 1070 Max-Q:
96.1 101 105 ~ 101 fps
GeForce GTX 1070 Ti (Desktop):
109  fps
QHD 2560x1440
GeForce GTX 1070 Ti (Desktop):
72  fps
4K 3840x2160
GeForce GTX 1070 Ti (Desktop):
36  fps
high 1920x1080
GeForce GTX 1070 Max-Q:
86.4 88.9 89.2 ~ 88 fps
ultra 1920x1080
GeForce GTX 1070 Max-Q:
73.9 75.9 78.5 ~ 76 fps
GeForce GTX 1070 Ti (Desktop):
117  fps
QHD 2560x1440
GeForce GTX 1070 Ti (Desktop):
77  fps
4K 3840x2160
GeForce GTX 1070 Ti (Desktop):
38  fps
low 1280x720
GeForce GTX 1070 Max-Q:
112.4  fps
med. 1920x1080
GeForce GTX 1070 Max-Q:
95.9  fps
high 1920x1080
GeForce GTX 1070 Max-Q:
89.9 92.5 94.2 ~ 92 fps
ultra 1920x1080
GeForce GTX 1070 Max-Q:
86.2 87.2 88.6 ~ 87 fps
GeForce GTX 1070 Ti (Desktop):
122  fps
QHD 2560x1440
GeForce GTX 1070 Ti (Desktop):
85  fps
4K 3840x2160
GeForce GTX 1070 Ti (Desktop):
45  fps
low 1280x720
GeForce GTX 1070 Max-Q:
163.3  fps
med. 1920x1080
GeForce GTX 1070 Max-Q:
133.5  fps
high 1920x1080
GeForce GTX 1070 Max-Q:
97.2 110 115 ~ 107 fps
ultra 1920x1080
GeForce GTX 1070 Max-Q:
86 94 101 ~ 94 fps
high 1920x1080
GeForce GTX 1070 Max-Q:
89.4 97.4 98.4 ~ 95 fps
ultra 1920x1080
GeForce GTX 1070 Max-Q:
83 91.8 92.2 ~ 89 fps
low 1280x720
GeForce GTX 1070 Max-Q:
63 70 ~ 67 fps
GeForce GTX 1070 Ti (Desktop):
103  fps
med. 1920x1080
GeForce GTX 1070 Max-Q:
53 64 ~ 59 fps
GeForce GTX 1070 Ti (Desktop):
92  fps
high 1920x1080
GeForce GTX 1070 Max-Q:
52 62 71 71 ~ 64 fps
GeForce GTX 1070 Ti (Desktop):
88  fps
ultra 1920x1080
GeForce GTX 1070 Max-Q:
44 53 61 61 ~ 55 fps
GeForce GTX 1070 Ti (Desktop):
75  fps
QHD 2560x1440
GeForce GTX 1070 Ti (Desktop):
58  fps
4K 3840x2160
GeForce GTX 1070 Max-Q:
26  fps
GeForce GTX 1070 Ti (Desktop):
34  fps
Destiny 2

Destiny 2

2017
low 1280x720
GeForce GTX 1070 Max-Q:
152.6  fps
med. 1920x1080
GeForce GTX 1070 Max-Q:
137.4  fps
high 1920x1080
GeForce GTX 1070 Max-Q:
130.8  fps
ultra 1920x1080
GeForce GTX 1070 Max-Q:
111  fps
ELEX

ELEX

2017
low 1280x720
GeForce GTX 1070 Max-Q:
120.5 122.5 ~ 122 fps
med. 1920x1080
GeForce GTX 1070 Max-Q:
87.7 107.3 ~ 98 fps
high 1920x1080
GeForce GTX 1070 Max-Q:
77.9 86.7 94.1 ~ 86 fps
ultra 1920x1080
GeForce GTX 1070 Max-Q:
63.3 66.6 73 ~ 68 fps
low 1280x720
GeForce GTX 1070 Max-Q:
88.5  fps
med. 1920x1080
GeForce GTX 1070 Max-Q:
53.3  fps
high 1920x1080
GeForce GTX 1070 Max-Q:
51.5 51.7 54 ~ 52 fps
ultra 1920x1080
GeForce GTX 1070 Max-Q:
50.5 50.5 53.8 ~ 52 fps
low 1280x720
GeForce GTX 1070 Max-Q:
91 132 ~ 112 fps
GeForce GTX 1070 Ti (Desktop):
165  fps
med. 1920x1080
GeForce GTX 1070 Max-Q:
82 114 ~ 98 fps
GeForce GTX 1070 Ti (Desktop):
136  fps
high 1920x1080
GeForce GTX 1070 Max-Q:
74 90 91 ~ 85 fps
GeForce GTX 1070 Ti (Desktop):
109  fps
ultra 1920x1080
GeForce GTX 1070 Max-Q:
62 69 71 ~ 67 fps
GeForce GTX 1070 Ti (Desktop):
85  fps
4K 3840x2160
GeForce GTX 1070 Ti (Desktop):
34  fps
FIFA 18

FIFA 18

2017
high 1920x1080
GeForce GTX 1070 Max-Q:
153 222 223 ~ 199 fps
ultra 1920x1080
GeForce GTX 1070 Max-Q:
152 214 217 ~ 194 fps
low 1280x720
GeForce GTX 1070 Max-Q:
158.3  fps
med. 1920x1080
GeForce GTX 1070 Max-Q:
62.7  fps
high 1920x1080
GeForce GTX 1070 Max-Q:
45.7  fps
ultra 1920x1080
GeForce GTX 1070 Max-Q:
31.9  fps
GeForce GTX 1070 Ti (Desktop):
47.1  fps
4K 3840x2160
GeForce GTX 1070 Ti (Desktop):
17.3  fps
F1 2017

F1 2017

2017
high 1920x1080
GeForce GTX 1070 Max-Q:
112 125 ~ 119 fps
ultra 1920x1080
GeForce GTX 1070 Max-Q:
79 80 81 ~ 80 fps
GeForce GTX 1070 Ti (Desktop):
106  fps
4K 3840x2160
GeForce GTX 1070 Max-Q:
36  fps
GeForce GTX 1070 Ti (Desktop):
52  fps
low 1280x720
GeForce GTX 1070 Max-Q:
109  fps
med. 1920x1080
GeForce GTX 1070 Max-Q:
93.7  fps
high 1920x1080
GeForce GTX 1070 Max-Q:
86.3 116 120 ~ 107 fps
ultra 1920x1080
GeForce GTX 1070 Max-Q:
68.2 78.7 84.6 ~ 77 fps
4K 3840x2160
GeForce GTX 1070 Max-Q:
22.4  fps
low 1280x720
GeForce GTX 1070 Max-Q:
128.4  fps
med. 1366x768
GeForce GTX 1070 Max-Q:
126.3  fps
high 1920x1080
GeForce GTX 1070 Max-Q:
122  fps
ultra 1920x1080
GeForce GTX 1070 Max-Q:
120.8  fps
4K 3820x2160
GeForce GTX 1070 Ti (Desktop):
152  fps
Dirt 4

Dirt 4

2017
high 1920x1080
GeForce GTX 1070 Max-Q:
115.4 121 ~ 118 fps
ultra 1920x1080
GeForce GTX 1070 Max-Q:
71.8 72.8 76.9 82.7 ~ 76 fps
4K 3840x2160
GeForce GTX 1070 Max-Q:
40.5  fps
GeForce GTX 1070 Ti (Desktop):
57.9  fps
high 1920x1080
GeForce GTX 1070 Max-Q:
196 196 208 ~ 200 fps
GeForce GTX 1070 Ti (Desktop):
223  fps
4K 3840x2160
GeForce GTX 1070 Max-Q:
83.8  fps
GeForce GTX 1070 Ti (Desktop):
92  fps
Prey

Prey

2017
high 1920x1080
GeForce GTX 1070 Max-Q:
137  fps
ultra 1920x1080
GeForce GTX 1070 Max-Q:
130 132 138.7 140.8 ~ 135 fps
4K 3840x2160
GeForce GTX 1070 Max-Q:
46.9 48.1 ~ 48 fps
low 1280x720
GeForce GTX 1070 Max-Q:
167.3  fps
med. 1920x1080
GeForce GTX 1070 Max-Q:
106.4  fps
high 1920x1080
GeForce GTX 1070 Max-Q:
100.9  fps
ultra 1920x1080
GeForce GTX 1070 Max-Q:
89.9  fps
low 1280x720
GeForce GTX 1070 Max-Q:
150.1  fps
med. 1920x1080
GeForce GTX 1070 Max-Q:
110.8  fps
high 1920x1080
GeForce GTX 1070 Max-Q:
77.6  fps
ultra 1920x1080
GeForce GTX 1070 Max-Q:
68.5  fps
low 1280x720
GeForce GTX 1070 Max-Q:
148.4  fps
med. 1920x1080
GeForce GTX 1070 Max-Q:
86  fps
high 1920x1080
GeForce GTX 1070 Max-Q:
75.7 78.6 79.7 ~ 78 fps
ultra 1920x1080
GeForce GTX 1070 Max-Q:
42.8 43.7 45.4 ~ 44 fps
GeForce GTX 1070 Ti (Desktop):
54.2  fps
4K 3840x2160
GeForce GTX 1070 Max-Q:
29  fps
GeForce GTX 1070 Ti (Desktop):
35.8  fps
For Honor

For Honor

2017
low 1280x720
GeForce GTX 1070 Max-Q:
203.9  fps
med. 1920x1080
GeForce GTX 1070 Max-Q:
128.6  fps
high 1920x1080
GeForce GTX 1070 Max-Q:
121 122.7 127 ~ 124 fps
GeForce GTX 1070 Ti (Desktop):
156  fps
ultra 1920x1080
GeForce GTX 1070 Max-Q:
93.4 94.2 96 ~ 95 fps
GeForce GTX 1070 Ti (Desktop):
122  fps
4K 3840x2160
GeForce GTX 1070 Max-Q:
39.1  fps
GeForce GTX 1070 Ti (Desktop):
47.9  fps
high 1920x1080
GeForce GTX 1070 Max-Q:
135 138 142 ~ 138 fps
ultra 1920x1080
GeForce GTX 1070 Max-Q:
116 116 117 ~ 116 fps
4K 3840x2160
GeForce GTX 1070 Max-Q:
38.6  fps
high 1920x1080
GeForce GTX 1070 Max-Q:
68.8 71.1 ~ 70 fps
ultra 1920x1080
GeForce GTX 1070 Max-Q:
51.5 55.3 ~ 53 fps
4K 3840x2160
GeForce GTX 1070 Max-Q:
28  fps
high 1920x1080
GeForce GTX 1070 Max-Q:
79.5 81.2 ~ 80 fps
ultra 1920x1080
GeForce GTX 1070 Max-Q:
68 73.4 ~ 71 fps
high 1920x1080
GeForce GTX 1070 Max-Q:
115  fps
ultra 1920x1080
GeForce GTX 1070 Max-Q:
106  fps
4K 3840x2160
GeForce GTX 1070 Max-Q:
52.4  fps
GeForce GTX 1070 Ti (Desktop):
67.8  fps
high 1920x1080
GeForce GTX 1070 Max-Q:
118  fps
ultra 1920x1080
GeForce GTX 1070 Max-Q:
104  fps
4K 3840x2160
GeForce GTX 1070 Max-Q:
37.4  fps
4K 3840x2160
GeForce GTX 1070 Ti (Desktop):
80  fps
low 1280x720
GeForce GTX 1070 Max-Q:
123.2  fps
med. 1366x768
GeForce GTX 1070 Max-Q:
105.5  fps
high 1920x1080
GeForce GTX 1070 Max-Q:
91.5 106 108 ~ 102 fps
ultra 1920x1080
GeForce GTX 1070 Max-Q:
90.7 96.4 96.6 ~ 95 fps
4K 3840x2160
GeForce GTX 1070 Max-Q:
38.9 39.1 ~ 39 fps
ultra 1920x1080
GeForce GTX 1070 Ti (Desktop):
108  fps
4K 3840x2160
GeForce GTX 1070 Ti (Desktop):
91  fps
Mafia 3

Mafia 3

2016
high 1920x1080
GeForce GTX 1070 Max-Q:
51.6 51.8 55.1 56 ~ 54 fps
4K 3840x2160
GeForce GTX 1070 Max-Q:
20.6  fps
FIFA 17

FIFA 17

2016
high 1920x1080
GeForce GTX 1070 Max-Q:
215  fps
ultra 1920x1080
GeForce GTX 1070 Max-Q:
212  fps
4K 3840x2160
GeForce GTX 1070 Max-Q:
144  fps
high 1920x1080
GeForce GTX 1070 Max-Q:
68.1 73.9 ~ 71 fps
ultra 1920x1080
GeForce GTX 1070 Max-Q:
37.9 40.4 ~ 39 fps
GeForce GTX 1070 Ti (Desktop):
67.9  fps
4K 3840x2160
GeForce GTX 1070 Max-Q:
24.5  fps
GeForce GTX 1070 Ti (Desktop):
31.9  fps
high 1920x1080
GeForce GTX 1070 Max-Q:
86.4 87.3 ~ 87 fps
ultra 1920x1080
GeForce GTX 1070 Max-Q:
78.6 80.2 ~ 79 fps
4K 3840x2160
GeForce GTX 1070 Max-Q:
31.5  fps
Overwatch

Overwatch

2016
ultra 1920x1080
GeForce GTX 1070 Max-Q:
81.3 136.2 138.1 ~ 119 fps
GeForce GTX 1070 Ti (Desktop):
182  fps
4K 3840x2160
GeForce GTX 1070 Max-Q:
70.1  fps
GeForce GTX 1070 Ti (Desktop):
88.7  fps
Doom

Doom

2016
high 1920x1080
GeForce GTX 1070 Max-Q:
115 115 ~ 115 fps
ultra 1920x1080
GeForce GTX 1070 Max-Q:
106 112 ~ 109 fps
4K 3840x2160
GeForce GTX 1070 Max-Q:
44.4  fps
med. 1920x1080
GeForce GTX 1070 Max-Q:
67 67.5 74.2 ~ 70 fps
high 1920x1080
GeForce GTX 1070 Max-Q:
63.5 65.2 72.8 ~ 67 fps
high 1920x1080
GeForce GTX 1070 Max-Q:
83.9 88.6 ~ 86 fps
ultra 1920x1080
GeForce GTX 1070 Max-Q:
65.3 72 ~ 69 fps
GeForce GTX 1070 Ti (Desktop):
94.6  fps
4K 3840x2160
GeForce GTX 1070 Max-Q:
33.6  fps
GeForce GTX 1070 Ti (Desktop):
45.6  fps
high 1920x1080
GeForce GTX 1070 Max-Q:
92  fps
ultra 1920x1080
GeForce GTX 1070 Max-Q:
76  fps
GeForce GTX 1070 Ti (Desktop):
98  fps
4K 3840x2160
GeForce GTX 1070 Max-Q:
34  fps
GeForce GTX 1070 Ti (Desktop):
41  fps
low 1024x768
GeForce GTX 1070 Max-Q:
131.1 202.7 217.5 ~ 184 fps
med. 1366x768
GeForce GTX 1070 Max-Q:
126.7 166 166.2 ~ 153 fps
high 1920x1080
GeForce GTX 1070 Max-Q:
85.7 97.7 97.8 100 102.8 ~ 97 fps
ultra 1920x1080
GeForce GTX 1070 Max-Q:
77.1 79.7 80 82.4 83.5 85.1 85.9 ~ 82 fps
GeForce GTX 1070 Ti (Desktop):
111  fps
4K 3840x2160
GeForce GTX 1070 Max-Q:
32.1 33.6 36 ~ 34 fps
GeForce GTX 1070 Ti (Desktop):
46.5  fps
high 1920x1080
GeForce GTX 1070 Max-Q:
161 168 ~ 165 fps
ultra 1920x1080
GeForce GTX 1070 Max-Q:
143 144 ~ 144 fps
GeForce GTX 1070 Ti (Desktop):
177  fps
4K 3840x2160
GeForce GTX 1070 Max-Q:
54.4  fps
GeForce GTX 1070 Ti (Desktop):
77  fps
high 1920x1080
GeForce GTX 1070 Max-Q:
136  fps
ultra 1920x1080
GeForce GTX 1070 Max-Q:
121  fps
4K 3840x2160
GeForce GTX 1070 Max-Q:
44.7  fps
high 1920x1080
GeForce GTX 1070 Max-Q:
78.8  fps
ultra 1920x1080
GeForce GTX 1070 Max-Q:
43.6  fps
4K 3840x2160
GeForce GTX 1070 Max-Q:
33.4  fps
Fallout 4

Fallout 4

2015
ultra 1920x1080
GeForce GTX 1070 Max-Q:
88.3 88.4 95.3 ~ 91 fps
4K 3840x2160
GeForce GTX 1070 Max-Q:
34.3  fps
low 1366x768
GeForce GTX 1070 Max-Q:
205.4  fps
med. 1366x768
GeForce GTX 1070 Max-Q:
169.8  fps
high 1920x1080
GeForce GTX 1070 Max-Q:
146.3  fps
ultra 1920x1080
GeForce GTX 1070 Max-Q:
140.7  fps
high 1920x1080
GeForce GTX 1070 Max-Q:
60  fps
ultra 1920x1080
GeForce GTX 1070 Max-Q:
60 60 60 ~ 60 fps
4K 3840x2160
GeForce GTX 1070 Max-Q:
59  fps
low 1280x720
100%
RTX A500 Laptop GPU:
157.7 160.4 ~ 159 fps
80%
GeForce GTX 1070 Max-Q:
126.9  fps
90%
GeForce GTX 1070 Ti (Desktop):
142.7  fps
med. 1366x768
100%
RTX A500 Laptop GPU:
130.5 131.1 ~ 131 fps
90%
GeForce GTX 1070 Max-Q:
118.2  fps
102%
GeForce GTX 1070 Ti (Desktop):
134.2  fps
high 1920x1080
100%
RTX A500 Laptop GPU:
96.2 111.9 ~ 104 fps
107%
GeForce GTX 1070 Max-Q:
111.7  fps
122%
GeForce GTX 1070 Ti (Desktop):
126.6  fps
ultra 1920x1080
100%
RTX A500 Laptop GPU:
91.6 104.8 ~ 98 fps
112%
GeForce GTX 1070 Max-Q:
109.7  fps
124%
GeForce GTX 1070 Ti (Desktop):
121.2  fps
4K 3840x2160
GeForce GTX 1070 Ti (Desktop):
105  fps
high 1920x1080
GeForce GTX 1070 Max-Q:
94 106 111 112 ~ 106 fps
ultra 1920x1080
GeForce GTX 1070 Max-Q:
56 64 73 73 79 ~ 69 fps
4K 3840x2160
GeForce GTX 1070 Max-Q:
37 40 ~ 39 fps
low 1024x768
100%
RTX A500 Laptop GPU:
134.6 174.5 ~ 155 fps
147%
GeForce GTX 1070 Max-Q:
175.7 218.5 232.8 236.2 251 254 ~ 228 fps
189%
GeForce GTX 1070 Ti (Desktop):
293  fps
med. 1366x768
100%
RTX A500 Laptop GPU:
81.6 104.1 ~ 93 fps
174%
GeForce GTX 1070 Max-Q:
140.8 156.7 164.8 165.2 170.8 173.9 ~ 162 fps
high 1920x1080
100%
RTX A500 Laptop GPU:
53.4 56.8 ~ 55 fps
171%
GeForce GTX 1070 Max-Q:
71.2 89.9 90.3 90.4 91.3 91.6 92.8 93.2 94.5 95.5 96 97 97.1 97.7 98.2 99.4 100 101.6 ~ 94 fps
ultra 1920x1080
100%
RTX A500 Laptop GPU:
26.3 31.1 ~ 29 fps
176%
GeForce GTX 1070 Max-Q:
46 48.9 49.2 49.6 49.8 50.2 50.2 50.7 51 51.3 51.5 52.4 52.4 52.7 53.5 53.7 54.2 55.3 55.3 ~ 51 fps
248%
GeForce GTX 1070 Ti (Desktop):
71.8  fps
4K 3840x2160
GeForce GTX 1070 Max-Q:
27.7 35.4 ~ 32 fps
GeForce GTX 1070 Ti (Desktop):
47.1  fps
GTA V

GTA V

2015
low 1024x768
100%
RTX A500 Laptop GPU:
173.3  fps
96%
GeForce GTX 1070 Max-Q:
166.7  fps
med. 1366x768
100%
RTX A500 Laptop GPU:
161.7  fps
99%
GeForce GTX 1070 Max-Q:
159.8  fps
high 1920x1080
100%
RTX A500 Laptop GPU:
89.7  fps
163%
GeForce GTX 1070 Max-Q:
145.9  fps
ultra 1920x1080
100%
RTX A500 Laptop GPU:
42.9  fps
151%
GeForce GTX 1070 Max-Q:
64.6  fps
QHD 2560x1440
100%
RTX A500 Laptop GPU:
29.8  fps
4K 3840x2160
GeForce GTX 1070 Ti (Desktop):
67  fps
Thief

Thief

2014
high 1366x768
GeForce GTX 1070 Max-Q:
70.8  fps
ultra 1920x1080
GeForce GTX 1070 Max-Q:
68.3 93.3 95.1 98.8 ~ 89 fps
high 1366x768
GeForce GTX 1070 Max-Q:
170.4  fps
ultra 1920x1080
GeForce GTX 1070 Max-Q:
72.8  fps
ultra 1920x1080
GeForce GTX 1070 Max-Q:
96.1 96.5 108.4 ~ 100 fps
low 1280x720
GeForce GTX 1070 Max-Q:
239.4 249 249.1 291.6 313.8 327.9 ~ 278 fps
med. 1366x768
GeForce GTX 1070 Max-Q:
173.8 210.1 222.1 246.7 247.6 279.9 ~ 230 fps
high 1366x768
GeForce GTX 1070 Max-Q:
161.5 188.4 194.4 204.7 230.8 242.8 256 ~ 211 fps
ultra 1920x1080
GeForce GTX 1070 Max-Q:
109.6 118 123.6 123.9 127.6 130.5 131.6 132.1 136.8 139.4 ~ 127 fps
GeForce GTX 1070 Ti (Desktop):
132  fps
low 1024x768
GeForce GTX 1070 Max-Q:
407.5 478.7 ~ 443 fps
med. 1366x768
GeForce GTX 1070 Max-Q:
376.4 439.3 ~ 408 fps
high 1366x768
GeForce GTX 1070 Max-Q:
339.3 371.5 ~ 355 fps
ultra 1920x1080
GeForce GTX 1070 Max-Q:
179.1 185.2 ~ 182 fps
ultra 1920x1080
GeForce GTX 1070 Max-Q:
62.2 70 ~ 66 fps

Average Gaming NVIDIA RTX A500 Laptop GPU → 100%

Average Gaming 30-70 fps → 100%

Average Gaming NVIDIA GeForce GTX 1070 Max-Q → 132%

Average Gaming 30-70 fps → 161%

Average Gaming NVIDIA GeForce GTX 1070 Ti (Desktop) → 159%

Average Gaming 30-70 fps → 197%

NVIDIA RTX A500 Laptop GPUlowmed.highultraQHD4K
F1 2482.471.932.911.7
Ghost of Tsushima34.627.519.114.1
Dragon's Dogma 223.614.5
Alone in the Dark80.168.658.643.8
Last Epoch76.758.249.333.3
Helldivers 219.512.81210.9
Enshrouded24.418.714.38.28
Cyberpunk 2077 2.1 Phantom Liberty4232242010.44.29
Baldur's Gate 34033292817.8
F1 235756.343.110.96.63
Hogwarts Legacy2319.610.65.43
F1 2292.585.257.816.9
Tiny Tina's Wonderlands66.253.536.227.6
Strange Brigade17676625439.2
Far Cry 582544844
X-Plane 11.111169478
Final Fantasy XV Benchmark85453223.3
Dota 2 Reborn15913110498
The Witcher 3155935529
GTA V173.3161.789.742.929.8
< 30 fps
< 60 fps
< 120 fps
≥ 120 fps
4
4
8
4
4
7
6
2
7
9
4
11
5
1
5
1

1


NVIDIA GeForce GTX 1070 Ti (Desktop)lowmed.highultraQHD4K
Control2007858.537.117.9
F1 20192441831641209457
League of Legends271249241219222221
Total War: Three Kingdoms86.663.441.220.3
Anno 18004640.424.1
Far Cry New Dawn121107103937642
Metro Exodus147836352.340.224.6
Apex Legends1441381231218142.4
Just Cause 4886435.3
Darksiders III1107435.4
Battlefield V1118347.1
Call of Duty Black Ops 41208040.1
Assassin´s Creed Odyssey634827
Forza Horizon 41008155
FIFA 19267141
Shadow of the Tomb Raider845128
F1 2018977849
Monster Hunter World7848.523.8
Far Cry 51351141081027539
X-Plane 11.111018974.566.7
Kingdom Come: Deliverance1541008259.142.422.7
Final Fantasy XV Benchmark146876327.7
Fortnite1097236
Star Wars Battlefront 21177738
Need for Speed Payback1228545
Assassin´s Creed Origins1039288755834
Middle-earth: Shadow of War1651361098534
Ark Survival Evolved47.117.3
F1 201710652
Team Fortress 2152
Dirt 457.9
Rocket League22392
Ghost Recon Wildlands54.235.8
For Honor15612247.9
Call of Duty Infinite Warfare67.8
Farming Simulator 1780
Civilization VI10891
Deus Ex Mankind Divided67.931.9
Overwatch18288.7
The Division94.645.6
Far Cry Primal9841
Rise of the Tomb Raider11146.5
Rainbow Six Siege17777
Dota 2 Reborn142.7134.2126.6121.2105
The Witcher 329371.847.1
GTA V67
BioShock Infinite132
< 30 fps
< 60 fps
< 120 fps
≥ 120 fps


2
12


8
5

1
9
6

5
22
11

9
13
1
10
24
9
3
NVIDIA GeForce GTX 1070 Max-Qlowmed.highultraQHD4K
Just Cause 4126.186.178.875.7
Darksiders III169.283.968.359.7
Battlefield V140.780.68175
Farming Simulator 19214.4167.6110.489.6
Fallout 766060
Hitman 29280.57168
Call of Duty Black Ops 4169.81059589
Assassin´s Creed Odyssey6462574221
Forza Horizon 4127101977943
FIFA 19199194
Shadow of the Tomb Raider11172675920
F1 20181631301067459
Monster Hunter World156.588.47859
The Crew 26060
Far Cry 510381797527
X-Plane 11.1110996.581.1
Kingdom Come: Deliverance6953
Final Fantasy XV Benchmark50
Fortnite121101
Star Wars Battlefront 28876
Need for Speed Payback112.495.99287
Call of Duty WWII163.3133.510794
Wolfenstein II: The New Colossus9589
Assassin´s Creed Origins6759645526
Destiny 2152.6137.4130.8111
ELEX122988668
The Evil Within 288.553.35252
Middle-earth: Shadow of War112988567
FIFA 18199194
Ark Survival Evolved158.362.745.731.9
F1 20171198036
Playerunknown's Battlegrounds (PUBG)10993.71077722.4
Team Fortress 2128.4126.3122120.8
Dirt 41187640.5
Rocket League20083.8
Prey13713548
Warhammer 40.000: Dawn of War III167.3106.4100.989.9
Mass Effect Andromeda150.1110.877.668.5
Ghost Recon Wildlands148.486784429
For Honor203.9128.61249539.1
Resident Evil 713811638.6
Watch Dogs 2705328
Dishonored 28071
Call of Duty Infinite Warfare11510652.4
Titanfall 211810437.4
Battlefield 1123.2105.51029539
Mafia 35420.6
FIFA 17215212144
Deus Ex Mankind Divided713924.5
Mirror's Edge Catalyst877931.5
Overwatch11970.1
Doom11510944.4
Ashes of the Singularity7067
The Division866933.6
Far Cry Primal927634
Rise of the Tomb Raider184153978234
Rainbow Six Siege16514454.4
Star Wars Battlefront13612144.7
Assassin's Creed Syndicate78.843.633.4
Fallout 49134.3
World of Warships205.4169.8146.3140.7
Metal Gear Solid V606059
Dota 2 Reborn126.9118.2111.7109.7
Batman: Arkham Knight1066939
The Witcher 3228162945132
GTA V166.7159.8145.964.6
Thief70.889
Total War: Rome II170.472.8
Metro: Last Light100
BioShock Infinite278230211127
Tomb Raider443408355182
Guild Wars 266
< 30 fps
< 60 fps
< 120 fps
≥ 120 fps


10
25

2
22
12

5
46
17

13
44
10


9
22
2
1

Eine Liste mit weiteren Spielen und allen Grafikkarten finden Sie auf unserer Seite: Welches Spiel ist mit welcher Grafikkarte spielbar?

v1.28
log 19. 21:45:17

#0 ran 0s before starting gpusingle class +0s ... 0s

#1 checking url part for id 11322 +0s ... 0s

#2 checking url part for id 8008 +0s ... 0s

#3 checking url part for id 8258 +0s ... 0s

#4 redirected to Ajax server, took 1726775116s time from redirect:1 +0s ... 0s

#5 did not recreate cache, as it is less than 5 days old! Created at Thu, 19 Sep 2024 05:16:33 +0200 +0s ... 0s

#6 composed specs +0.005s ... 0.005s

#7 did output specs +0s ... 0.005s

#8 start showIntegratedCPUs +0s ... 0.005s

#9 getting avg benchmarks for device 11322 +0.022s ... 0.027s

#10 got single benchmarks 11322 +0.008s ... 0.034s

#11 getting avg benchmarks for device 8008 +0.001s ... 0.036s

#12 got single benchmarks 8008 +0.002s ... 0.038s

#13 getting avg benchmarks for device 8258 +0s ... 0.038s

#14 got single benchmarks 8258 +0.004s ... 0.042s

#15 got avg benchmarks for devices +0s ... 0.042s

#16 min, max, avg, median took s +0.05s ... 0.092s

#17 before gaming benchmark output +0s ... 0.092s

#18 Got 753 rows for game benchmarks. +0.029s ... 0.121s

#19 composed SQL query for gamebenchmarks +0s ... 0.121s

#20 got data and put it in $dataArray +0.005s ... 0.127s

#21 benchmarks composed for output. +0.031s ... 0.157s

#22 calculated avg scores. +0s ... 0.157s

#23 return log +0.001s ... 0.159s

Teilen Sie diesen Artikel, um uns zu unterstützen. Jeder Link hilft!
> Notebook Test, Laptop Test und News > Benchmarks / Technik > Benchmarks / Technik > Grafikkarten Vergleich - Head 2 Head
Autor: Klaus Hinum,  8.09.2017 (Update:  1.07.2023)