NVIDIA Quadro T1000 (Laptop) vs NVIDIA GeForce GTX 1650 Ti Mobile vs NVIDIA Quadro RTX 3000 Max-Q
NVIDIA Quadro T1000 (Laptop) ► remove from comparison
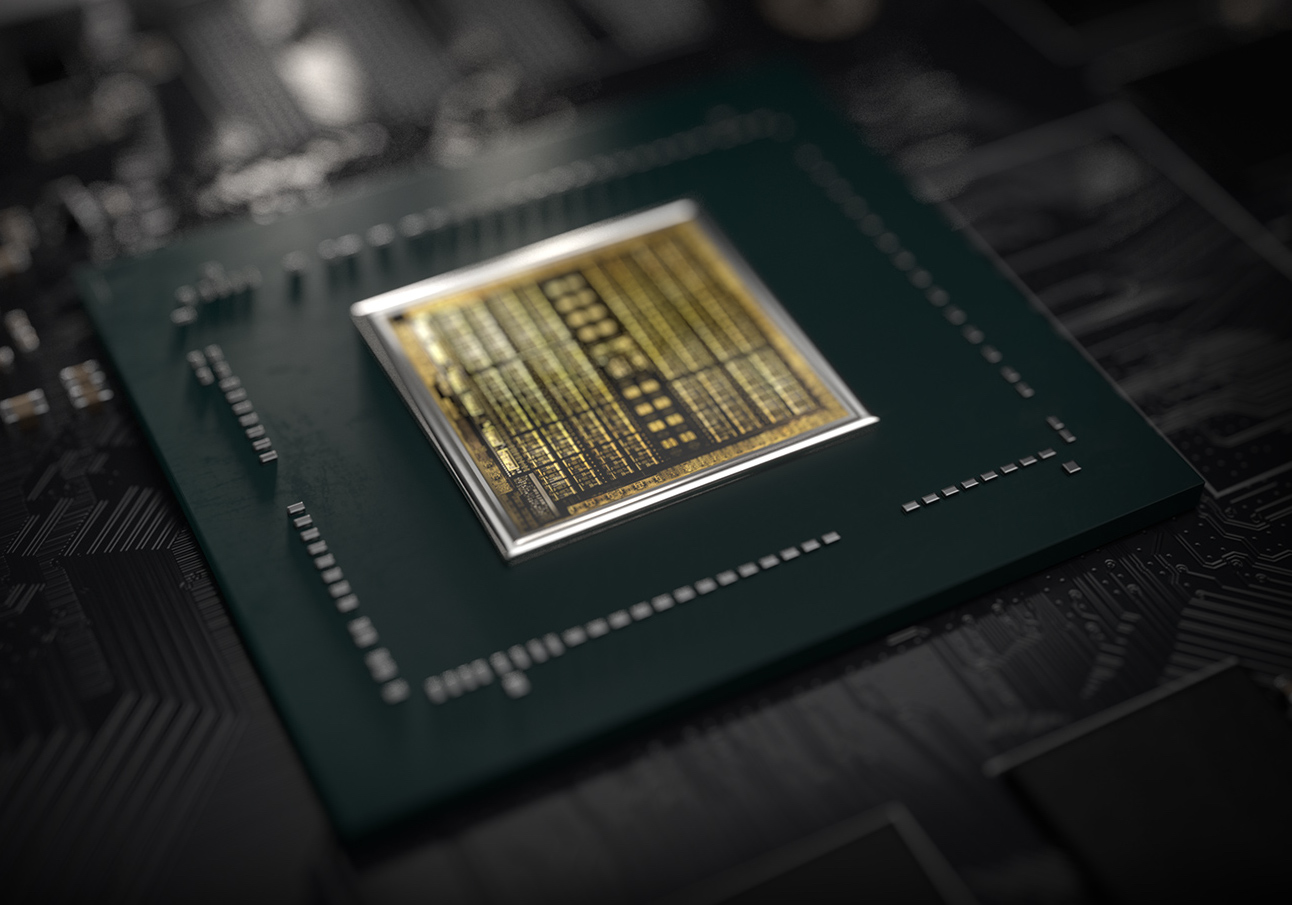
Die Nvidia Quadro T1000 für Laptops ist eine professionelle Grafikkarte für Notebooks und mobile Workstations der Mittelklasse. Sie basiert auf den selben TU117 Turing-Chip wie die Consumer GTX 1650 für Laptops, jedoch mit nur 768 Shader (versus 896 der GTX 1650). Die stärkere Quadro T2000 basiert auf den selben Chip, bietet jedoch doppelt so viele CUDA Kerne und ist damit deutlich schneller.
Die Quadro-Grafikkarten bieten zertifizierte Treiber , welche auf Stabiltität und Performance bei professionellen Anwendungen (CAD-, DCC-, Medizin-, Prospektions-, Visualisierungsanwendungen) optimiert sind. Dadurch ist die Performance im Vergleich zu den Consumergrafikkarten mit gleichem Chip in diesen Bereichen deutlich besser.
Die kleineren Chips der Turing Serie bietet im Unterschied zu den stärkeren RTX Karten (z.B. Quadro RTX 3000 ) keine Raytracing und Tensor Kerne. Bei der Turing Architektur gab es auch auf der Ebene der CUDA-Kerne deutliche Verbesserungen. Float und INT Operationen können nun gleichzeitig ausgeführt werden, der Cache wurde vereinheitlicht und verbessert und Adaptive Shading eingeführt. Nvidia spricht dadurch von einer bis zu 50% höheren Leistung pro Kern im Vergleich zu Pascal.
NVIDIA GeForce GTX 1650 Ti Mobile ► remove from comparison
Die Nvidia GeForce GTX 1650 Ti Mobile (N18P-G62) für Laptops ist eine mobile Grafikkarte basierend auf der Turing Architektur. Sie basiert wie die Desktop-Version auf den TU117 Chip, nutzt jedoch alle 1024 Shader. Die GTX 1650 Serie bietet im Unterschied zu den stärkeren RTX 2000er Karten (z.B. RTX 2060 ) keine Raytracing und Tensor Kerne. Die Leistung sollte leicht oberhalb einer mobilen GTX 1650 liegen, es kommen jedoch anscheinend unterschiedliche Versionen zum Einsatz.
Es gibt eine N18P-G62-B-KC-A1 welche im selben Package geliefert wird wie die schnelleren RTX Refresh GPUs und eine N18P-62-A1 im selben Package wie die GTX 1650. Die Varianten sollten sich beim Speicherbus (128 und 256 Bit) und TGP (50 vs 55 Watt) unterscheiden.
Bei der Turing Architektur gab es auch auf der Ebene der CUDA-Kerne deutliche Verbesserungen. Float und INT Operationen können nun gleichzeitig ausgeführt werden, der Cache wurde vereinheitlicht und verbessert und Adaptive Shading eingeführt. Nvidia spricht dadurch von einer bis zu 50% höheren Leistung pro Kern im Vergleich zu Pascal.
Im Gegensatz zu den größeren Turing Chips (wie den TU116 der GTX 1660 Ti) bietet der TU117 nur die älteren NVENC Videoenkodierung der Pascal / Volta Generation.
Nvidia spezifiziert einen Stromverbrauch von 50 - 80 Watt TGP (Total Graphics Power) für die Grafikkarte und damit 15 Watt mehr als die langsamere und effizientere Max-Q Variante der GTX1650 . Der TU117 Chip wird bei TSMC im 12nm FFN Verfahren gefertigt.
NVIDIA Quadro RTX 3000 Max-Q ► remove from comparison
Die Nvidia Quadro RTX 3000 with Max-Q Design ist eine professionelle Grafikkarte für große Notebooks / mobile Workstations. Die Max-Q Variante ist eine auf Effizienz optimierte Version der RTX 3000 mit verringerten Taktraten. Sie basiert auf den selben Chip wie die Consumer GeForce RTX 2070 Max-Q jedoch mit zertifizierten Treibern für professionelle Anwendungen, weniger Shader und geringeren Taktraten und langsameren, aber größerem Grafikspeicher. Nach aktuellen Informationen gibt es drei verschiedene Max-Q Varianten mit einem Stromverbrauch der Karte (TGP) von 70, 65 und 60 Watt im Vergleich zu den 80 Watt der normalen mobilen RTX 3000.
Variante Shader TGP (W) Base (MHz) Boost (MHz) Quadro RTX 4000 Desktop 2304 160 1005 1545 Quadro RTX 3000 Mobile 1920 80 945 1380 Quadro RTX 3000 Max-Q 1920 70 870 1380 Quadro RTX 4000 Max-Q 2304 65 765 1305 Quadro RTX 4000 Max-Q 2304 60 600 1215 GeForce RTX 2070 Mobile 2304 115? 1215 1440
Die Quadro-Grafikkarten bieten zertifizierte Treiber , welche auf Stabiltität und Performance bei professionellen Anwendungen (CAD-, DCC-, Medizin-, Prospektions-, Visualisierungsanwendungen) optimiert sind. Dadurch ist die Performance im Vergleich zu den Consumergrafikkarten mit gleichem Chip in diesen Bereichen deutlich besser.
Features
Der TU106-Chip wird in 12nm gefertigt und bietet eine Reihe neuer Features, wie DLSS (Deep Learning Super Sampling) und Real Time Ray Tracing. Dadurch lassen sich vor allem Beleuchtungseffekte sehr viel realistischer darstellen. Weiterhin gibt es Support für DisplayPort 1.4 (ready), HDMI 2.0b, HDR, Simultaneous Multi-Projection (SMP) sowie H.265 Video De- und Encoding (PlayReady 3.0).
Performance
Je nach Variante, kann die Max-Q Version deutlich Performance zur normalen RTX 4000 einbüßen. Zwar ist der maximale Boost-Takt bei der schnellsten Variante vergleichbar, der garantierte Basistakt liegt jedoch deutlich darunter. Dadurch ist die Performance stark von der Kühlung abhängig.
Im Vergleich zu Consumer-Karten, wie der höher gektateten RTX 2070 Max-Q verhelfen die Quadro Treiber der RTX 3000 Max-q jedoch zu einer höheren Performance.
Mit einem TDP von 60-70 Watt benötigt die Quadro RTX 3000 Max-Q zwar deutlich weniger als die stärkeren RTX 4000 und 5000 GPUs, jedoch eignet sie sich trotzdem nur für große Workstation Laptops.
NVIDIA Quadro T1000 (Laptop) NVIDIA GeForce GTX 1650 Ti Mobile NVIDIA Quadro RTX 3000 Max-Q Quadro Turing Serie Codename N19P-Q1 N18P-G62 N19E-Q1 MAX-Q Architektur Turing Turing Turing Pipelines 768 - unified 1024 - unified 1920 - unified Kerntakt 1395 - 1455 (Boost) MHz 1350 - 1485 (Boost) MHz 600 - 870 - 1215 - 1380 (Boost) MHz Speichertakt 8000 MHz 12000 effective = 1500 MHz 14000 MHz Speicherbandbreite 128 Bit 128 Bit 192 Bit Speichertyp GDDR5 GDDR6 GDDR6 Max. Speichergröße 4 GB 4 GB 6 GB Shared Memory nein nein nein API DirectX 12_1, OpenGL 4.6 DirectX 12_1, OpenGL 4.6 DirectX 12_1, OpenGL 4.6 Stromverbrauch 50 Watt 50 Watt (50 - 80 Watt TGP) 60 - 70 Watt Herstellungsprozess 12 nm 12 nm 12 nm Notebookgröße mittel (15.4" z.B.) mittel (15.4" z.B.) groß (17" z.B.) Erscheinungsdatum 27.05.2019 02.04.2020 27.05.2019 TMUs 64 ROPs 32 Memory Bandwidth 192 GB/s Transistors 4.7 Billion 10.8 Billion Die Size 200 mm² PCIe 3.0 Herstellerseite www.nvidia.com Features DLSS, Raytraycing, VR Ready, G-SYNC, Vulkan, Multi Monitor
Benchmarks Performance Rating - 3DMark 11 + Fire Strike + Time Spy - Quadro T1000 (Laptop)
3.9 pt (12%)
...
NVIDIA Quadro T1000 (Laptop)
...
max:
Performance Rating - 3DMark 11 + Fire Strike + Time Spy - GeForce GTX 1650 Ti Mobile
4.4 pt (13%)
...
NVIDIA GeForce GTX 1650 Ti Mobile
...
max:
Performance Rating - 3DMark 11 + Fire Strike + Time Spy - Quadro RTX 3000 Max-Q
6 pt (18%)
...
NVIDIA Quadro RTX 3000 Max-Q
...
max:
3DMark - 3DMark Time Spy Score
min: 3006 avg: 3348 median: 3474 (10%) max: 3565 Points
GPU TDP ? TDP 50 W 91% 100%
min: 3738 avg: 3918 median: 3851 (11%) max: 4201 Points
GPU TDP ? TDP 50 W 100% 98%
min: 5070 avg: 5388 median: 5357 (15%) max: 5737 Points
GPU TDP ? TDP 50 W TDP 60 W 76% 69% 100%
3DMark - 3DMark Time Spy Graphics
min: 2834 avg: 3123 median: 3261 (9%) max: 3273 Points
GPU TDP ? TDP 50 W 93% 100%
min: 3554 avg: 3689 median: 3618 (10%) max: 3904 Points
GPU TDP ? TDP 50 W 100% 95%
min: 4943 avg: 5132 median: 5048 (13%) max: 5405 Points
GPU TDP ? TDP 50 W TDP 60 W 76% 68% 100%
3DMark - 3DMark Ice Storm Unlimited Graphics
375510 Points (38%)
min: 393082 avg: 405955 median: 410191 (41%) max: 414592 Points
GPU TDP ? TDP 50 W 95% 100%
3DMark - 3DMark Ice Storm Extreme Graphics
122046 Points (14%)
min: 97700 avg: 109711 median: 109711 (13%) max: 121722 Points
3DMark - 3DMark Cloud Gate Score
min: 23601 avg: 25273 median: 25273 (24%) max: 26945 Points
min: 20269 avg: 28454 median: 28177 (27%) max: 33407 Points
GPU TDP ? TDP 50 W 81% 100%
min: 32299 avg: 33282 median: 33281.5 (31%) max: 34264 Points
GPU TDP ? TDP 50 W 85% 100%
3DMark - 3DMark Cloud Gate Graphics
min: 48965 avg: 53629 median: 53628.5 (13%) max: 58292 Points
min: 34971 avg: 59364 median: 65163 (16%) max: 70377 Points
GPU TDP ? TDP 50 W 85% 100%
min: 54418 avg: 66284 median: 66284 (16%) max: 78150 Points
GPU TDP ? TDP 50 W 87% 100%
3DMark - 3DMark Fire Strike Standard Score
min: 6812 avg: 7589 median: 7783 (13%) max: 8173 Points
GPU TDP ? TDP 50 W 89% 100%
min: 8780 avg: 9250 median: 9222 (15%) max: 9800 Points
GPU TDP ? TDP 50 W 100% 97%
min: 12130 avg: 12705 median: 12642 (21%) max: 13342 Points
GPU TDP ? TDP 50 W TDP 60 W 75% 68% 100%
3DMark - 3DMark Fire Strike Standard Graphics
min: 7558 avg: 8347 median: 8727 (10%) max: 8757 Points
GPU TDP ? TDP 50 W 93% 100%
min: 9691 avg: 10133 median: 9930 (11%) max: 10733 Points
GPU TDP ? TDP 50 W 100% 95%
min: 13196 avg: 13714 median: 13617 (15%) max: 14328 Points
GPU TDP ? TDP 50 W TDP 60 W 77% 68% 100%
3DMark - 3DMark Ice Storm Graphics
min: 86096 avg: 111211 median: 111211 (12%) max: 136326 Points
min: 98715 avg: 110988 median: 110988 (12%) max: 123260 Points
86888 Points (10%)
3DMark - 3DMark Wild Life Unlimited
min: 23435 avg: 24074 median: 24073.5 (12%) max: 24712 Points
GPU TDP ? TDP 50 W 100% 95%
3DMark - 3DMark Night Raid
27759 Points (26%)
3DMark - 3DMark Night Raid Graphics Score
44557 Points (17%)
3DMark 11 - 3DM11 Performance Score
min: 10211 avg: 11241 median: 11592 (15%) max: 11919 Points
GPU TDP ? TDP 50 W 95% 100%
min: 12192 avg: 13097 median: 13072.5 (17%) max: 14125 Points
GPU TDP ? TDP 50 W 100% 99%
min: 14763 avg: 16774 median: 16577 (21%) max: 18981 Points
GPU TDP ? TDP 50 W TDP 60 W 81% 75% 100%
3DMark 11 - 3DM11 Performance GPU
min: 10407 avg: 11305 median: 11377 (10%) max: 12132 Points
GPU TDP ? TDP 50 W 99% 100%
min: 12865 avg: 13515 median: 13266 (11%) max: 14415 Points
GPU TDP ? TDP 50 W 100% 94%
min: 17074 avg: 18037 median: 17523 (15%) max: 19513 Points
GPU TDP ? TDP 50 W TDP 60 W 80% 70% 100%
3DMark Vantage + NVIDIA Quadro T1000 (Laptop) 3DMark Vantage - 3DM Vant. Perf. total
31509 Points (9%)
3DM Vant. Perf. total + NVIDIA GeForce GTX 1650 Ti Mobile
43517 Points (13%)
3DM Vant. Perf. GPU no PhysX + NVIDIA Quadro T1000 (Laptop) 3DMark Vantage - 3DM Vant. Perf. GPU no PhysX
33740 Points (18%)
3DM Vant. Perf. GPU no PhysX + NVIDIA GeForce GTX 1650 Ti Mobile
40643 Points (22%)
3DMark 06 3DMark 06 - Standard 1280x1024 + NVIDIA Quadro T1000 (Laptop)
min: 33809 avg: 35034 median: 35033.5 (46%) max: 36258 Points
3DMark 06 - Standard 1280x1024 + NVIDIA GeForce GTX 1650 Ti Mobile
39720 Points (52%)
Unigine Valley 1.0 - Unigine Valley 1.0 DX
min: 36.7 avg: 39.3 median: 39.3 (12%) max: 41.9 fps
68 fps (21%)
Unigine Heaven 3.0 - Unigine Heaven 3.0 DX 11
110.3 fps (37%)
Unigine Heaven 3.0 - Unigine Heaven 3.0 OpenGL
101.1 fps (45%)
Unigine Heaven 2.1 - Heaven 2.1 high
min: 136.9 avg: 149.7 median: 149.7 (28%) max: 162.4 fps
Blender - Blender 3.3 Classroom CUDA *
141 Seconds (21%)
Blender - Blender 3.3 Classroom OPTIX *
141 Seconds (52%)
SPECviewperf 12 + NVIDIA Quadro T1000 (Laptop) SPECviewperf 12 - specvp12 sw-03
113.8 fps (28%)
specvp12 sw-03 + NVIDIA Quadro RTX 3000 Max-Q
min: 108.6 avg: 110.3 median: 110.3 (27%) max: 111.9 fps
specvp12 snx-02 + NVIDIA Quadro T1000 (Laptop) SPECviewperf 12 - specvp12 snx-02
82.7 fps (12%)
specvp12 snx-02 + NVIDIA Quadro RTX 3000 Max-Q
min: 90.5 avg: 96.8 median: 96.8 (14%) max: 103 fps
specvp12 showcase-01 + NVIDIA Quadro T1000 (Laptop) SPECviewperf 12 - specvp12 showcase-01
40.3 fps (9%)
specvp12 showcase-01 + NVIDIA Quadro RTX 3000 Max-Q
min: 67.8 avg: 70.6 median: 70.6 (15%) max: 73.3 fps
specvp12 mediacal-01 + NVIDIA Quadro T1000 (Laptop) SPECviewperf 12 - specvp12 mediacal-01
min: 24.99 avg: 29.9 median: 29.9 (8%) max: 34.8 fps
specvp12 mediacal-01 + NVIDIA Quadro RTX 3000 Max-Q
min: 41.02 avg: 43.8 median: 43.8 (11%) max: 46.63 fps
specvp12 maya-04 + NVIDIA Quadro T1000 (Laptop) SPECviewperf 12 - specvp12 maya-04
min: 47.5 avg: 56.3 median: 56.3 (15%) max: 65.1 fps
specvp12 maya-04 + NVIDIA Quadro RTX 3000 Max-Q
min: 58.5 avg: 61.6 median: 61.6 (17%) max: 64.7 fps
specvp12 energy-01 + NVIDIA Quadro T1000 (Laptop) SPECviewperf 12 - specvp12 energy-01
min: 5.79 avg: 6.8 median: 6.8 (6%) max: 7.9 fps
specvp12 energy-01 + NVIDIA Quadro RTX 3000 Max-Q
min: 9.99 avg: 10.6 median: 10.6 (9%) max: 11.25 fps
specvp12 creo-01 + NVIDIA Quadro T1000 (Laptop) SPECviewperf 12 - specvp12 creo-01
min: 75 avg: 79.5 median: 79.5 (32%) max: 83.9 fps
specvp12 creo-01 + NVIDIA Quadro RTX 3000 Max-Q
min: 99.1 avg: 109.8 median: 109.8 (44%) max: 120.4 fps
specvp12 catia-04 + NVIDIA Quadro T1000 (Laptop) SPECviewperf 12 - specvp12 catia-04
min: 82.4 avg: 87.7 median: 87.7 (14%) max: 93 fps
specvp12 catia-04 + NVIDIA Quadro RTX 3000 Max-Q
min: 97.4 avg: 104.8 median: 104.8 (17%) max: 112.1 fps
specvp12 3dsmax-05 + NVIDIA Quadro T1000 (Laptop) SPECviewperf 12 - specvp12 3dsmax-05
min: 85.5 avg: 93.8 median: 93.8 (16%) max: 102.1 fps
SPECviewperf 13 specvp13 sw-04 + NVIDIA Quadro T1000 (Laptop) SPECviewperf 13 - specvp13 sw-04
min: 89.2 avg: 99.7 median: 104.4 (28%) max: 105.6 fps
GPU TDP ? TDP 50 W 92% 100%
specvp13 sw-04 + NVIDIA Quadro RTX 3000 Max-Q
min: 110.8 avg: 120.4 median: 123.7 (33%) max: 126.7 fps
GPU TDP ? TDP 50 W TDP 60 W 84% 83% 100%
specvp13 snx-03 + NVIDIA Quadro T1000 (Laptop) SPECviewperf 13 - specvp13 snx-03
min: 127.8 avg: 136.4 median: 133.1 (15%) max: 148.4 fps
GPU TDP ? TDP 50 W 100% 96%
specvp13 snx-03 + NVIDIA Quadro RTX 3000 Max-Q
min: 179.4 avg: 192.4 median: 195.8 (22%) max: 202.1 fps
GPU TDP ? TDP 50 W TDP 60 W 84% 68% 100%
specvp13 showcase-02 + NVIDIA Quadro T1000 (Laptop) SPECviewperf 13 - specvp13 showcase-02
min: 35.27 avg: 40.4 median: 40.2 (9%) max: 45.71 fps
GPU TDP ? TDP 50 W 83% 100%
specvp13 showcase-02 + NVIDIA Quadro RTX 3000 Max-Q
min: 67.8 avg: 70.7 median: 71.5 (16%) max: 72.8 fps
GPU TDP ? TDP 50 W TDP 60 W 76% 64% 100%
specvp13 medical-02 + NVIDIA Quadro T1000 (Laptop) SPECviewperf 13 - specvp13 medical-02
min: 33.45 avg: 41.7 median: 41.6 (9%) max: 50.1 fps
GPU TDP ? TDP 50 W 100% 100%
specvp13 medical-02 + NVIDIA Quadro RTX 3000 Max-Q
min: 67.1 avg: 70.2 median: 69.5 (15%) max: 73.9 fps
GPU TDP ? TDP 50 W TDP 60 W 81% 60% 100%
specvp13 maya-05 + NVIDIA Quadro T1000 (Laptop) SPECviewperf 13 - specvp13 maya-05
min: 101 avg: 109.6 median: 113.3 (13%) max: 114.6 fps
GPU TDP ? TDP 50 W 95% 100%
specvp13 maya-05 + NVIDIA Quadro RTX 3000 Max-Q
min: 146.4 avg: 158.7 median: 160.8 (18%) max: 168.8 fps
GPU TDP ? TDP 50 W TDP 60 W 83% 70% 100%
specvp13 energy-02 + NVIDIA Quadro T1000 (Laptop) SPECviewperf 13 - specvp13 energy-02
min: 12 avg: 15.1 median: 15.6 (5%) max: 17.8 fps
GPU TDP ? TDP 50 W 95% 100%
specvp13 energy-02 + NVIDIA Quadro RTX 3000 Max-Q
min: 25.94 avg: 27.2 median: 27.1 (9%) max: 28.6 fps
GPU TDP ? TDP 50 W TDP 60 W 78% 58% 100%
specvp13 creo-02 + NVIDIA Quadro T1000 (Laptop) SPECviewperf 13 - specvp13 creo-02
min: 99.9 avg: 108.6 median: 109.5 (16%) max: 116.3 fps
GPU TDP ? TDP 50 W 99% 100%
specvp13 creo-02 + NVIDIA Quadro RTX 3000 Max-Q
min: 151.8 avg: 167 median: 168.3 (25%) max: 180.9 fps
GPU TDP ? TDP 50 W TDP 60 W 82% 65% 100%
specvp13 catia-05 + NVIDIA Quadro T1000 (Laptop) SPECviewperf 13 - specvp13 catia-05
min: 121.3 avg: 130 median: 130.5 (15%) max: 138.3 fps
GPU TDP ? TDP 50 W 99% 100%
specvp13 catia-05 + NVIDIA Quadro RTX 3000 Max-Q
min: 166.9 avg: 186.8 median: 194.8 (22%) max: 198.6 fps
GPU TDP ? TDP 50 W TDP 60 W 80% 67% 100%
specvp13 3dsmax-06 + NVIDIA Quadro T1000 (Laptop) SPECviewperf 13 - specvp13 3dsmax-06
min: 83.9 avg: 94.8 median: 98.5 (17%) max: 101.9 fps
GPU TDP ? TDP 50 W 94% 100%
specvp13 3dsmax-06 + NVIDIA Quadro RTX 3000 Max-Q
min: 120.3 avg: 130.4 median: 134.6 (23%) max: 136.2 fps
GPU TDP ? TDP 50 W TDP 60 W 82% 73% 100%
SPECviewperf 2020 specvp2020 solidworks-05 1080p + NVIDIA Quadro T1000 (Laptop) SPECviewperf 2020 - specvp2020 solidworks-05 1080p
78.8 fps (15%)
specvp2020 solidworks-05 1080p + NVIDIA Quadro RTX 3000 Max-Q
93.8 fps (18%)
GPU TDP 50 W TDP 60 W 84% 100%
specvp2020 snx-04 1080p + NVIDIA Quadro T1000 (Laptop) SPECviewperf 2020 - specvp2020 snx-04 1080p
132.7 fps (22%)
specvp2020 snx-04 1080p + NVIDIA Quadro RTX 3000 Max-Q
184 fps (30%)
GPU TDP 50 W TDP 60 W 72% 100%
specvp2020 medical-03 1080p + NVIDIA Quadro T1000 (Laptop) SPECviewperf 2020 - specvp2020 medical-03 1080p
19.2 fps (13%)
specvp2020 medical-03 1080p + NVIDIA Quadro RTX 3000 Max-Q
33.9 fps (22%)
GPU TDP 50 W TDP 60 W 57% 100%
specvp2020 maya-06 1080p + NVIDIA Quadro T1000 (Laptop) SPECviewperf 2020 - specvp2020 maya-06 1080p
134.3 fps (15%)
specvp2020 maya-06 1080p + NVIDIA Quadro RTX 3000 Max-Q
177 fps (20%)
GPU TDP 50 W TDP 60 W 76% 100%
specvp2020 energy-03 1080p + NVIDIA Quadro T1000 (Laptop) SPECviewperf 2020 - specvp2020 energy-03 1080p
15.6 fps (10%)
specvp2020 energy-03 1080p + NVIDIA Quadro RTX 3000 Max-Q
29.3 fps (19%)
GPU TDP 50 W TDP 60 W 53% 100%
specvp2020 creo-03 1080p + NVIDIA Quadro T1000 (Laptop) SPECviewperf 2020 - specvp2020 creo-03 1080p
67.5 fps (33%)
specvp2020 creo-03 1080p + NVIDIA Quadro RTX 3000 Max-Q
101 fps (50%)
GPU TDP 50 W TDP 60 W 67% 100%
specvp2020 catia-06 1080p + NVIDIA Quadro T1000 (Laptop) SPECviewperf 2020 - specvp2020 catia-06 1080p
33.6 fps (20%)
specvp2020 catia-06 1080p + NVIDIA Quadro RTX 3000 Max-Q
56.4 fps (34%)
GPU TDP 50 W TDP 60 W 60% 100%
specvp2020 3dsmax-07 1080p + NVIDIA Quadro T1000 (Laptop) SPECviewperf 2020 - specvp2020 3dsmax-07 1080p
45.3 fps (14%)
specvp2020 3dsmax-07 1080p + NVIDIA Quadro RTX 3000 Max-Q
65.5 fps (20%)
GPU TDP 50 W TDP 60 W 69% 100%
Cinebench R10 Cinebench R10 Shading (32bit) + NVIDIA Quadro T1000 (Laptop) Cinebench R10 - Cinebench R10 Shading (32bit)
6818 Points (5%)
Cinebench R10 Shading (32bit) + NVIDIA GeForce GTX 1650 Ti Mobile
min: 6827 avg: 6832 median: 6831.5 (5%) max: 6836 Points
Cinebench R10 Shading (32bit) + NVIDIA Quadro RTX 3000 Max-Q
6821 Points (5%)
Cinebench R11.5 Cinebench R11.5 OpenGL 64 Bit + NVIDIA Quadro T1000 (Laptop) Cinebench R11.5 - Cinebench R11.5 OpenGL 64 Bit
124 fps (41%)
Cinebench R11.5 OpenGL 64 Bit + NVIDIA GeForce GTX 1650 Ti Mobile
min: 79.9 avg: 83.8 median: 83.8 (28%) max: 87.7 fps
Cinebench R11.5 OpenGL 64 Bit + NVIDIA Quadro RTX 3000 Max-Q
116.6 fps (38%)
Cinebench R15 + NVIDIA Quadro T1000 (Laptop) Cinebench R15 - Cinebench R15 OpenGL 64 Bit
min: 166 avg: 182.6 median: 185.7 (11%) max: 196 fps
GPU TDP ? TDP 50 W 90% 100%
Cinebench R15 OpenGL 64 Bit + NVIDIA GeForce GTX 1650 Ti Mobile
min: 93.9 avg: 121.8 median: 126.7 (7%) max: 152 fps
GPU TDP ? TDP 50 W 83% 100%
Cinebench R15 OpenGL 64 Bit + NVIDIA Quadro RTX 3000 Max-Q
min: 201 avg: 211.7 median: 202 (12%) max: 232 fps
GPU TDP ? TDP 50 W TDP 60 W 74% 80% 100%
Cinebench R15 OpenGL Ref. Match 64 Bit + NVIDIA Quadro T1000 (Laptop) Cinebench R15 - Cinebench R15 OpenGL Ref. Match 64 Bit
min: 99.6 avg: 99.7 median: 99.6 (100%) max: 100 %
GPU TDP ? TDP 50 W 100% 100%
Cinebench R15 OpenGL Ref. Match 64 Bit + NVIDIA GeForce GTX 1650 Ti Mobile
99.6 % (100%)
GPU TDP ? TDP 50 W 100% 100%
Cinebench R15 OpenGL Ref. Match 64 Bit + NVIDIA Quadro RTX 3000 Max-Q
99.6 % (100%)
GPU TDP ? TDP 50 W TDP 60 W 100% 100% 100%
GFXBench - GFXBench 5.0 Aztec Ruins High Tier Offscreen
89.3 fps (16%)
102.9 fps (19%)
GFXBench - GFXBench 5.0 Aztec Ruins Normal Tier Offscreen
225.8 fps (17%)
243.8 fps (18%)
GFXBench - GFXBench Car Chase Offscreen
min: 145.6 avg: 154.9 median: 154.9 (17%) max: 164.2 fps
234 fps (26%)
GFXBench 3.1 - GFXBench Manhattan ES 3.1 Offscreen
min: 220.2 avg: 243.6 median: 243.6 (5%) max: 267 fps
GFXBench 3.0 - GFXBench 3.0 Manhattan Offscreen
min: 269 avg: 315.3 median: 315.3 (18%) max: 361.6 fps
GFXBench (DX / GLBenchmark) 2.7 + NVIDIA Quadro T1000 (Laptop) GFXBench (DX / GLBenchmark) 2.7 - GFXBench T-Rex HD Offscreen C24Z16
min: 575 avg: 660 median: 659.5 (5%) max: 744 fps
Geekbench 6.3 - Geekbench 6.3 GPU OpenCL
46415 Points (13%)
LuxMark v2.0 64Bit - LuxMark v2.0 Room GPU
min: 1375 avg: 1410 median: 1409.5 (5%) max: 1444 Samples/s
9770 Samples/s (35%)
2153 Samples/s (8%)
LuxMark v2.0 64Bit - LuxMark v2.0 Sala GPU
min: 2567 avg: 2768 median: 2768 (5%) max: 2969 Samples/s
10574 Samples/s (19%)
4392 Samples/s (8%)
ComputeMark v2.1 - ComputeMark v2.1 Result
min: 5376 avg: 5966 median: 5965.5 (6%) max: 6555 Points
7120 Points (8%)
10064 Points (11%)
Power Consumption - Furmark Stress Test Power Consumption - external Monitor *
88.8 Watt (13%)
72.2 Watt (10%)
102 Watt (14%)
GPU TDP ? TDP 60 W 104% 100%
Power Consumption - The Witcher 3 Power Consumption - external Monitor *
93.8 Watt (13%)
92.5 Watt (13%)
109.6 Watt (15%)
GPU TDP ? TDP 60 W 103% 100%
Power Consumption - Witcher 3 Power Consumption *
min: 83 avg: 89 median: 89 (20%) max: 95 Watt
GPU TDP ? TDP 50 W 103% 100%
min: 78 avg: 89.9 median: 93 (20%) max: 99.1 Watt
GPU TDP ? TDP 50 W 102% 100%
min: 106 avg: 113.8 median: 115.4 (25%) max: 120 Watt
GPU TDP ? TDP 50 W TDP 60 W 108% 108% 100%
Power Consumption - Witcher 3 ultra Power Efficiency
min: 0.3684 avg: 0.4 median: 0.4 (37%) max: 0.4566 fps per Watt
GPU TDP ? TDP 50 W 100% 81%
min: 0.3915 avg: 0.4 median: 0.4 (39%) max: 0.491 fps per Watt
GPU TDP ? TDP 50 W 100% 94%
min: 0.4342 avg: 0.5 median: 0.5 (41%) max: 0.4957 fps per Watt
GPU TDP ? TDP 50 W TDP 60 W 100% 92% 97%
Power Consumption - Witcher 3 ultra Power Efficiency - external Monitor
0.4 fps per Watt (33%)
0.4 fps per Watt (34%)
0.5 fps per Watt (39%)
GPU TDP ? TDP 60 W 86% 100%
Emissions Witcher 3 Fan Noise + NVIDIA Quadro T1000 (Laptop) Emissions - Witcher 3 Fan Noise
min: 36.9 avg: 37.3 median: 37.3 (60%) max: 37.7 dB(A)
GPU TDP ? TDP 50 W 98% 100%
Witcher 3 Fan Noise + NVIDIA GeForce GTX 1650 Ti Mobile
min: 42 avg: 45.1 median: 45 (72%) max: 47.9 dB(A)
GPU TDP ? TDP 50 W 100% 93%
Witcher 3 Fan Noise + NVIDIA Quadro RTX 3000 Max-Q
min: 31.6 avg: 43.5 median: 46.3 (74%) max: 52.5 dB(A)
GPU TDP ? TDP 50 W TDP 60 W 94% 88% 100%
Clock Speed - GPU Clock Witcher 3 ultra
1237 MHz (49%)
min: 1530 avg: 1640 median: 1665 (65%) max: 1725 MHz
GPU TDP ? TDP 50 W 100% 99%
Clock Speed - GPU Clock Speed Furmark
1543 MHz (61%)
600 MHz (24%)
GPU TDP ? TDP 60 W 100% 39%
Average Benchmarks NVIDIA Quadro T1000 (Laptop) → 100% n=16 Average Benchmarks NVIDIA GeForce GTX 1650 Ti Mobile → 159% n=16 Average Benchmarks NVIDIA Quadro RTX 3000 Max-Q → 134% n=16
- Bereich der Benchmarkergebnisse für diese Grafikkarte
- Durchschnittliche Benchmarkergebnisse für diese Grafikkarte
* Smaller numbers mean a higher performance
1 This benchmark is not used for the average calculation
Spiele-Benchmarks Die folgenden Benchmarks basieren auf unseren Spieletests mit Testnotebooks. Die Performance dieser Grafikkarte bei den gelisteten Spielen ist abhängig von der verwendeten CPU, Speicherausstattung, Treiber und auch Betriebssystem. Dadurch müssen die untenstehenden Werte nicht repräsentativ sein. Detaillierte Informationen über das verwendete System sehen Sie nach einem Klick auf den fps-Wert.
GeForce GTX 1650 Ti Mobile:
30 [X] Lenovo IdeaPad Gaming 3 15ARH05-82EY003NGE AMD Ryzen 5 4600H 3GHz
GeForce GTX 1650 Ti Mobile
min:
26 fps, max:
35 fps
fps
GeForce GTX 1650 Ti Mobile:
21 [X] Lenovo IdeaPad Gaming 3 15ARH05-82EY003NGE AMD Ryzen 5 4600H 3GHz
GeForce GTX 1650 Ti Mobile
min:
10 fps, max:
25 fps
fps
GeForce GTX 1650 Ti Mobile:
15 [X] Lenovo IdeaPad Gaming 3 15ARH05-82EY003NGE AMD Ryzen 5 4600H 3GHz
GeForce GTX 1650 Ti Mobile
min:
8 fps, max:
18 fps
fps
GeForce GTX 1650 Ti Mobile:
67.5 [X] Lenovo IdeaPad Gaming 3 15ARH05-82EY003NGE AMD Ryzen 5 4600H 3GHz
GeForce GTX 1650 Ti Mobile
min:
49.6 fps, P0.1:
52.3 fps, P1:
56.7 fps, max:
101.6 fps
fps
GeForce GTX 1650 Ti Mobile:
40.4 [X] Lenovo IdeaPad Gaming 3 15ARH05-82EY003NGE AMD Ryzen 5 4600H 3GHz
GeForce GTX 1650 Ti Mobile
min:
30.2 fps, P0.1:
30.4 fps, P1:
33.6 fps, max:
50.9 fps
fps
GeForce GTX 1650 Ti Mobile:
108.8 [X] Lenovo IdeaPad Gaming 3 15ARH05-82EY003NGE 1140008
AMD Ryzen 5 4600H 3GHz
GeForce GTX 1650 Ti Mobile
min:
91 fps, P1:
81 fps, max:
130 fps
fps
GeForce GTX 1650 Ti Mobile:
91.8 [X] Lenovo IdeaPad Gaming 3 15ARH05-82EY003NGE 1140008
AMD Ryzen 5 4600H 3GHz
GeForce GTX 1650 Ti Mobile
min:
79 fps, P1:
72 fps, max:
110 fps
fps
GeForce GTX 1650 Ti Mobile:
64.2 [X] Lenovo IdeaPad Gaming 3 15ARH05-82EY003NGE 1140008
AMD Ryzen 5 4600H 3GHz
GeForce GTX 1650 Ti Mobile
min:
54 fps, P1:
54 fps, max:
74 fps
fps
GeForce GTX 1650 Ti Mobile:
49.2 [X] Lenovo IdeaPad Gaming 3 15ARH05-82EY003NGE 1140008
AMD Ryzen 5 4600H 3GHz
GeForce GTX 1650 Ti Mobile
min:
41 fps, P1:
40 fps, max:
57 fps
fps
GeForce GTX 1650 Ti Mobile:
10.5 [X] Lenovo IdeaPad Gaming 3 15ARH05-82EY003NGE AMD Ryzen 5 4600H 3GHz
GeForce GTX 1650 Ti Mobile
min:
8.61 fps, P0.1:
8.83 fps, P1:
9.19 fps, max:
12.4 fps
fps
GeForce GTX 1650 Ti Mobile:
44.2 [X] Lenovo IdeaPad Gaming 3 15ARH05-82EY003NGE AMD Ryzen 5 4600H 3GHz
GeForce GTX 1650 Ti Mobile
min:
28.7 fps, P0.1:
30.9 fps, P1:
34.3 fps, max:
65.9 fps
fps
GeForce GTX 1650 Ti Mobile:
35.9 [X] Lenovo IdeaPad Gaming 3 15ARH05-82EY003NGE AMD Ryzen 5 4600H 3GHz
GeForce GTX 1650 Ti Mobile
min:
23.6 fps, P0.1:
25.9 fps, P1:
27.2 fps, max:
55.6 fps
fps
GeForce GTX 1650 Ti Mobile:
27.8 [X] Lenovo IdeaPad Gaming 3 15ARH05-82EY003NGE AMD Ryzen 5 4600H 3GHz
GeForce GTX 1650 Ti Mobile
min:
16 fps, P0.1:
16.9 fps, P1:
18.7 fps, max:
44.3 fps
fps
GeForce GTX 1650 Ti Mobile:
20.8 [X] Lenovo IdeaPad Gaming 3 15ARH05-82EY003NGE AMD Ryzen 5 4600H 3GHz
GeForce GTX 1650 Ti Mobile
min:
13.2 fps, P0.1:
13.4 fps, P1:
15.1 fps, max:
30.9 fps
fps
GeForce GTX 1650 Ti Mobile:
34.3 [X] Lenovo IdeaPad Gaming 3 15ARH05-82EY003NGE AMD Ryzen 5 4600H 3GHz
GeForce GTX 1650 Ti Mobile
min:
27.9 fps, P0.1:
28 fps, P1:
28.7 fps, max:
49 fps
fps
GeForce GTX 1650 Ti Mobile:
27.8 [X] Lenovo IdeaPad Gaming 3 15ARH05-82EY003NGE AMD Ryzen 5 4600H 3GHz
GeForce GTX 1650 Ti Mobile
min:
23.4 fps, P0.1:
23.6 fps, P1:
24.3 fps, max:
35.6 fps
fps
GeForce GTX 1650 Ti Mobile:
17 [X] Lenovo IdeaPad Gaming 3 15ARH05-82EY003NGE AMD Ryzen 5 4600H 3GHz
GeForce GTX 1650 Ti Mobile
min:
12.6 fps, P0.1:
12.6 fps, P1:
12.8 fps, max:
24.1 fps
fps
GeForce GTX 1650 Ti Mobile:
14.3 [X] Lenovo IdeaPad Gaming 3 15ARH05-82EY003NGE AMD Ryzen 5 4600H 3GHz
GeForce GTX 1650 Ti Mobile
min:
8.38 fps, P0.1:
8.92 fps, P1:
11.4 fps, max:
23.9 fps
fps
GeForce GTX 1650 Ti Mobile:
58 [X] Lenovo IdeaPad Gaming 3 15ARH05-82EY003NGE AMD Ryzen 5 4600H 3GHz
GeForce GTX 1650 Ti Mobile
min:
30.4 fps, P0.1:
38.9 fps, P1:
48.2 fps, max:
101.4 fps
fps
GeForce GTX 1650 Ti Mobile:
24.3 [X] Lenovo IdeaPad Gaming 3 15ARH05-82EY003NGE AMD Ryzen 5 4600H 3GHz
GeForce GTX 1650 Ti Mobile
min:
15.6 fps, P0.1:
16.4 fps, P1:
20 fps, max:
44.2 fps
fps
GeForce GTX 1650 Ti Mobile:
20.8 [X] Lenovo IdeaPad Gaming 3 15ARH05-82EY003NGE AMD Ryzen 5 4600H 3GHz
GeForce GTX 1650 Ti Mobile
min:
9.11 fps, P0.1:
12.1 fps, P1:
17.3 fps, max:
93.5 fps
fps
GeForce GTX 1650 Ti Mobile:
16.8 [X] Lenovo IdeaPad Gaming 3 15ARH05-82EY003NGE AMD Ryzen 5 4600H 3GHz
GeForce GTX 1650 Ti Mobile
min:
12.1 fps, P0.1:
12.2 fps, P1:
12.5 fps, max:
25.7 fps
fps
GeForce GTX 1650 Ti Mobile:
86.2 [X] Lenovo IdeaPad Gaming 3 15ARH05-82EY003NGE AMD Ryzen 5 4600H 3GHz
GeForce GTX 1650 Ti Mobile
min:
16.5 fps, P0.1:
31.9 fps, P1:
48 fps, max:
138.1 fps
fps
GeForce GTX 1650 Ti Mobile:
67.6 [X] Lenovo IdeaPad Gaming 3 15ARH05-82EY003NGE AMD Ryzen 5 4600H 3GHz
GeForce GTX 1650 Ti Mobile
min:
10.7 fps, P0.1:
18.3 fps, P1:
27.7 fps, max:
127.1 fps
74.2 [X] Lenovo IdeaPad Gaming 3 15ARH05-82EY003NGE AMD Ryzen 5 4600H 3GHz
GeForce GTX 1650 Ti Mobile
min:
14 fps, P0.1:
18.3 fps, P1:
27.7 fps, max:
142.3 fps
~ 71 fps
GeForce GTX 1650 Ti Mobile:
45.7 [X] Lenovo IdeaPad Gaming 3 15ARH05-82EY003NGE AMD Ryzen 5 4600H 3GHz
GeForce GTX 1650 Ti Mobile
min:
12.2 fps, P0.1:
16.7 fps, P1:
22.9 fps, max:
127.3 fps
fps
GeForce GTX 1650 Ti Mobile:
101.7 [X] Lenovo IdeaPad Gaming 3 15ARH05-82EY003NGE AMD Ryzen 5 4600H 3GHz
GeForce GTX 1650 Ti Mobile
min:
44.6 fps, P0.1:
63.9 fps, P1:
72.3 fps, max:
153.4 fps
fps
GeForce GTX 1650 Ti Mobile:
77.9 [X] Lenovo IdeaPad Gaming 3 15ARH05-82EY003NGE AMD Ryzen 5 4600H 3GHz
GeForce GTX 1650 Ti Mobile
min:
50 fps, P0.1:
50.7 fps, P1:
54.7 fps, max:
133.5 fps
fps
GeForce GTX 1650 Ti Mobile:
68.4 [X] Lenovo IdeaPad Gaming 3 15ARH05-82EY003NGE AMD Ryzen 5 4600H 3GHz
GeForce GTX 1650 Ti Mobile
min:
38.8 fps, P0.1:
44.1 fps, P1:
48.3 fps, max:
121.7 fps
fps
GeForce GTX 1650 Ti Mobile:
49.5 [X] Lenovo IdeaPad Gaming 3 15ARH05-82EY003NGE AMD Ryzen 5 4600H 3GHz
GeForce GTX 1650 Ti Mobile
min:
33.7 fps, P0.1:
34 fps, P1:
36.8 fps, max:
71.4 fps
fps
GeForce GTX 1650 Ti Mobile:
25 [X] Lenovo IdeaPad Gaming 3 15ARH05-82EY003NGE AMD Ryzen 5 4600H 3GHz
GeForce GTX 1650 Ti Mobile
min:
23 fps, max:
32 fps
fps
GeForce GTX 1650 Ti Mobile:
22 [X] Lenovo IdeaPad Gaming 3 15ARH05-82EY003NGE AMD Ryzen 5 4600H 3GHz
GeForce GTX 1650 Ti Mobile
min:
12 fps, max:
30 fps
fps
GeForce GTX 1650 Ti Mobile:
16 [X] Lenovo IdeaPad Gaming 3 15ARH05-82EY003NGE AMD Ryzen 5 4600H 3GHz
GeForce GTX 1650 Ti Mobile
min:
10 fps, max:
23 fps
fps
GeForce GTX 1650 Ti Mobile:
11 [X] Lenovo IdeaPad Gaming 3 15ARH05-82EY003NGE AMD Ryzen 5 4600H 3GHz
GeForce GTX 1650 Ti Mobile
min:
7 fps, max:
16 fps
fps
GeForce GTX 1650 Ti Mobile:
118 [X] Lenovo IdeaPad Gaming 3 15ARH05-82EY003NGE AMD Ryzen 5 4600H 3GHz
GeForce GTX 1650 Ti Mobile
min:
87 fps
fps
GeForce GTX 1650 Ti Mobile:
54 [X] Lenovo IdeaPad Gaming 3 15ARH05-82EY003NGE AMD Ryzen 5 4600H 3GHz
GeForce GTX 1650 Ti Mobile
min:
40 fps
fps
GeForce GTX 1650 Ti Mobile:
54 [X] Lenovo IdeaPad Gaming 3 15ARH05-82EY003NGE AMD Ryzen 5 4600H 3GHz
GeForce GTX 1650 Ti Mobile
min:
40 fps
fps
GeForce GTX 1650 Ti Mobile:
37 [X] Lenovo IdeaPad Gaming 3 15ARH05-82EY003NGE AMD Ryzen 5 4600H 3GHz
GeForce GTX 1650 Ti Mobile
min:
20 fps
fps
GeForce GTX 1650 Ti Mobile:
51.6 [X] Lenovo IdeaPad Gaming 3 15ARH05-82EY003NGE AMD Ryzen 5 4600H 3GHz
GeForce GTX 1650 Ti Mobile
min:
5.86 fps, P0.1:
25.7 fps, P1:
36.2 fps, max:
121.9 fps
fps
GeForce GTX 1650 Ti Mobile:
42.5 [X] Lenovo IdeaPad Gaming 3 15ARH05-82EY003NGE AMD Ryzen 5 4600H 3GHz
GeForce GTX 1650 Ti Mobile
min:
8.84 fps, P0.1:
28.2 fps, P1:
35.3 fps, max:
64 fps
fps
GeForce GTX 1650 Ti Mobile:
31.8 [X] Lenovo IdeaPad Gaming 3 15ARH05-82EY003NGE AMD Ryzen 5 4600H 3GHz
GeForce GTX 1650 Ti Mobile
min:
4.16 fps, P0.1:
9.8 fps, P1:
25.8 fps, max:
62.1 fps
fps
GeForce GTX 1650 Ti Mobile:
26.7 [X] Lenovo IdeaPad Gaming 3 15ARH05-82EY003NGE AMD Ryzen 5 4600H 3GHz
GeForce GTX 1650 Ti Mobile
min:
5.88 fps, P0.1:
14.5 fps, P1:
22.2 fps, max:
48.5 fps
fps
GeForce GTX 1650 Ti Mobile:
25.2 [X] Lenovo IdeaPad Gaming 3 15ARH05-82EY003NGE AMD Ryzen 5 4600H 3GHz
GeForce GTX 1650 Ti Mobile
min:
18.7 fps, P0.1:
18.7 fps, P1:
20.7 fps, max:
53.7 fps
fps
GeForce GTX 1650 Ti Mobile:
22.5 [X] Lenovo IdeaPad Gaming 3 15ARH05-82EY003NGE AMD Ryzen 5 4600H 3GHz
GeForce GTX 1650 Ti Mobile
min:
16.5 fps, P0.1:
16.9 fps, P1:
18.4 fps, max:
32.5 fps
fps
GeForce GTX 1650 Ti Mobile:
21.8 [X] Lenovo IdeaPad Gaming 3 15ARH05-82EY003NGE AMD Ryzen 5 4600H 3GHz
GeForce GTX 1650 Ti Mobile
min:
7.49 fps, P0.1:
8.37 fps, P1:
17.5 fps, max:
54.5 fps
fps
GeForce GTX 1650 Ti Mobile:
34.7 [X] Lenovo IdeaPad Gaming 3 15ARH05-82EY003NGE AMD Ryzen 5 4600H 3GHz
GeForce GTX 1650 Ti Mobile
min:
13.1 fps, P0.1:
14.7 fps, P1:
25.3 fps, max:
71.7 fps
fps
GeForce GTX 1650 Ti Mobile:
28.7 [X] Lenovo IdeaPad Gaming 3 15ARH05-82EY003NGE AMD Ryzen 5 4600H 3GHz
GeForce GTX 1650 Ti Mobile
min:
14.9 fps, P0.1:
17.6 fps, P1:
22.4 fps, max:
61.5 fps
fps
GeForce GTX 1650 Ti Mobile:
20.6 [X] Lenovo IdeaPad Gaming 3 15ARH05-82EY003NGE AMD Ryzen 5 4600H 3GHz
GeForce GTX 1650 Ti Mobile
min:
9.98 fps, P0.1:
10.5 fps, P1:
15.7 fps, max:
82.7 fps
fps
GeForce GTX 1650 Ti Mobile:
11.1 [X] Lenovo IdeaPad Gaming 3 15ARH05-82EY003NGE AMD Ryzen 5 4600H 3GHz
GeForce GTX 1650 Ti Mobile
min:
8.47 fps, P0.1:
8.48 fps, P1:
9.09 fps, max:
16.7 fps
fps
GeForce GTX 1650 Ti Mobile:
156.8 [X] Lenovo IdeaPad Gaming 3 15ARH05-82EY003NGE AMD Ryzen 5 4600H 3GHz
GeForce GTX 1650 Ti Mobile
fps
GeForce GTX 1650 Ti Mobile:
94.7 [X] Lenovo IdeaPad Gaming 3 15ARH05-82EY003NGE AMD Ryzen 5 4600H 3GHz
GeForce GTX 1650 Ti Mobile
fps
GeForce GTX 1650 Ti Mobile:
57.1 [X] Lenovo IdeaPad Gaming 3 15ARH05-82EY003NGE AMD Ryzen 5 4600H 3GHz
GeForce GTX 1650 Ti Mobile
fps
GeForce GTX 1650 Ti Mobile:
45.1 [X] Lenovo IdeaPad Gaming 3 15ARH05-82EY003NGE AMD Ryzen 5 4600H 3GHz
GeForce GTX 1650 Ti Mobile
fps
GeForce GTX 1650 Ti Mobile:
53 [X] Lenovo IdeaPad Gaming 3 15ARH05-82EY003NGE AMD Ryzen 5 4600H 3GHz
GeForce GTX 1650 Ti Mobile
min:
27 fps, max:
70 fps
fps
GeForce GTX 1650 Ti Mobile:
48 [X] Lenovo IdeaPad Gaming 3 15ARH05-82EY003NGE AMD Ryzen 5 4600H 3GHz
GeForce GTX 1650 Ti Mobile
min:
23 fps, max:
91 fps
fps
GeForce GTX 1650 Ti Mobile:
35 [X] Lenovo IdeaPad Gaming 3 15ARH05-82EY003NGE AMD Ryzen 5 4600H 3GHz
GeForce GTX 1650 Ti Mobile
min:
4 fps, max:
83 fps
fps
GeForce GTX 1650 Ti Mobile:
22 [X] Lenovo IdeaPad Gaming 3 15ARH05-82EY003NGE AMD Ryzen 5 4600H 3GHz
GeForce GTX 1650 Ti Mobile
min:
3 fps, max:
74 fps
fps
GeForce GTX 1650 Ti Mobile:
66.8 [X] Lenovo IdeaPad Gaming 3 15ARH05-82EY003NGE AMD Ryzen 5 4600H 3GHz
GeForce GTX 1650 Ti Mobile
min:
22.1 fps, P0.1:
34.5 fps, P1:
48 fps, max:
118.5 fps
fps
GeForce GTX 1650 Ti Mobile:
123.4 [X] Lenovo IdeaPad Gaming 3 15ARH05-82EY003NGE AMD Ryzen 5 4600H 3GHz
GeForce GTX 1650 Ti Mobile
min:
44.3 fps, P0.1:
53.4 fps, P1:
66.9 fps, max:
324 fps
fps
GeForce GTX 1650 Ti Mobile:
94.9 [X] Lenovo IdeaPad Gaming 3 15ARH05-82EY003NGE AMD Ryzen 5 4600H 3GHz
GeForce GTX 1650 Ti Mobile
min:
45.2 fps, P0.1:
47.2 fps, P1:
51 fps, max:
332 fps
fps
GeForce GTX 1650 Ti Mobile:
75.4 [X] Lenovo IdeaPad Gaming 3 15ARH05-82EY003NGE AMD Ryzen 5 4600H 3GHz
GeForce GTX 1650 Ti Mobile
min:
30.7 fps, P0.1:
32 fps, P1:
36.3 fps, max:
269 fps
fps
GeForce GTX 1650 Ti Mobile:
62 [X] Lenovo IdeaPad Gaming 3 15ARH05-82EY003NGE AMD Ryzen 5 4600H 3GHz
GeForce GTX 1650 Ti Mobile
min:
21 fps, P0.1:
31.6 fps, P1:
35.7 fps, max:
219 fps
fps
GeForce GTX 1650 Ti Mobile:
46.8 [X] Lenovo IdeaPad Gaming 3 15ARH05-82EY003NGE 2.02
AMD Ryzen 5 4600H 3GHz
GeForce GTX 1650 Ti Mobile
min:
9.7 fps, max:
66.9 fps
fps
GeForce GTX 1650 Ti Mobile:
36.3 [X] Lenovo IdeaPad Gaming 3 15ARH05-82EY003NGE 2.02
AMD Ryzen 5 4600H 3GHz
GeForce GTX 1650 Ti Mobile
min:
8.91 fps, max:
49.1 fps
fps
GeForce GTX 1650 Ti Mobile:
29.8 [X] Lenovo IdeaPad Gaming 3 15ARH05-82EY003NGE 2.02
AMD Ryzen 5 4600H 3GHz
GeForce GTX 1650 Ti Mobile
min:
9 fps, max:
42.9 fps
fps
GeForce GTX 1650 Ti Mobile:
25.1 [X] Lenovo IdeaPad Gaming 3 15ARH05-82EY003NGE 2.02
AMD Ryzen 5 4600H 3GHz
GeForce GTX 1650 Ti Mobile
min:
13.6 fps, max:
38.1 fps
fps
GeForce GTX 1650 Ti Mobile:
51.2 [X] Lenovo IdeaPad Gaming 3 15ARH05-82EY003NGE AMD Ryzen 5 4600H 3GHz
GeForce GTX 1650 Ti Mobile
min:
36 fps, P0.1:
40 fps, P1:
42.7 fps, max:
68.2 fps
fps
GeForce GTX 1650 Ti Mobile:
42 [X] Lenovo IdeaPad Gaming 3 15ARH05-82EY003NGE AMD Ryzen 5 4600H 3GHz
GeForce GTX 1650 Ti Mobile
min:
29.9 fps, P0.1:
32.7 fps, P1:
35.9 fps, max:
58.6 fps
fps
GeForce GTX 1650 Ti Mobile:
35.8 [X] Lenovo IdeaPad Gaming 3 15ARH05-82EY003NGE AMD Ryzen 5 4600H 3GHz
GeForce GTX 1650 Ti Mobile
min:
29.4 fps, P0.1:
29.9 fps, P1:
31.1 fps, max:
43.4 fps
fps
GeForce GTX 1650 Ti Mobile:
35.4 [X] Lenovo IdeaPad Gaming 3 15ARH05-82EY003NGE AMD Ryzen 5 4600H 3GHz
GeForce GTX 1650 Ti Mobile
min:
28.2 fps, P0.1:
29.4 fps, P1:
30.9 fps, max:
44.2 fps
fps
GeForce GTX 1650 Ti Mobile:
71.5 [X] Lenovo IdeaPad Gaming 3 15ARH05-82EY003NGE AMD Ryzen 5 4600H 3GHz
GeForce GTX 1650 Ti Mobile
min:
33.4 fps, P0.1:
35.9 fps, P1:
43.6 fps, max:
163.8 fps
fps
GeForce GTX 1650 Ti Mobile:
62.5 [X] Lenovo IdeaPad Gaming 3 15ARH05-82EY003NGE AMD Ryzen 5 4600H 3GHz
GeForce GTX 1650 Ti Mobile
min:
31.6 fps, P0.1:
32.4 fps, P1:
37.8 fps, max:
155.7 fps
fps
GeForce GTX 1650 Ti Mobile:
53.5 [X] Lenovo IdeaPad Gaming 3 15ARH05-82EY003NGE AMD Ryzen 5 4600H 3GHz
GeForce GTX 1650 Ti Mobile
min:
25.5 fps, P0.1:
27.5 fps, P1:
30 fps, max:
141.6 fps
fps
GeForce GTX 1650 Ti Mobile:
46.6 [X] Lenovo IdeaPad Gaming 3 15ARH05-82EY003NGE AMD Ryzen 5 4600H 3GHz
GeForce GTX 1650 Ti Mobile
min:
23.1 fps, P0.1:
23.9 fps, P1:
25.6 fps, max:
142.4 fps
fps
GeForce GTX 1650 Ti Mobile:
48 [X] Lenovo IdeaPad Gaming 3 15ARH05-82EY003NGE AMD Ryzen 5 4600H 3GHz
GeForce GTX 1650 Ti Mobile
min:
40 fps, max:
59 fps
fps
GeForce GTX 1650 Ti Mobile:
43 [X] Lenovo IdeaPad Gaming 3 15ARH05-82EY003NGE AMD Ryzen 5 4600H 3GHz
GeForce GTX 1650 Ti Mobile
min:
37 fps, max:
51 fps
fps
GeForce GTX 1650 Ti Mobile:
35 [X] Lenovo IdeaPad Gaming 3 15ARH05-82EY003NGE AMD Ryzen 5 4600H 3GHz
GeForce GTX 1650 Ti Mobile
min:
30 fps, max:
53 fps
fps
GeForce GTX 1650 Ti Mobile:
29 [X] Lenovo IdeaPad Gaming 3 15ARH05-82EY003NGE AMD Ryzen 5 4600H 3GHz
GeForce GTX 1650 Ti Mobile
min:
26 fps, max:
40 fps
fps
GeForce GTX 1650 Ti Mobile:
29.7 [X] Lenovo IdeaPad Gaming 3 15ARH05-82EY003NGE AMD Ryzen 5 4600H 3GHz
GeForce GTX 1650 Ti Mobile
min:
22.4 fps, P0.1:
22.5 fps, P1:
23.3 fps, max:
52.9 fps
fps
GeForce GTX 1650 Ti Mobile:
25 [X] Lenovo IdeaPad Gaming 3 15ARH05-82EY003NGE AMD Ryzen 5 4600H 3GHz
GeForce GTX 1650 Ti Mobile
min:
17.4 fps, P0.1:
17.8 fps, P1:
19.2 fps, max:
41.7 fps
fps
GeForce GTX 1650 Ti Mobile:
19.8 [X] Lenovo IdeaPad Gaming 3 15ARH05-82EY003NGE AMD Ryzen 5 4600H 3GHz
GeForce GTX 1650 Ti Mobile
min:
14.5 fps, P0.1:
14.7 fps, P1:
15.2 fps, max:
34.1 fps
fps
GeForce GTX 1650 Ti Mobile:
17.3 [X] Lenovo IdeaPad Gaming 3 15ARH05-82EY003NGE AMD Ryzen 5 4600H 3GHz
GeForce GTX 1650 Ti Mobile
min:
13.2 fps, P0.1:
13.2 fps, P1:
13.6 fps, max:
26.3 fps
fps
GeForce GTX 1650 Ti Mobile:
68.2 [X] Lenovo IdeaPad Gaming 3 15ARH05-82EY003NGE AMD Ryzen 5 4600H 3GHz
GeForce GTX 1650 Ti Mobile
min:
32.2 fps, P0.1:
43.2 fps, P1:
49.3 fps, max:
108.1 fps
fps
GeForce GTX 1650 Ti Mobile:
58.6 [X] Lenovo IdeaPad Gaming 3 15ARH05-82EY003NGE AMD Ryzen 5 4600H 3GHz
GeForce GTX 1650 Ti Mobile
min:
2.32 fps, P0.1:
28.7 fps, P1:
43.8 fps, max:
108.9 fps
fps
GeForce GTX 1650 Ti Mobile:
51.4 [X] Lenovo IdeaPad Gaming 3 15ARH05-82EY003NGE AMD Ryzen 5 4600H 3GHz
GeForce GTX 1650 Ti Mobile
min:
4.31 fps, P0.1:
26.7 fps, P1:
41 fps, max:
87.1 fps
fps
GeForce GTX 1650 Ti Mobile:
41 [X] Lenovo IdeaPad Gaming 3 15ARH05-82EY003NGE AMD Ryzen 5 4600H 3GHz
GeForce GTX 1650 Ti Mobile
min:
2.52 fps, P0.1:
3.42 fps, P1:
34.2 fps, max:
81.3 fps
fps
GeForce GTX 1650 Ti Mobile:
22.2 [X] Lenovo IdeaPad Gaming 3 15ARH05-82EY003NGE AMD Ryzen 5 4600H 3GHz
GeForce GTX 1650 Ti Mobile
min:
3.89 fps, P0.1:
4.06 fps, P1:
10.4 fps, max:
76.8 fps
fps
GeForce GTX 1650 Ti Mobile:
17.9 [X] Lenovo IdeaPad Gaming 3 15ARH05-82EY003NGE AMD Ryzen 5 4600H 3GHz
GeForce GTX 1650 Ti Mobile
min:
4.11 fps, P0.1:
4.82 fps, P1:
8.38 fps, max:
55.2 fps
fps
GeForce GTX 1650 Ti Mobile:
14.4 [X] Lenovo IdeaPad Gaming 3 15ARH05-82EY003NGE AMD Ryzen 5 4600H 3GHz
GeForce GTX 1650 Ti Mobile
min:
6.04 fps, P0.1:
6.37 fps, P1:
8.35 fps, max:
54.6 fps
fps
GeForce GTX 1650 Ti Mobile:
57.3 [X] Lenovo IdeaPad Gaming 3 15ARH05-82EY003NGE AMD Ryzen 5 4600H 3GHz
GeForce GTX 1650 Ti Mobile
min:
36.4 fps, P0.1:
47 fps, P1:
48.8 fps, max:
78.2 fps
fps
GeForce GTX 1650 Ti Mobile:
54.8 [X] Lenovo IdeaPad Gaming 3 15ARH05-82EY003NGE AMD Ryzen 5 4600H 3GHz
GeForce GTX 1650 Ti Mobile
min:
34 fps, P0.1:
41.4 fps, P1:
44.9 fps, max:
81.8 fps
fps
GeForce GTX 1650 Ti Mobile:
51.3 [X] Lenovo IdeaPad Gaming 3 15ARH05-82EY003NGE AMD Ryzen 5 4600H 3GHz
GeForce GTX 1650 Ti Mobile
min:
30 fps, P0.1:
33.6 fps, P1:
42.1 fps, max:
85.3 fps
fps
GeForce GTX 1650 Ti Mobile:
33 [X] Lenovo IdeaPad Gaming 3 15ARH05-82EY003NGE AMD Ryzen 5 4600H 3GHz
GeForce GTX 1650 Ti Mobile
min:
2.59 fps, P0.1:
4.99 fps, P1:
27.1 fps, max:
53.2 fps
fps
GeForce GTX 1650 Ti Mobile:
29.9 [X] Lenovo IdeaPad Gaming 3 15ARH05-82EY003NGE AMD Ryzen 5 4600H 3GHz
GeForce GTX 1650 Ti Mobile
min:
19.1 fps, P0.1:
20.1 fps, P1:
22.3 fps, max:
48.2 fps
fps
GeForce GTX 1650 Ti Mobile:
24.7 [X] Lenovo IdeaPad Gaming 3 15ARH05-82EY003NGE AMD Ryzen 5 4600H 3GHz
GeForce GTX 1650 Ti Mobile
min:
16.8 fps, P0.1:
17.6 fps, P1:
18.7 fps, max:
39.3 fps
fps
GeForce GTX 1650 Ti Mobile:
18 [X] Lenovo IdeaPad Gaming 3 15ARH05-82EY003NGE AMD Ryzen 5 4600H 3GHz
GeForce GTX 1650 Ti Mobile
min:
11.9 fps, P0.1:
12 fps, P1:
12.2 fps, max:
28.6 fps
fps
GeForce GTX 1650 Ti Mobile:
15.7 [X] Lenovo IdeaPad Gaming 3 15ARH05-82EY003NGE AMD Ryzen 5 4600H 3GHz
GeForce GTX 1650 Ti Mobile
min:
10.2 fps, P0.1:
10.3 fps, P1:
10.6 fps, max:
27.5 fps
fps
GeForce GTX 1650 Ti Mobile:
119.7 [X] Lenovo IdeaPad Gaming 3 15ARH05-82EY003NGE 1042581
AMD Ryzen 5 4600H 3GHz
GeForce GTX 1650 Ti Mobile
min:
102 fps, P1:
87 fps, max:
138 fps
fps
GeForce GTX 1650 Ti Mobile:
109 [X] Lenovo IdeaPad Gaming 3 15ARH05-82EY003NGE 1042581
AMD Ryzen 5 4600H 3GHz
GeForce GTX 1650 Ti Mobile
min:
94 fps, P1:
86 fps, max:
125 fps
fps
GeForce GTX 1650 Ti Mobile:
73.7 [X] Lenovo IdeaPad Gaming 3 15ARH05-82EY003NGE 1042581
AMD Ryzen 5 4600H 3GHz
GeForce GTX 1650 Ti Mobile
min:
60 fps, P1:
62 fps, max:
83 fps
fps
GeForce GTX 1650 Ti Mobile:
42.2 [X] Lenovo IdeaPad Gaming 3 15ARH05-82EY003NGE 1042581
AMD Ryzen 5 4600H 3GHz
GeForce GTX 1650 Ti Mobile
min:
19 fps, P1:
32 fps, max:
53 fps
fps
GeForce GTX 1650 Ti Mobile:
100.1 [X] Lenovo IdeaPad Gaming 3 15ARH05-82EY003NGE AMD Ryzen 5 4600H 3GHz
GeForce GTX 1650 Ti Mobile
min:
50.7 fps, P0.1:
54.9 fps, P1:
67 fps, max:
180.3 fps
fps
GeForce GTX 1650 Ti Mobile:
85.8 [X] Lenovo IdeaPad Gaming 3 15ARH05-82EY003NGE AMD Ryzen 5 4600H 3GHz
GeForce GTX 1650 Ti Mobile
min:
33.3 fps, P0.1:
38.4 fps, P1:
58.2 fps, max:
172.4 fps
fps
GeForce GTX 1650 Ti Mobile:
77.3 [X] Lenovo IdeaPad Gaming 3 15ARH05-82EY003NGE AMD Ryzen 5 4600H 3GHz
GeForce GTX 1650 Ti Mobile
min:
32.6 fps, P0.1:
45.1 fps, P1:
53.7 fps, max:
190.5 fps
fps
GeForce GTX 1650 Ti Mobile:
64.1 [X] Lenovo IdeaPad Gaming 3 15ARH05-82EY003NGE AMD Ryzen 5 4600H 3GHz
GeForce GTX 1650 Ti Mobile
min:
25.5 fps, P0.1:
33.2 fps, P1:
43.4 fps, max:
196.1 fps
fps
GeForce GTX 1650 Ti Mobile:
31.8 [X] Lenovo IdeaPad Gaming 3 15ARH05-82EY003NGE AMD Ryzen 5 4600H 3GHz
GeForce GTX 1650 Ti Mobile
min:
9.1 fps, P0.1:
9.59 fps, P1:
21.6 fps, max:
83.7 fps
fps
GeForce GTX 1650 Ti Mobile:
26.2 [X] Lenovo IdeaPad Gaming 3 15ARH05-82EY003NGE AMD Ryzen 5 4600H 3GHz
GeForce GTX 1650 Ti Mobile
min:
6.54 fps, P0.1:
6.95 fps, P1:
15.6 fps, max:
84.5 fps
fps
GeForce GTX 1650 Ti Mobile:
24.2 [X] Lenovo IdeaPad Gaming 3 15ARH05-82EY003NGE AMD Ryzen 5 4600H 3GHz
GeForce GTX 1650 Ti Mobile
min:
9.44 fps, P0.1:
9.46 fps, P1:
13.9 fps, max:
78.8 fps
fps
GeForce GTX 1650 Ti Mobile:
23.7 [X] Lenovo IdeaPad Gaming 3 15ARH05-82EY003NGE AMD Ryzen 5 4600H 3GHz
GeForce GTX 1650 Ti Mobile
min:
6.93 fps, P0.1:
10 fps, P1:
15.6 fps, max:
64 fps
fps
GeForce GTX 1650 Ti Mobile:
98.4 [X] Lenovo IdeaPad Gaming 3 15ARH05-82EY003NGE AMD Ryzen 5 4600H 3GHz
GeForce GTX 1650 Ti Mobile
min:
31.7 fps, P0.1:
50.9 fps, P1:
65.8 fps, max:
152.5 fps
fps
GeForce GTX 1650 Ti Mobile:
83.1 [X] Lenovo IdeaPad Gaming 3 15ARH05-82EY003NGE AMD Ryzen 5 4600H 3GHz
GeForce GTX 1650 Ti Mobile
min:
6.85 fps, P0.1:
16.7 fps, P1:
52.5 fps, max:
145.3 fps
fps
GeForce GTX 1650 Ti Mobile:
55.9 [X] Lenovo IdeaPad Gaming 3 15ARH05-82EY003NGE AMD Ryzen 5 4600H 3GHz
GeForce GTX 1650 Ti Mobile
min:
10.3 fps, P0.1:
16.3 fps, P1:
32 fps, max:
139.2 fps
fps
GeForce GTX 1650 Ti Mobile:
43 [X] Lenovo IdeaPad Gaming 3 15ARH05-82EY003NGE AMD Ryzen 5 4600H 3GHz
GeForce GTX 1650 Ti Mobile
min:
12.8 fps, P0.1:
12.9 fps, P1:
25.6 fps, max:
124 fps
fps
GeForce GTX 1650 Ti Mobile:
39.4 [X] Lenovo IdeaPad Gaming 3 15ARH05-82EY003NGE AMD Ryzen 5 4600H 3GHz
GeForce GTX 1650 Ti Mobile
min:
23 fps, P0.1:
26.6 fps, P1:
31.4 fps, max:
64 fps
fps
GeForce GTX 1650 Ti Mobile:
30.8 [X] Lenovo IdeaPad Gaming 3 15ARH05-82EY003NGE AMD Ryzen 5 4600H 3GHz
GeForce GTX 1650 Ti Mobile
min:
2.58 fps, P0.1:
16.8 fps, P1:
24.9 fps, max:
52.1 fps
fps
GeForce GTX 1650 Ti Mobile:
24.5 [X] Lenovo IdeaPad Gaming 3 15ARH05-82EY003NGE AMD Ryzen 5 4600H 3GHz
GeForce GTX 1650 Ti Mobile
min:
1.697 fps, P0.1:
11.5 fps, P1:
18.5 fps, max:
37.6 fps
fps
GeForce GTX 1650 Ti Mobile:
50.3 [X] Lenovo IdeaPad Gaming 3 15ARH05-82EY003NGE AMD Ryzen 5 4600H 3GHz
GeForce GTX 1650 Ti Mobile
min:
10.3 fps, P0.1:
32.3 fps, P1:
40.7 fps, max:
91.7 fps
fps
GeForce GTX 1650 Ti Mobile:
35.9 [X] Lenovo IdeaPad Gaming 3 15ARH05-82EY003NGE AMD Ryzen 5 4600H 3GHz
GeForce GTX 1650 Ti Mobile
min:
13.4 fps, P0.1:
19.9 fps, P1:
26.4 fps, max:
58.5 fps
fps
GeForce GTX 1650 Ti Mobile:
31.5 [X] Lenovo IdeaPad Gaming 3 15ARH05-82EY003NGE AMD Ryzen 5 4600H 3GHz
GeForce GTX 1650 Ti Mobile
min:
6.83 fps, P0.1:
11.5 fps, P1:
23.4 fps, max:
52 fps
fps
GeForce GTX 1650 Ti Mobile:
17.3 [X] Lenovo IdeaPad Gaming 3 15ARH05-82EY003NGE AMD Ryzen 5 4600H 3GHz
GeForce GTX 1650 Ti Mobile
min:
4.59 fps, P0.1:
4.86 fps, P1:
11.9 fps, max:
30.5 fps
fps
GeForce GTX 1650 Ti Mobile:
54.9 [X] Lenovo IdeaPad Gaming 3 15ARH05-82EY003NGE AMD Ryzen 5 4600H 3GHz
GeForce GTX 1650 Ti Mobile
P0.1:
31.4 fpsP1:
37.5 fps
fps
GeForce GTX 1650 Ti Mobile:
49 [X] Lenovo IdeaPad Gaming 3 15ARH05-82EY003NGE AMD Ryzen 5 4600H 3GHz
GeForce GTX 1650 Ti Mobile
P0.1:
25.8 fpsP1:
35 fps
fps
GeForce GTX 1650 Ti Mobile:
39.7 [X] Lenovo IdeaPad Gaming 3 15ARH05-82EY003NGE AMD Ryzen 5 4600H 3GHz
GeForce GTX 1650 Ti Mobile
P0.1:
22.7 fpsP1:
27.3 fps
fps
GeForce GTX 1650 Ti Mobile:
39.6 [X] Lenovo IdeaPad Gaming 3 15ARH05-82EY003NGE AMD Ryzen 5 4600H 3GHz
GeForce GTX 1650 Ti Mobile
P0.1:
24.9 fpsP1:
26.9 fps
fps
GeForce GTX 1650 Ti Mobile:
58.3 [X] Lenovo IdeaPad Gaming 3 15ARH05-82EY003NGE AMD Ryzen 5 4600H 3GHz
GeForce GTX 1650 Ti Mobile
min:
5.68 fps, P0.1:
25.6 fps, P1:
36 fps, max:
102.7 fps
fps
GeForce GTX 1650 Ti Mobile:
38.3 [X] Lenovo IdeaPad Gaming 3 15ARH05-82EY003NGE AMD Ryzen 5 4600H 3GHz
GeForce GTX 1650 Ti Mobile
min:
3.76 fps, P0.1:
10.3 fps, P1:
19.6 fps, max:
82.2 fps
fps
GeForce GTX 1650 Ti Mobile:
35.9 [X] Lenovo IdeaPad Gaming 3 15ARH05-82EY003NGE AMD Ryzen 5 4600H 3GHz
GeForce GTX 1650 Ti Mobile
min:
11 fps, P0.1:
13.9 fps, P1:
23.8 fps, max:
62.6 fps
fps
GeForce GTX 1650 Ti Mobile:
34.1 [X] Lenovo IdeaPad Gaming 3 15ARH05-82EY003NGE AMD Ryzen 5 4600H 3GHz
GeForce GTX 1650 Ti Mobile
min:
9.98 fps, P0.1:
10.7 fps, P1:
24.1 fps, max:
63.5 fps
fps
GeForce GTX 1650 Ti Mobile:
76.4 [X] Lenovo IdeaPad Gaming 3 15ARH05-82EY003NGE AMD Ryzen 5 4600H 3GHz
GeForce GTX 1650 Ti Mobile
min:
27.9 fps, P0.1:
51.8 fps, P1:
61.2 fps, max:
122.9 fps
fps
GeForce GTX 1650 Ti Mobile:
56.3 [X] Lenovo IdeaPad Gaming 3 15ARH05-82EY003NGE AMD Ryzen 5 4600H 3GHz
GeForce GTX 1650 Ti Mobile
min:
30.4 fps, P0.1:
40.5 fps, P1:
45.9 fps, max:
92 fps
fps
GeForce GTX 1650 Ti Mobile:
34 [X] Lenovo IdeaPad Gaming 3 15ARH05-82EY003NGE AMD Ryzen 5 4600H 3GHz
GeForce GTX 1650 Ti Mobile
min:
20.5 fps, P0.1:
27.4 fps, P1:
28.8 fps, max:
68.1 fps
fps
GeForce GTX 1650 Ti Mobile:
25.7 [X] Lenovo IdeaPad Gaming 3 15ARH05-82EY003NGE AMD Ryzen 5 4600H 3GHz
GeForce GTX 1650 Ti Mobile
min:
15.1 fps, P0.1:
21.6 fps, P1:
22.2 fps, max:
50.7 fps
fps
GeForce GTX 1650 Ti Mobile:
42 [X] Lenovo IdeaPad Gaming 3 15ARH05-82EY003NGE AMD Ryzen 5 4600H 3GHz
GeForce GTX 1650 Ti Mobile
min:
22 fps, max:
68 fps
fps
GeForce GTX 1650 Ti Mobile:
40 [X] Lenovo IdeaPad Gaming 3 15ARH05-82EY003NGE AMD Ryzen 5 4600H 3GHz
GeForce GTX 1650 Ti Mobile
min:
17 fps, max:
78 fps
fps
GeForce GTX 1650 Ti Mobile:
36 [X] Lenovo IdeaPad Gaming 3 15ARH05-82EY003NGE AMD Ryzen 5 4600H 3GHz
GeForce GTX 1650 Ti Mobile
min:
21 fps, max:
61 fps
fps
GeForce GTX 1650 Ti Mobile:
28 [X] Lenovo IdeaPad Gaming 3 15ARH05-82EY003NGE AMD Ryzen 5 4600H 3GHz
GeForce GTX 1650 Ti Mobile
min:
5 fps, max:
53 fps
fps
GeForce GTX 1650 Ti Mobile:
57.3 [X] Lenovo IdeaPad Gaming 3 15ARH05-82EY003NGE AMD Ryzen 5 4600H 3GHz
GeForce GTX 1650 Ti Mobile
min:
20 fps, P0.1:
24.7 fps, P1:
32.2 fps, max:
91.6 fps
fps
GeForce GTX 1650 Ti Mobile:
41.8 [X] Lenovo IdeaPad Gaming 3 15ARH05-82EY003NGE AMD Ryzen 5 4600H 3GHz
GeForce GTX 1650 Ti Mobile
min:
5.83 fps, P0.1:
18.4 fps, P1:
23.7 fps, max:
76.4 fps
fps
GeForce GTX 1650 Ti Mobile:
32.1 [X] Lenovo IdeaPad Gaming 3 15ARH05-82EY003NGE AMD Ryzen 5 4600H 3GHz
GeForce GTX 1650 Ti Mobile
min:
13.6 fps, P0.1:
14.6 fps, P1:
19.4 fps, max:
62.3 fps
fps
GeForce GTX 1650 Ti Mobile:
22 [X] Lenovo IdeaPad Gaming 3 15ARH05-82EY003NGE AMD Ryzen 5 4600H 3GHz
GeForce GTX 1650 Ti Mobile
min:
7.91 fps, P0.1:
9.08 fps, P1:
12.3 fps, max:
51.5 fps
fps
GeForce GTX 1650 Ti Mobile:
34.3 [X] Lenovo IdeaPad Gaming 3 15ARH05-82EY003NGE AMD Ryzen 5 4600H 3GHz
GeForce GTX 1650 Ti Mobile
min:
6.36 fps, P0.1:
9.32 fps, P1:
23.5 fps, max:
63.2 fps
fps
GeForce GTX 1650 Ti Mobile:
23.2 [X] Lenovo IdeaPad Gaming 3 15ARH05-82EY003NGE AMD Ryzen 5 4600H 3GHz
GeForce GTX 1650 Ti Mobile
min:
5.06 fps, P0.1:
7.19 fps, P1:
17.7 fps, max:
37.9 fps
fps
GeForce GTX 1650 Ti Mobile:
22.9 [X] Lenovo IdeaPad Gaming 3 15ARH05-82EY003NGE AMD Ryzen 5 4600H 3GHz
GeForce GTX 1650 Ti Mobile
min:
10.4 fps, P0.1:
10.4 fps, P1:
14.7 fps, max:
51.2 fps
fps
GeForce GTX 1650 Ti Mobile:
21.8 [X] Lenovo IdeaPad Gaming 3 15ARH05-82EY003NGE AMD Ryzen 5 4600H 3GHz
GeForce GTX 1650 Ti Mobile
min:
10.8 fps, P0.1:
11.2 fps, P1:
15.7 fps, max:
67.2 fps
fps
GeForce GTX 1650 Ti Mobile:
91.4 [X] Lenovo IdeaPad Gaming 3 15ARH05-82EY003NGE AMD Ryzen 5 4600H 3GHz
GeForce GTX 1650 Ti Mobile
min:
8.11 fps, P0.1:
52.4 fps, P1:
64.6 fps, max:
165.6 fps
fps
GeForce GTX 1650 Ti Mobile:
68.1 [X] Lenovo IdeaPad Gaming 3 15ARH05-82EY003NGE AMD Ryzen 5 4600H 3GHz
GeForce GTX 1650 Ti Mobile
min:
8.36 fps, P0.1:
43 fps, P1:
51.8 fps, max:
145.9 fps
fps
GeForce GTX 1650 Ti Mobile:
55.6 [X] Lenovo IdeaPad Gaming 3 15ARH05-82EY003NGE AMD Ryzen 5 4600H 3GHz
GeForce GTX 1650 Ti Mobile
min:
8.28 fps, P0.1:
36.5 fps, P1:
43.8 fps, max:
95.4 fps
fps
GeForce GTX 1650 Ti Mobile:
41.1 [X] Lenovo IdeaPad Gaming 3 15ARH05-82EY003NGE AMD Ryzen 5 4600H 3GHz
GeForce GTX 1650 Ti Mobile
min:
8.81 fps, P0.1:
28 fps, P1:
30.8 fps, max:
89 fps
fps
GeForce GTX 1650 Ti Mobile:
65.9 [X] Lenovo IdeaPad Gaming 3 15ARH05-82EY003NGE AMD Ryzen 5 4600H 3GHz
GeForce GTX 1650 Ti Mobile
min:
23.2 fps, P0.1:
28.3 fps, P1:
40.1 fps, max:
162.4 fps
110.2 [X] Lenovo IdeaPad Gaming 3 15ARH05-82EY003NGE AMD Ryzen 5 4600H 3GHz
GeForce GTX 1650 Ti Mobile
min:
31.4 fps, P0.1:
45.8 fps, P1:
64.8 fps, max:
204 fps
~ 88 fps
GeForce GTX 1650 Ti Mobile:
53.1 [X] Lenovo IdeaPad Gaming 3 15ARH05-82EY003NGE AMD Ryzen 5 4600H 3GHz
GeForce GTX 1650 Ti Mobile
min:
26.4 fps, P0.1:
27.7 fps, P1:
32 fps, max:
137.2 fps
fps
GeForce GTX 1650 Ti Mobile:
43.1 [X] Lenovo IdeaPad Gaming 3 15ARH05-82EY003NGE AMD Ryzen 5 4600H 3GHz
GeForce GTX 1650 Ti Mobile
min:
16 fps, P0.1:
17.2 fps, P1:
23.8 fps, max:
119 fps
fps
GeForce GTX 1650 Ti Mobile:
77.1 [X] Lenovo IdeaPad Gaming 3 15ARH05-82EY003NGE AMD Ryzen 5 4600H 3GHz
GeForce GTX 1650 Ti Mobile
fps
GeForce GTX 1650 Ti Mobile:
54.1 [X] Lenovo IdeaPad Gaming 3 15ARH05-82EY003NGE AMD Ryzen 5 4600H 3GHz
GeForce GTX 1650 Ti Mobile
fps
GeForce GTX 1650 Ti Mobile:
51.2 [X] Lenovo IdeaPad Gaming 3 15ARH05-82EY003NGE AMD Ryzen 5 4600H 3GHz
GeForce GTX 1650 Ti Mobile
fps
GeForce GTX 1650 Ti Mobile:
31.2 [X] Lenovo IdeaPad Gaming 3 15ARH05-82EY003NGE AMD Ryzen 5 4600H 3GHz
GeForce GTX 1650 Ti Mobile
fps
GeForce GTX 1650 Ti Mobile:
65.5 [X] Lenovo IdeaPad Gaming 3 15ARH05-82EY003NGE AMD Ryzen 5 4600H 3GHz
GeForce GTX 1650 Ti Mobile
min:
32.2 fps, P0.1:
46.3 fps, P1:
50.2 fps, max:
118.1 fps
fps
GeForce GTX 1650 Ti Mobile:
58.5 [X] Lenovo IdeaPad Gaming 3 15ARH05-82EY003NGE AMD Ryzen 5 4600H 3GHz
GeForce GTX 1650 Ti Mobile
min:
34.6 fps, P0.1:
37.7 fps, P1:
46.9 fps, max:
94.3 fps
fps
GeForce GTX 1650 Ti Mobile:
38.3 [X] Lenovo IdeaPad Gaming 3 15ARH05-82EY003NGE AMD Ryzen 5 4600H 3GHz
GeForce GTX 1650 Ti Mobile
min:
9.82 fps, P0.1:
14.1 fps, P1:
28.4 fps, max:
70.8 fps
fps
GeForce GTX 1650 Ti Mobile:
28.7 [X] Lenovo IdeaPad Gaming 3 15ARH05-82EY003NGE AMD Ryzen 5 4600H 3GHz
GeForce GTX 1650 Ti Mobile
min:
1.382 fps, P0.1:
8.7 fps, P1:
21.6 fps, max:
222 fps
fps
GeForce GTX 1650 Ti Mobile:
43.9 [X] Lenovo IdeaPad Gaming 3 15ARH05-82EY003NGE AMD Ryzen 5 4600H 3GHz
GeForce GTX 1650 Ti Mobile
min:
35 fps, P0.1:
35.7 fps, P1:
38.7 fps, max:
50.7 fps
fps
GeForce GTX 1650 Ti Mobile:
34.5 [X] Lenovo IdeaPad Gaming 3 15ARH05-82EY003NGE AMD Ryzen 5 4600H 3GHz
GeForce GTX 1650 Ti Mobile
min:
3.78 fps, P0.1:
7.82 fps, P1:
30.8 fps, max:
51.3 fps
fps
GeForce GTX 1650 Ti Mobile:
22.6 [X] Lenovo IdeaPad Gaming 3 15ARH05-82EY003NGE AMD Ryzen 5 4600H 3GHz
GeForce GTX 1650 Ti Mobile
min:
4.2 fps, P0.1:
4.31 fps, P1:
5.07 fps, max:
35 fps
fps
GeForce GTX 1650 Ti Mobile:
21.5 [X] Lenovo IdeaPad Gaming 3 15ARH05-82EY003NGE AMD Ryzen 5 4600H 3GHz
GeForce GTX 1650 Ti Mobile
min:
12.8 fps, P0.1:
14.4 fps, P1:
19.6 fps, max:
68.9 fps
fps
GeForce GTX 1650 Ti Mobile:
44.1 [X] Lenovo IdeaPad Gaming 3 15ARH05-82EY003NGE AMD Ryzen 5 4600H 3GHz
GeForce GTX 1650 Ti Mobile
min:
16.9 fps, P0.1:
28 fps, P1:
33.6 fps, max:
88.2 fps
fps
GeForce GTX 1650 Ti Mobile:
35.5 [X] Lenovo IdeaPad Gaming 3 15ARH05-82EY003NGE AMD Ryzen 5 4600H 3GHz
GeForce GTX 1650 Ti Mobile
min:
23.8 fps, P0.1:
24.6 fps, P1:
29 fps, max:
55.7 fps
fps
GeForce GTX 1650 Ti Mobile:
31.8 [X] Lenovo IdeaPad Gaming 3 15ARH05-82EY003NGE AMD Ryzen 5 4600H 3GHz
GeForce GTX 1650 Ti Mobile
min:
16 fps, P0.1:
22.6 fps, P1:
25.4 fps, max:
66.3 fps
fps
GeForce GTX 1650 Ti Mobile:
28.2 [X] Lenovo IdeaPad Gaming 3 15ARH05-82EY003NGE AMD Ryzen 5 4600H 3GHz
GeForce GTX 1650 Ti Mobile
min:
20.4 fps, P0.1:
20.6 fps, P1:
23.1 fps, max:
40.5 fps
fps
GeForce GTX 1650 Ti Mobile:
69.6 [X] Lenovo IdeaPad Gaming 3 15ARH05-82EY003NGE AMD Ryzen 5 4600H 3GHz
GeForce GTX 1650 Ti Mobile
min:
15.7 fps, P0.1:
47 fps, P1:
52.3 fps, max:
134.4 fps
fps
GeForce GTX 1650 Ti Mobile:
60.7 [X] Lenovo IdeaPad Gaming 3 15ARH05-82EY003NGE AMD Ryzen 5 4600H 3GHz
GeForce GTX 1650 Ti Mobile
min:
17.1 fps, P0.1:
25.5 fps, P1:
51.3 fps, max:
109.7 fps
fps
GeForce GTX 1650 Ti Mobile:
44.5 [X] Lenovo IdeaPad Gaming 3 15ARH05-82EY003NGE AMD Ryzen 5 4600H 3GHz
GeForce GTX 1650 Ti Mobile
min:
13.6 fps, P0.1:
22 fps, P1:
35.8 fps, max:
116.4 fps
fps
GeForce GTX 1650 Ti Mobile:
36.1 [X] Lenovo IdeaPad Gaming 3 15ARH05-82EY003NGE AMD Ryzen 5 4600H 3GHz
GeForce GTX 1650 Ti Mobile
min:
11.4 fps, P0.1:
14.2 fps, P1:
25.9 fps, max:
112.6 fps
fps
GeForce GTX 1650 Ti Mobile:
27.5 [X] Lenovo IdeaPad Gaming 3 15ARH05-82EY003NGE AMD Ryzen 5 4600H 3GHz
GeForce GTX 1650 Ti Mobile
min:
12.3 fps, P0.1:
13.1 fps, P1:
15 fps, max:
99.8 fps
fps
GeForce GTX 1650 Ti Mobile:
124 [X] Lenovo IdeaPad Gaming 3 15ARH05-82EY003NGE 959964
AMD Ryzen 5 4600H 3GHz
GeForce GTX 1650 Ti Mobile
min:
105 fps, P1:
81 fps, max:
145 fps
fps
GeForce GTX 1650 Ti Mobile:
112.2 [X] Lenovo IdeaPad Gaming 3 15ARH05-82EY003NGE 959964
AMD Ryzen 5 4600H 3GHz
GeForce GTX 1650 Ti Mobile
min:
94 fps, P1:
78 fps, max:
131 fps
fps
GeForce GTX 1650 Ti Mobile:
81.3 [X] Lenovo IdeaPad Gaming 3 15ARH05-82EY003NGE 959964
AMD Ryzen 5 4600H 3GHz
GeForce GTX 1650 Ti Mobile
min:
67 fps, P1:
64 fps, max:
95 fps
fps
GeForce GTX 1650 Ti Mobile:
60.4 [X] Lenovo IdeaPad Gaming 3 15ARH05-82EY003NGE 959964
AMD Ryzen 5 4600H 3GHz
GeForce GTX 1650 Ti Mobile
min:
47 fps, P1:
47 fps, max:
70 fps
fps
GeForce GTX 1650 Ti Mobile:
171.6 [X] MSI GP75 Intel Core i7-10750H 2.6GHz
GeForce GTX 1650 Ti Mobile
min:
5.1 fps, P0.1:
77.4 fps, P1:
122.4 fps, max:
336 fps
fps
GeForce GTX 1650 Ti Mobile:
95 [X] MSI GP75 Intel Core i7-10750H 2.6GHz
GeForce GTX 1650 Ti Mobile
min:
20.8 fps, P0.1:
58.6 fps, P1:
69.9 fps, max:
243 fps
fps
GeForce GTX 1650 Ti Mobile:
88.9 [X] MSI GP75 Intel Core i7-10750H 2.6GHz
GeForce GTX 1650 Ti Mobile
min:
53.1 fps, P0.1:
57.2 fps, P1:
64.5 fps, max:
213 fps
fps
GeForce GTX 1650 Ti Mobile:
85.5 [X] MSI GP75 Intel Core i7-10750H 2.6GHz
GeForce GTX 1650 Ti Mobile
min:
34.6 fps, P0.1:
55.4 fps, P1:
62.2 fps, max:
164.6 fps
fps
GeForce GTX 1650 Ti Mobile:
66.4 [X] MSI GP75 Intel Core i7-10750H 2.6GHz
GeForce GTX 1650 Ti Mobile
min:
27.6 fps, P0.1:
34.9 fps, P1:
39.8 fps, max:
207 fps
fps
GeForce GTX 1650 Ti Mobile:
61.6 [X] MSI GP75 Intel Core i7-10750H 2.6GHz
GeForce GTX 1650 Ti Mobile
min:
25.9 fps, P0.1:
31.7 fps, P1:
35.7 fps, max:
206 fps
fps
GeForce GTX 1650 Ti Mobile:
61.2 [X] MSI GP75 Intel Core i7-10750H 2.6GHz
GeForce GTX 1650 Ti Mobile
min:
23.4 fps, P0.1:
31.3 fps, P1:
35.5 fps, max:
202 fps
fps
GeForce GTX 1650 Ti Mobile:
60.5 [X] MSI GP75 Intel Core i7-10750H 2.6GHz
GeForce GTX 1650 Ti Mobile
min:
25.6 fps, P0.1:
30.4 fps, P1:
35 fps, max:
208 fps
fps
GeForce GTX 1650 Ti Mobile:
36.9 [X] MSI GP75 Intel Core i7-10750H 2.6GHz
GeForce GTX 1650 Ti Mobile
min:
17.7 fps, P0.1:
18.6 fps, P1:
19.9 fps, max:
189.8 fps
fps
GeForce GTX 1650 Ti Mobile:
84.7 [X] MSI GP75 Intel Core i7-10750H 2.6GHz
GeForce GTX 1650 Ti Mobile
fps
GeForce GTX 1650 Ti Mobile:
68.7 [X] MSI GP75 Intel Core i7-10750H 2.6GHz
GeForce GTX 1650 Ti Mobile
fps
GeForce GTX 1650 Ti Mobile:
45.6 [X] MSI GP75 Intel Core i7-10750H 2.6GHz
GeForce GTX 1650 Ti Mobile
fps
GeForce GTX 1650 Ti Mobile:
34.9 [X] MSI GP75 Intel Core i7-10750H 2.6GHz
GeForce GTX 1650 Ti Mobile
fps
GeForce GTX 1650 Ti Mobile:
58.7 [X] MSI GP75 Intel Core i7-10750H 2.6GHz
GeForce GTX 1650 Ti Mobile
min:
40 fps
fps
GeForce GTX 1650 Ti Mobile:
46 [X] MSI GP75 Intel Core i7-10750H 2.6GHz
GeForce GTX 1650 Ti Mobile
min:
33 fps
fps
GeForce GTX 1650 Ti Mobile:
36 [X] MSI GP75 Intel Core i7-10750H 2.6GHz
GeForce GTX 1650 Ti Mobile
min:
26 fps
fps
GeForce GTX 1650 Ti Mobile:
34 [X] MSI GP75 Intel Core i7-10750H 2.6GHz
GeForce GTX 1650 Ti Mobile
min:
26 fps
fps
GeForce GTX 1650 Ti Mobile:
16.4 [X] MSI GP75 Intel Core i7-10750H 2.6GHz
GeForce GTX 1650 Ti Mobile
min:
11 fps
fps
GeForce GTX 1650 Ti Mobile:
5.7 [X] MSI GP75 Intel Core i7-10750H 2.6GHz
GeForce GTX 1650 Ti Mobile
min:
3 fps
fps
GeForce GTX 1650 Ti Mobile:
52.2 [X] MSI GP75 Intel Core i7-10750H 2.6GHz
GeForce GTX 1650 Ti Mobile
min:
26.7 fps, P0.1:
29 fps, P1:
36.2 fps, max:
81.7 fps
fps
GeForce GTX 1650 Ti Mobile:
46.1 [X] MSI GP75 Intel Core i7-10750H 2.6GHz
GeForce GTX 1650 Ti Mobile
min:
25.8 fps, P0.1:
27.7 fps, P1:
31.3 fps, max:
70.2 fps
fps
GeForce GTX 1650 Ti Mobile:
39.2 [X] MSI GP75 Intel Core i7-10750H 2.6GHz
GeForce GTX 1650 Ti Mobile
min:
19.2 fps, P0.1:
23 fps, P1:
26.1 fps, max:
64.2 fps
fps
GeForce GTX 1650 Ti Mobile:
34.6 [X] MSI GP75 Intel Core i7-10750H 2.6GHz
GeForce GTX 1650 Ti Mobile
min:
19 fps, P0.1:
20 fps, P1:
24.9 fps, max:
71.5 fps
fps
GeForce GTX 1650 Ti Mobile:
149 [X] MSI GP75 Intel Core i7-10750H 2.6GHz
GeForce GTX 1650 Ti Mobile
min:
119 fps
fps
GeForce GTX 1650 Ti Mobile:
104 [X] MSI GP75 Intel Core i7-10750H 2.6GHz
GeForce GTX 1650 Ti Mobile
min:
87 fps
fps
GeForce GTX 1650 Ti Mobile:
88.5 [X] MSI GP75 Intel Core i7-10750H 2.6GHz
GeForce GTX 1650 Ti Mobile
min:
69 fps
fps
GeForce GTX 1650 Ti Mobile:
59.1 [X] MSI GP75 Intel Core i7-10750H 2.6GHz
GeForce GTX 1650 Ti Mobile
min:
43 fps
fps
GeForce GTX 1650 Ti Mobile:
59.1 [X] MSI GP75 Intel Core i7-10750H 2.6GHz
GeForce GTX 1650 Ti Mobile
min:
33.8 fps, P0.1:
34.3 fps, P1:
43.5 fps, max:
92.6 fps
fps
GeForce GTX 1650 Ti Mobile:
58.8 [X] MSI GP75 Intel Core i7-10750H 2.6GHz
GeForce GTX 1650 Ti Mobile
min:
23.8 fps, P0.1:
34.7 fps, P1:
43 fps, max:
82.7 fps
fps
GeForce GTX 1650 Ti Mobile:
55.5 [X] MSI GP75 Intel Core i7-10750H 2.6GHz
GeForce GTX 1650 Ti Mobile
min:
25.3 fps, P0.1:
28.8 fps, P1:
37.6 fps, max:
86.3 fps
fps
GeForce GTX 1650 Ti Mobile:
46.9 [X] MSI GP75 Intel Core i7-10750H 2.6GHz
GeForce GTX 1650 Ti Mobile
min:
20 fps, P0.1:
22.8 fps, P1:
31.4 fps, max:
79 fps
fps
GeForce GTX 1650 Ti Mobile:
35.5 [X] MSI GP75 Intel Core i7-10750H 2.6GHz
GeForce GTX 1650 Ti Mobile
min:
21.6 fps, P0.1:
21.9 fps, P1:
27.3 fps, max:
62 fps
fps
GeForce GTX 1650 Ti Mobile:
19.9 [X] MSI GP75 Intel Core i7-10750H 2.6GHz
GeForce GTX 1650 Ti Mobile
min:
15.4 fps, P0.1:
15.6 fps, P1:
17.1 fps, max:
26.3 fps
fps
GeForce GTX 1650 Ti Mobile:
42.6 [X] MSI GP75 Intel Core i7-10750H 2.6GHz
GeForce GTX 1650 Ti Mobile
min:
35.1 fps, P0.1:
37 fps, P1:
39 fps, max:
50.2 fps
fps
GeForce GTX 1650 Ti Mobile:
33.4 [X] MSI GP75 Intel Core i7-10750H 2.6GHz
GeForce GTX 1650 Ti Mobile
min:
28.5 fps, P0.1:
29.8 fps, P1:
30.8 fps, max:
37.9 fps
fps
GeForce GTX 1650 Ti Mobile:
27.8 [X] MSI GP75 Intel Core i7-10750H 2.6GHz
GeForce GTX 1650 Ti Mobile
min:
23.8 fps, P0.1:
24.5 fps, P1:
25.6 fps, max:
33 fps
fps
GeForce GTX 1650 Ti Mobile:
88 [X] MSI GP75 Intel Core i7-10750H 2.6GHz
GeForce GTX 1650 Ti Mobile
min:
64 fps
fps
GeForce GTX 1650 Ti Mobile:
80 [X] MSI GP75 Intel Core i7-10750H 2.6GHz
GeForce GTX 1650 Ti Mobile
min:
57 fps
fps
GeForce GTX 1650 Ti Mobile:
78 [X] MSI GP75 Intel Core i7-10750H 2.6GHz
GeForce GTX 1650 Ti Mobile
min:
56 fps
fps
GeForce GTX 1650 Ti Mobile:
60 [X] MSI GP75 Intel Core i7-10750H 2.6GHz
GeForce GTX 1650 Ti Mobile
min:
35 fps
fps
GeForce GTX 1650 Ti Mobile:
56.6 [X] MSI GP75 Intel Core i7-10750H 2.6GHz
GeForce GTX 1650 Ti Mobile
min:
42.6 fps, P0.1:
44.5 fps, P1:
48.3 fps, max:
75.2 fps
fps
GeForce GTX 1650 Ti Mobile:
46.1 [X] MSI GP75 Intel Core i7-10750H 2.6GHz
GeForce GTX 1650 Ti Mobile
min:
37.2 fps, P0.1:
38.1 fps, P1:
40.5 fps, max:
63.5 fps
fps
GeForce GTX 1650 Ti Mobile:
36.1 [X] MSI GP75 Intel Core i7-10750H 2.6GHz
GeForce GTX 1650 Ti Mobile
min:
29 fps, P0.1:
30.4 fps, P1:
32.2 fps, max:
47.9 fps
fps
GeForce GTX 1650 Ti Mobile:
23.6 [X] MSI GP75 Intel Core i7-10750H 2.6GHz
GeForce GTX 1650 Ti Mobile
min:
11.7 fps, P0.1:
11.8 fps, P1:
14.6 fps, max:
30.7 fps
fps
GeForce GTX 1650 Ti Mobile:
111 [X] MSI GP75 Intel Core i7-10750H 2.6GHz
GeForce GTX 1650 Ti Mobile
min:
51 fps, P0.1:
58.3 fps, P1:
81.8 fps, max:
216 fps
fps
GeForce GTX 1650 Ti Mobile:
62.2 [X] MSI GP75 Intel Core i7-10750H 2.6GHz
GeForce GTX 1650 Ti Mobile
min:
31 fps, P0.1:
39.4 fps, P1:
48.2 fps, max:
205 fps
fps
GeForce GTX 1650 Ti Mobile:
48.5 [X] MSI GP75 Intel Core i7-10750H 2.6GHz
GeForce GTX 1650 Ti Mobile
min:
26.8 fps, P0.1:
29.8 fps, P1:
37.2 fps, max:
174 fps
fps
GeForce GTX 1650 Ti Mobile:
43 [X] MSI GP75 Intel Core i7-10750H 2.6GHz
GeForce GTX 1650 Ti Mobile
min:
29.9 fps, P0.1:
30.3 fps, P1:
32.7 fps, max:
113 fps
fps
GeForce GTX 1650 Ti Mobile:
187 [X] MSI GP75 Intel Core i7-10750H 2.6GHz
GeForce GTX 1650 Ti Mobile
min:
11.1 fps, P0.1:
20.6 fps, P1:
135 fps, max:
255 fps
fps
GeForce GTX 1650 Ti Mobile:
115 [X] MSI GP75 Intel Core i7-10750H 2.6GHz
GeForce GTX 1650 Ti Mobile
min:
6.49 fps, P0.1:
19.4 fps, P1:
24.3 fps, max:
183 fps
fps
GeForce GTX 1650 Ti Mobile:
84.6 [X] MSI GP75 Intel Core i7-10750H 2.6GHz
GeForce GTX 1650 Ti Mobile
min:
15.3 fps, P0.1:
38.5 fps, P1:
62.2 fps, max:
142 fps
fps
GeForce GTX 1650 Ti Mobile:
67.6 [X] MSI GP75 Intel Core i7-10750H 2.6GHz
GeForce GTX 1650 Ti Mobile
min:
14.1 fps, P0.1:
40.9 fps, P1:
52.4 fps, max:
128 fps
fps
GeForce GTX 1650 Ti Mobile:
49.3 [X] MSI GP75 Intel Core i7-10750H 2.6GHz
GeForce GTX 1650 Ti Mobile
min:
16.2 fps, P0.1:
23.2 fps, P1:
38.7 fps, max:
123 fps
fps
GeForce GTX 1650 Ti Mobile:
28.6 [X] MSI GP75 Intel Core i7-10750H 2.6GHz
GeForce GTX 1650 Ti Mobile
min:
8.87 fps, P0.1:
9.57 fps, P1:
13.6 fps, max:
113 fps
fps
GeForce GTX 1650 Ti Mobile:
78 [X] MSI GP75 Intel Core i7-10750H 2.6GHz
GeForce GTX 1650 Ti Mobile
fps
GeForce GTX 1650 Ti Mobile:
67 [X] MSI GP75 Intel Core i7-10750H 2.6GHz
GeForce GTX 1650 Ti Mobile
fps
GeForce GTX 1650 Ti Mobile:
26 [X] MSI GP75 Intel Core i7-10750H 2.6GHz
GeForce GTX 1650 Ti Mobile
fps
GeForce GTX 1650 Ti Mobile:
21 [X] MSI GP75 Intel Core i7-10750H 2.6GHz
GeForce GTX 1650 Ti Mobile
fps
GeForce GTX 1650 Ti Mobile:
14 [X] MSI GP75 Intel Core i7-10750H 2.6GHz
GeForce GTX 1650 Ti Mobile
fps
GeForce GTX 1650 Ti Mobile:
66.1 [X] MSI GP75 Intel Core i7-10750H 2.6GHz
GeForce GTX 1650 Ti Mobile
min:
46.4 fps, P0.1:
54.2 fps, P1:
55.9 fps, max:
158 fps
fps
GeForce GTX 1650 Ti Mobile:
44.8 [X] MSI GP75 Intel Core i7-10750H 2.6GHz
GeForce GTX 1650 Ti Mobile
min:
31.4 fps, P0.1:
34.4 fps, P1:
36.2 fps, max:
75.4 fps
fps
GeForce GTX 1650 Ti Mobile:
41.9 [X] MSI GP75 Intel Core i7-10750H 2.6GHz
GeForce GTX 1650 Ti Mobile
min:
30.8 fps, P0.1:
33.4 fps, P1:
35.3 fps, max:
57.8 fps
fps
GeForce GTX 1650 Ti Mobile:
28 [X] MSI GP75 Intel Core i7-10750H 2.6GHz
GeForce GTX 1650 Ti Mobile
min:
23.4 fps, P0.1:
23.7 fps, P1:
24 fps, max:
39.9 fps
fps
GeForce GTX 1650 Ti Mobile:
14.4 [X] MSI GP75 Intel Core i7-10750H 2.6GHz
GeForce GTX 1650 Ti Mobile
min:
11.2 fps, P0.1:
11.3 fps, P1:
11.7 fps, max:
19.5 fps
fps
GeForce GTX 1650 Ti Mobile:
68 [X] MSI GP75 Intel Core i7-10750H 2.6GHz
GeForce GTX 1650 Ti Mobile
min:
50 fps
fps
GeForce GTX 1650 Ti Mobile:
52 [X] MSI GP75 Intel Core i7-10750H 2.6GHz
GeForce GTX 1650 Ti Mobile
min:
43 fps
fps
GeForce GTX 1650 Ti Mobile:
47 [X] MSI GP75 Intel Core i7-10750H 2.6GHz
GeForce GTX 1650 Ti Mobile
min:
37 fps
fps
GeForce GTX 1650 Ti Mobile:
30 [X] MSI GP75 Intel Core i7-10750H 2.6GHz
GeForce GTX 1650 Ti Mobile
min:
25 fps
fps
GeForce GTX 1650 Ti Mobile:
12 [X] MSI GP75 Intel Core i7-10750H 2.6GHz
GeForce GTX 1650 Ti Mobile
min:
10 fps
fps
GeForce GTX 1650 Ti Mobile:
55 [X] MSI GP75 Intel Core i7-10750H 2.6GHz
GeForce GTX 1650 Ti Mobile
min:
10 fps
fps
GeForce GTX 1650 Ti Mobile:
54 [X] MSI GP75 Intel Core i7-10750H 2.6GHz
GeForce GTX 1650 Ti Mobile
min:
37 fps
fps
GeForce GTX 1650 Ti Mobile:
53 [X] MSI GP75 Intel Core i7-10750H 2.6GHz
GeForce GTX 1650 Ti Mobile
min:
36 fps
fps
GeForce GTX 1650 Ti Mobile:
32 [X] MSI GP75 Intel Core i7-10750H 2.6GHz
GeForce GTX 1650 Ti Mobile
min:
22 fps
fps
GeForce GTX 1650 Ti Mobile:
13 [X] MSI GP75 Intel Core i7-10750H 2.6GHz
GeForce GTX 1650 Ti Mobile
min:
10 fps
fps
GeForce GTX 1650 Ti Mobile:
106 [X] MSI GP75 Intel Core i7-10750H 2.6GHz
GeForce GTX 1650 Ti Mobile
min:
51.3 fps, P0.1:
57.1 fps, P1:
63.7 fps, max:
341 fps
fps
GeForce GTX 1650 Ti Mobile:
91.5 [X] MSI GP75 Intel Core i7-10750H 2.6GHz
GeForce GTX 1650 Ti Mobile
min:
47.3 fps, P0.1:
48.1 fps, P1:
54.2 fps, max:
287 fps
fps
GeForce GTX 1650 Ti Mobile:
83.8 [X] MSI GP75 Intel Core i7-10750H 2.6GHz
GeForce GTX 1650 Ti Mobile
min:
45.5 fps, P0.1:
45.8 fps, P1:
49.7 fps, max:
281 fps
fps
GeForce GTX 1650 Ti Mobile:
52.7 [X] MSI GP75 Intel Core i7-10750H 2.6GHz
GeForce GTX 1650 Ti Mobile
min:
22.8 fps, P0.1:
25.9 fps, P1:
28.1 fps, max:
330 fps
fps
GeForce GTX 1650 Ti Mobile:
26.1 [X] MSI GP75 Intel Core i7-10750H 2.6GHz
GeForce GTX 1650 Ti Mobile
min:
12.4 fps, P0.1:
12.5 fps, P1:
13 fps, max:
201 fps
fps
GeForce GTX 1650 Ti Mobile:
67 [X] MSI GP75 Intel Core i7-10750H 2.6GHz
GeForce GTX 1650 Ti Mobile
min:
45 fps
fps
GeForce GTX 1650 Ti Mobile:
57 [X] MSI GP75 Intel Core i7-10750H 2.6GHz
GeForce GTX 1650 Ti Mobile
min:
35 fps
fps
GeForce GTX 1650 Ti Mobile:
50 [X] MSI GP75 Intel Core i7-10750H 2.6GHz
GeForce GTX 1650 Ti Mobile
min:
35 fps
fps
GeForce GTX 1650 Ti Mobile:
33 [X] MSI GP75 Intel Core i7-10750H 2.6GHz
GeForce GTX 1650 Ti Mobile
min:
20 fps
fps
GeForce GTX 1650 Ti Mobile:
80.5 [X] MSI GP75 Intel Core i7-10750H 2.6GHz
GeForce GTX 1650 Ti Mobile
min:
40.9 fps, P0.1:
43 fps, P1:
66.5 fps, max:
146 fps
fps
GeForce GTX 1650 Ti Mobile:
69 [X] MSI GP75 Intel Core i7-10750H 2.6GHz
GeForce GTX 1650 Ti Mobile
min:
33.2 fps, P0.1:
41 fps, P1:
57.8 fps, max:
131 fps
fps
GeForce GTX 1650 Ti Mobile:
45.8 [X] MSI GP75 Intel Core i7-10750H 2.6GHz
GeForce GTX 1650 Ti Mobile
min:
29.3 fps, P0.1:
38.3 fps, P1:
40.5 fps, max:
72.1 fps
fps
GeForce GTX 1650 Ti Mobile:
174 [X] MSI GP75 Intel Core i7-10750H 2.6GHz
GeForce GTX 1650 Ti Mobile
min:
18.5 fps, P0.1:
93 fps, P1:
110 fps, max:
304 fps
fps
GeForce GTX 1650 Ti Mobile:
173 [X] MSI GP75 Intel Core i7-10750H 2.6GHz
GeForce GTX 1650 Ti Mobile
min:
14.3 fps, P0.1:
75.9 fps, P1:
100 fps, max:
316 fps
fps
GeForce GTX 1650 Ti Mobile:
154 [X] MSI GP75 Intel Core i7-10750H 2.6GHz
GeForce GTX 1650 Ti Mobile
min:
53.7 fps, P0.1:
69.3 fps, P1:
88.3 fps, max:
316 fps
fps
GeForce GTX 1650 Ti Mobile:
122 [X] MSI GP75 Intel Core i7-10750H 2.6GHz
GeForce GTX 1650 Ti Mobile
min:
58.8 fps, P0.1:
68.6 fps, P1:
73.2 fps, max:
301 fps
fps
GeForce GTX 1650 Ti Mobile:
82.6 [X] MSI GP75 Intel Core i7-10750H 2.6GHz
GeForce GTX 1650 Ti Mobile
min:
50.6 fps, P0.1:
52.7 fps, P1:
58.3 fps, max:
166 fps
fps
GeForce GTX 1650 Ti Mobile:
53.7 [X] MSI GP75 Intel Core i7-10750H 2.6GHz
GeForce GTX 1650 Ti Mobile
min:
27.3 fps, P0.1:
29.8 fps, P1:
35.2 fps, max:
114 fps
fps
GeForce GTX 1650 Ti Mobile:
48.6 [X] MSI GP75 Intel Core i7-10750H 2.6GHz
GeForce GTX 1650 Ti Mobile
min:
23.4 fps, P0.1:
28.4 fps, P1:
31.3 fps, max:
90.1 fps
fps
GeForce GTX 1650 Ti Mobile:
36.4 [X] MSI GP75 Intel Core i7-10750H 2.6GHz
GeForce GTX 1650 Ti Mobile
min:
15.9 fps, P0.1:
19.1 fps, P1:
22.2 fps, max:
66.5 fps
fps
GeForce GTX 1650 Ti Mobile:
25.3 [X] MSI GP75 Intel Core i7-10750H 2.6GHz
GeForce GTX 1650 Ti Mobile
min:
12.7 fps, P0.1:
15.6 fps, P1:
18.4 fps, max:
39.2 fps
fps
GeForce GTX 1650 Ti Mobile:
12.2 [X] MSI GP75 Intel Core i7-10750H 2.6GHz
GeForce GTX 1650 Ti Mobile
min:
8.39 fps, P0.1:
8.65 fps, P1:
9.22 fps, max:
17 fps
fps
GeForce GTX 1650 Ti Mobile:
56.4 [X] MSI GP75 Intel Core i7-10750H 2.6GHz
GeForce GTX 1650 Ti Mobile
min:
19.7 fps, P0.1:
43.6 fps, P1:
47.2 fps, max:
73.4 fps
fps
GeForce GTX 1650 Ti Mobile:
43.8 [X] MSI GP75 Intel Core i7-10750H 2.6GHz
GeForce GTX 1650 Ti Mobile
min:
17.5 fps, P0.1:
18.5 fps, P1:
36.6 fps, max:
58.9 fps
fps
GeForce GTX 1650 Ti Mobile:
40.4 [X] MSI GP75 Intel Core i7-10750H 2.6GHz
GeForce GTX 1650 Ti Mobile
min:
17 fps, P0.1:
20.9 fps, P1:
33.2 fps, max:
99.9 fps
fps
GeForce GTX 1650 Ti Mobile:
26.3 [X] MSI GP75 Intel Core i7-10750H 2.6GHz
GeForce GTX 1650 Ti Mobile
min:
11.7 fps, P0.1:
13.7 fps, P1:
22.3 fps, max:
89.4 fps
fps
GeForce GTX 1650 Ti Mobile:
11.9 [X] MSI GP75 Intel Core i7-10750H 2.6GHz
GeForce GTX 1650 Ti Mobile
min:
9.29 fps, P0.1:
9.33 fps, P1:
10 fps, max:
15.8 fps
fps
GeForce GTX 1650 Ti Mobile:
123 [X] MSI GP75 Intel Core i7-10750H 2.6GHz
GeForce GTX 1650 Ti Mobile
min:
108 fps
fps
GeForce GTX 1650 Ti Mobile:
101 [X] MSI GP75 Intel Core i7-10750H 2.6GHz
GeForce GTX 1650 Ti Mobile
min:
90 fps
fps
GeForce GTX 1650 Ti Mobile:
132 [X] MSI GP75 Intel Core i7-10750H 2.6GHz
GeForce GTX 1650 Ti Mobile
min:
68.7 fps, P0.1:
81 fps, P1:
98.7 fps, max:
153 fps
fps
GeForce GTX 1650 Ti Mobile:
120 [X] MSI GP75 Intel Core i7-10750H 2.6GHz
GeForce GTX 1650 Ti Mobile
min:
81.9 fps, P0.1:
84.9 fps, P1:
93.8 fps, max:
143 fps
fps
GeForce GTX 1650 Ti Mobile:
93.9 [X] MSI GP75 Intel Core i7-10750H 2.6GHz
GeForce GTX 1650 Ti Mobile
min:
53.7 fps, P0.1:
69 fps, P1:
75.6 fps, max:
109 fps
fps
GeForce GTX 1650 Ti Mobile:
57.9 [X] MSI GP75 Intel Core i7-10750H 2.6GHz
GeForce GTX 1650 Ti Mobile
min:
45.5 fps, P0.1:
46 fps, P1:
47.6 fps, max:
67 fps
fps
GeForce GTX 1650 Ti Mobile:
67.8 [X] MSI GP75 Intel Core i7-10750H 2.6GHz
GeForce GTX 1650 Ti Mobile
min:
34.9 fps, P0.1:
38.4 fps, P1:
48.8 fps, max:
172 fps
fps
GeForce GTX 1650 Ti Mobile:
59.1 [X] MSI GP75 Intel Core i7-10750H 2.6GHz
GeForce GTX 1650 Ti Mobile
min:
25.4 fps, P0.1:
32.7 fps, P1:
43.8 fps, max:
134 fps
fps
GeForce GTX 1650 Ti Mobile:
42.4 [X] MSI GP75 Intel Core i7-10750H 2.6GHz
GeForce GTX 1650 Ti Mobile
min:
16 fps, P0.1:
27.4 fps, P1:
33.8 fps, max:
92.7 fps
fps
GeForce GTX 1650 Ti Mobile:
30.1 [X] MSI GP75 Intel Core i7-10750H 2.6GHz
GeForce GTX 1650 Ti Mobile
min:
16.7 fps, P0.1:
22.3 fps, P1:
24.9 fps, max:
73.2 fps
fps
GeForce GTX 1650 Ti Mobile:
16.5 [X] MSI GP75 Intel Core i7-10750H 2.6GHz
GeForce GTX 1650 Ti Mobile
min:
13.9 fps, P0.1:
14.1 fps, P1:
14.9 fps, max:
21 fps
fps
GeForce GTX 1650 Ti Mobile:
123 [X] MSI GP75 Intel Core i7-10750H 2.6GHz
GeForce GTX 1650 Ti Mobile
min:
26.9 fps, P0.1:
48.9 fps, P1:
66.7 fps, max:
329 fps
fps
GeForce GTX 1650 Ti Mobile:
103 [X] MSI GP75 Intel Core i7-10750H 2.6GHz
GeForce GTX 1650 Ti Mobile
min:
26.8 fps, P0.1:
52.6 fps, P1:
61.6 fps, max:
281 fps
fps
GeForce GTX 1650 Ti Mobile:
75.9 [X] MSI GP75 Intel Core i7-10750H 2.6GHz
GeForce GTX 1650 Ti Mobile
min:
28.3 fps, P0.1:
38 fps, P1:
58.4 fps, max:
196 fps
fps
GeForce GTX 1650 Ti Mobile:
38.1 [X] MSI GP75 Intel Core i7-10750H 2.6GHz
GeForce GTX 1650 Ti Mobile
min:
29.7 fps, P0.1:
31.6 fps, P1:
32.8 fps, max:
70.4 fps
fps
GeForce GTX 1650 Ti Mobile:
82.9 [X] MSI GP75 Intel Core i7-10750H 2.6GHz
GeForce GTX 1650 Ti Mobile
min:
65.8 fps, P0.1:
65.9 fps, P1:
66.9 fps, max:
104 fps
fps
GeForce GTX 1650 Ti Mobile:
74.7 [X] MSI GP75 Intel Core i7-10750H 2.6GHz
GeForce GTX 1650 Ti Mobile
min:
50.3 fps, P0.1:
57.4 fps, P1:
58.8 fps, max:
101 fps
fps
GeForce GTX 1650 Ti Mobile:
61.1 [X] MSI GP75 Intel Core i7-10750H 2.6GHz
GeForce GTX 1650 Ti Mobile
min:
14 fps, P0.1:
34.9 fps, P1:
51.6 fps, max:
87.3 fps
fps
GeForce GTX 1650 Ti Mobile:
38.6 [X] MSI GP75 Intel Core i7-10750H 2.6GHz
GeForce GTX 1650 Ti Mobile
min:
20.4 fps, P0.1:
32 fps, P1:
32.6 fps, max:
54.3 fps
fps
GeForce GTX 1650 Ti Mobile:
16.4 [X] MSI GP75 Intel Core i7-10750H 2.6GHz
GeForce GTX 1650 Ti Mobile
min:
9.6 fps, P0.1:
13.3 fps, P1:
14 fps, max:
21.7 fps
fps
GeForce GTX 1650 Ti Mobile:
74 [X] MSI GP75 Intel Core i7-10750H 2.6GHz
GeForce GTX 1650 Ti Mobile
min:
34.2 fps, P0.1:
35.9 fps, P1:
45.7 fps, max:
149 fps
fps
GeForce GTX 1650 Ti Mobile:
61.5 [X] MSI GP75 Intel Core i7-10750H 2.6GHz
GeForce GTX 1650 Ti Mobile
min:
23.9 fps, P0.1:
32.2 fps, P1:
40.2 fps, max:
130 fps
fps
GeForce GTX 1650 Ti Mobile:
51.4 [X] MSI GP75 Intel Core i7-10750H 2.6GHz
GeForce GTX 1650 Ti Mobile
min:
29.2 fps, P0.1:
30.3 fps, P1:
33.8 fps, max:
80.5 fps
fps
GeForce GTX 1650 Ti Mobile:
33.4 [X] MSI GP75 Intel Core i7-10750H 2.6GHz
GeForce GTX 1650 Ti Mobile
min:
8.81 fps, P0.1:
9.26 fps, P1:
12.8 fps, max:
178 fps
fps
GeForce GTX 1650 Ti Mobile:
29.1 [X] MSI GP75 Intel Core i7-10750H 2.6GHz
GeForce GTX 1650 Ti Mobile
min:
5.47 fps, P0.1:
6.49 fps, P1:
10.5 fps, max:
185 fps
fps
Quadro RTX 3000 Max-Q:
178 fps
GeForce GTX 1650 Ti Mobile:
83.3 [X] MSI GP75 Intel Core i7-10750H 2.6GHz
GeForce GTX 1650 Ti Mobile
min:
56 fps
fps
Quadro RTX 3000 Max-Q:
100 fps
GeForce GTX 1650 Ti Mobile:
70.7 [X] MSI GP75 Intel Core i7-10750H 2.6GHz
GeForce GTX 1650 Ti Mobile
min:
45 fps
fps
Quadro RTX 3000 Max-Q:
86 fps
GeForce GTX 1650 Ti Mobile:
64.1 [X] MSI GP75 Intel Core i7-10750H 2.6GHz
GeForce GTX 1650 Ti Mobile
min:
43 fps
fps
Quadro RTX 3000 Max-Q:
78 fps
GeForce GTX 1650 Ti Mobile:
39.4 [X] MSI GP75 Intel Core i7-10750H 2.6GHz
GeForce GTX 1650 Ti Mobile
min:
27 fps
fps
GeForce GTX 1650 Ti Mobile:
21.1 [X] MSI GP75 Intel Core i7-10750H 2.6GHz
GeForce GTX 1650 Ti Mobile
min:
16 fps
fps
Quadro RTX 3000 Max-Q:
27 fps
GeForce GTX 1650 Ti Mobile:
58.7 [X] Dell G5 15 5500 09E2 Intel Core i5-10300H 2.5GHz
GeForce GTX 1650 Ti Mobile
min:
14.3 fps, P0.1:
25.6 fps, P1:
36.2 fps, max:
98.2 fps
69.5 ~ 64 fps
Quadro RTX 3000 Max-Q:
93 fps
GeForce GTX 1650 Ti Mobile:
32.7 [X] Dell G5 15 5500 09E2 Intel Core i5-10300H 2.5GHz
GeForce GTX 1650 Ti Mobile
min:
13.1 fps, P0.1:
22 fps, P1:
25.4 fps, max:
63.5 fps
34.2 37.4 [X] MSI GP75 Intel Core i7-10750H 2.6GHz
GeForce GTX 1650 Ti Mobile
min:
18.5 fps, P0.1:
27.1 fps, P1:
31.6 fps, max:
77.8 fps
~ 35 fps
Quadro RTX 3000 Max-Q:
52 fps
GeForce GTX 1650 Ti Mobile:
26.3 [X] Dell G5 15 5500 09E2 Intel Core i5-10300H 2.5GHz
GeForce GTX 1650 Ti Mobile
min:
13.4 fps, P0.1:
14.1 fps, P1:
21.4 fps, max:
72.9 fps
27.9 30 [X] MSI GP75 Intel Core i7-10750H 2.6GHz
GeForce GTX 1650 Ti Mobile
min:
19.1 fps, P0.1:
23.6 fps, P1:
25.4 fps, max:
72.8 fps
~ 28 fps
Quadro RTX 3000 Max-Q:
43 fps
GeForce GTX 1650 Ti Mobile:
22.4 [X] Dell G5 15 5500 09E2 Intel Core i5-10300H 2.5GHz
GeForce GTX 1650 Ti Mobile
min:
11.4 fps, P0.1:
11.8 fps, P1:
18.4 fps, max:
47.6 fps
23.2 25.5 [X] MSI GP75 Intel Core i7-10750H 2.6GHz
GeForce GTX 1650 Ti Mobile
min:
18.9 fps, P0.1:
20.6 fps, P1:
22.1 fps, max:
48.7 fps
~ 24 fps
Quadro RTX 3000 Max-Q:
36 fps
GeForce GTX 1650 Ti Mobile:
15.5 [X] MSI GP75 Intel Core i7-10750H 2.6GHz
GeForce GTX 1650 Ti Mobile
min:
9.79 fps, P0.1:
9.88 fps, P1:
12.9 fps, max:
23.4 fps
fps
GeForce GTX 1650 Ti Mobile:
6 [X] MSI GP75 Intel Core i7-10750H 2.6GHz
GeForce GTX 1650 Ti Mobile
min:
2.87 fps, P0.1:
4.19 fps, P1:
4.55 fps, max:
13.4 fps
fps
Quadro RTX 3000 Max-Q:
10 fps
GeForce GTX 1650 Ti Mobile:
92 fps
Quadro RTX 3000 Max-Q:
105 fps
GeForce GTX 1650 Ti Mobile:
54 64 [X] MSI GP75 Intel Core i7-10750H 2.6GHz
GeForce GTX 1650 Ti Mobile
min:
22 fps
~ 59 fps
Quadro RTX 3000 Max-Q:
71 fps
GeForce GTX 1650 Ti Mobile:
38 46 [X] MSI GP75 Intel Core i7-10750H 2.6GHz
GeForce GTX 1650 Ti Mobile
min:
23 fps
~ 42 fps
Quadro RTX 3000 Max-Q:
63 fps
GeForce GTX 1650 Ti Mobile:
33 45 [X] MSI GP75 Intel Core i7-10750H 2.6GHz
GeForce GTX 1650 Ti Mobile
min:
15 fps
~ 39 fps
Quadro RTX 3000 Max-Q:
58 fps
GeForce GTX 1650 Ti Mobile:
27 [X] MSI GP75 Intel Core i7-10750H 2.6GHz
GeForce GTX 1650 Ti Mobile
min:
14 fps
fps
GeForce GTX 1650 Ti Mobile:
16 [X] MSI GP75 Intel Core i7-10750H 2.6GHz
GeForce GTX 1650 Ti Mobile
min:
11 fps
fps
Quadro RTX 3000 Max-Q:
24 fps
GeForce GTX 1650 Ti Mobile:
121.1 fps
Quadro RTX 3000 Max-Q:
131 fps
GeForce GTX 1650 Ti Mobile:
49.4 53.4 [X] MSI GP75 Intel Core i7-10750H 2.6GHz
GeForce GTX 1650 Ti Mobile
min:
30.1 fps, P0.1:
33.1 fps, P1:
36.8 fps, max:
102 fps
~ 51 fps
Quadro RTX 3000 Max-Q:
88 fps
GeForce GTX 1650 Ti Mobile:
49 51.1 [X] MSI GP75 Intel Core i7-10750H 2.6GHz
GeForce GTX 1650 Ti Mobile
min:
33 fps, P0.1:
36.2 fps, P1:
37.4 fps, max:
81.3 fps
~ 50 fps
Quadro RTX 3000 Max-Q:
66 fps
GeForce GTX 1650 Ti Mobile:
42.4 [X] MSI GP75 Intel Core i7-10750H 2.6GHz
GeForce GTX 1650 Ti Mobile
min:
25.5 fps, P0.1:
26 fps, P1:
27.9 fps, max:
88 fps
42.9 ~ 43 fps
Quadro RTX 3000 Max-Q:
59 fps
GeForce GTX 1650 Ti Mobile:
27.8 [X] MSI GP75 Intel Core i7-10750H 2.6GHz
GeForce GTX 1650 Ti Mobile
min:
16.4 fps, P0.1:
17.1 fps, P1:
18 fps, max:
48.8 fps
fps
GeForce GTX 1650 Ti Mobile:
13.7 [X] MSI GP75 Intel Core i7-10750H 2.6GHz
GeForce GTX 1650 Ti Mobile
min:
8.24 fps, P0.1:
8.25 fps, P1:
8.65 fps, max:
34.3 fps
fps
Quadro RTX 3000 Max-Q:
18 fps
GeForce GTX 1650 Ti Mobile:
128 [X] MSI GP75 Leopard 10SCSK Intel Core i7-10750H 2.6GHz
GeForce GTX 1650 Ti Mobile
min:
78.4 fps, P0.1:
83.8 fps, P1:
95 fps, max:
308 fps
fps
GeForce GTX 1650 Ti Mobile:
48.4 [X] Dell G5 15 5500 09E2 Intel Core i5-10300H 2.5GHz
GeForce GTX 1650 Ti Mobile
min:
16.2 fps, P0.1:
27.4 fps, P1:
33.8 fps, max:
152 fps
58.3 [X] MSI GP75 Leopard 10SCSK Intel Core i7-10750H 2.6GHz
GeForce GTX 1650 Ti Mobile
min:
34.6 fps, P0.1:
44.4 fps, P1:
46.8 fps, max:
210 fps
~ 53 fps
GeForce GTX 1650 Ti Mobile:
40.1 [X] Dell G5 15 5500 09E2 Intel Core i5-10300H 2.5GHz
GeForce GTX 1650 Ti Mobile
min:
17.1 fps, P0.1:
22.9 fps, P1:
28 fps, max:
188 fps
42.2 [X] MSI GP75 Leopard 10SCSK Intel Core i7-10750H 2.6GHz
GeForce GTX 1650 Ti Mobile
min:
30.5 fps, P0.1:
33.1 fps, P1:
34.8 fps, max:
80.4 fps
~ 41 fps
GeForce GTX 1650 Ti Mobile:
29.3 [X] Dell G5 15 5500 09E2 Intel Core i5-10300H 2.5GHz
GeForce GTX 1650 Ti Mobile
min:
19.3 fps, P0.1:
19.5 fps, P1:
21.4 fps, max:
71.8 fps
37.3 [X] MSI GP75 Leopard 10SCSK Intel Core i7-10750H 2.6GHz
GeForce GTX 1650 Ti Mobile
min:
27.1 fps, P0.1:
28.4 fps, P1:
30.3 fps, max:
60 fps
~ 33 fps
GeForce GTX 1650 Ti Mobile:
85 87 [X] MSI GP75 Leopard 10SCSK Intel Core i7-10750H 2.6GHz
GeForce GTX 1650 Ti Mobile
P0.1:
62 fpsP1:
fps
~ 86 fps
Quadro RTX 3000 Max-Q:
90 fps
GeForce GTX 1650 Ti Mobile:
47 49 52 [X] MSI GP75 Leopard 10SCSK Intel Core i7-10750H 2.6GHz
GeForce GTX 1650 Ti Mobile
P0.1:
37 fpsP1:
fps
~ 49 fps
Quadro RTX 3000 Max-Q:
60 fps
GeForce GTX 1650 Ti Mobile:
27 32 [X] MSI GP75 Leopard 10SCSK Intel Core i7-10750H 2.6GHz
GeForce GTX 1650 Ti Mobile
P0.1:
22 fpsP1:
fps
35 ~ 31 fps
Quadro RTX 3000 Max-Q:
50 fps
GeForce GTX 1650 Ti Mobile:
9 15 [X] MSI GP75 Leopard 10SCSK Intel Core i7-10750H 2.6GHz
GeForce GTX 1650 Ti Mobile
P0.1:
11 fpsP1:
fps
15 ~ 13 fps
Quadro RTX 3000 Max-Q:
44 fps
Quadro RTX 3000 Max-Q:
19 fps
GeForce GTX 1650 Ti Mobile:
111 [X] MSI GP75 Leopard 10SCSK Intel Core i7-10750H 2.6GHz
GeForce GTX 1650 Ti Mobile
min:
73.7 fps, P0.1:
81.3 fps, P1:
88.4 fps, max:
164.1 fps
fps
Quadro RTX 3000 Max-Q:
133 fps
GeForce GTX 1650 Ti Mobile:
52.6 [X] MSI GP75 Leopard 10SCSK Intel Core i7-10750H 2.6GHz
GeForce GTX 1650 Ti Mobile
min:
27 fps, P0.1:
37.8 fps, P1:
45 fps, max:
66.1 fps
fps
Quadro RTX 3000 Max-Q:
71 fps
GeForce GTX 1650 Ti Mobile:
40.8 [X] MSI GP75 Leopard 10SCSK Intel Core i7-10750H 2.6GHz
GeForce GTX 1650 Ti Mobile
min:
31 fps, P0.1:
32.5 fps, P1:
35.5 fps, max:
49.4 fps
fps
Quadro RTX 3000 Max-Q:
58 fps
GeForce GTX 1650 Ti Mobile:
34 [X] MSI GP75 Leopard 10SCSK Intel Core i7-10750H 2.6GHz
GeForce GTX 1650 Ti Mobile
min:
25.2 fps, P0.1:
25.9 fps, P1:
28.8 fps, max:
42.7 fps
fps
Quadro RTX 3000 Max-Q:
47 fps
Quadro RTX 3000 Max-Q:
37 fps
Quadro RTX 3000 Max-Q:
23 fps
GeForce GTX 1650 Ti Mobile:
97 102 [X] MSI GP75 Leopard 10SCSK Intel Core i7-10750H 2.6GHz
GeForce GTX 1650 Ti Mobile
min:
49.84 fps, P1:
72.73 fps, max:
150.68 fps
~ 100 fps
Quadro RTX 3000 Max-Q:
110 fps
GeForce GTX 1650 Ti Mobile:
57 62.1 [X] MSI GP75 Leopard 10SCSK Intel Core i7-10750H 2.6GHz
GeForce GTX 1650 Ti Mobile
min:
29.41 fps, P1:
48.57 fps, max:
101.03 fps
~ 60 fps
Quadro RTX 3000 Max-Q:
70 fps
GeForce GTX 1650 Ti Mobile:
50 53.1 [X] MSI GP75 Leopard 10SCSK Intel Core i7-10750H 2.6GHz
GeForce GTX 1650 Ti Mobile
min:
23.89 fps, P1:
41.99 fps, max:
97.84 fps
~ 52 fps
Quadro RTX 3000 Max-Q:
61 fps
GeForce GTX 1650 Ti Mobile:
22 22.9 [X] MSI GP75 Leopard 10SCSK Intel Core i7-10750H 2.6GHz
GeForce GTX 1650 Ti Mobile
min:
12.66 fps, P1:
15.34 fps, max:
67.09 fps
~ 22 fps
Quadro RTX 3000 Max-Q:
33 fps
Quadro RTX 3000 Max-Q:
12 fps
GeForce GTX 1650 Ti Mobile:
201 [X] MSI GP75 Leopard 10SCSK Intel Core i7-10750H 2.6GHz
GeForce GTX 1650 Ti Mobile
min:
7.96 fps, P0.1:
111 fps, P1:
134 fps, max:
278 fps
fps
GeForce GTX 1650 Ti Mobile:
183 [X] MSI GP75 Leopard 10SCSK Intel Core i7-10750H 2.6GHz
GeForce GTX 1650 Ti Mobile
min:
16.1 fps, P0.1:
114 fps, P1:
120 fps, max:
264 fps
fps
GeForce GTX 1650 Ti Mobile:
170 [X] MSI GP75 Leopard 10SCSK Intel Core i7-10750H 2.6GHz
GeForce GTX 1650 Ti Mobile
min:
63.1 fps, P0.1:
84.9 fps, P1:
103 fps, max:
270 fps
fps
GeForce GTX 1650 Ti Mobile:
120 [X] MSI GP75 Leopard 10SCSK Intel Core i7-10750H 2.6GHz
GeForce GTX 1650 Ti Mobile
min:
24.4 fps, P0.1:
68.1 fps, P1:
72.7 fps, max:
269 fps
fps
GeForce GTX 1650 Ti Mobile:
83.7 [X] MSI GP75 Leopard 10SCSK Intel Core i7-10750H 2.6GHz
GeForce GTX 1650 Ti Mobile
min:
46.4 fps, P0.1:
47 fps, P1:
56.9 fps, max:
253 fps
fps
GeForce GTX 1650 Ti Mobile:
324 [X] MSI GP75 Leopard 10SCSK Intel Core i7-10750H 2.6GHz
GeForce GTX 1650 Ti Mobile
min:
76.9 fps, P0.1:
222 fps, P1:
256 fps, max:
439 fps
fps
GeForce GTX 1650 Ti Mobile:
150 [X] MSI GP75 Leopard 10SCSK Intel Core i7-10750H 2.6GHz
GeForce GTX 1650 Ti Mobile
min:
38.5 fps, P0.1:
65.5 fps, P1:
114 fps, max:
347 fps
fps
GeForce GTX 1650 Ti Mobile:
132 [X] MSI GP75 Leopard 10SCSK Intel Core i7-10750H 2.6GHz
GeForce GTX 1650 Ti Mobile
min:
89.4 fps, P0.1:
92.7 fps, P1:
101 fps, max:
287 fps
fps
GeForce GTX 1650 Ti Mobile:
122 [X] MSI GP75 Leopard 10SCSK Intel Core i7-10750H 2.6GHz
GeForce GTX 1650 Ti Mobile
min:
86 fps, P0.1:
88.4 fps, P1:
95.2 fps, max:
259 fps
fps
GeForce GTX 1650 Ti Mobile:
114 [X] MSI GP75 Leopard 10SCSK Intel Core i7-10750H 2.6GHz
GeForce GTX 1650 Ti Mobile
min:
65.8 fps, P0.1:
69.5 fps, P1:
82.9 fps, max:
201 fps
fps
GeForce GTX 1650 Ti Mobile:
55 [X] MSI GP75 Leopard 10SCSK Intel Core i7-10750H 2.6GHz
GeForce GTX 1650 Ti Mobile
min:
38.3 fps, P0.1:
41.8 fps, P1:
45.7 fps, max:
88.6 fps
fps
GeForce GTX 1650 Ti Mobile:
49.9 [X] MSI GP75 Leopard 10SCSK Intel Core i7-10750H 2.6GHz
GeForce GTX 1650 Ti Mobile
min:
32.5 fps, P0.1:
33.7 fps, P1:
42.1 fps, max:
104 fps
fps
GeForce GTX 1650 Ti Mobile:
119 122 [X] MSI GP75 Leopard 10SCSK Intel Core i7-10750H 2.6GHz
GeForce GTX 1650 Ti Mobile
min:
6.7 fps, P0.1:
17.3 fps, P1:
64.7 fps, max:
236 fps
~ 121 fps
GeForce GTX 1650 Ti Mobile:
55.8 57.4 [X] MSI GP75 Leopard 10SCSK Intel Core i7-10750H 2.6GHz
GeForce GTX 1650 Ti Mobile
min:
7.51 fps, P0.1:
13.3 fps, P1:
30.9 fps, max:
122 fps
~ 57 fps
GeForce GTX 1650 Ti Mobile:
43.4 48.2 [X] MSI GP75 Leopard 10SCSK Intel Core i7-10750H 2.6GHz
GeForce GTX 1650 Ti Mobile
min:
12 fps, P0.1:
18.2 fps, P1:
27.8 fps, max:
95.4 fps
~ 46 fps
GeForce GTX 1650 Ti Mobile:
32.9 34.5 [X] MSI GP75 Leopard 10SCSK Intel Core i7-10750H 2.6GHz
GeForce GTX 1650 Ti Mobile
min:
11.4 fps, P0.1:
13.8 fps, P1:
19.5 fps, max:
84.1 fps
~ 34 fps
GeForce GTX 1650 Ti Mobile:
69.5 [X] MSI GP75 Intel Core i7-10750H 2.6GHz
GeForce GTX 1650 Ti Mobile
min:
15.4 fps, P0.1:
16 fps, P1:
17.6 fps, max:
329 fps
fps
GeForce GTX 1650 Ti Mobile:
38.1 [X] MSI GP75 Intel Core i7-10750H 2.6GHz
GeForce GTX 1650 Ti Mobile
min:
25.9 fps, P0.1:
27.6 fps, P1:
31 fps, max:
65.6 fps
fps
GeForce GTX 1650 Ti Mobile:
24.8 [X] MSI GP75 Intel Core i7-10750H 2.6GHz
GeForce GTX 1650 Ti Mobile
min:
15.7 fps, P0.1:
17 fps, P1:
20.2 fps, max:
50.9 fps
fps
GeForce GTX 1650 Ti Mobile:
14.9 [X] MSI GP75 Intel Core i7-10750H 2.6GHz
GeForce GTX 1650 Ti Mobile
min:
11.4 fps, P0.1:
11.6 fps, P1:
12.4 fps, max:
19.9 fps
fps
GeForce GTX 1650 Ti Mobile:
8.8 [X] MSI GP75 Intel Core i7-10750H 2.6GHz
GeForce GTX 1650 Ti Mobile
min:
7.28 fps, P0.1:
7.32 fps, P1:
7.55 fps, max:
10.9 fps
fps
GeForce GTX 1650 Ti Mobile:
85.4 [X] MSI GP75 Leopard 10SCSK Intel Core i7-10750H 2.6GHz
GeForce GTX 1650 Ti Mobile
min:
1.915 fps, P0.1:
17.6 fps, P1:
46.1 fps, max:
111 fps
fps
GeForce GTX 1650 Ti Mobile:
42.3 [X] MSI GP75 Leopard 10SCSK Intel Core i7-10750H 2.6GHz
GeForce GTX 1650 Ti Mobile
min:
6.5 fps, P0.1:
10.5 fps, P1:
23.1 fps, max:
97.9 fps
fps
GeForce GTX 1650 Ti Mobile:
31.5 [X] MSI GP75 Leopard 10SCSK Intel Core i7-10750H 2.6GHz
GeForce GTX 1650 Ti Mobile
min:
15.5 fps, P0.1:
16.1 fps, P1:
24.2 fps, max:
66 fps
fps
GeForce GTX 1650 Ti Mobile:
21.8 [X] MSI GP75 Leopard 10SCSK Intel Core i7-10750H 2.6GHz
GeForce GTX 1650 Ti Mobile
min:
8.9 fps, P0.1:
10.3 fps, P1:
16.1 fps, max:
52.7 fps
fps
GeForce GTX 1650 Ti Mobile:
110 120 [X] MSI GP75 Leopard 10SCSK Intel Core i7-10750H 2.6GHz
GeForce GTX 1650 Ti Mobile
P0.1:
52 fpsP1:
fps
~ 115 fps
Quadro RTX 3000 Max-Q:
118 fps
GeForce GTX 1650 Ti Mobile:
56 62 68 [X] MSI GP75 Leopard 10SCSK Intel Core i7-10750H 2.6GHz
GeForce GTX 1650 Ti Mobile
P0.1:
39 fpsP1:
fps
~ 62 fps
Quadro RTX 3000 Max-Q:
76 fps
GeForce GTX 1650 Ti Mobile:
49 50 58 [X] MSI GP75 Leopard 10SCSK Intel Core i7-10750H 2.6GHz
GeForce GTX 1650 Ti Mobile
P0.1:
25 fpsP1:
fps
~ 52 fps
Quadro RTX 3000 Max-Q:
65 fps
GeForce GTX 1650 Ti Mobile:
43 43 43 [X] SCHENKER XMG Core 17 Comet Lake Overboost
Intel Core i7-10750H 2.6GHz
GeForce GTX 1650 Ti Mobile
min:
20 fps, max:
97 fps
48 [X] MSI GP75 Leopard 10SCSK Intel Core i7-10750H 2.6GHz
GeForce GTX 1650 Ti Mobile
P0.1:
25 fpsP1:
fps
~ 44 fps
Quadro RTX 3000 Max-Q:
56 fps
Quadro RTX 3000 Max-Q:
41 fps
Quadro RTX 3000 Max-Q:
23 fps
GeForce GTX 1650 Ti Mobile:
125 [X] MSI GP75 Leopard 10SCSK Intel Core i7-10750H 2.6GHz
GeForce GTX 1650 Ti Mobile
min:
66.5 fps, P0.1:
90.5 fps, P1:
107 fps, max:
160 fps
fps
Quadro RTX 3000 Max-Q:
98 fps
GeForce GTX 1650 Ti Mobile:
71.9 [X] MSI GP75 Leopard 10SCSK Intel Core i7-10750H 2.6GHz
GeForce GTX 1650 Ti Mobile
min:
35.2 fps, P0.1:
57.3 fps, P1:
61.2 fps, max:
126 fps
fps
Quadro RTX 3000 Max-Q:
85 fps
GeForce GTX 1650 Ti Mobile:
67.5 [X] MSI GP75 Leopard 10SCSK Intel Core i7-10750H 2.6GHz
GeForce GTX 1650 Ti Mobile
min:
28.1 fps, P0.1:
51.3 fps, P1:
59.6 fps, max:
118 fps
fps
Quadro RTX 3000 Max-Q:
79 fps
GeForce GTX 1650 Ti Mobile:
65.4 [X] MSI GP75 Leopard 10SCSK Intel Core i7-10750H 2.6GHz
GeForce GTX 1650 Ti Mobile
min:
53.8 fps, P0.1:
55 fps, P1:
57.5 fps, max:
72.9 fps
fps
Quadro RTX 3000 Max-Q:
76 fps
Quadro RTX 3000 Max-Q:
54 fps
Quadro RTX 3000 Max-Q:
29 fps
GeForce GTX 1650 Ti Mobile:
206 218 [X] MSI GP75 Leopard 10SCSK 704326
Intel Core i7-10750H 2.6GHz
GeForce GTX 1650 Ti Mobile
min:
200 fps, max:
242 fps
~ 212 fps
GeForce GTX 1650 Ti Mobile:
110 119 [X] MSI GP75 Leopard 10SCSK 704326
Intel Core i7-10750H 2.6GHz
GeForce GTX 1650 Ti Mobile
min:
104 fps, max:
133 fps
~ 115 fps
GeForce GTX 1650 Ti Mobile:
87.9 93.7 [X] MSI GP75 Leopard 10SCSK 704326
Intel Core i7-10750H 2.6GHz
GeForce GTX 1650 Ti Mobile
min:
81 fps, max:
106 fps
~ 91 fps
GeForce GTX 1650 Ti Mobile:
61.4 66.4 [X] MSI GP75 Leopard 10SCSK 704326
Intel Core i7-10750H 2.6GHz
GeForce GTX 1650 Ti Mobile
min:
54 fps, max:
77 fps
~ 64 fps
GeForce GTX 1650 Ti Mobile:
181 [X] MSI GP75 Leopard 10SCSK Intel Core i7-10750H 2.6GHz
GeForce GTX 1650 Ti Mobile
min:
68 fps, P0.1:
89.7 fps, P1:
127 fps, max:
534 fps
fps
GeForce GTX 1650 Ti Mobile:
180 [X] MSI GP75 Leopard 10SCSK Intel Core i7-10750H 2.6GHz
GeForce GTX 1650 Ti Mobile
min:
71.2 fps, P0.1:
99.4 fps, P1:
134 fps, max:
643 fps
fps
GeForce GTX 1650 Ti Mobile:
164 [X] MSI GP75 Leopard 10SCSK Intel Core i7-10750H 2.6GHz
GeForce GTX 1650 Ti Mobile
min:
8.96 fps, P0.1:
86.9 fps, P1:
116 fps, max:
705 fps
fps
GeForce GTX 1650 Ti Mobile:
83.9 [X] MSI GP75 Leopard 10SCSK Intel Core i7-10750H 2.6GHz
GeForce GTX 1650 Ti Mobile
min:
2.36 fps, P0.1:
49.4 fps, P1:
61.2 fps, max:
161 fps
fps
100%
Quadro T1000 (Laptop):
190.9 fps
100%
Quadro T1000 (Laptop):
91.8 fps
109%
GeForce GTX 1650 Ti Mobile:
100 fps
100%
Quadro T1000 (Laptop):
58.4 fps
115%
GeForce GTX 1650 Ti Mobile:
67.3 fps
100%
Quadro T1000 (Laptop):
43.5 fps
114%
GeForce GTX 1650 Ti Mobile:
49.8 fps
GeForce GTX 1650 Ti Mobile:
29.3 fps
GeForce GTX 1650 Ti Mobile:
16.9 fps
100%
Quadro T1000 (Laptop):
150 fps
113%
GeForce GTX 1650 Ti Mobile:
149.5 188.3 ~ 169 fps
119%
Quadro RTX 3000 Max-Q:
178.3 fps
100%
Quadro T1000 (Laptop):
78 fps
124%
GeForce GTX 1650 Ti Mobile:
90.7 97.9 101 [X] Dell G5 15 5500 09E2 Intel Core i5-10300H 2.5GHz
GeForce GTX 1650 Ti Mobile
min:
34.1 fps, P0.1:
75 fps, P1:
80.1 fps, max:
189 fps
~ 97 fps
153%
Quadro RTX 3000 Max-Q:
119.2 fps
100%
Quadro T1000 (Laptop):
64.3 fps
117%
GeForce GTX 1650 Ti Mobile:
66.6 75.3 [X] Dell G5 15 5500 09E2 Intel Core i5-10300H 2.5GHz
GeForce GTX 1650 Ti Mobile
min:
49.3 fps, P0.1:
51.4 fps, P1:
55.4 fps, max:
113 fps
82.3 ~ 75 fps
162%
Quadro RTX 3000 Max-Q:
104.4 fps
Quadro RTX 3000 Max-Q:
102.6 fps
Quadro RTX 3000 Max-Q:
67.5 fps
Quadro RTX 3000 Max-Q:
31.6 fps
100%
Quadro T1000 (Laptop):
134.1 fps
112%
GeForce GTX 1650 Ti Mobile:
150 fps
100%
Quadro T1000 (Laptop):
51 fps
115%
GeForce GTX 1650 Ti Mobile:
58.5 fps
100%
Quadro T1000 (Laptop):
44.4 fps
107%
GeForce GTX 1650 Ti Mobile:
47.5 fps
100%
Quadro T1000 (Laptop):
121.4 fps
99%
GeForce GTX 1650 Ti Mobile:
120.5 fps
100%
Quadro T1000 (Laptop):
87.9 fps
102%
GeForce GTX 1650 Ti Mobile:
89.7 fps
100%
Quadro T1000 (Laptop):
67.8 fps
89%
GeForce GTX 1650 Ti Mobile:
60.4 fps
100%
Quadro T1000 (Laptop):
56 fps
130%
GeForce GTX 1650 Ti Mobile:
73 fps
100%
Quadro T1000 (Laptop):
87.9 fps
100%
Quadro T1000 (Laptop):
46.7 fps
115%
GeForce GTX 1650 Ti Mobile:
53.8 fps
100%
Quadro T1000 (Laptop):
29.9 fps
118%
GeForce GTX 1650 Ti Mobile:
35.4 fps
100%
Quadro T1000 (Laptop):
19.4 fps
112%
GeForce GTX 1650 Ti Mobile:
21.8 fps
GeForce GTX 1650 Ti Mobile:
17.1 fps
100%
Quadro T1000 (Laptop):
67.3 fps
66%
GeForce GTX 1650 Ti Mobile:
44.1 fps
114%
Quadro RTX 3000 Max-Q:
76.8 fps
100%
Quadro T1000 (Laptop):
57.6 fps
72%
GeForce GTX 1650 Ti Mobile:
41.5 fps
125%
Quadro RTX 3000 Max-Q:
71.8 fps
100%
Quadro T1000 (Laptop):
50.4 fps
81%
GeForce GTX 1650 Ti Mobile:
40.7 fps
132%
Quadro RTX 3000 Max-Q:
66.3 fps
Quadro RTX 3000 Max-Q:
46.8 fps
Quadro RTX 3000 Max-Q:
24.1 fps
100%
Quadro T1000 (Laptop):
86 fps
70%
GeForce GTX 1650 Ti Mobile:
60.4 fps
95%
Quadro RTX 3000 Max-Q:
82 fps
100%
Quadro T1000 (Laptop):
60.5 fps
72%
GeForce GTX 1650 Ti Mobile:
43.3 fps
123%
Quadro RTX 3000 Max-Q:
74.7 fps
100%
Quadro T1000 (Laptop):
51.9 fps
75%
GeForce GTX 1650 Ti Mobile:
39 fps
129%
Quadro RTX 3000 Max-Q:
66.7 fps
100%
Quadro T1000 (Laptop):
46.9 fps
80%
GeForce GTX 1650 Ti Mobile:
37.3 fps
132%
Quadro RTX 3000 Max-Q:
61.9 fps
Quadro RTX 3000 Max-Q:
47.5 fps
Quadro RTX 3000 Max-Q:
25.9 fps
100%
Quadro T1000 (Laptop):
96.7 fps
147%
Quadro RTX 3000 Max-Q:
142.5 fps
100%
Quadro T1000 (Laptop):
61.2 fps
116%
GeForce GTX 1650 Ti Mobile:
71.1 fps
153%
Quadro RTX 3000 Max-Q:
93.8 fps
100%
Quadro T1000 (Laptop):
50.8 fps
125%
GeForce GTX 1650 Ti Mobile:
63.5 fps
159%
Quadro RTX 3000 Max-Q:
81 fps
100%
Quadro T1000 (Laptop):
44 fps
118%
GeForce GTX 1650 Ti Mobile:
51.7 fps
123%
Quadro RTX 3000 Max-Q:
54.3 fps
GeForce GTX 1650 Ti Mobile:
36.6 fps
Quadro RTX 3000 Max-Q:
34 fps
GeForce GTX 1650 Ti Mobile:
18.9 fps
Quadro RTX 3000 Max-Q:
17.5 fps
100%
Quadro T1000 (Laptop):
125.4 fps
83%
GeForce GTX 1650 Ti Mobile:
103.8 fps
74%
Quadro RTX 3000 Max-Q:
93 fps
100%
Quadro T1000 (Laptop):
76.8 fps
92%
GeForce GTX 1650 Ti Mobile:
70.7 fps
94%
Quadro RTX 3000 Max-Q:
72.4 fps
100%
Quadro T1000 (Laptop):
65.2 fps
98%
GeForce GTX 1650 Ti Mobile:
64.1 fps
102%
Quadro RTX 3000 Max-Q:
66.3 fps
100%
Quadro T1000 (Laptop):
42.8 fps
64%
GeForce GTX 1650 Ti Mobile:
27.3 fps
120%
Quadro RTX 3000 Max-Q:
51.4 fps
Quadro RTX 3000 Max-Q:
46.6 fps
Quadro RTX 3000 Max-Q:
21.2 fps
100%
Quadro T1000 (Laptop):
93 fps
77%
GeForce GTX 1650 Ti Mobile:
72 fps
81%
Quadro RTX 3000 Max-Q:
75 fps
100%
Quadro T1000 (Laptop):
53 fps
100%
GeForce GTX 1650 Ti Mobile:
53 fps
123%
Quadro RTX 3000 Max-Q:
65 fps
100%
Quadro T1000 (Laptop):
47 fps
100%
GeForce GTX 1650 Ti Mobile:
47 fps
126%
Quadro RTX 3000 Max-Q:
59 fps
100%
Quadro T1000 (Laptop):
32 fps
97%
GeForce GTX 1650 Ti Mobile:
31 fps
141%
Quadro RTX 3000 Max-Q:
45 fps
Quadro RTX 3000 Max-Q:
32 fps
Quadro RTX 3000 Max-Q:
16 fps
100%
Quadro T1000 (Laptop):
208 fps
100%
Quadro T1000 (Laptop):
171.3 fps
90%
GeForce GTX 1650 Ti Mobile:
155 fps
100%
Quadro T1000 (Laptop):
160.3 fps
95%
GeForce GTX 1650 Ti Mobile:
153 fps
100%
Quadro T1000 (Laptop):
148.9 fps
99%
GeForce GTX 1650 Ti Mobile:
148 fps
GeForce GTX 1650 Ti Mobile:
144 fps
100%
Quadro T1000 (Laptop):
117.9 fps
106%
GeForce GTX 1650 Ti Mobile:
122 128.3 ~ 125 fps
100%
Quadro T1000 (Laptop):
58.7 fps
100%
Quadro T1000 (Laptop):
38 fps
100%
Quadro T1000 (Laptop):
28.5 fps
GeForce GTX 1650 Ti Mobile:
20.1 fps
GeForce GTX 1650 Ti Mobile:
7.1 fps
100%
Quadro T1000 (Laptop):
136.8 fps
100%
Quadro T1000 (Laptop):
42.4 fps
115%
GeForce GTX 1650 Ti Mobile:
48.6 fps
100%
Quadro T1000 (Laptop):
31.2 fps
114%
GeForce GTX 1650 Ti Mobile:
35.5 fps
GeForce GTX 1650 Ti Mobile:
21.9 fps
GeForce GTX 1650 Ti Mobile:
10.5 fps
100%
Quadro T1000 (Laptop):
118 178 ~ 148 fps
139%
GeForce GTX 1650 Ti Mobile:
206 fps
100%
Quadro T1000 (Laptop):
73 105 ~ 89 fps
118%
GeForce GTX 1650 Ti Mobile:
105 fps
100%
Quadro T1000 (Laptop):
61 92 ~ 77 fps
116%
GeForce GTX 1650 Ti Mobile:
89 fps
100%
Quadro T1000 (Laptop):
49 79 ~ 64 fps
119%
GeForce GTX 1650 Ti Mobile:
76 fps
100%
Quadro T1000 (Laptop):
182.3 189 ~ 186 fps
102%
GeForce GTX 1650 Ti Mobile:
190.2 fps
100%
Quadro T1000 (Laptop):
60.4 62.5 ~ 61 fps
97%
GeForce GTX 1650 Ti Mobile:
59.1 fps
100%
Quadro T1000 (Laptop):
37.5 39.1 ~ 38 fps
107%
GeForce GTX 1650 Ti Mobile:
40.8 fps
100%
Quadro T1000 (Laptop):
24.7 25.6 ~ 25 fps
109%
GeForce GTX 1650 Ti Mobile:
27.2 fps
100%
Quadro T1000 (Laptop):
123.7 fps
100%
Quadro T1000 (Laptop):
55.2 fps
121%
GeForce GTX 1650 Ti Mobile:
66.9 fps
100%
Quadro T1000 (Laptop):
45.7 fps
121%
GeForce GTX 1650 Ti Mobile:
55.5 fps
100%
Quadro T1000 (Laptop):
45.1 fps
121%
GeForce GTX 1650 Ti Mobile:
54.7 fps
GeForce GTX 1650 Ti Mobile:
33.7 fps
GeForce GTX 1650 Ti Mobile:
14.9 fps
100%
Quadro T1000 (Laptop):
69.6 94.5 ~ 82 fps
83%
GeForce GTX 1650 Ti Mobile:
68.4 fps
100%
Quadro T1000 (Laptop):
52.8 73.4 ~ 63 fps
102%
GeForce GTX 1650 Ti Mobile:
64.5 fps
100%
Quadro T1000 (Laptop):
37.2 45.2 ~ 41 fps
120%
GeForce GTX 1650 Ti Mobile:
49.1 fps
100%
Quadro T1000 (Laptop):
20 23.1 ~ 22 fps
125%
GeForce GTX 1650 Ti Mobile:
27.6 fps
100%
Quadro T1000 (Laptop):
111 fps
104%
GeForce GTX 1650 Ti Mobile:
115 fps
103%
Quadro RTX 3000 Max-Q:
114 fps
100%
Quadro T1000 (Laptop):
39 61 ~ 50 fps
112%
GeForce GTX 1650 Ti Mobile:
56 fps
172%
Quadro RTX 3000 Max-Q:
86 fps
100%
Quadro T1000 (Laptop):
36 48 ~ 42 fps
112%
GeForce GTX 1650 Ti Mobile:
47 fps
162%
Quadro RTX 3000 Max-Q:
68 fps
100%
Quadro T1000 (Laptop):
29 35 ~ 32 fps
109%
GeForce GTX 1650 Ti Mobile:
35 fps
156%
Quadro RTX 3000 Max-Q:
50 fps
Quadro RTX 3000 Max-Q:
34 fps
Quadro RTX 3000 Max-Q:
17 fps
118%
GeForce GTX 1650 Ti Mobile:
247.3 fps
97%
Quadro RTX 3000 Max-Q:
203 fps
100%
Quadro T1000 (Laptop):
80.7 100.5 ~ 91 fps
102%
GeForce GTX 1650 Ti Mobile:
92.7 fps
141%
Quadro RTX 3000 Max-Q:
128 fps
100%
Quadro T1000 (Laptop):
63.7 79.4 ~ 72 fps
104%
GeForce GTX 1650 Ti Mobile:
74.6 fps
140%
Quadro RTX 3000 Max-Q:
101 fps
100%
Quadro T1000 (Laptop):
36.3 42.5 ~ 39 fps
115%
GeForce GTX 1650 Ti Mobile:
44.8 fps
164%
Quadro RTX 3000 Max-Q:
64 fps
Quadro RTX 3000 Max-Q:
47.2 fps
100%
Quadro T1000 (Laptop):
77 fps
116%
GeForce GTX 1650 Ti Mobile:
73 104 ~ 89 fps
100%
Quadro T1000 (Laptop):
48 fps
131%
GeForce GTX 1650 Ti Mobile:
57 66 66 ~ 63 fps
100%
Quadro T1000 (Laptop):
46 fps
133%
GeForce GTX 1650 Ti Mobile:
58 62 63 ~ 61 fps
100%
Quadro T1000 (Laptop):
43 fps
128%
GeForce GTX 1650 Ti Mobile:
51 57 57 ~ 55 fps
100%
Quadro T1000 (Laptop):
93.3 fps
98%
GeForce GTX 1650 Ti Mobile:
91.6 fps
100%
Quadro T1000 (Laptop):
43.4 fps
112%
GeForce GTX 1650 Ti Mobile:
48.7 fps
100%
Quadro T1000 (Laptop):
31.9 fps
113%
GeForce GTX 1650 Ti Mobile:
35.9 fps
100%
Quadro T1000 (Laptop):
25.5 fps
109%
GeForce GTX 1650 Ti Mobile:
27.9 fps
100%
Quadro T1000 (Laptop):
143.7 144 ~ 144 fps
100%
GeForce GTX 1650 Ti Mobile:
144 fps
100%
Quadro T1000 (Laptop):
73.8 92.7 ~ 83 fps
110%
GeForce GTX 1650 Ti Mobile:
91 fps
100%
Quadro T1000 (Laptop):
57.8 69 ~ 63 fps
133%
GeForce GTX 1650 Ti Mobile:
84 fps
100%
Quadro T1000 (Laptop):
55.9 68.7 ~ 62 fps
119%
GeForce GTX 1650 Ti Mobile:
74 fps
GeForce GTX 1650 Ti Mobile:
84.4 fps
GeForce GTX 1650 Ti Mobile:
60.9 fps
GeForce GTX 1650 Ti Mobile:
56.2 fps
GeForce GTX 1650 Ti Mobile:
37.5 fps
GeForce GTX 1650 Ti Mobile:
19.6 fps
GeForce GTX 1650 Ti Mobile:
85.9 fps
GeForce GTX 1650 Ti Mobile:
68.6 fps
GeForce GTX 1650 Ti Mobile:
60.8 fps
GeForce GTX 1650 Ti Mobile:
37.9 fps
GeForce GTX 1650 Ti Mobile:
12.7 fps
100%
Quadro T1000 (Laptop):
61.5 138.1 ~ 100 fps
100%
Quadro T1000 (Laptop):
43.2 76.5 ~ 60 fps
141%
GeForce GTX 1650 Ti Mobile:
84.3 fps
100%
Quadro T1000 (Laptop):
37.8 66.6 ~ 52 fps
141%
GeForce GTX 1650 Ti Mobile:
73.2 fps
100%
Quadro T1000 (Laptop):
35 59.4 ~ 47 fps
143%
GeForce GTX 1650 Ti Mobile:
67.3 fps
GeForce GTX 1650 Ti Mobile:
51.2 fps
GeForce GTX 1650 Ti Mobile:
27.6 fps
100%
Quadro T1000 (Laptop):
182.4 fps
100%
Quadro T1000 (Laptop):
106.7 fps
100%
Quadro T1000 (Laptop):
86.3 fps
100%
Quadro T1000 (Laptop):
66.5 fps
Quadro RTX 3000 Max-Q:
66.3 fps
GeForce GTX 1650 Ti Mobile:
59.2 fps
Quadro RTX 3000 Max-Q:
63.2 fps
GeForce GTX 1650 Ti Mobile:
53.7 fps
Quadro RTX 3000 Max-Q:
57.5 fps
GeForce GTX 1650 Ti Mobile:
51.5 fps
Quadro RTX 3000 Max-Q:
55.9 fps
GeForce GTX 1650 Ti Mobile:
40.5 fps
Quadro RTX 3000 Max-Q:
44.8 fps
GeForce GTX 1650 Ti Mobile:
21.6 fps
Quadro RTX 3000 Max-Q:
24.3 fps
100%
Quadro T1000 (Laptop):
57 82 ~ 70 fps
123%
GeForce GTX 1650 Ti Mobile:
86 fps
100%
Quadro T1000 (Laptop):
40 55 ~ 48 fps
127%
GeForce GTX 1650 Ti Mobile:
60 62 ~ 61 fps
100%
Quadro T1000 (Laptop):
35 50 ~ 43 fps
107%
GeForce GTX 1650 Ti Mobile:
42 49 ~ 46 fps
100%
Quadro T1000 (Laptop):
29 29 ~ 29 fps
93%
GeForce GTX 1650 Ti Mobile:
25 29 ~ 27 fps
100%
Quadro T1000 (Laptop):
148 fps
100%
Quadro T1000 (Laptop):
119.2 fps
100%
Quadro T1000 (Laptop):
113.5 fps
100%
Quadro T1000 (Laptop):
110.8 fps
100%
Quadro T1000 (Laptop):
88 101 111 ~ 100 fps
139%
GeForce GTX 1650 Ti Mobile:
139 fps
86%
Quadro RTX 3000 Max-Q:
86 fps
100%
Quadro T1000 (Laptop):
46 56.7 58 ~ 54 fps
120%
GeForce GTX 1650 Ti Mobile:
62 65 69 ~ 65 fps
141%
Quadro RTX 3000 Max-Q:
76 fps
100%
Quadro T1000 (Laptop):
40 50 54.1 ~ 48 fps
119%
GeForce GTX 1650 Ti Mobile:
55 57 58 ~ 57 fps
148%
Quadro RTX 3000 Max-Q:
71 fps
100%
Quadro T1000 (Laptop):
35 45 46 ~ 42 fps
117%
GeForce GTX 1650 Ti Mobile:
48 48 51 ~ 49 fps
155%
Quadro RTX 3000 Max-Q:
65 fps
GeForce GTX 1650 Ti Mobile:
32 fps
Quadro RTX 3000 Max-Q:
43 fps
GeForce GTX 1650 Ti Mobile:
18 fps
Quadro RTX 3000 Max-Q:
21 fps
GeForce GTX 1650 Ti Mobile:
230 fps
GeForce GTX 1650 Ti Mobile:
95 fps
GeForce GTX 1650 Ti Mobile:
75.2 fps
GeForce GTX 1650 Ti Mobile:
62.7 fps
GeForce GTX 1650 Ti Mobile:
63.7 fps
GeForce GTX 1650 Ti Mobile:
55.5 fps
GeForce GTX 1650 Ti Mobile:
45.3 fps
100%
Quadro T1000 (Laptop):
107 fps
111%
GeForce GTX 1650 Ti Mobile:
119 fps
134%
Quadro RTX 3000 Max-Q:
143 fps
100%
Quadro T1000 (Laptop):
62 fps
108%
GeForce GTX 1650 Ti Mobile:
67 fps
140%
Quadro RTX 3000 Max-Q:
87 fps
100%
Quadro T1000 (Laptop):
57 fps
109%
GeForce GTX 1650 Ti Mobile:
62 fps
139%
Quadro RTX 3000 Max-Q:
79 fps
100%
Quadro T1000 (Laptop):
53 fps
109%
GeForce GTX 1650 Ti Mobile:
58 fps
142%
Quadro RTX 3000 Max-Q:
75 fps
Quadro RTX 3000 Max-Q:
26 fps
100%
Quadro T1000 (Laptop):
491.9 fps
100%
Quadro T1000 (Laptop):
199.3 fps
100%
Quadro T1000 (Laptop):
77.1 fps
100%
Quadro T1000 (Laptop):
79.7 91 108 ~ 93 fps
104%
GeForce GTX 1650 Ti Mobile:
80.2 90.1 92.4 [X] SCHENKER XMG Core 17 Comet Lake Balanced
Intel Core i7-10750H 2.6GHz
GeForce GTX 1650 Ti Mobile
95.6 98.9 103 103 [X] SCHENKER XMG Core 17 Comet Lake Overboost
Intel Core i7-10750H 2.6GHz
GeForce GTX 1650 Ti Mobile
109 ~ 97 fps
118%
Quadro RTX 3000 Max-Q:
106 107 117 ~ 110 fps
100%
Quadro T1000 (Laptop):
66.2 78 96 ~ 80 fps
101%
GeForce GTX 1650 Ti Mobile:
67.6 78.2 80.5 81.4 81.4 [X] SCHENKER XMG Core 17 Comet Lake Balanced
Intel Core i7-10750H 2.6GHz
GeForce GTX 1650 Ti Mobile
82.7 89.9 90.1 [X] SCHENKER XMG Core 17 Comet Lake Overboost
Intel Core i7-10750H 2.6GHz
GeForce GTX 1650 Ti Mobile
~ 81 fps
121%
Quadro RTX 3000 Max-Q:
92 93.9 106 ~ 97 fps
100%
GeForce GTX 1650 Ti Mobile:
59.1 63.3 69.5 69.6 [X] SCHENKER XMG Core 17 Comet Lake Balanced
Intel Core i7-10750H 2.6GHz
GeForce GTX 1650 Ti Mobile
71 71.8 75.7 75.9 [X] SCHENKER XMG Core 17 Comet Lake Overboost
Intel Core i7-10750H 2.6GHz
GeForce GTX 1650 Ti Mobile
~ 69 fps
GeForce GTX 1650 Ti Mobile:
45.8 fps
100%
Quadro T1000 (Laptop):
93.7 fps
100%
Quadro T1000 (Laptop):
49.3 fps
141%
GeForce GTX 1650 Ti Mobile:
69.3 fps
100%
Quadro T1000 (Laptop):
40.5 fps
142%
GeForce GTX 1650 Ti Mobile:
57.7 fps
100%
Quadro T1000 (Laptop):
30.7 fps
126%
GeForce GTX 1650 Ti Mobile:
38.7 fps
GeForce GTX 1650 Ti Mobile:
25.9 fps
GeForce GTX 1650 Ti Mobile:
11.7 fps
100%
Quadro T1000 (Laptop):
56.1 77.4 ~ 67 fps
158%
GeForce GTX 1650 Ti Mobile:
104 107 ~ 106 fps
222%
Quadro RTX 3000 Max-Q:
149 fps
100%
Quadro T1000 (Laptop):
41.9 49.2 ~ 46 fps
172%
Quadro RTX 3000 Max-Q:
79.1 fps
100%
Quadro T1000 (Laptop):
31.1 34 ~ 33 fps
124%
GeForce GTX 1650 Ti Mobile:
39.3 40.9 42 ~ 41 fps
180%
Quadro RTX 3000 Max-Q:
59.5 fps
Quadro RTX 3000 Max-Q:
43.8 fps
GeForce GTX 1650 Ti Mobile:
14.6 fps
Quadro RTX 3000 Max-Q:
25.9 fps
GeForce GTX 1650 Ti Mobile:
121 fps
GeForce GTX 1650 Ti Mobile:
89.9 fps
GeForce GTX 1650 Ti Mobile:
68.6 fps
GeForce GTX 1650 Ti Mobile:
41.1 fps
GeForce GTX 1650 Ti Mobile:
13.1 fps
100%
Quadro T1000 (Laptop):
246.4 fps
100%
Quadro T1000 (Laptop):
150.7 fps
100%
Quadro T1000 (Laptop):
117 fps
100%
Quadro T1000 (Laptop):
94 fps
100%
Quadro T1000 (Laptop):
47.2 fps
100%
Quadro T1000 (Laptop):
43.9 fps
100%
Quadro T1000 (Laptop):
24.2 fps
100%
Quadro T1000 (Laptop):
66.7 77.5 ~ 72 fps
100%
Quadro T1000 (Laptop):
63.9 74.3 ~ 69 fps
100%
Quadro T1000 (Laptop):
48.8 56.7 ~ 53 fps
100%
Quadro T1000 (Laptop):
136.2 fps
133%
GeForce GTX 1650 Ti Mobile:
181 fps
143%
Quadro RTX 3000 Max-Q:
195 fps
100%
Quadro T1000 (Laptop):
86 fps
144%
GeForce GTX 1650 Ti Mobile:
124 fps
162%
Quadro RTX 3000 Max-Q:
139 fps
100%
Quadro T1000 (Laptop):
53.4 fps
128%
GeForce GTX 1650 Ti Mobile:
68.3 fps
181%
Quadro RTX 3000 Max-Q:
96.7 fps
100%
Quadro T1000 (Laptop):
43.8 fps
134%
GeForce GTX 1650 Ti Mobile:
58.9 fps
184%
Quadro RTX 3000 Max-Q:
80.8 fps
Quadro RTX 3000 Max-Q:
34 fps
100%
Quadro T1000 (Laptop):
97.9 117.9 ~ 108 fps
98%
GeForce GTX 1650 Ti Mobile:
107 136.2 137 [X] SCHENKER XMG Core 17 Comet Lake Balanced
Intel Core i7-10750H 2.6GHz
GeForce GTX 1650 Ti Mobile
min:
121 fps, max:
-1 fps
138 148 148 148 [X] SCHENKER XMG Core 17 Comet Lake Overboost
Intel Core i7-10750H 2.6GHz
GeForce GTX 1650 Ti Mobile
min:
130.7 fps, max:
-1 fps
150 ~ 139 fps
101%
Quadro RTX 3000 Max-Q:
131 145 156 ~ 144 fps
100%
GeForce GTX 1650 Ti Mobile:
104 121 [X] SCHENKER XMG Core 17 Comet Lake Balanced
Intel Core i7-10750H 2.6GHz
GeForce GTX 1650 Ti Mobile
min:
106.7 fps, max:
-1 fps
123.8 124 129 129 [X] SCHENKER XMG Core 17 Comet Lake Overboost
Intel Core i7-10750H 2.6GHz
GeForce GTX 1650 Ti Mobile
min:
112.8 fps, max:
-1 fps
132 139 ~ 125 fps
105%
Quadro RTX 3000 Max-Q:
120 133 141 ~ 131 fps
99%
GeForce GTX 1650 Ti Mobile:
91 115 115 [X] SCHENKER XMG Core 17 Comet Lake Balanced
Intel Core i7-10750H 2.6GHz
GeForce GTX 1650 Ti Mobile
min:
100.7 fps, max:
-1 fps
117.1 120 120 [X] SCHENKER XMG Core 17 Comet Lake Overboost
Intel Core i7-10750H 2.6GHz
GeForce GTX 1650 Ti Mobile
min:
104 fps, max:
-1 fps
122 130 ~ 116 fps
108%
Quadro RTX 3000 Max-Q:
115 126 137 ~ 126 fps
100%
GeForce GTX 1650 Ti Mobile:
87.1 107 [X] SCHENKER XMG Core 17 Comet Lake Balanced
Intel Core i7-10750H 2.6GHz
GeForce GTX 1650 Ti Mobile
min:
93.8 fps, max:
-1 fps
109 112 112 [X] SCHENKER XMG Core 17 Comet Lake Overboost
Intel Core i7-10750H 2.6GHz
GeForce GTX 1650 Ti Mobile
min:
98.9 fps, max:
-1 fps
113 115 120 ~ 109 fps
108%
Quadro RTX 3000 Max-Q:
109 120 125 ~ 118 fps
100%
Quadro T1000 (Laptop):
47.9 fps
108%
GeForce GTX 1650 Ti Mobile:
51.8 fps
111%
GeForce GTX 1650 Ti Mobile:
34.7 [X] Dell G5 15 5500 09E2 Intel Core i5-10300H 2.5GHz
GeForce GTX 1650 Ti Mobile
min:
8.09 fps, P0.1:
8.67 fps, P1:
28.2 fps, max:
154 fps
36.6 38.1 38.3 38.8 40.1 42.1 [X] SCHENKER XMG Core 17 Comet Lake Overboost
Intel Core i7-10750H 2.6GHz
GeForce GTX 1650 Ti Mobile
42.3 ~ 39 fps
GeForce GTX 1650 Ti Mobile:
24.8 fps
100%
Quadro T1000 (Laptop):
170.1 fps
93%
GeForce GTX 1650 Ti Mobile:
144 173 ~ 159 fps
91%
Quadro RTX 3000 Max-Q:
155 fps
100%
Quadro T1000 (Laptop):
153.9 fps
107%
GeForce GTX 1650 Ti Mobile:
165 fps
97%
Quadro RTX 3000 Max-Q:
150 fps
100%
Quadro T1000 (Laptop):
93.8 fps
107%
GeForce GTX 1650 Ti Mobile:
93.1 107 ~ 100 fps
119%
Quadro RTX 3000 Max-Q:
111.8 fps
100%
Quadro T1000 (Laptop):
41.7 fps
125%
GeForce GTX 1650 Ti Mobile:
51.5 53.2 ~ 52 fps
140%
Quadro RTX 3000 Max-Q:
58.5 fps
Quadro RTX 3000 Max-Q:
49.4 fps
Quadro RTX 3000 Max-Q:
65 fps
102%
GeForce GTX 1650 Ti Mobile:
299.1 309 ~ 304 fps
100%
Quadro T1000 (Laptop):
210 241 ~ 226 fps
108%
GeForce GTX 1650 Ti Mobile:
239.3 251 ~ 245 fps
112%
GeForce GTX 1650 Ti Mobile:
222.6 227 ~ 225 fps
100%
Quadro T1000 (Laptop):
72.9 86.6 ~ 80 fps
140%
GeForce GTX 1650 Ti Mobile:
99 125.6 ~ 112 fps
Average Gaming NVIDIA Quadro T1000 (Laptop) → 100% Average Gaming 30-70 fps → 100%
Average Gaming NVIDIA GeForce GTX 1650 Ti Mobile → 111% Average Gaming 30-70 fps → 110%
Average Gaming NVIDIA Quadro RTX 3000 Max-Q → 135% Average Gaming 30-70 fps → 140%
NVIDIA Quadro RTX 3000 Max-Q low med. high ultra QHD 4K Hitman 3 178 100 86 78 27 Cyberpunk 2077 1.0 93 52 43 36 10 Immortals Fenyx Rising 105 71 63 58 24 Yakuza Like a Dragon 131 88 66 59 18 Assassin´s Creed Valhalla 90 60 50 44 19 Dirt 5 133 71 58 47 37 23 Watch Dogs Legion 110 70 61 33 12 Horizon Zero Dawn 118 76 65 56 41 23 Death Stranding 98 85 79 76 54 29 Doom Eternal 178.3 119.2 104.4 102.6 67.5 31.6 Star Wars Jedi Fallen Order 76.8 71.8 66.3 46.8 24.1 Need for Speed Heat 82 74.7 66.7 61.9 47.5 25.9 Call of Duty Modern Warfare 2019 142.5 93.8 81 54.3 34 17.5 GRID 2019 93 72.4 66.3 51.4 46.6 21.2 Ghost Recon Breakpoint 75 65 59 45 32 16 The Division 2 114 86 68 50 34 17 Dirt Rally 2.0 203 128 101 64 47.2 Hitman 2 66.3 63.2 57.5 55.9 44.8 24.3 Shadow of the Tomb Raider 86 76 71 65 43 21 Far Cry 5 143 87 79 75 26 X-Plane 11.11 110 97 81 65 Final Fantasy XV Benchmark 149 79.1 59.5 43.8 25.9 Rise of the Tomb Raider 195 139 96.7 80.8 34 Dota 2 Reborn 144 131 126 118 75 The Witcher 3 270 179 100 53 35 GTA V 155 150 111.8 58.5 49.4 65 < 30 fps < 60 fps < 120 fps ≥ 120 fps 13 12 1 20 5 6 19 1 14 10 14 1 19 3 3
v1.28
log 15. 00:58:10
#0 ran 0s before starting gpusingle class +0s ... 0s
#1 checking url part for id 9860 +0s ... 0s
#2 checking url part for id 10227 +0s ... 0s
#3 checking url part for id 9884 +0s ... 0s
#4 redirected to Ajax server, took 1731628688s time from redirect:1 +0s ... 0s
#5 did not recreate cache, as it is less than 5 days old! Created at Wed, 13 Nov 2024 05:16:40 +0100 +0s ... 0s
#6 composed specs +0.005s ... 0.006s
#7 did output specs +0s ... 0.006s
#8 start showIntegratedCPUs +0s ... 0.006s
#9 getting avg benchmarks for device 9860 +0.012s ... 0.017s
#10 got single benchmarks 9860 +0.001s ... 0.018s
#11 getting avg benchmarks for device 10227 +0.001s ... 0.019s
#12 got single benchmarks 10227 +0.004s ... 0.023s
#13 getting avg benchmarks for device 9884 +0.004s ... 0.027s
#14 got single benchmarks 9884 +0.006s ... 0.033s
#15 got avg benchmarks for devices +0s ... 0.033s
#16 min, max, avg, median took s +0.052s ... 0.084s
#17 before gaming benchmark output +0s ... 0.084s
#18 Got 1111 rows for game benchmarks. +0.055s ... 0.139s
#19 composed SQL query for gamebenchmarks +0s ... 0.139s
#20 got data and put it in $dataArray +0.008s ... 0.147s
#21 benchmarks composed for output. +0.049s ... 0.195s
#22 calculated avg scores. +0s ... 0.195s
#23 return log +0.002s ... 0.198s
Teilen Sie diesen Artikel, um uns zu unterstützen. Jeder Link hilft!
Autor: Klaus Hinum, 8.09.2017 (Update: 1.07.2023)
 Deutsch
 English
 Español
 Français
 Italiano
 Nederlands
 Polski
 Português
 Русский
 Türkçe
 Svenska
 Chinese
 Magyar