NVIDIA Quadro RTX 5000 (Laptop) vs NVIDIA GeForce RTX 2080 Mobile vs NVIDIA GeForce RTX 2060 Mobile
NVIDIA Quadro RTX 5000 (Laptop) ► remove from comparison
Die Nvidia Quadro RTX 5000 für Laptops ist eine professionelle Grafikkarte für große und schwere Notebooks. Sie basiert wie die Consumer GeForce RTX 2080 auf den TU104 Chip, bietet jedoch mit 3072 Shader 128 mehr als diese. Im Vergleich zur Desktop RTX 5000, wird die mobile deutlich geringer getaktet. Weiters gibt es verschiedene Versionen mit unterschiedlichen Taktraten und TDPs. Neben den deutlich niedriger getakteten Max-Q Varianten, ist die normale Max-P in 110 W (1035 - 1545 MHz) und 150 W (1350 - 1770 MHz) verfügbar.
Variante TGP (W) Base (MHz) Boost (MHz) Quadro RTX 5000 Desktop 230 1620 1815 Quadro RTX 5000 Mobile 150 1350 1770 Quadro RTX 5000 Mobile 110 1035 1545 Quadro RTX 5000 Max-Q 90 930 1455 Quadro RTX 5000 Max-Q 85 765 1395 Quadro RTX 5000 Max-Q 80 600 1350
Die Quadro-Grafikkarten bieten zertifizierte Treiber , welche auf Stabiltität und Performance bei professionellen Anwendungen (CAD-, DCC-, Medizin-, Prospektions-, Visualisierungsanwendungen) optimiert sind. Dadurch ist die Performance im Vergleich zu den Consumergrafikkarten mit gleichem Chip in diesen Bereichen deutlich besser.
Features
Der TU104-Chip wird in 12nm gefertigt und bietet eine Reihe neuer Features, wie DLSS (Deep Learning Super Sampling) und Real Time Ray Tracing. Dadurch lassen sich vor allem Beleuchtungseffekte sehr viel realistischer darstellen. Weiterhin gibt es Support für DisplayPort 1.4 (ready), HDMI 2.0b, HDR, Simultaneous Multi-Projection (SMP) sowie H.265 Video De- und Encoding (PlayReady 3.0).
Performance
Je nach Anwendung sollte die Performance der Quadro RTX 5000 knapp oberhalb einer GeForce RTX 2080 liegen. Durch den größeren VRAM und die optimierten Treiber, gibt es bei professionellen Applikationen auch teilweise größere Geschwindigkeitsvorteile. Dadurch sollte die RTX 5000 aktuell die schnellste Notebookgrafikkarte sein (Mitte 2019).
Durch den hohen Stromverbrauch, eignet sich die Quadro RTX5000 nur für große und schwere Notebooks. Die langsamere Max-Q Version ist für dünnere Notebooks gedacht.
NVIDIA GeForce RTX 2080 Mobile ► remove from comparison
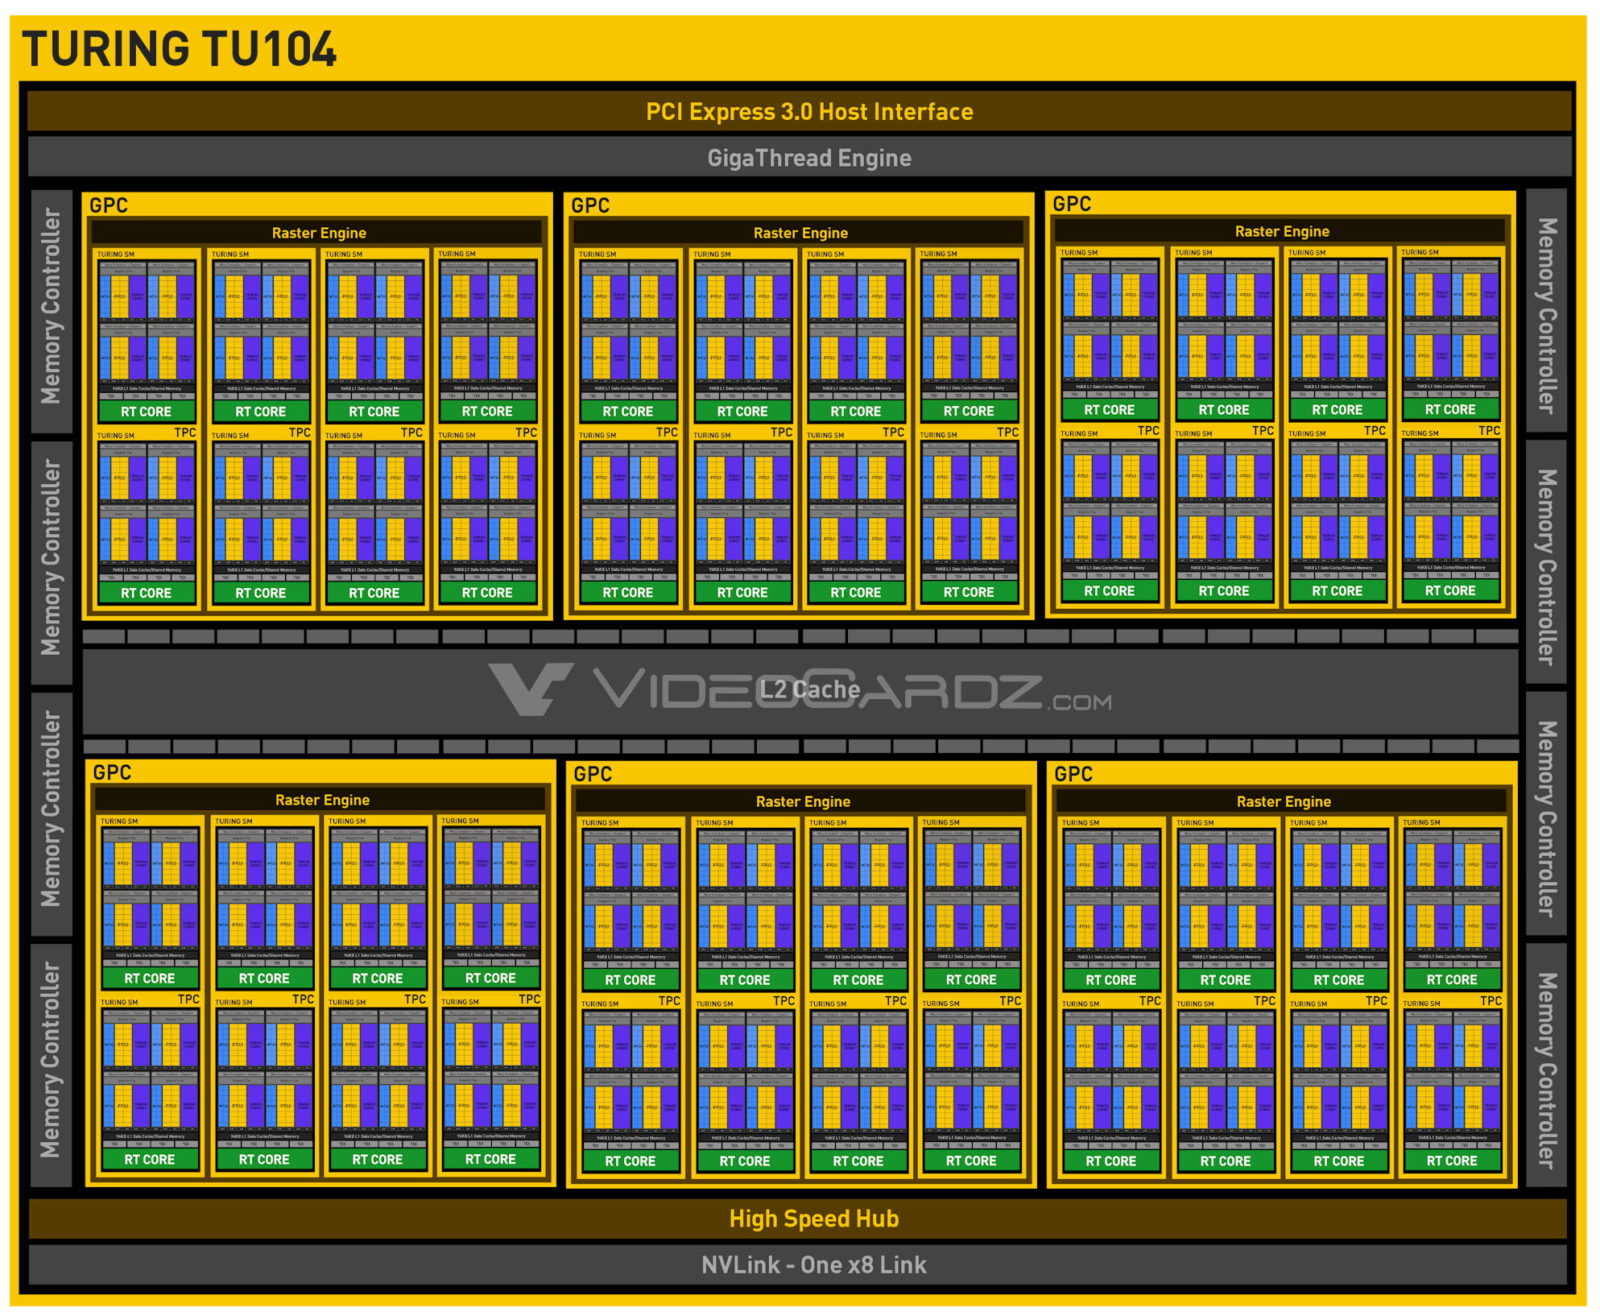
Die Nvidia GeForce RTX 2080 für Laptops ist Anfang 2019 die schnellste Grafikkarte für Notebooks. Sie basiert auf die Desktop GeForce RTX 2080 jedoch bei deutlich reduzierten Taktraten der Kerne (-7% Boost, -9% Base). Die GPU verfügt über die 2.944 Shadereinheiten, sowie 8 GB GDDR6-Speicher an einem 256-Bit-Interface (14 GHz, 448 GB/s, wie im Desktop).
Features
Der TU104-Chip wird in 12nm gefertigt und bietet eine Reihe neuer Features, wie DLSS (Deep Learning Super Sampling) und Real Time Ray Tracing. Dadurch lassen sich vor allem Beleuchtungseffekte sehr viel realistischer darstellen. Weiterhin gibt es Support für DisplayPort 1.4 (ready), HDMI 2.0b, HDR, Simultaneous Multi-Projection (SMP) sowie H.265 Video De- und Encoding (PlayReady 3.0).
Performance
Die Performance der mobilen GeForce RTX 2080 sollte etwas unterhalb der Desktop RTX2080 und damit auch GTX 1080 Ti liegen. Die alte mobile GTX 1080 wird jedoch deutlich geschlagen. Damit ordnet sich die RTX 2080 im absoluten High-End-Segment ein und kann die meisten Spiele des Jahres 2018 in hohen Einstellungen und 4K-Auflösung flüssig darstellen.
Der Stromverbrauch wurde im Vergleich zur Desktop-Version von 215 auf 150 Watt TDP reduziert. Trotzdem eignet sich die RTX 2080 nur für große und schwere Notebooks. Die sparsamere und langsamere Max-Q Version mit 80 bzw 90 Watt TDP ist für dünnere Notebooks gedacht.
NVIDIA GeForce RTX 2060 Mobile ► remove from comparison
Die Nvidia GeForce RTX 2060 für Laptops ist eine mobile Gaming-Grafikkarte der Oberklasse. Sie basiert auf die Desktop RTX 2060 bei reduzierten Kerntaktraten (-30%) und TDP (80 - 90 versus 160 Watt).
In 2020 gab es eine leicht geänderte Version (Refresh ) mit gleichem Namen. Diese basiert auf den TU106B Chip, höheren Taktraten (1005 - 1560 MHz), höherem TGP (bis 115 Watt) aber verringerten Speichertaktraten von 11Gbps.
Der verwendete Turing Chip wird in 12nm gefertigt und bietet eine Reihe neuer Features, wie DLSS (Deep Learning Super Sampling) und Real Time Ray Tracing. Dadurch lassen sich vor allem Beleuchtungseffekte sehr viel realistischer darstellen. Weiterhin gibt es Support für DisplayPort 1.4 (ready), HDMI 2.0b, HDR, Simultaneous Multi-Projection (SMP) sowie H.265 Video De- und Encoding (PlayReady 3.0).
Performance
Die Performance der mobilen GeForce RTX 2060 liegt in unseren Spieletests im Schnitt auf dem Niveau der alten Desktop GeForce GTX 1070 und deutlich hinter der Desktop RTX 2060 . Die mobile GTX 1660 Ti kann nur knapp abgehängt werden, bietet jedoch auch keine Raytracing-Features. Dadurch eignet sie sich am besten für anspruchsvolles Spielen in Full HD (1080p) in hohen bis sehr hohen Detailstufe (siehe detaillierte Notebook-Spiele-Tests unten). Da die RTX-Features sehr viel Leistung kosten, sind diese also nicht immer gut nutzbar bei der RTX 2060.
Der Stromverbrauch ist mit 80 - 90 Watt TGP (Graphics Subsystem Power, komplette Grafikkarte) definiert und dadurch auf dem Niveau der stärkeren RTX 2070 Max-Q und RTX 2080 Max-Q. In unseren Notebooktests positioniert sich die Leistungsaufnahme des durchschnittlichen RTX 2060 Notebooks nur knapp oberhalb der mobilen GTX 1660 Ti in The Witcher 3. Wie zu erwarten sind die Max-Q Modelle der RTX 2070 und 2080 ebenfalls vergleichbar (wenige Prozentpunkte höher in unseren Tests).
NVIDIA Quadro RTX 5000 (Laptop) NVIDIA GeForce RTX 2080 Mobile NVIDIA GeForce RTX 2060 Mobile GeForce RTX 2000 Serie Codename N19E-Q5 N18E-G3 TU104 N18E-G1 TU106 Architektur Turing Turing Turing Pipelines 3072 - unified 2944 - unified 1920 - unified Kerntakt 1035 / 1350 - 1545 / 1770 (Boost) MHz 1380 - 1590 (Boost) MHz 960 - 1200 (Boost) MHz Speichertakt 14000 MHz 14000 MHz 14000 MHz Speicherbandbreite 256 Bit 256 Bit 192 Bit Speichertyp GDDR6 GDDR6 GDDR6 Max. Speichergröße 16 GB 8 GB 6 GB Shared Memory nein nein nein API DirectX 12_1, OpenGL 4.6 DirectX 12_1, OpenGL 4.6 DirectX 12_1, OpenGL 4.6 Stromverbrauch 110 / 150 Watt 150 Watt 80-90 Watt Transistors 13.6 Billion 13.6 Billion Herstellungsprozess 12 nm 12 nm 12 nm Features NVLink, DLSS, Raytraycing, VR Ready, G-SYNC, Vulkan, Multi Monitor NVLink, DLSS, Raytraycing, VR Ready, G-SYNC, Vulkan, Multi Monitor, 650 Watt system power recommended DLSS, Raytraycing, VR Ready, G-SYNC, Vulkan, Multi Monitor Notebookgröße groß (17" z.B.) groß (17" z.B.) groß (17" z.B.) Erscheinungsdatum 27.05.2019 06.01.2019 06.01.2019
Benchmarks Performance Rating - 3DMark 11 + Fire Strike + Time Spy - Quadro RTX 5000 (Laptop)
10.2 pt (31%)
...
NVIDIA Quadro RTX 5000 (Laptop)
...
max:
Performance Rating - 3DMark 11 + Fire Strike + Time Spy - GeForce RTX 2080 Mobile
11.3 pt (34%)
...
NVIDIA GeForce RTX 2080 Mobile
...
max:
Performance Rating - 3DMark 11 + Fire Strike + Time Spy - GeForce RTX 2060 Mobile
7.2 pt (22%)
...
NVIDIA GeForce RTX 2060 Mobile
...
max:
3DMark - 3DMark Time Spy Score
min: 8246 avg: 9013 median: 9012.5 (26%) max: 9779 Points
GPU TDP ? TDP 110 W 100% 84%
min: 8501 avg: 9604 median: 9617 (28%) max: 10704 Points
GPU TDP ? TDP 110 W 100% 86%
min: 5679 avg: 6254 median: 6192 (18%) max: 6926 Points
GPU TDP ? TDP 110 W 87% 100%
3DMark - 3DMark Time Spy Graphics
min: 8708 avg: 9332 median: 9332 (25%) max: 9956 Points
GPU TDP ? TDP 110 W 100% 87%
min: 9411 avg: 10046 median: 9854 (26%) max: 10992 Points
GPU TDP ? TDP 110 W 100% 87%
min: 5660 avg: 6206 median: 6141 (16%) max: 6910 Points
GPU TDP ? TDP 110 W 84% 100%
3DMark - 3DMark Ice Storm Unlimited Graphics
501167 Points (51%)
min: 428856 avg: 464228 median: 458810 (46%) max: 510435 Points
min: 287714 avg: 402584 median: 411721 (42%) max: 439590 Points
3DMark - 3DMark Ice Storm Extreme Graphics
397321 Points (49%)
min: 164011 avg: 262640 median: 262640 (33%) max: 361269 Points
min: 73968 avg: 207813 median: 208300 (26%) max: 321075 Points
3DMark - 3DMark Cloud Gate Score
min: 34501 avg: 39399 median: 39398.5 (42%) max: 44296 Points
GPU TDP ? TDP 110 W 100% 78%
min: 27465 avg: 46374 median: 44306.5 (47%) max: 60073 Points
GPU TDP ? TDP 110 W 100% 75%
min: 25480 avg: 35169 median: 36017.5 (39%) max: 43412 Points
GPU TDP ? TDP 110 W 100% 89%
3DMark - 3DMark Cloud Gate Graphics
min: 100792 avg: 117274 median: 117274 (31%) max: 133756 Points
GPU TDP ? TDP 110 W 100% 75%
min: 72806 avg: 136271 median: 139346 (37%) max: 168006 Points
GPU TDP ? TDP 110 W 100% 74%
min: 55324 avg: 93235 median: 99178.5 (26%) max: 116593 Points
GPU TDP ? TDP 110 W 100% 94%
3DMark - 3DMark Fire Strike Standard Score
min: 17512 avg: 18943 median: 18943 (33%) max: 20374 Points
GPU TDP ? TDP 110 W 100% 86%
min: 18856 avg: 20754 median: 20746 (37%) max: 23195 Points
GPU TDP ? TDP 110 W 100% 84%
min: 13566 avg: 14686 median: 14690 (26%) max: 16465 Points
GPU TDP ? TDP 110 W 94% 100%
3DMark - 3DMark Fire Strike Standard Graphics
min: 21715 avg: 23035 median: 23034.5 (26%) max: 24354 Points
GPU TDP ? TDP 110 W 100% 89%
min: 22504 avg: 25211 median: 25436 (29%) max: 27319 Points
GPU TDP ? TDP 110 W 100% 86%
min: 14768 avg: 16301 median: 16331 (18%) max: 18358 Points
GPU TDP ? TDP 110 W 87% 100%
3DMark - 3DMark Ice Storm Graphics
390293 Points (46%)
min: 164755 avg: 339226 median: 407069 (48%) max: 445854 Points
min: 76950 avg: 267101 median: 354573 (41%) max: 413361 Points
3DMark - 3DMark Night Raid
28746 Points (27%)
3DMark - 3DMark Night Raid Graphics Score
44905 Points (17%)
3DMark 11 - 3DM11 Performance Score
min: 19301 avg: 21964 median: 21068.5 (29%) max: 26416 Points
GPU TDP ? TDP 110 W 100% 92%
min: 20224 avg: 26032 median: 25504 (35%) max: 29759 Points
GPU TDP ? TDP 110 W 100% 80%
min: 15612 avg: 18064 median: 18110 (25%) max: 20404 Points
GPU TDP ? TDP 110 W 100% 99%
3DMark 11 - 3DM11 Performance GPU
min: 18233 avg: 25897 median: 24620 (21%) max: 32999 Points
GPU TDP ? TDP 110 W 100% 87%
min: 31826 avg: 35286 median: 34897 (30%) max: 38809 Points
GPU TDP ? TDP 110 W 100% 70%
min: 19143 avg: 21459 median: 21261.5 (18%) max: 24662 Points
GPU TDP ? TDP 110 W 100% 93%
3DMark Vantage 3DM Vant. Perf. total + NVIDIA GeForce RTX 2080 Mobile 3DMark Vantage - 3DM Vant. Perf. total
68525 Points (20%)
3DM Vant. Perf. total + NVIDIA GeForce RTX 2060 Mobile
57644 Points (17%)
3DM Vant. Perf. GPU no PhysX + NVIDIA GeForce RTX 2080 Mobile 3DMark Vantage - 3DM Vant. Perf. GPU no PhysX
74946 Points (41%)
3DM Vant. Perf. GPU no PhysX + NVIDIA GeForce RTX 2060 Mobile
58792 Points (32%)
3DMark 06 3DMark 06 - Standard 1280x1024 + NVIDIA Quadro RTX 5000 (Laptop)
45180 Points (59%)
3DMark 06 - Standard 1280x1024 + NVIDIA GeForce RTX 2080 Mobile
min: 35591 avg: 41853 median: 41995 (55%) max: 47829 Points
3DMark 06 - Standard 1280x1024 + NVIDIA GeForce RTX 2060 Mobile
min: 33034 avg: 38285 median: 38509 (50%) max: 43414 Points
Unigine Valley 1.0 - Unigine Valley 1.0 DX
125.5 fps (39%)
Unigine Heaven 3.0 - Unigine Heaven 3.0 DX 11
302.1 fps (100%)
Unigine Heaven 3.0 - Unigine Heaven 3.0 OpenGL
225.3 fps (100%)
Unigine Heaven 2.1 - Heaven 2.1 high
532 fps (100%)
SPECviewperf 12 specvp12 sw-03 + NVIDIA Quadro RTX 5000 (Laptop) SPECviewperf 12 - specvp12 sw-03
min: 120 avg: 156.7 median: 120 (30%) max: 230.1 fps
specvp12 sw-03 + NVIDIA GeForce RTX 2080 Mobile
65.5 fps (16%)
specvp12 sw-03 + NVIDIA GeForce RTX 2060 Mobile
48.7 fps (12%)
specvp12 snx-02 + NVIDIA Quadro RTX 5000 (Laptop) SPECviewperf 12 - specvp12 snx-02
min: 145 avg: 184 median: 149 (22%) max: 258.1 fps
specvp12 snx-02 + NVIDIA GeForce RTX 2080 Mobile
11.8 fps (2%)
specvp12 snx-02 + NVIDIA GeForce RTX 2060 Mobile
8.1 fps (1%)
specvp12 showcase-01 + NVIDIA Quadro RTX 5000 (Laptop) SPECviewperf 12 - specvp12 showcase-01
min: 93 avg: 104.3 median: 93.4 (20%) max: 126.4 fps
specvp12 showcase-01 + NVIDIA GeForce RTX 2080 Mobile
122.4 fps (27%)
specvp12 showcase-01 + NVIDIA GeForce RTX 2060 Mobile
75.7 fps (16%)
specvp12 mediacal-01 + NVIDIA Quadro RTX 5000 (Laptop) SPECviewperf 12 - specvp12 mediacal-01
109.3 fps (28%)
specvp12 mediacal-01 + NVIDIA GeForce RTX 2080 Mobile
37.7 fps (10%)
specvp12 mediacal-01 + NVIDIA GeForce RTX 2060 Mobile
33.3 fps (9%)
specvp12 maya-04 + NVIDIA Quadro RTX 5000 (Laptop) SPECviewperf 12 - specvp12 maya-04
min: 90.2 avg: 121.4 median: 95.1 (26%) max: 179 fps
specvp12 maya-04 + NVIDIA GeForce RTX 2080 Mobile
160.6 fps (44%)
specvp12 maya-04 + NVIDIA GeForce RTX 2060 Mobile
75 fps (20%)
specvp12 energy-01 + NVIDIA Quadro RTX 5000 (Laptop) SPECviewperf 12 - specvp12 energy-01
26 fps (23%)
specvp12 energy-01 + NVIDIA GeForce RTX 2080 Mobile
11.6 fps (10%)
specvp12 energy-01 + NVIDIA GeForce RTX 2060 Mobile
13.4 fps (12%)
specvp12 creo-01 + NVIDIA Quadro RTX 5000 (Laptop) SPECviewperf 12 - specvp12 creo-01
min: 127 avg: 144.4 median: 134 (54%) max: 172.1 fps
specvp12 creo-01 + NVIDIA GeForce RTX 2080 Mobile
57.5 fps (23%)
specvp12 creo-01 + NVIDIA GeForce RTX 2060 Mobile
42.3 fps (17%)
specvp12 catia-04 + NVIDIA Quadro RTX 5000 (Laptop) SPECviewperf 12 - specvp12 catia-04
min: 125 avg: 159 median: 132 (22%) max: 220 fps
specvp12 catia-04 + NVIDIA GeForce RTX 2080 Mobile
99.8 fps (16%)
specvp12 catia-04 + NVIDIA GeForce RTX 2060 Mobile
65.7 fps (11%)
specvp12 3dsmax-05 + NVIDIA Quadro RTX 5000 (Laptop) SPECviewperf 12 - specvp12 3dsmax-05
min: 172 avg: 193.9 median: 174 (30%) max: 235.8 fps
specvp12 3dsmax-05 + NVIDIA GeForce RTX 2080 Mobile
207.2 fps (36%)
specvp12 3dsmax-05 + NVIDIA GeForce RTX 2060 Mobile
121 fps (21%)
SPECviewperf 13 specvp13 sw-04 + NVIDIA Quadro RTX 5000 (Laptop) SPECviewperf 13 - specvp13 sw-04
min: 118.6 avg: 144.1 median: 127 (34%) max: 203.8 fps
GPU TDP ? TDP 110 W 100% 78%
specvp13 sw-04 + NVIDIA GeForce RTX 2080 Mobile
min: 93.9 avg: 94.1 median: 94.1 (25%) max: 94.2 fps
GPU TDP ? TDP 110 W 100% 92%
specvp13 sw-04 + NVIDIA GeForce RTX 2060 Mobile
min: 71.7 avg: 74.6 median: 74.6 (20%) max: 77.4 fps
GPU TDP ? TDP 110 W 96% 100%
specvp13 snx-03 + NVIDIA Quadro RTX 5000 (Laptop) SPECviewperf 13 - specvp13 snx-03
min: 226.4 avg: 307.2 median: 268.5 (30%) max: 465.3 fps
GPU TDP ? TDP 110 W 100% 68%
specvp13 snx-03 + NVIDIA GeForce RTX 2080 Mobile
min: 21.16 avg: 21.4 median: 21.4 (2%) max: 21.66 fps
GPU TDP ? TDP 110 W 92% 100%
specvp13 snx-03 + NVIDIA GeForce RTX 2060 Mobile
min: 14.35 avg: 14.7 median: 14.7 (2%) max: 15.1 fps
GPU TDP ? TDP 110 W 68% 100%
specvp13 showcase-02 + NVIDIA Quadro RTX 5000 (Laptop) SPECviewperf 13 - specvp13 showcase-02
min: 92.4 avg: 104.7 median: 99.7 (22%) max: 127.1 fps
GPU TDP ? TDP 110 W 99% 100%
specvp13 showcase-02 + NVIDIA GeForce RTX 2080 Mobile
min: 116.4 avg: 119 median: 119 (26%) max: 121.6 fps
GPU TDP ? TDP 110 W 100% 95%
specvp13 showcase-02 + NVIDIA GeForce RTX 2060 Mobile
min: 75.5 avg: 76.8 median: 76.8 (17%) max: 78 fps
GPU TDP ? TDP 110 W 96% 100%
specvp13 medical-02 + NVIDIA Quadro RTX 5000 (Laptop) SPECviewperf 13 - specvp13 medical-02
min: 98.8 avg: 116.1 median: 116.1 (24%) max: 133.4 fps
GPU TDP ? TDP 110 W 100% 74%
specvp13 medical-02 + NVIDIA GeForce RTX 2080 Mobile
min: 61.8 avg: 63.5 median: 63.5 (13%) max: 65.2 fps
GPU TDP ? TDP 110 W 88% 100%
specvp13 medical-02 + NVIDIA GeForce RTX 2060 Mobile
min: 41.46 avg: 42.2 median: 42.1 (9%) max: 42.83 fps
GPU TDP ? TDP 110 W 70% 100%
specvp13 maya-05 + NVIDIA Quadro RTX 5000 (Laptop) SPECviewperf 13 - specvp13 maya-05
min: 182.8 avg: 234.9 median: 208 (24%) max: 340.8 fps
GPU TDP ? TDP 110 W 100% 72%
specvp13 maya-05 + NVIDIA GeForce RTX 2080 Mobile
min: 294.9 avg: 302 median: 302 (34%) max: 309 fps
GPU TDP ? TDP 110 W 100% 67%
specvp13 maya-05 + NVIDIA GeForce RTX 2060 Mobile
min: 164.2 avg: 190.7 median: 190.7 (22%) max: 217.1 fps
GPU TDP ? TDP 110 W 100% 73%
specvp13 energy-02 + NVIDIA Quadro RTX 5000 (Laptop) SPECviewperf 13 - specvp13 energy-02
min: 46.13 avg: 51.7 median: 51.7 (17%) max: 57.3 fps
GPU TDP ? TDP 110 W 100% 81%
specvp13 energy-02 + NVIDIA GeForce RTX 2080 Mobile
min: 21.71 avg: 22.1 median: 22.1 (7%) max: 22.55 fps
GPU TDP ? TDP 110 W 73% 100%
specvp13 energy-02 + NVIDIA GeForce RTX 2060 Mobile
min: 15.04 avg: 17.5 median: 17.4 (6%) max: 19.85 fps
GPU TDP ? TDP 110 W 59% 100%
specvp13 creo-02 + NVIDIA Quadro RTX 5000 (Laptop) SPECviewperf 13 - specvp13 creo-02
min: 185.4 avg: 231.3 median: 210 (31%) max: 319.8 fps
GPU TDP ? TDP 110 W 100% 75%
specvp13 creo-02 + NVIDIA GeForce RTX 2080 Mobile
min: 204.3 avg: 207.8 median: 207.8 (30%) max: 211.3 fps
GPU TDP ? TDP 110 W 100% 80%
specvp13 creo-02 + NVIDIA GeForce RTX 2060 Mobile
min: 104.9 avg: 128 median: 128 (19%) max: 151 fps
GPU TDP ? TDP 110 W 100% 92%
specvp13 catia-05 + NVIDIA Quadro RTX 5000 (Laptop) SPECviewperf 13 - specvp13 catia-05
min: 183.8 avg: 238.9 median: 216.5 (24%) max: 338.9 fps
GPU TDP ? TDP 110 W 100% 71%
specvp13 catia-05 + NVIDIA GeForce RTX 2080 Mobile
min: 146.1 avg: 148.5 median: 148.5 (17%) max: 150.9 fps
GPU TDP ? TDP 110 W 100% 86%
specvp13 catia-05 + NVIDIA GeForce RTX 2060 Mobile
min: 56.7 avg: 77.3 median: 77.3 (9%) max: 97.8 fps
GPU TDP ? TDP 110 W 95% 100%
specvp13 3dsmax-06 + NVIDIA Quadro RTX 5000 (Laptop) SPECviewperf 13 - specvp13 3dsmax-06
min: 168.7 avg: 187.5 median: 174.5 (30%) max: 232.2 fps
GPU TDP ? TDP 110 W 100% 87%
specvp13 3dsmax-06 + NVIDIA GeForce RTX 2080 Mobile
min: 198.9 avg: 201 median: 201 (35%) max: 203 fps
GPU TDP ? TDP 110 W 100% 86%
specvp13 3dsmax-06 + NVIDIA GeForce RTX 2060 Mobile
min: 135.5 avg: 142.8 median: 142.8 (25%) max: 150.1 fps
GPU TDP ? TDP 110 W 100% 93%
Cinebench R10 Cinebench R10 Shading (32bit) + NVIDIA Quadro RTX 5000 (Laptop) Cinebench R10 - Cinebench R10 Shading (32bit)
19419 Points (14%)
Cinebench R10 Shading (32bit) + NVIDIA GeForce RTX 2080 Mobile
min: 6820 avg: 11436 median: 11602.5 (8%) max: 15720 Points
Cinebench R10 Shading (32bit) + NVIDIA GeForce RTX 2060 Mobile
min: 4898 avg: 9191 median: 9210 (7%) max: 13444 Points
Cinebench R11.5 Cinebench R11.5 OpenGL 64 Bit + NVIDIA GeForce RTX 2080 Mobile Cinebench R11.5 - Cinebench R11.5 OpenGL 64 Bit
min: 82 avg: 88.2 median: 85.8 (28%) max: 99.1 fps
Cinebench R11.5 OpenGL 64 Bit + NVIDIA GeForce RTX 2060 Mobile
min: 69.6 avg: 76.5 median: 76.6 (25%) max: 84.1 fps
Cinebench R15 Cinebench R15 OpenGL 64 Bit + NVIDIA Quadro RTX 5000 (Laptop) Cinebench R15 - Cinebench R15 OpenGL 64 Bit
min: 196 avg: 215.6 median: 209.5 (12%) max: 247.5 fps
GPU TDP ? TDP 110 W 100% 91%
Cinebench R15 OpenGL 64 Bit + NVIDIA GeForce RTX 2080 Mobile
min: 98.1 avg: 138.5 median: 144.9 (8%) max: 174.7 fps
GPU TDP ? TDP 110 W 77% 100%
Cinebench R15 OpenGL 64 Bit + NVIDIA GeForce RTX 2060 Mobile
min: 89.3 avg: 119.5 median: 120.4 (7%) max: 146.8 fps
GPU TDP ? TDP 110 W 65% 100%
Cinebench R15 OpenGL Ref. Match 64 Bit + NVIDIA Quadro RTX 5000 (Laptop) Cinebench R15 - Cinebench R15 OpenGL Ref. Match 64 Bit
99.6 % (100%)
GPU TDP ? TDP 110 W 100% 100%
Cinebench R15 OpenGL Ref. Match 64 Bit + NVIDIA GeForce RTX 2080 Mobile
99.6 % (100%)
GPU TDP ? TDP 110 W 100% 100%
Cinebench R15 OpenGL Ref. Match 64 Bit + NVIDIA GeForce RTX 2060 Mobile
99.6 % (100%)
GPU TDP ? TDP 110 W 100% 100%
GFXBench - GFXBench 5.0 Aztec Ruins High Tier Offscreen
242.3 fps (44%)
GFXBench - GFXBench 5.0 Aztec Ruins Normal Tier Offscreen
584 fps (43%)
GFXBench - GFXBench Car Chase Offscreen
435.7 fps (49%)
385 fps (43%)
274 fps (31%)
GFXBench 3.1 - GFXBench Manhattan ES 3.1 Offscreen
602 fps (13%)
GFXBench 3.0 - GFXBench 3.0 Manhattan Offscreen
626 fps (37%)
GFXBench (DX / GLBenchmark) 2.7 GFXBench T-Rex HD Offscreen C24Z16 + NVIDIA Quadro RTX 5000 (Laptop) GFXBench (DX / GLBenchmark) 2.7 - GFXBench T-Rex HD Offscreen C24Z16
1960 fps (16%)
Basemark GPU 1.2 - Basemark GPU 1.2 Vulkan Official Medium Offscreen 1080
1195 fps (8%)
Basemark GPU 1.2 - Basemark GPU 1.2 Vulkan Official High Offscreen 2160
413 fps (94%)
LuxMark v2.0 64Bit - LuxMark v2.0 Room GPU
3408 Samples/s (15%)
3371 Samples/s (15%)
2461 Samples/s (11%)
LuxMark v2.0 64Bit - LuxMark v2.0 Sala GPU
7688 Samples/s (13%)
7527 Samples/s (13%)
5054 Samples/s (9%)
ComputeMark v2.1 - ComputeMark v2.1 Result
19614 Points (21%)
18239 Points (20%)
min: 11722 avg: 12126 median: 12241 (13%) max: 12415 Points
Power Consumption - Furmark Stress Test Power Consumption - external Monitor *
207 Watt (29%)
min: 111 avg: 121.3 median: 120 (17%) max: 134 Watt
Power Consumption - The Witcher 3 Power Consumption - external Monitor *
205.3 Watt (29%)
min: 99 avg: 133.8 median: 136.9 (19%) max: 164 Watt
Power Consumption - Witcher 3 Power Consumption *
min: 181 avg: 201 median: 201 (44%) max: 221 Watt
GPU TDP ? TDP 110 W 100% 117%
min: 207 avg: 257.1 median: 254.1 (56%) max: 339.5 Watt
GPU TDP ? TDP 110 W 100% 137%
min: 119 avg: 146.4 median: 145 (32%) max: 185.4 Watt
GPU TDP ? TDP 110 W 101% 100%
Power Consumption - Witcher 3 ultra Power Efficiency
min: 0.4973 avg: 0.5 median: 0.5 (45%) max: 0.4994 fps per Watt
GPU TDP ? TDP 110 W 100% 100%
min: 0.2978 avg: 0.4 median: 0.4 (33%) max: 0.4449 fps per Watt
GPU TDP ? TDP 110 W 77% 100%
min: 0.3554 avg: 0.4 median: 0.4 (37%) max: 0.51 fps per Watt
GPU TDP ? TDP 110 W 82% 100%
Power Consumption - Witcher 3 ultra Power Efficiency - external Monitor
0.5 fps per Watt (39%)
min: 0.3085 avg: 0.5 median: 0.5 (41%) max: 0.611 fps per Watt
Emissions Witcher 3 Fan Noise + NVIDIA Quadro RTX 5000 (Laptop) Emissions - Witcher 3 Fan Noise
min: 39 avg: 41.8 median: 41.8 (67%) max: 44.6 dB(A)
GPU TDP ? TDP 110 W 100% 87%
Witcher 3 Fan Noise + NVIDIA GeForce RTX 2080 Mobile
min: 37.2 avg: 51.8 median: 53 (85%) max: 60 dB(A)
GPU TDP ? TDP 110 W 100% 76%
Witcher 3 Fan Noise + NVIDIA GeForce RTX 2060 Mobile
min: 39.5 avg: 48.9 median: 48.7 (78%) max: 59 dB(A)
GPU TDP ? TDP 110 W 100% 79%
Clock Speed - GPU Clock Witcher 3 ultra
min: 1590 avg: 1700 median: 1725 (68%) max: 1830 MHz
min: 438 avg: 1342 median: 1470 (58%) max: 1710 MHz
Clock Speed - GPU Clock Speed Furmark
min: 493 avg: 1154 median: 1200 (48%) max: 1725 MHz
Average Benchmarks NVIDIA Quadro RTX 5000 (Laptop) → 100% n=37 Average Benchmarks NVIDIA GeForce RTX 2080 Mobile → 89% n=37 Average Benchmarks NVIDIA GeForce RTX 2060 Mobile → 63% n=37
- Bereich der Benchmarkergebnisse für diese Grafikkarte
- Durchschnittliche Benchmarkergebnisse für diese Grafikkarte
* Smaller numbers mean a higher performance
1 This benchmark is not used for the average calculation
Spiele-Benchmarks Die folgenden Benchmarks basieren auf unseren Spieletests mit Testnotebooks. Die Performance dieser Grafikkarte bei den gelisteten Spielen ist abhängig von der verwendeten CPU, Speicherausstattung, Treiber und auch Betriebssystem. Dadurch müssen die untenstehenden Werte nicht repräsentativ sein. Detaillierte Informationen über das verwendete System sehen Sie nach einem Klick auf den fps-Wert.
GeForce RTX 2080 Mobile:
201 [X] MSI GT76 Titan DT 9SG Intel Core i9-9900K 3.6GHz
GeForce RTX 2080 Mobile
min:
174 fps
fps
GeForce RTX 2060 Mobile:
149 [X] MSI GE65 Raider 9SE Intel Core i7-9750H 2.6GHz
GeForce RTX 2060 Mobile
min:
131 fps
fps
GeForce RTX 2080 Mobile:
160 [X] MSI GT76 Titan DT 9SG Intel Core i9-9900K 3.6GHz
GeForce RTX 2080 Mobile
min:
142 fps
fps
GeForce RTX 2060 Mobile:
126 [X] MSI GE65 Raider 9SE Intel Core i7-9750H 2.6GHz
GeForce RTX 2060 Mobile
min:
113 fps
fps
GeForce RTX 2080 Mobile:
101 [X] MSI GT76 Titan DT 9SG Intel Core i9-9900K 3.6GHz
GeForce RTX 2080 Mobile
min:
91 fps
fps
GeForce RTX 2060 Mobile:
71 [X] MSI GE65 Raider 9SE Intel Core i7-9750H 2.6GHz
GeForce RTX 2060 Mobile
min:
60 fps
fps
GeForce RTX 2080 Mobile:
79 [X] MSI GT76 Titan DT 9SG Intel Core i9-9900K 3.6GHz
GeForce RTX 2080 Mobile
min:
70 fps
fps
GeForce RTX 2060 Mobile:
52 [X] MSI GE65 Raider 9SE Intel Core i7-9750H 2.6GHz
GeForce RTX 2060 Mobile
min:
46 fps
fps
GeForce RTX 2080 Mobile:
45 [X] MSI GT76 Titan DT 9SG Intel Core i9-9900K 3.6GHz
GeForce RTX 2080 Mobile
min:
40 fps
fps
GeForce RTX 2060 Mobile:
28 [X] MSI GE65 Raider 9SE Intel Core i7-9750H 2.6GHz
GeForce RTX 2060 Mobile
min:
24 fps
fps
GeForce RTX 2080 Mobile:
148 [X] MSI GT76 Titan DT 9SG Intel Core i9-9900K 3.6GHz
GeForce RTX 2080 Mobile
min:
22.7 fps, P0.1:
26.8 fps, P1:
69.5 fps, max:
291 fps
fps
GeForce RTX 2060 Mobile:
99.3 [X] MSI GE65 Raider 9SE Intel Core i7-9750H 2.6GHz
GeForce RTX 2060 Mobile
min:
15.6 fps, P0.1:
37.5 fps, P1:
52.5 fps, max:
202 fps
fps
GeForce RTX 2080 Mobile:
131 [X] MSI GT76 Titan DT 9SG Intel Core i9-9900K 3.6GHz
GeForce RTX 2080 Mobile
min:
20 fps, P0.1:
27 fps, P1:
65.9 fps, max:
298 fps
fps
GeForce RTX 2060 Mobile:
87.4 [X] MSI GE65 Raider 9SE Intel Core i7-9750H 2.6GHz
GeForce RTX 2060 Mobile
min:
21.1 fps, P0.1:
31.5 fps, P1:
50.7 fps, max:
202 fps
fps
GeForce RTX 2080 Mobile:
100 [X] MSI GT76 Titan DT 9SG Intel Core i9-9900K 3.6GHz
GeForce RTX 2080 Mobile
min:
21.4 fps, P0.1:
25.8 fps, P1:
46.9 fps, max:
249 fps
fps
GeForce RTX 2060 Mobile:
64.8 [X] MSI GE65 Raider 9SE Intel Core i7-9750H 2.6GHz
GeForce RTX 2060 Mobile
min:
27.3 fps, P0.1:
29.4 fps, P1:
42.2 fps, max:
161 fps
fps
GeForce RTX 2080 Mobile:
75.2 [X] MSI GT76 Titan DT 9SG Intel Core i9-9900K 3.6GHz
GeForce RTX 2080 Mobile
min:
19.1 fps, P0.1:
25.3 fps, P1:
33.7 fps, max:
233 fps
fps
GeForce RTX 2060 Mobile:
46.9 [X] MSI GE65 Raider 9SE Intel Core i7-9750H 2.6GHz
GeForce RTX 2060 Mobile
min:
21.5 fps, P0.1:
25.5 fps, P1:
32.3 fps, max:
116 fps
fps
GeForce RTX 2080 Mobile:
44.3 [X] MSI GT76 Titan DT 9SG Intel Core i9-9900K 3.6GHz
GeForce RTX 2080 Mobile
min:
14.8 fps, P0.1:
20.7 fps, P1:
29.5 fps, max:
97.4 fps
fps
GeForce RTX 2060 Mobile:
26.4 [X] MSI GE65 Raider 9SE Intel Core i7-9750H 2.6GHz
GeForce RTX 2060 Mobile
min:
13.6 fps, P0.1:
14.8 fps, P1:
18.5 fps, max:
71.5 fps
fps
GeForce RTX 2080 Mobile:
125 [X] MSI GT76 Titan DT 9SG Intel Core i9-9900K 3.6GHz
GeForce RTX 2080 Mobile
min:
15.8 fps, P0.1:
16.7 fps, P1:
29.6 fps, max:
397 fps
fps
GeForce RTX 2060 Mobile:
102 [X] MSI GE65 Raider 9SE Intel Core i7-9750H 2.6GHz
GeForce RTX 2060 Mobile
min:
18.4 fps, P0.1:
22.3 fps, P1:
42.8 fps, max:
273 fps
fps
GeForce RTX 2080 Mobile:
111 [X] MSI GT76 Titan DT 9SG Intel Core i9-9900K 3.6GHz
GeForce RTX 2080 Mobile
min:
15 fps, P0.1:
15.4 fps, P1:
19.1 fps, max:
361 fps
fps
GeForce RTX 2060 Mobile:
99.9 [X] MSI GE65 Raider 9SE Intel Core i7-9750H 2.6GHz
GeForce RTX 2060 Mobile
min:
21.4 fps, P0.1:
23.7 fps, P1:
30.3 fps, max:
320 fps
fps
GeForce RTX 2080 Mobile:
109 [X] MSI GT76 Titan DT 9SG Intel Core i9-9900K 3.6GHz
GeForce RTX 2080 Mobile
min:
15.3 fps, P0.1:
15.8 fps, P1:
23.1 fps, max:
321 fps
fps
GeForce RTX 2060 Mobile:
90.3 [X] MSI GE65 Raider 9SE Intel Core i7-9750H 2.6GHz
GeForce RTX 2060 Mobile
min:
19.6 fps, P0.1:
21 fps, P1:
25.8 fps, max:
257 fps
fps
GeForce RTX 2080 Mobile:
81.7 [X] MSI GT76 Titan DT 9SG Intel Core i9-9900K 3.6GHz
GeForce RTX 2080 Mobile
min:
13.4 fps, P0.1:
13.8 fps, P1:
16.9 fps, max:
326 fps
fps
GeForce RTX 2060 Mobile:
56.9 [X] MSI GE65 Raider 9SE Intel Core i7-9750H 2.6GHz
GeForce RTX 2060 Mobile
min:
16.6 fps, P0.1:
17.7 fps, P1:
22.3 fps, max:
129 fps
fps
GeForce RTX 2080 Mobile:
163 [X] MSI GT76 Titan DT 9SG Intel Core i9-9900K 3.6GHz
GeForce RTX 2080 Mobile
min:
43.4 fps, P0.1:
58 fps, P1:
86.8 fps, max:
240 fps
fps
GeForce RTX 2060 Mobile:
106 [X] MSI GE65 Raider 9SE Intel Core i7-9750H 2.6GHz
GeForce RTX 2060 Mobile
min:
46.9 fps, P0.1:
52.9 fps, P1:
69 fps, max:
146 fps
fps
GeForce RTX 2080 Mobile:
159 [X] MSI GT76 Titan DT 9SG Intel Core i9-9900K 3.6GHz
GeForce RTX 2080 Mobile
min:
70.3 fps, P0.1:
90.6 fps, P1:
96.8 fps, max:
230 fps
fps
GeForce RTX 2060 Mobile:
95.1 [X] MSI GE65 Raider 9SE Intel Core i7-9750H 2.6GHz
GeForce RTX 2060 Mobile
min:
24.2 fps, P0.1:
28.8 fps, P1:
39.6 fps, max:
139 fps
fps
GeForce RTX 2080 Mobile:
145 [X] MSI GT76 Titan DT 9SG Intel Core i9-9900K 3.6GHz
GeForce RTX 2080 Mobile
min:
31.1 fps, P0.1:
45.2 fps, P1:
85 fps, max:
217 fps
fps
GeForce RTX 2060 Mobile:
93.2 [X] MSI GE65 Raider 9SE Intel Core i7-9750H 2.6GHz
GeForce RTX 2060 Mobile
min:
12.9 fps, P0.1:
50 fps, P1:
65.7 fps, max:
127 fps
fps
GeForce RTX 2060 Mobile:
56.6 [X] MSI GE65 Raider 9SE Intel Core i7-9750H 2.6GHz
GeForce RTX 2060 Mobile
min:
15.6 fps, P0.1:
23.8 fps, P1:
28.5 fps, max:
95.1 fps
fps
GeForce RTX 2060 Mobile:
31.7 [X] MSI GE65 Raider 9SE Intel Core i7-9750H 2.6GHz
GeForce RTX 2060 Mobile
min:
12.8 fps, P0.1:
22.6 fps, P1:
27 fps, max:
43.2 fps
fps
GeForce RTX 2080 Mobile:
142 [X] MSI GT76 Titan DT 9SG Intel Core i9-9900K 3.6GHz
GeForce RTX 2080 Mobile
min:
16.9 fps, P0.1:
17.7 fps, P1:
26.2 fps, max:
297 fps
fps
GeForce RTX 2060 Mobile:
104 [X] MSI GE65 Raider 9SE Intel Core i7-9750H 2.6GHz
GeForce RTX 2060 Mobile
min:
18.7 fps, P0.1:
32.2 fps, P1:
46.6 fps, max:
176 fps
fps
GeForce RTX 2080 Mobile:
130 [X] MSI GT76 Titan DT 9SG Intel Core i9-9900K 3.6GHz
GeForce RTX 2080 Mobile
min:
16.9 fps, P0.1:
18.1 fps, P1:
26.8 fps, max:
257 fps
fps
GeForce RTX 2060 Mobile:
89.8 [X] MSI GE65 Raider 9SE Intel Core i7-9750H 2.6GHz
GeForce RTX 2060 Mobile
min:
32.6 fps, P0.1:
33.4 fps, P1:
45 fps, max:
172 fps
fps
GeForce RTX 2080 Mobile:
113 [X] MSI GT76 Titan DT 9SG Intel Core i9-9900K 3.6GHz
GeForce RTX 2080 Mobile
min:
13.5 fps, P0.1:
16.5 fps, P1:
25.3 fps, max:
242 fps
fps
GeForce RTX 2060 Mobile:
76.6 [X] MSI GE65 Raider 9SE Intel Core i7-9750H 2.6GHz
GeForce RTX 2060 Mobile
min:
9.5 fps, P0.1:
16.4 fps, P1:
45.5 fps, max:
191 fps
fps
GeForce RTX 2080 Mobile:
80.2 [X] MSI GT76 Titan DT 9SG Intel Core i9-9900K 3.6GHz
GeForce RTX 2080 Mobile
min:
10.2 fps, P0.1:
15.6 fps, P1:
20.9 fps, max:
240 fps
fps
GeForce RTX 2060 Mobile:
51.6 [X] MSI GE65 Raider 9SE Intel Core i7-9750H 2.6GHz
GeForce RTX 2060 Mobile
min:
20.5 fps, P0.1:
28.7 fps, P1:
32.8 fps, max:
113 fps
fps
GeForce RTX 2080 Mobile:
45.7 [X] MSI GT76 Titan DT 9SG Intel Core i9-9900K 3.6GHz
GeForce RTX 2080 Mobile
min:
6.06 fps, P0.1:
12.4 fps, P1:
25 fps, max:
162 fps
fps
GeForce RTX 2060 Mobile:
32.8 [X] MSI GE65 Raider 9SE Intel Core i7-9750H 2.6GHz
GeForce RTX 2060 Mobile
min:
4.22 fps, P0.1:
4.78 fps, P1:
8.29 fps, max:
118 fps
fps
GeForce RTX 2080 Mobile:
183 [X] MSI GT76 Titan DT 9SG Intel Core i9-9900K 3.6GHz
GeForce RTX 2080 Mobile
min:
48 fps
fps
GeForce RTX 2060 Mobile:
120 [X] MSI GE65 Raider 9SE Intel Core i7-9750H 2.6GHz
GeForce RTX 2060 Mobile
min:
37 fps
fps
GeForce RTX 2080 Mobile:
165 [X] MSI GT76 Titan DT 9SG Intel Core i9-9900K 3.6GHz
GeForce RTX 2080 Mobile
min:
46 fps
fps
GeForce RTX 2060 Mobile:
105 [X] MSI GE65 Raider 9SE Intel Core i7-9750H 2.6GHz
GeForce RTX 2060 Mobile
min:
34 fps
fps
GeForce RTX 2080 Mobile:
153 [X] MSI GT76 Titan DT 9SG Intel Core i9-9900K 3.6GHz
GeForce RTX 2080 Mobile
min:
41 fps
fps
GeForce RTX 2060 Mobile:
96.8 [X] MSI GE65 Raider 9SE Intel Core i7-9750H 2.6GHz
GeForce RTX 2060 Mobile
min:
29 fps
fps
GeForce RTX 2080 Mobile:
103 [X] MSI GT76 Titan DT 9SG Intel Core i9-9900K 3.6GHz
GeForce RTX 2080 Mobile
min:
33 fps
fps
GeForce RTX 2060 Mobile:
61.8 [X] MSI GE65 Raider 9SE Intel Core i7-9750H 2.6GHz
GeForce RTX 2060 Mobile
min:
19 fps
fps
GeForce RTX 2080 Mobile:
58.8 [X] MSI GT76 Titan DT 9SG Intel Core i9-9900K 3.6GHz
GeForce RTX 2080 Mobile
min:
31 fps
fps
GeForce RTX 2060 Mobile:
34.2 [X] MSI GE65 Raider 9SE Intel Core i7-9750H 2.6GHz
GeForce RTX 2060 Mobile
min:
17 fps
fps
GeForce RTX 2080 Mobile:
94.2 [X] MSI GT76 Titan DT 9SG Intel Core i9-9900K 3.6GHz
GeForce RTX 2080 Mobile
min:
17.9 fps, P0.1:
55.9 fps, P1:
71 fps, max:
157 fps
fps
GeForce RTX 2060 Mobile:
62.3 [X] MSI GE65 Raider 9SE Intel Core i7-9750H 2.6GHz
GeForce RTX 2060 Mobile
min:
16.4 fps, P0.1:
35.9 fps, P1:
46.2 fps, max:
103 fps
fps
GeForce RTX 2080 Mobile:
77.3 [X] MSI GT76 Titan DT 9SG Intel Core i9-9900K 3.6GHz
GeForce RTX 2080 Mobile
min:
21.4 fps, P0.1:
49.9 fps, P1:
61.9 fps, max:
137 fps
fps
GeForce RTX 2060 Mobile:
45.3 51.5 [X] MSI GE65 Raider 9SE Intel Core i7-9750H 2.6GHz
GeForce RTX 2060 Mobile
min:
14.9 fps, P0.1:
31.2 fps, P1:
39.8 fps, max:
92.3 fps
~ 48 fps
GeForce RTX 2080 Mobile:
67.1 [X] MSI GT76 Titan DT 9SG Intel Core i9-9900K 3.6GHz
GeForce RTX 2080 Mobile
min:
19.6 fps, P0.1:
43.1 fps, P1:
54.5 fps, max:
118 fps
fps
GeForce RTX 2060 Mobile:
38.8 43.6 [X] MSI GE65 Raider 9SE Intel Core i7-9750H 2.6GHz
GeForce RTX 2060 Mobile
min:
16.3 fps, P0.1:
24.6 fps, P1:
32.7 fps, max:
75.6 fps
~ 41 fps
GeForce RTX 2080 Mobile:
45.1 [X] MSI GT76 Titan DT 9SG Intel Core i9-9900K 3.6GHz
GeForce RTX 2080 Mobile
min:
21.8 fps, P0.1:
31.7 fps, P1:
36.9 fps, max:
87.5 fps
fps
GeForce RTX 2060 Mobile:
28.1 [X] MSI GE65 Raider 9SE Intel Core i7-9750H 2.6GHz
GeForce RTX 2060 Mobile
min:
16 fps, P0.1:
20 fps, P1:
22.7 fps, max:
55.8 fps
fps
GeForce RTX 2080 Mobile:
21.9 [X] MSI GT76 Titan DT 9SG Intel Core i9-9900K 3.6GHz
GeForce RTX 2080 Mobile
min:
16.4 fps, P0.1:
16.7 fps, P1:
18.4 fps, max:
29.1 fps
fps
GeForce RTX 2060 Mobile:
12.6 [X] MSI GE65 Raider 9SE Intel Core i7-9750H 2.6GHz
GeForce RTX 2060 Mobile
min:
8.96 fps, P0.1:
9.06 fps, P1:
9.96 fps, max:
19.6 fps
fps
GeForce RTX 2080 Mobile:
106 [X] MSI GT76 Titan DT 9SG Intel Core i9-9900K 3.6GHz
GeForce RTX 2080 Mobile
min:
24 fps
fps
GeForce RTX 2060 Mobile:
74 [X] MSI GE65 Raider 9SE Intel Core i7-9750H 2.6GHz
GeForce RTX 2060 Mobile
min:
24 fps
fps
GeForce RTX 2080 Mobile:
88 [X] MSI GT76 Titan DT 9SG Intel Core i9-9900K 3.6GHz
GeForce RTX 2080 Mobile
min:
20 fps
fps
GeForce RTX 2060 Mobile:
54 63 [X] MSI GE65 Raider 9SE Intel Core i7-9750H 2.6GHz
GeForce RTX 2060 Mobile
min:
26 fps
~ 59 fps
GeForce RTX 2080 Mobile:
82 [X] MSI GT76 Titan DT 9SG Intel Core i9-9900K 3.6GHz
GeForce RTX 2080 Mobile
min:
25 fps
fps
GeForce RTX 2060 Mobile:
51 58 [X] MSI GE65 Raider 9SE Intel Core i7-9750H 2.6GHz
GeForce RTX 2060 Mobile
min:
26 fps
~ 55 fps
GeForce RTX 2080 Mobile:
61 [X] MSI GT76 Titan DT 9SG Intel Core i9-9900K 3.6GHz
GeForce RTX 2080 Mobile
min:
31 fps
fps
GeForce RTX 2060 Mobile:
46 [X] MSI GE65 Raider 9SE Intel Core i7-9750H 2.6GHz
GeForce RTX 2060 Mobile
min:
25 fps
fps
GeForce RTX 2080 Mobile:
42 [X] MSI GT76 Titan DT 9SG Intel Core i9-9900K 3.6GHz
GeForce RTX 2080 Mobile
min:
24 fps
fps
GeForce RTX 2060 Mobile:
28 [X] MSI GE65 Raider 9SE Intel Core i7-9750H 2.6GHz
GeForce RTX 2060 Mobile
min:
17 fps
fps
GeForce RTX 2080 Mobile:
126 [X] MSI GT76 Titan DT 9SG Intel Core i9-9900K 3.6GHz
GeForce RTX 2080 Mobile
min:
21.8 fps, P0.1:
70.3 fps, P1:
79.8 fps, max:
198 fps
fps
GeForce RTX 2060 Mobile:
82.9 [X] MSI GE65 Raider 9SE Intel Core i7-9750H 2.6GHz
GeForce RTX 2060 Mobile
min:
33.4 fps, P0.1:
36.5 fps, P1:
48.5 fps, max:
142 fps
fps
GeForce RTX 2080 Mobile:
122 [X] MSI GT76 Titan DT 9SG Intel Core i9-9900K 3.6GHz
GeForce RTX 2080 Mobile
min:
17.8 fps, P0.1:
62 fps, P1:
78.5 fps, max:
202 fps
fps
GeForce RTX 2060 Mobile:
71.8 78.4 [X] MSI GE65 Raider 9SE Intel Core i7-9750H 2.6GHz
GeForce RTX 2060 Mobile
min:
30.9 fps, P0.1:
37.7 fps, P1:
45.7 fps, max:
124 fps
~ 75 fps
GeForce RTX 2080 Mobile:
102 [X] MSI GT76 Titan DT 9SG Intel Core i9-9900K 3.6GHz
GeForce RTX 2080 Mobile
min:
36.4 fps, P0.1:
45.5 fps, P1:
58.9 fps, max:
176 fps
fps
GeForce RTX 2060 Mobile:
64.1 67.9 [X] MSI GE65 Raider 9SE Intel Core i7-9750H 2.6GHz
GeForce RTX 2060 Mobile
min:
26.3 fps, P0.1:
31.1 fps, P1:
39 fps, max:
125 fps
~ 66 fps
GeForce RTX 2080 Mobile:
72 [X] MSI GT76 Titan DT 9SG Intel Core i9-9900K 3.6GHz
GeForce RTX 2080 Mobile
min:
41.4 fps, P0.1:
43.6 fps, P1:
47.4 fps, max:
151 fps
fps
GeForce RTX 2060 Mobile:
45.8 [X] MSI GE65 Raider 9SE Intel Core i7-9750H 2.6GHz
GeForce RTX 2060 Mobile
min:
27.4 fps, P0.1:
27.6 fps, P1:
29.5 fps, max:
96.4 fps
fps
GeForce RTX 2080 Mobile:
38.8 [X] MSI GT76 Titan DT 9SG Intel Core i9-9900K 3.6GHz
GeForce RTX 2080 Mobile
min:
24.5 fps, P0.1:
24.8 fps, P1:
25.5 fps, max:
84 fps
fps
GeForce RTX 2060 Mobile:
23.3 [X] MSI GE65 Raider 9SE Intel Core i7-9750H 2.6GHz
GeForce RTX 2060 Mobile
min:
13 fps, P0.1:
13.1 fps, P1:
13.8 fps, max:
80.9 fps
fps
GeForce RTX 2080 Mobile:
125 [X] MSI GT76 Titan DT 9SG Intel Core i9-9900K 3.6GHz
GeForce RTX 2080 Mobile
min:
42.8 fps, P0.1:
71.9 fps, P1:
98.7 fps, max:
328 fps
fps
GeForce RTX 2060 Mobile:
83.3 [X] MSI GE65 Raider 9SE Intel Core i7-9750H 2.6GHz
GeForce RTX 2060 Mobile
min:
38.9 fps, P0.1:
49 fps, P1:
64.3 fps, max:
254 fps
fps
GeForce RTX 2080 Mobile:
106 [X] MSI GT76 Titan DT 9SG Intel Core i9-9900K 3.6GHz
GeForce RTX 2080 Mobile
min:
40.4 fps, P0.1:
63.2 fps, P1:
83.6 fps, max:
289 fps
fps
GeForce RTX 2060 Mobile:
62.2 69.7 [X] MSI GE65 Raider 9SE Intel Core i7-9750H 2.6GHz
GeForce RTX 2060 Mobile
min:
37.7 fps, P0.1:
40 fps, P1:
54.4 fps, max:
203 fps
~ 66 fps
GeForce RTX 2080 Mobile:
94.4 [X] MSI GT76 Titan DT 9SG Intel Core i9-9900K 3.6GHz
GeForce RTX 2080 Mobile
min:
46.7 fps, P0.1:
60.8 fps, P1:
73.5 fps, max:
269 fps
fps
GeForce RTX 2060 Mobile:
57.1 63.1 [X] MSI GE65 Raider 9SE Intel Core i7-9750H 2.6GHz
GeForce RTX 2060 Mobile
min:
1.55 fps, P0.1:
33.5 fps, P1:
48.7 fps, max:
155 fps
~ 60 fps
GeForce RTX 2080 Mobile:
69.2 [X] MSI GT76 Titan DT 9SG Intel Core i9-9900K 3.6GHz
GeForce RTX 2080 Mobile
min:
13.1 fps, P0.1:
49.3 fps, P1:
56.6 fps, max:
246 fps
fps
GeForce RTX 2060 Mobile:
42.2 [X] MSI GE65 Raider 9SE Intel Core i7-9750H 2.6GHz
GeForce RTX 2060 Mobile
min:
27.6 fps, P0.1:
30.1 fps, P1:
32.9 fps, max:
85.4 fps
fps
GeForce RTX 2080 Mobile:
38.3 [X] MSI GT76 Titan DT 9SG Intel Core i9-9900K 3.6GHz
GeForce RTX 2080 Mobile
min:
28 fps, P0.1:
28.7 fps, P1:
31.4 fps, max:
75.9 fps
fps
GeForce RTX 2060 Mobile:
19.4 [X] MSI GE65 Raider 9SE Intel Core i7-9750H 2.6GHz
GeForce RTX 2060 Mobile
min:
1.631 fps, P0.1:
7.53 fps, P1:
15.4 fps, max:
113 fps
fps
GeForce RTX 2080 Mobile:
87 [X] MSI GT76 Titan DT 9SG Intel Core i9-9900K 3.6GHz
GeForce RTX 2080 Mobile
P0.1:
48 fpsP1:
fps
fps
GeForce RTX 2060 Mobile:
71 [X] MSI GE65 Raider 9SE Intel Core i7-9750H 2.6GHz
GeForce RTX 2060 Mobile
P0.1:
33 fpsP1:
fps
fps
GeForce RTX 2080 Mobile:
74 [X] MSI GT76 Titan DT 9SG Intel Core i9-9900K 3.6GHz
GeForce RTX 2080 Mobile
P0.1:
25 fpsP1:
fps
fps
GeForce RTX 2060 Mobile:
53 58 [X] MSI GE65 Raider 9SE Intel Core i7-9750H 2.6GHz
GeForce RTX 2060 Mobile
P0.1:
7 fpsP1:
fps
~ 56 fps
GeForce RTX 2080 Mobile:
66 [X] MSI GT76 Titan DT 9SG Intel Core i9-9900K 3.6GHz
GeForce RTX 2080 Mobile
P0.1:
8 fpsP1:
fps
fps
GeForce RTX 2060 Mobile:
46 50 [X] MSI GE65 Raider 9SE Intel Core i7-9750H 2.6GHz
GeForce RTX 2060 Mobile
P0.1:
28 fpsP1:
fps
~ 48 fps
GeForce RTX 2080 Mobile:
52 [X] MSI GT76 Titan DT 9SG Intel Core i9-9900K 3.6GHz
GeForce RTX 2080 Mobile
P0.1:
33 fpsP1:
fps
fps
GeForce RTX 2060 Mobile:
38 [X] MSI GE65 Raider 9SE Intel Core i7-9750H 2.6GHz
GeForce RTX 2060 Mobile
P0.1:
25 fpsP1:
fps
fps
GeForce RTX 2080 Mobile:
34 [X] MSI GT76 Titan DT 9SG Intel Core i9-9900K 3.6GHz
GeForce RTX 2080 Mobile
P0.1:
24 fpsP1:
fps
fps
GeForce RTX 2060 Mobile:
22 [X] MSI GE65 Raider 9SE Intel Core i7-9750H 2.6GHz
GeForce RTX 2060 Mobile
P0.1:
16 fpsP1:
fps
fps
GeForce RTX 2080 Mobile:
112 [X] MSI GT76 Titan DT 9SG Intel Core i9-9900K 3.6GHz
GeForce RTX 2080 Mobile
min:
43.8 fps, P0.1:
71.4 fps, P1:
82 fps, max:
176.9 fps
fps
GeForce RTX 2060 Mobile:
75.6 [X] MSI GE65 Raider 9SE Intel Core i7-9750H 2.6GHz
GeForce RTX 2060 Mobile
min:
40 fps, P0.1:
49.6 fps, P1:
57.8 fps, max:
108 fps
fps
GeForce RTX 2080 Mobile:
90.4 [X] MSI GT76 Titan DT 9SG Intel Core i9-9900K 3.6GHz
GeForce RTX 2080 Mobile
min:
9.7 fps, P0.1:
63.3 fps, P1:
71.8 fps, max:
133.9 fps
fps
GeForce RTX 2060 Mobile:
59.2 59.8 [X] MSI GE65 Raider 9SE Intel Core i7-9750H 2.6GHz
GeForce RTX 2060 Mobile
min:
25.4 fps, P0.1:
43.3 fps, P1:
47.9 fps, max:
85.4 fps
~ 60 fps
GeForce RTX 2080 Mobile:
55.9 [X] MSI GT76 Titan DT 9SG Intel Core i9-9900K 3.6GHz
GeForce RTX 2080 Mobile
min:
41 fps, P0.1:
42.4 fps, P1:
45.8 fps, max:
76.2 fps
fps
GeForce RTX 2060 Mobile:
35.4 [X] MSI GE65 Raider 9SE Intel Core i7-9750H 2.6GHz
GeForce RTX 2060 Mobile
min:
25 fps, P0.1:
26.1 fps, P1:
28.6 fps, max:
48.6 fps
38.7 ~ 37 fps
GeForce RTX 2080 Mobile:
48.1 [X] MSI GT76 Titan DT 9SG Intel Core i9-9900K 3.6GHz
GeForce RTX 2080 Mobile
min:
31.1 fps, P0.1:
36.2 fps, P1:
40.1 fps, max:
66 fps
fps
GeForce RTX 2060 Mobile:
29.4 [X] MSI GE65 Raider 9SE Intel Core i7-9750H 2.6GHz
GeForce RTX 2060 Mobile
min:
20.2 fps, P0.1:
22.4 fps, P1:
24.3 fps, max:
37.9 fps
fps
GeForce RTX 2080 Mobile:
35.8 [X] MSI GT76 Titan DT 9SG Intel Core i9-9900K 3.6GHz
GeForce RTX 2080 Mobile
min:
24.5 fps, P0.1:
27 fps, P1:
30.3 fps, max:
44.4 fps
fps
GeForce RTX 2060 Mobile:
21.9 [X] MSI GE65 Raider 9SE Intel Core i7-9750H 2.6GHz
GeForce RTX 2060 Mobile
min:
16.6 fps, P0.1:
17 fps, P1:
18.5 fps, max:
27.1 fps
fps
GeForce RTX 2080 Mobile:
114 [X] MSI GT76 Titan DT 9SG Intel Core i9-9900K 3.6GHz
GeForce RTX 2080 Mobile
min:
40.1 fps, P1:
83.5 fps, max:
163.58 fps
fps
GeForce RTX 2060 Mobile:
85.5 [X] MSI GE65 Raider 9SE Intel Core i7-9750H 2.6GHz
GeForce RTX 2060 Mobile
min:
35.49 fps, P1:
61.35 fps, max:
124.76 fps
fps
GeForce RTX 2080 Mobile:
101 [X] MSI GT76 Titan DT 9SG Intel Core i9-9900K 3.6GHz
GeForce RTX 2080 Mobile
min:
39.81 fps, P1:
74.33 fps, max:
145.04 fps
fps
GeForce RTX 2060 Mobile:
66 74.4 [X] MSI GE65 Raider 9SE Intel Core i7-9750H 2.6GHz
GeForce RTX 2060 Mobile
min:
33.64 fps, P1:
53.49 fps, max:
114.49 fps
~ 70 fps
GeForce RTX 2080 Mobile:
70.7 [X] MSI GT76 Titan DT 9SG Intel Core i9-9900K 3.6GHz
GeForce RTX 2080 Mobile
min:
32.64 fps, P1:
56.68 fps, max:
107.65 fps
fps
GeForce RTX 2060 Mobile:
36 40.5 [X] MSI GE65 Raider 9SE Intel Core i7-9750H 2.6GHz
GeForce RTX 2060 Mobile
min:
19.95 fps, P1:
30.63 fps, max:
73.02 fps
~ 38 fps
GeForce RTX 2080 Mobile:
53 [X] MSI GT76 Titan DT 9SG Intel Core i9-9900K 3.6GHz
GeForce RTX 2080 Mobile
min:
23.37 fps, P1:
42.94 fps, max:
111.11 fps
fps
GeForce RTX 2060 Mobile:
27.9 [X] MSI GE65 Raider 9SE Intel Core i7-9750H 2.6GHz
GeForce RTX 2060 Mobile
min:
16.02 fps, P1:
20.99 fps, max:
74.72 fps
fps
GeForce RTX 2080 Mobile:
30.8 [X] MSI GT76 Titan DT 9SG Intel Core i9-9900K 3.6GHz
GeForce RTX 2080 Mobile
min:
14.23 fps, P1:
23.4 fps, max:
97.93 fps
fps
GeForce RTX 2060 Mobile:
15.3 [X] MSI GE65 Raider 9SE Intel Core i7-9750H 2.6GHz
GeForce RTX 2060 Mobile
min:
7.7 fps, P1:
11.28 fps, max:
63.4 fps
fps
GeForce RTX 2080 Mobile:
284 [X] MSI GT76 Titan DT 9SG Intel Core i9-9900K 3.6GHz
GeForce RTX 2080 Mobile
min:
26.3 fps, P1:
178 fps, max:
409 fps
fps
GeForce RTX 2060 Mobile:
231 [X] MSI GE65 Raider 9SE Intel Core i7-9750H 2.6GHz
GeForce RTX 2060 Mobile
min:
8.13 fps, P1:
161 fps, max:
303 fps
fps
GeForce RTX 2080 Mobile:
279 [X] MSI GT76 Titan DT 9SG Intel Core i9-9900K 3.6GHz
GeForce RTX 2080 Mobile
min:
48.8 fps, P1:
197 fps, max:
419 fps
fps
GeForce RTX 2060 Mobile:
227 [X] MSI GE65 Raider 9SE Intel Core i7-9750H 2.6GHz
GeForce RTX 2060 Mobile
min:
48.6 fps, P1:
155 fps, max:
296 fps
fps
GeForce RTX 2080 Mobile:
274 [X] MSI GT76 Titan DT 9SG Intel Core i9-9900K 3.6GHz
GeForce RTX 2080 Mobile
min:
51.3 fps, P1:
196 fps, max:
386 fps
fps
GeForce RTX 2060 Mobile:
163 217 [X] MSI GE65 Raider 9SE Intel Core i7-9750H 2.6GHz
GeForce RTX 2060 Mobile
min:
22.4 fps, P1:
152 fps, max:
298 fps
~ 190 fps
GeForce RTX 2080 Mobile:
271 [X] MSI GT76 Titan DT 9SG Intel Core i9-9900K 3.6GHz
GeForce RTX 2080 Mobile
min:
38.8 fps, P1:
194 fps, max:
395 fps
fps
GeForce RTX 2060 Mobile:
161 210 [X] MSI GE65 Raider 9SE Intel Core i7-9750H 2.6GHz
GeForce RTX 2060 Mobile
min:
14.2 fps, P1:
147 fps, max:
296 fps
~ 186 fps
GeForce RTX 2080 Mobile:
264 [X] MSI GT76 Titan DT 9SG Intel Core i9-9900K 3.6GHz
GeForce RTX 2080 Mobile
min:
9.52 fps, P1:
182 fps, max:
389 fps
fps
GeForce RTX 2060 Mobile:
210 [X] MSI GE65 Raider 9SE Intel Core i7-9750H 2.6GHz
GeForce RTX 2060 Mobile
min:
16.3 fps, P1:
146 fps, max:
290 fps
fps
GeForce RTX 2080 Mobile:
224 [X] MSI GT76 Titan DT 9SG Intel Core i9-9900K 3.6GHz
GeForce RTX 2080 Mobile
min:
17.9 fps, P1:
160 fps, max:
318 fps
fps
GeForce RTX 2060 Mobile:
146 [X] MSI GE65 Raider 9SE Intel Core i7-9750H 2.6GHz
GeForce RTX 2060 Mobile
min:
68.1 fps, P1:
113 fps, max:
236 fps
fps
GeForce RTX 2080 Mobile:
395 [X] MSI GT76 Titan DT 9SG 1.5.4.5
Intel Core i9-9900K 3.6GHz
GeForce RTX 2080 Mobile
min:
64.6 fps, P1:
244 fps, max:
639 fps
fps
GeForce RTX 2060 Mobile:
255 262.1 282 [X] MSI GE65 Raider 9SE 1.5.4.5
Intel Core i7-9750H 2.6GHz
GeForce RTX 2060 Mobile
min:
32.8 fps, P1:
175 fps, max:
472 fps
~ 266 fps
GeForce RTX 2080 Mobile:
288 [X] MSI GT76 Titan DT 9SG 1.5.4.5
Intel Core i9-9900K 3.6GHz
GeForce RTX 2080 Mobile
min:
19.6 fps, P1:
232 fps, max:
462 fps
fps
GeForce RTX 2060 Mobile:
184.5 202.7 235 [X] MSI GE65 Raider 9SE 1.5.4.5
Intel Core i7-9750H 2.6GHz
GeForce RTX 2060 Mobile
min:
15.8 fps, P1:
181 fps, max:
342 fps
~ 207 fps
GeForce RTX 2080 Mobile:
249 [X] MSI GT76 Titan DT 9SG 1.5.4.5
Intel Core i9-9900K 3.6GHz
GeForce RTX 2080 Mobile
min:
135 fps, P1:
202 fps, max:
395 fps
fps
GeForce RTX 2060 Mobile:
172.8 176.5 198 [X] MSI GE65 Raider 9SE 1.5.4.5
Intel Core i7-9750H 2.6GHz
GeForce RTX 2060 Mobile
min:
69.1 fps, P1:
155 fps, max:
311 fps
~ 182 fps
GeForce RTX 2080 Mobile:
232 [X] MSI GT76 Titan DT 9SG 1.5.4.5
Intel Core i9-9900K 3.6GHz
GeForce RTX 2080 Mobile
min:
148 fps, P1:
187 fps, max:
351 fps
fps
GeForce RTX 2060 Mobile:
156.2 156.8 181 [X] MSI GE65 Raider 9SE 1.5.4.5
Intel Core i7-9750H 2.6GHz
GeForce RTX 2060 Mobile
min:
104 fps, P1:
142 fps, max:
269 fps
~ 165 fps
GeForce RTX 2080 Mobile:
164 [X] MSI GT76 Titan DT 9SG 1.5.4.5
Intel Core i9-9900K 3.6GHz
GeForce RTX 2080 Mobile
min:
24 fps, P1:
139 fps, max:
249 fps
fps
GeForce RTX 2060 Mobile:
117 [X] MSI GE65 Raider 9SE 1.5.4.5
Intel Core i7-9750H 2.6GHz
GeForce RTX 2060 Mobile
min:
73.6 fps, P1:
92.9 fps, max:
181 fps
fps
GeForce RTX 2080 Mobile:
101 [X] MSI GT76 Titan DT 9SG 1.5.4.5
Intel Core i9-9900K 3.6GHz
GeForce RTX 2080 Mobile
min:
75.6 fps, P1:
84.5 fps, max:
135 fps
fps
GeForce RTX 2060 Mobile:
63.7 [X] MSI GE65 Raider 9SE 1.5.4.5
Intel Core i7-9750H 2.6GHz
GeForce RTX 2060 Mobile
min:
45.7 fps, P1:
55.3 fps, max:
110 fps
fps
GeForce RTX 2080 Mobile:
156 [X] MSI GT76 Titan DT 9SG 1.5.4.5
Intel Core i9-9900K 3.6GHz
GeForce RTX 2080 Mobile
min:
57 fps, P1:
107 fps, max:
286 fps
fps
GeForce RTX 2060 Mobile:
94.3 117.9 120 [X] MSI GE65 Raider 9SE 1.5.4.5
Intel Core i7-9750H 2.6GHz
GeForce RTX 2060 Mobile
min:
43.1 fps, P1:
76.6 fps, max:
209 fps
128.3 [X] Aorus 7 KB Intel Core i7-10750H 2.6GHz
GeForce RTX 2060 Mobile
~ 115 fps
GeForce RTX 2080 Mobile:
122 [X] MSI GT76 Titan DT 9SG 1.5.4.5
Intel Core i9-9900K 3.6GHz
GeForce RTX 2080 Mobile
min:
12.4 fps, P1:
82.9 fps, max:
242 fps
fps
GeForce RTX 2060 Mobile:
62.5 74.6 77.4 [X] Aorus 7 KB Intel Core i7-10750H 2.6GHz
GeForce RTX 2060 Mobile
82.4 [X] MSI GE65 Raider 9SE 1.5.4.5
Intel Core i7-9750H 2.6GHz
GeForce RTX 2060 Mobile
min:
32.7 fps, P1:
52.6 fps, max:
145 fps
~ 74 fps
GeForce RTX 2080 Mobile:
110 [X] MSI GT76 Titan DT 9SG 1.5.4.5
Intel Core i9-9900K 3.6GHz
GeForce RTX 2080 Mobile
min:
3.02 fps, P1:
81.6 fps, max:
197 fps
fps
GeForce RTX 2060 Mobile:
60.2 67.1 71.1 [X] Aorus 7 KB Intel Core i7-10750H 2.6GHz
GeForce RTX 2060 Mobile
76.1 [X] MSI GE65 Raider 9SE 1.5.4.5
Intel Core i7-9750H 2.6GHz
GeForce RTX 2060 Mobile
min:
37.4 fps, P1:
54.1 fps, max:
167 fps
~ 69 fps
GeForce RTX 2080 Mobile:
79.1 [X] MSI GT76 Titan DT 9SG 1.5.4.5
Intel Core i9-9900K 3.6GHz
GeForce RTX 2080 Mobile
min:
23.9 fps, P1:
59.4 fps, max:
195 fps
fps
GeForce RTX 2060 Mobile:
50.8 [X] MSI GE65 Raider 9SE 1.5.4.5
Intel Core i7-9750H 2.6GHz
GeForce RTX 2060 Mobile
min:
27.2 fps, P1:
41.6 fps, max:
129 fps
fps
GeForce RTX 2080 Mobile:
42.4 [X] MSI GT76 Titan DT 9SG 1.5.4.5
Intel Core i9-9900K 3.6GHz
GeForce RTX 2080 Mobile
min:
30.2 fps, P1:
37.4 fps, max:
69.4 fps
fps
GeForce RTX 2060 Mobile:
25.9 [X] MSI GE65 Raider 9SE 1.5.4.5
Intel Core i7-9750H 2.6GHz
GeForce RTX 2060 Mobile
min:
19.8 fps, P1:
22.6 fps, max:
33.7 fps
fps
GeForce RTX 2080 Mobile:
145 [X] MSI GT76 Titan DT 9SG Intel Core i9-9900K 3.6GHz
GeForce RTX 2080 Mobile
min:
8.13 fps, P1:
83.8 fps, max:
267 fps
fps
GeForce RTX 2060 Mobile:
105 113 116 [X] MSI GE65 Raider 9SE Intel Core i7-9750H 2.6GHz
GeForce RTX 2060 Mobile
min:
6.92 fps, P1:
66.4 fps, max:
212 fps
126 [X] Aorus 7 KB Intel Core i7-10750H 2.6GHz
GeForce RTX 2060 Mobile
min:
7.57 fps, P1:
69.8 fps, max:
233 fps
~ 115 fps
GeForce RTX 2080 Mobile:
107 [X] MSI GT76 Titan DT 9SG Intel Core i9-9900K 3.6GHz
GeForce RTX 2080 Mobile
min:
6.12 fps, P1:
66.6 fps, max:
214 fps
fps
GeForce RTX 2060 Mobile:
75.7 80.9 [X] Aorus 7 KB Intel Core i7-10750H 2.6GHz
GeForce RTX 2060 Mobile
min:
2.33 fps, P1:
46.7 fps, max:
160 fps
83.3 [X] MSI GE65 Raider 9SE Intel Core i7-9750H 2.6GHz
GeForce RTX 2060 Mobile
min:
8.49 fps, P1:
53.9 fps, max:
158 fps
83.4 ~ 81 fps
GeForce RTX 2080 Mobile:
105 [X] MSI GT76 Titan DT 9SG Intel Core i9-9900K 3.6GHz
GeForce RTX 2080 Mobile
min:
13.2 fps, P1:
65.9 fps, max:
176 fps
fps
GeForce RTX 2060 Mobile:
57.7 [X] MSI GE65 Raider 9SE Intel Core i7-9750H 2.6GHz
GeForce RTX 2060 Mobile
min:
2.44 fps, P1:
31.4 fps, max:
129 fps
69.9 69.9 74.8 [X] Aorus 7 KB Intel Core i7-10750H 2.6GHz
GeForce RTX 2060 Mobile
min:
5.42 fps, P1:
40.6 fps, max:
141 fps
~ 68 fps
GeForce RTX 2080 Mobile:
89.4 [X] MSI GT76 Titan DT 9SG Intel Core i9-9900K 3.6GHz
GeForce RTX 2080 Mobile
min:
9.65 fps, P1:
58 fps, max:
140 fps
fps
GeForce RTX 2060 Mobile:
50.3 [X] MSI GE65 Raider 9SE Intel Core i7-9750H 2.6GHz
GeForce RTX 2060 Mobile
min:
1.968 fps, P1:
23.1 fps, max:
99.2 fps
56.6 58.7 [X] Aorus 7 KB Intel Core i7-10750H 2.6GHz
GeForce RTX 2060 Mobile
min:
17.5 fps, P1:
32.7 fps, max:
111 fps
59.8 61.3 [X] Acer Predator Helios 300 PH315-53-77N5 Extrem
Intel Core i7-10750H 2.6GHz
GeForce RTX 2060 Mobile
min:
12 fps, P1:
33 fps, max:
112 fps
63.3 [X] Acer Predator Helios 300 PH317-54-75G8 Extrem
Intel Core i7-10750H 2.6GHz
GeForce RTX 2060 Mobile
min:
21.5 fps, P1:
37.4 fps, max:
104 fps
~ 58 fps
GeForce RTX 2080 Mobile:
78.6 [X] MSI GT76 Titan DT 9SG Intel Core i9-9900K 3.6GHz
GeForce RTX 2080 Mobile
min:
11.4 fps, P1:
52 fps, max:
141 fps
fps
GeForce RTX 2060 Mobile:
43.6 [X] MSI GE65 Raider 9SE Intel Core i7-9750H 2.6GHz
GeForce RTX 2060 Mobile
min:
11.8 fps, P1:
25.1 fps, max:
84.4 fps
fps
GeForce RTX 2080 Mobile:
160 [X] MSI GT76 Titan DT 9SG Intel Core i9-9900K 3.6GHz
GeForce RTX 2080 Mobile
min:
28.5 fps, P0.1:
42.3 fps, P1:
60.6 fps, max:
381 fps
fps
GeForce RTX 2060 Mobile:
112 [X] MSI GE65 Raider 9SE Intel Core i7-9750H 2.6GHz
GeForce RTX 2060 Mobile
min:
20.7 fps, P0.1:
24.8 fps, P1:
28.5 fps, max:
300 fps
fps
GeForce RTX 2080 Mobile:
89.3 [X] MSI GT76 Titan DT 9SG Intel Core i9-9900K 3.6GHz
GeForce RTX 2080 Mobile
min:
29.3 fps, P0.1:
33.9 fps, P1:
48 fps, max:
179 fps
fps
GeForce RTX 2060 Mobile:
52.9 61.1 [X] MSI GE65 Raider 9SE Intel Core i7-9750H 2.6GHz
GeForce RTX 2060 Mobile
min:
10.4 fps, P0.1:
30.1 fps, P1:
46.9 fps, max:
149 fps
~ 57 fps
GeForce RTX 2080 Mobile:
61.1 [X] MSI GT76 Titan DT 9SG Intel Core i9-9900K 3.6GHz
GeForce RTX 2080 Mobile
min:
29.7 fps, P0.1:
33.7 fps, P1:
41.5 fps, max:
145 fps
fps
GeForce RTX 2060 Mobile:
40 46.5 [X] MSI GE65 Raider 9SE Intel Core i7-9750H 2.6GHz
GeForce RTX 2060 Mobile
min:
33.6 fps, P0.1:
35.1 fps, P1:
38.9 fps, max:
66 fps
~ 43 fps
GeForce RTX 2080 Mobile:
42.7 [X] MSI GT76 Titan DT 9SG Intel Core i9-9900K 3.6GHz
GeForce RTX 2080 Mobile
min:
23.1 fps, P0.1:
23.6 fps, P1:
35.8 fps, max:
69.7 fps
fps
GeForce RTX 2060 Mobile:
24.1 [X] MSI GE65 Raider 9SE Intel Core i7-9750H 2.6GHz
GeForce RTX 2060 Mobile
min:
15.4 fps, P0.1:
15.5 fps, P1:
17.3 fps, max:
35.5 fps
fps
GeForce RTX 2080 Mobile:
26.9 [X] MSI GT76 Titan DT 9SG Intel Core i9-9900K 3.6GHz
GeForce RTX 2080 Mobile
min:
13.7 fps, P0.1:
17.2 fps, P1:
23.3 fps, max:
69.8 fps
fps
GeForce RTX 2060 Mobile:
15.6 [X] MSI GE65 Raider 9SE Intel Core i7-9750H 2.6GHz
GeForce RTX 2060 Mobile
min:
4.89 fps, P0.1:
6.39 fps, P1:
13.4 fps, max:
19.8 fps
fps
GeForce RTX 2080 Mobile:
92.3 [X] MSI GT76 Titan DT 9SG 1.5.4.5
Intel Core i9-9900K 3.6GHz
GeForce RTX 2080 Mobile
min:
8.53 fps, P1:
65.072 fps, max:
114 fps
fps
GeForce RTX 2060 Mobile:
65.5 [X] Aorus 7 KB Intel Core i7-10750H 2.6GHz
GeForce RTX 2060 Mobile
66.6 72.5 [X] MSI GE65 Raider 9SE 1.5.4.5
Intel Core i7-9750H 2.6GHz
GeForce RTX 2060 Mobile
min:
5.65 fps, P1:
44.662 fps, max:
94.4 fps
~ 68 fps
GeForce RTX 2080 Mobile:
79 [X] MSI GT76 Titan DT 9SG 1.5.4.5
Intel Core i9-9900K 3.6GHz
GeForce RTX 2080 Mobile
min:
8.52 fps, P1:
55.19 fps, max:
95.5 fps
fps
GeForce RTX 2060 Mobile:
55 55.7 [X] Aorus 7 KB Intel Core i7-10750H 2.6GHz
GeForce RTX 2060 Mobile
59.6 [X] MSI GE65 Raider 9SE 1.5.4.5
Intel Core i7-9750H 2.6GHz
GeForce RTX 2060 Mobile
min:
5.32 fps, P1:
37.092 fps, max:
76.8 fps
~ 57 fps
GeForce RTX 2080 Mobile:
62.6 [X] MSI GT76 Titan DT 9SG 1.5.4.5
Intel Core i9-9900K 3.6GHz
GeForce RTX 2080 Mobile
min:
5.7 fps, P1:
43.595 fps, max:
74.4 fps
fps
GeForce RTX 2060 Mobile:
41.8 [X] Aorus 7 KB Intel Core i7-10750H 2.6GHz
GeForce RTX 2060 Mobile
42.5 44.7 [X] MSI GE65 Raider 9SE 1.5.4.5
Intel Core i7-9750H 2.6GHz
GeForce RTX 2060 Mobile
min:
7.37 fps, P1:
30.4 fps, max:
58.1 fps
~ 43 fps
GeForce RTX 2080 Mobile:
46.3 [X] MSI GT76 Titan DT 9SG 1.5.4.5
Intel Core i9-9900K 3.6GHz
GeForce RTX 2080 Mobile
min:
7.82 fps, P1:
35.3 fps, max:
55.9 fps
fps
GeForce RTX 2060 Mobile:
30.3 30.8 [X] MSI GE65 Raider 9SE 1.5.4.5
Intel Core i7-9750H 2.6GHz
GeForce RTX 2060 Mobile
min:
8.04 fps, P1:
21.758 fps, max:
45.7 fps
30.9 [X] Aorus 7 KB Intel Core i7-10750H 2.6GHz
GeForce RTX 2060 Mobile
~ 31 fps
GeForce RTX 2080 Mobile:
36.4 [X] MSI GT76 Titan DT 9SG 1.5.4.5
Intel Core i9-9900K 3.6GHz
GeForce RTX 2080 Mobile
min:
9.16 fps, P1:
27.349 fps, max:
51 fps
fps
GeForce RTX 2060 Mobile:
22.9 [X] MSI GE65 Raider 9SE 1.5.4.5
Intel Core i7-9750H 2.6GHz
GeForce RTX 2060 Mobile
min:
12.3 fps, P1:
16.149 fps, max:
41.1 fps
fps
GeForce RTX 2080 Mobile:
22.6 [X] MSI GT76 Titan DT 9SG 1.5.4.5
Intel Core i9-9900K 3.6GHz
GeForce RTX 2080 Mobile
min:
10.6 fps, P1:
17.664 fps, max:
47.3 fps
fps
GeForce RTX 2060 Mobile:
13.6 [X] MSI GE65 Raider 9SE 1.5.4.5
Intel Core i7-9750H 2.6GHz
GeForce RTX 2060 Mobile
min:
8.09 fps, P1:
9.44 fps, max:
27.5 fps
fps
GeForce RTX 2080 Mobile:
162 [X] MSI GT76 Titan DT 9SG Intel Core i9-9900K 3.6GHz
GeForce RTX 2080 Mobile
min:
34 fps
fps
GeForce RTX 2060 Mobile:
106 125 [X] MSI GE65 Raider 9SE Intel Core i7-9750H 2.6GHz
GeForce RTX 2060 Mobile
min:
34 fps
128 [X] Aorus 7 KB Intel Core i7-10750H 2.6GHz
GeForce RTX 2060 Mobile
139 ~ 125 fps
GeForce RTX 2080 Mobile:
121 [X] MSI GT76 Titan DT 9SG Intel Core i9-9900K 3.6GHz
GeForce RTX 2080 Mobile
min:
21 fps
fps
GeForce RTX 2060 Mobile:
72 84 [X] Aorus 7 KB Intel Core i7-10750H 2.6GHz
GeForce RTX 2060 Mobile
90 [X] MSI GE65 Raider 9SE Intel Core i7-9750H 2.6GHz
GeForce RTX 2060 Mobile
min:
34 fps
93 ~ 85 fps
GeForce RTX 2080 Mobile:
103 [X] MSI GT76 Titan DT 9SG Intel Core i9-9900K 3.6GHz
GeForce RTX 2080 Mobile
min:
29 fps
fps
GeForce RTX 2060 Mobile:
67 70 [X] Aorus 7 KB Intel Core i7-10750H 2.6GHz
GeForce RTX 2060 Mobile
75 [X] MSI GE65 Raider 9SE Intel Core i7-9750H 2.6GHz
GeForce RTX 2060 Mobile
min:
15 fps
78 ~ 73 fps
GeForce RTX 2080 Mobile:
84 [X] MSI GT76 Titan DT 9SG Intel Core i9-9900K 3.6GHz
GeForce RTX 2080 Mobile
min:
29 fps
fps
GeForce RTX 2060 Mobile:
54 [X] Aorus 7 KB Intel Core i7-10750H 2.6GHz
GeForce RTX 2060 Mobile
57 59 [X] MSI GE65 Raider 9SE Intel Core i7-9750H 2.6GHz
GeForce RTX 2060 Mobile
min:
24 fps
62 62 [X] Acer Predator Helios 300 PH315-53-77N5 Extrem
Intel Core i7-10750H 2.6GHz
GeForce RTX 2060 Mobile
67 [X] Acer Predator Helios 300 PH317-54-75G8 Extrem
Intel Core i7-10750H 2.6GHz
GeForce RTX 2060 Mobile
~ 60 fps
GeForce RTX 2080 Mobile:
65 [X] MSI GT76 Titan DT 9SG Intel Core i9-9900K 3.6GHz
GeForce RTX 2080 Mobile
min:
28 fps
fps
GeForce RTX 2060 Mobile:
45 [X] MSI GE65 Raider 9SE Intel Core i7-9750H 2.6GHz
GeForce RTX 2060 Mobile
min:
25 fps
fps
GeForce RTX 2080 Mobile:
38 [X] MSI GT76 Titan DT 9SG Intel Core i9-9900K 3.6GHz
GeForce RTX 2080 Mobile
min:
22 fps
fps
GeForce RTX 2060 Mobile:
25 [X] MSI GE65 Raider 9SE Intel Core i7-9750H 2.6GHz
GeForce RTX 2060 Mobile
min:
12 fps
fps
GeForce RTX 2080 Mobile:
181 [X] MSI GT76 Titan DT 9SG Intel Core i9-9900K 3.6GHz
GeForce RTX 2080 Mobile
min:
105 fps
fps
GeForce RTX 2060 Mobile:
140 [X] MSI GE65 Raider 9SE Intel Core i7-9750H 2.6GHz
GeForce RTX 2060 Mobile
min:
75 fps
146.6 148.4 [X] Aorus 7 KB Intel Core i7-10750H 2.6GHz
GeForce RTX 2060 Mobile
~ 145 fps
GeForce RTX 2080 Mobile:
155 [X] MSI GT76 Titan DT 9SG Intel Core i9-9900K 3.6GHz
GeForce RTX 2080 Mobile
min:
91 fps
fps
GeForce RTX 2060 Mobile:
99.6 [X] Aorus 7 KB Intel Core i7-10750H 2.6GHz
GeForce RTX 2060 Mobile
102 106 [X] MSI GE65 Raider 9SE Intel Core i7-9750H 2.6GHz
GeForce RTX 2060 Mobile
min:
70 fps
~ 103 fps
GeForce RTX 2080 Mobile:
141 [X] MSI GT76 Titan DT 9SG Intel Core i9-9900K 3.6GHz
GeForce RTX 2080 Mobile
min:
87 fps
fps
GeForce RTX 2060 Mobile:
91.9 [X] Aorus 7 KB Intel Core i7-10750H 2.6GHz
GeForce RTX 2060 Mobile
93.1 98.7 [X] MSI GE65 Raider 9SE Intel Core i7-9750H 2.6GHz
GeForce RTX 2060 Mobile
min:
60 fps
~ 95 fps
GeForce RTX 2080 Mobile:
138 [X] MSI GT76 Titan DT 9SG Intel Core i9-9900K 3.6GHz
GeForce RTX 2080 Mobile
min:
78 fps
fps
GeForce RTX 2060 Mobile:
88.7 [X] Aorus 7 KB Intel Core i7-10750H 2.6GHz
GeForce RTX 2060 Mobile
91 94.7 [X] MSI GE65 Raider 9SE Intel Core i7-9750H 2.6GHz
GeForce RTX 2060 Mobile
min:
56 fps
~ 91 fps
GeForce RTX 2080 Mobile:
103 [X] MSI GT76 Titan DT 9SG Intel Core i9-9900K 3.6GHz
GeForce RTX 2080 Mobile
min:
78 fps
fps
GeForce RTX 2060 Mobile:
64.7 [X] MSI GE65 Raider 9SE Intel Core i7-9750H 2.6GHz
GeForce RTX 2060 Mobile
min:
49 fps
fps
GeForce RTX 2080 Mobile:
56.4 [X] MSI GT76 Titan DT 9SG Intel Core i9-9900K 3.6GHz
GeForce RTX 2080 Mobile
min:
47 fps
fps
GeForce RTX 2060 Mobile:
34.7 [X] MSI GE65 Raider 9SE Intel Core i7-9750H 2.6GHz
GeForce RTX 2060 Mobile
min:
24 fps
fps
GeForce RTX 2080 Mobile:
288 [X] MSI GT76 Titan DT 9SG Intel Core i9-9900K 3.6GHz
GeForce RTX 2080 Mobile
min:
229 fps
fps
GeForce RTX 2060 Mobile:
198 [X] MSI GE65 Raider 9SE Intel Core i7-9750H 2.6GHz
GeForce RTX 2060 Mobile
min:
164 fps
218 230 231 [X] Aorus 7 KB Intel Core i7-10750H 2.6GHz
GeForce RTX 2060 Mobile
min:
185 fps, max:
252 fps
~ 219 fps
GeForce RTX 2080 Mobile:
205 [X] MSI GT76 Titan DT 9SG Intel Core i9-9900K 3.6GHz
GeForce RTX 2080 Mobile
min:
177 fps
fps
GeForce RTX 2060 Mobile:
142 [X] Aorus 7 KB Intel Core i7-10750H 2.6GHz
GeForce RTX 2060 Mobile
min:
129 fps, max:
152 fps
148 149 [X] MSI GE65 Raider 9SE Intel Core i7-9750H 2.6GHz
GeForce RTX 2060 Mobile
min:
128 fps
150 ~ 147 fps
GeForce RTX 2080 Mobile:
174 [X] MSI GT76 Titan DT 9SG Intel Core i9-9900K 3.6GHz
GeForce RTX 2080 Mobile
min:
157 fps
fps
GeForce RTX 2060 Mobile:
126 [X] Aorus 7 KB Intel Core i7-10750H 2.6GHz
GeForce RTX 2060 Mobile
min:
112 fps, max:
140 fps
129 [X] MSI GE65 Raider 9SE Intel Core i7-9750H 2.6GHz
GeForce RTX 2060 Mobile
min:
118 fps
131 132 ~ 130 fps
GeForce RTX 2080 Mobile:
139 [X] MSI GT76 Titan DT 9SG Intel Core i9-9900K 3.6GHz
GeForce RTX 2080 Mobile
min:
101 fps
fps
GeForce RTX 2060 Mobile:
93 94 [X] Aorus 7 KB Intel Core i7-10750H 2.6GHz
GeForce RTX 2060 Mobile
min:
78 fps, max:
108 fps
94 98 [X] MSI GE65 Raider 9SE Intel Core i7-9750H 2.6GHz
GeForce RTX 2060 Mobile
min:
81 fps
~ 95 fps
GeForce RTX 2080 Mobile:
117 [X] MSI GT76 Titan DT 9SG Intel Core i9-9900K 3.6GHz
GeForce RTX 2080 Mobile
min:
100 fps
fps
GeForce RTX 2060 Mobile:
70 [X] MSI GE65 Raider 9SE Intel Core i7-9750H 2.6GHz
GeForce RTX 2060 Mobile
min:
58 fps
fps
GeForce RTX 2080 Mobile:
67 [X] MSI GT76 Titan DT 9SG Intel Core i9-9900K 3.6GHz
GeForce RTX 2080 Mobile
min:
57 fps
fps
GeForce RTX 2060 Mobile:
41 [X] MSI GE65 Raider 9SE Intel Core i7-9750H 2.6GHz
GeForce RTX 2060 Mobile
min:
34 fps
fps
GeForce RTX 2080 Mobile:
282 [X] MSI GT76 Titan DT 9SG Intel Core i9-9900K 3.6GHz
GeForce RTX 2080 Mobile
min:
229 fps
fps
GeForce RTX 2060 Mobile:
225 [X] MSI GE65 Raider 9SE Intel Core i7-9750H 2.6GHz
GeForce RTX 2060 Mobile
min:
197 fps
fps
GeForce RTX 2080 Mobile:
276 [X] MSI GT76 Titan DT 9SG Intel Core i9-9900K 3.6GHz
GeForce RTX 2080 Mobile
min:
227 fps
fps
GeForce RTX 2060 Mobile:
223 [X] MSI GE65 Raider 9SE Intel Core i7-9750H 2.6GHz
GeForce RTX 2060 Mobile
min:
187 fps
fps
GeForce RTX 2080 Mobile:
266 [X] MSI GT76 Titan DT 9SG Intel Core i9-9900K 3.6GHz
GeForce RTX 2080 Mobile
min:
209 fps
fps
GeForce RTX 2060 Mobile:
177 215 [X] MSI GE65 Raider 9SE Intel Core i7-9750H 2.6GHz
GeForce RTX 2060 Mobile
min:
186 fps
~ 196 fps
GeForce RTX 2080 Mobile:
260 [X] MSI GT76 Titan DT 9SG Intel Core i9-9900K 3.6GHz
GeForce RTX 2080 Mobile
min:
208 fps
fps
GeForce RTX 2060 Mobile:
212 [X] MSI GE65 Raider 9SE Intel Core i7-9750H 2.6GHz
GeForce RTX 2060 Mobile
min:
181 fps
fps
GeForce RTX 2080 Mobile:
240 [X] MSI GT76 Titan DT 9SG Intel Core i9-9900K 3.6GHz
GeForce RTX 2080 Mobile
min:
183 fps
fps
GeForce RTX 2060 Mobile:
171 [X] MSI GE65 Raider 9SE Intel Core i7-9750H 2.6GHz
GeForce RTX 2060 Mobile
min:
153 fps
fps
GeForce RTX 2080 Mobile:
316 [X] MSI GT76 Titan DT 9SG Intel Core i9-9900K 3.6GHz
GeForce RTX 2080 Mobile
fps
GeForce RTX 2080 Mobile:
240 [X] MSI GT76 Titan DT 9SG Intel Core i9-9900K 3.6GHz
GeForce RTX 2080 Mobile
fps
GeForce RTX 2080 Mobile:
156 [X] MSI GT76 Titan DT 9SG Intel Core i9-9900K 3.6GHz
GeForce RTX 2080 Mobile
fps
GeForce RTX 2080 Mobile:
119 [X] MSI GT76 Titan DT 9SG Intel Core i9-9900K 3.6GHz
GeForce RTX 2080 Mobile
fps
GeForce RTX 2080 Mobile:
76.7 [X] MSI GT76 Titan DT 9SG Intel Core i9-9900K 3.6GHz
GeForce RTX 2080 Mobile
fps
GeForce RTX 2060 Mobile:
50.8 [X] MSI GE65 Raider 9SE Intel Core i7-9750H 2.6GHz
GeForce RTX 2060 Mobile
fps
GeForce RTX 2080 Mobile:
42.9 [X] MSI GT76 Titan DT 9SG Intel Core i9-9900K 3.6GHz
GeForce RTX 2080 Mobile
fps
GeForce RTX 2060 Mobile:
26.8 [X] MSI GE65 Raider 9SE Intel Core i7-9750H 2.6GHz
GeForce RTX 2060 Mobile
fps
100%
Quadro RTX 5000 (Laptop):
234.5 fps
140%
GeForce RTX 2080 Mobile:
328 [X] MSI GT76 Titan DT 9SG Intel Core i9-9900K 3.6GHz
GeForce RTX 2080 Mobile
min:
140 fps
fps
100%
Quadro RTX 5000 (Laptop):
200.2 fps
118%
GeForce RTX 2080 Mobile:
237 [X] MSI GT76 Titan DT 9SG Intel Core i9-9900K 3.6GHz
GeForce RTX 2080 Mobile
min:
139 fps
fps
100%
Quadro RTX 5000 (Laptop):
183.7 fps
114%
GeForce RTX 2080 Mobile:
209 [X] MSI GT76 Titan DT 9SG Intel Core i9-9900K 3.6GHz
GeForce RTX 2080 Mobile
min:
138 fps
fps
100%
Quadro RTX 5000 (Laptop):
180.8 fps
113%
GeForce RTX 2080 Mobile:
205 [X] MSI GT76 Titan DT 9SG Intel Core i9-9900K 3.6GHz
GeForce RTX 2080 Mobile
min:
130 fps
fps
67%
GeForce RTX 2060 Mobile:
98.7 108.9 114 121.8 [X] Aorus 7 KB Intel Core i7-10750H 2.6GHz
GeForce RTX 2060 Mobile
121.9 124.4 126.1 129 [X] Aorus 5 KB Intel Core i7-10750H 2.6GHz
GeForce RTX 2060 Mobile
134.4 [X] Acer Predator Helios 300 PH317-54-75G8 Extrem
Intel Core i7-10750H 2.6GHz
GeForce RTX 2060 Mobile
138 [X] MSI GE65 Raider 9SE Intel Core i7-9750H 2.6GHz
GeForce RTX 2060 Mobile
min:
95 fps
~ 122 fps
100%
Quadro RTX 5000 (Laptop):
128.5 fps
111%
GeForce RTX 2080 Mobile:
142 [X] MSI GT76 Titan DT 9SG Intel Core i9-9900K 3.6GHz
GeForce RTX 2080 Mobile
min:
99 fps
fps
68%
GeForce RTX 2060 Mobile:
86.9 [X] MSI GE65 Raider 9SE Intel Core i7-9750H 2.6GHz
GeForce RTX 2060 Mobile
min:
64 fps
fps
100%
Quadro RTX 5000 (Laptop):
68.6 fps
110%
GeForce RTX 2080 Mobile:
75.2 [X] MSI GT76 Titan DT 9SG Intel Core i9-9900K 3.6GHz
GeForce RTX 2080 Mobile
min:
55 fps
fps
60%
GeForce RTX 2060 Mobile:
41 [X] MSI GE65 Raider 9SE Intel Core i7-9750H 2.6GHz
GeForce RTX 2060 Mobile
min:
29 fps
fps
100%
Quadro RTX 5000 (Laptop):
231.1 fps
114%
GeForce RTX 2080 Mobile:
264 [X] MSI GT76 Titan DT 9SG Intel Core i9-9900K 3.6GHz
GeForce RTX 2080 Mobile
min:
238 fps
fps
80%
GeForce RTX 2060 Mobile:
170.6 197 [X] MSI GE65 Raider 9SE Intel Core i7-9750H 2.6GHz
GeForce RTX 2060 Mobile
min:
170 fps
~ 184 fps
100%
Quadro RTX 5000 (Laptop):
163.8 fps
95%
GeForce RTX 2080 Mobile:
155 [X] MSI GT76 Titan DT 9SG Intel Core i9-9900K 3.6GHz
GeForce RTX 2080 Mobile
min:
146 fps
fps
62%
GeForce RTX 2060 Mobile:
94.2 109 [X] MSI GE65 Raider 9SE Intel Core i7-9750H 2.6GHz
GeForce RTX 2060 Mobile
min:
101 fps
~ 102 fps
100%
Quadro RTX 5000 (Laptop):
130.4 fps
104%
GeForce RTX 2080 Mobile:
135 [X] MSI GT76 Titan DT 9SG Intel Core i9-9900K 3.6GHz
GeForce RTX 2080 Mobile
min:
125 fps
fps
62%
GeForce RTX 2060 Mobile:
75 87.4 [X] MSI GE65 Raider 9SE Intel Core i7-9750H 2.6GHz
GeForce RTX 2060 Mobile
min:
81 fps
~ 81 fps
100%
Quadro RTX 5000 (Laptop):
87.8 fps
98%
GeForce RTX 2080 Mobile:
85.7 [X] MSI GT76 Titan DT 9SG Intel Core i9-9900K 3.6GHz
GeForce RTX 2080 Mobile
min:
81 fps
fps
59%
GeForce RTX 2060 Mobile:
51.7 [X] MSI GE65 Raider 9SE Intel Core i7-9750H 2.6GHz
GeForce RTX 2060 Mobile
min:
49 fps
fps
100%
Quadro RTX 5000 (Laptop):
77.1 fps
54%
GeForce RTX 2080 Mobile:
41.5 [X] MSI GT76 Titan DT 9SG Intel Core i9-9900K 3.6GHz
GeForce RTX 2080 Mobile
min:
39 fps
fps
32%
GeForce RTX 2060 Mobile:
24.8 [X] MSI GE65 Raider 9SE Intel Core i7-9750H 2.6GHz
GeForce RTX 2060 Mobile
min:
23 fps
fps
100%
Quadro RTX 5000 (Laptop):
121 fps
100%
GeForce RTX 2080 Mobile:
121 [X] MSI GT76 Titan DT 9SG Intel Core i9-9900K 3.6GHz
GeForce RTX 2080 Mobile
min:
120 fps
fps
100%
GeForce RTX 2060 Mobile:
121 [X] MSI GE65 Raider 9SE Intel Core i7-9750H 2.6GHz
GeForce RTX 2060 Mobile
min:
118 fps
121 ~ 121 fps
100%
Quadro RTX 5000 (Laptop):
121 fps
100%
GeForce RTX 2080 Mobile:
121 [X] MSI GT76 Titan DT 9SG Intel Core i9-9900K 3.6GHz
GeForce RTX 2080 Mobile
min:
119 fps
fps
100%
GeForce RTX 2060 Mobile:
121 [X] MSI GE65 Raider 9SE Intel Core i7-9750H 2.6GHz
GeForce RTX 2060 Mobile
min:
115 fps
121 ~ 121 fps
100%
Quadro RTX 5000 (Laptop):
120.3 fps
101%
GeForce RTX 2080 Mobile:
121 [X] MSI GT76 Titan DT 9SG Intel Core i9-9900K 3.6GHz
GeForce RTX 2080 Mobile
min:
119 fps
fps
97%
GeForce RTX 2060 Mobile:
116 [X] MSI GE65 Raider 9SE Intel Core i7-9750H 2.6GHz
GeForce RTX 2060 Mobile
min:
96 fps
117.5 ~ 117 fps
100%
Quadro RTX 5000 (Laptop):
110.6 fps
109%
GeForce RTX 2080 Mobile:
121 [X] MSI GT76 Titan DT 9SG Intel Core i9-9900K 3.6GHz
GeForce RTX 2080 Mobile
min:
111 fps
fps
91%
GeForce RTX 2060 Mobile:
99.3 [X] MSI GE65 Raider 9SE Intel Core i7-9750H 2.6GHz
GeForce RTX 2060 Mobile
min:
85 fps
103.3 ~ 101 fps
100%
Quadro RTX 5000 (Laptop):
106.6 fps
83%
GeForce RTX 2080 Mobile:
88.6 [X] MSI GT76 Titan DT 9SG Intel Core i9-9900K 3.6GHz
GeForce RTX 2080 Mobile
min:
77 fps
fps
58%
GeForce RTX 2060 Mobile:
61.5 [X] MSI GE65 Raider 9SE Intel Core i7-9750H 2.6GHz
GeForce RTX 2060 Mobile
min:
46 fps
fps
100%
Quadro RTX 5000 (Laptop):
53.8 fps
92%
GeForce RTX 2080 Mobile:
49.3 [X] MSI GT76 Titan DT 9SG Intel Core i9-9900K 3.6GHz
GeForce RTX 2080 Mobile
min:
44 fps
fps
56%
GeForce RTX 2060 Mobile:
30 [X] MSI GE65 Raider 9SE Intel Core i7-9750H 2.6GHz
GeForce RTX 2060 Mobile
min:
25 fps
fps
100%
Quadro RTX 5000 (Laptop):
145.6 fps
96%
GeForce RTX 2080 Mobile:
140 [X] MSI GT76 Titan DT 9SG Intel Core i9-9900K 3.6GHz
GeForce RTX 2080 Mobile
min:
32 fps
fps
79%
GeForce RTX 2060 Mobile:
106 [X] MSI GE65 Raider 9SE Intel Core i7-9750H 2.6GHz
GeForce RTX 2060 Mobile
min:
22 fps
116.9 117.9 118.5 ~ 115 fps
100%
Quadro RTX 5000 (Laptop):
125.9 fps
95%
GeForce RTX 2080 Mobile:
119 [X] MSI GT76 Titan DT 9SG Intel Core i9-9900K 3.6GHz
GeForce RTX 2080 Mobile
min:
35 fps
fps
64%
GeForce RTX 2060 Mobile:
76.1 81.6 81.9 83.6 [X] MSI GE65 Raider 9SE Intel Core i7-9750H 2.6GHz
GeForce RTX 2060 Mobile
min:
24 fps
~ 81 fps
100%
Quadro RTX 5000 (Laptop):
87.4 fps
98%
GeForce RTX 2080 Mobile:
83 [X] MSI GT76 Titan DT 9SG Intel Core i9-9900K 3.6GHz
GeForce RTX 2080 Mobile
min:
27 fps
88.9 ~ 86 fps
62%
GeForce RTX 2060 Mobile:
50.7 50.7 54.9 55.1 56.2 [X] MSI GE65 Raider 9SE Intel Core i7-9750H 2.6GHz
GeForce RTX 2060 Mobile
min:
22 fps
~ 54 fps
100%
Quadro RTX 5000 (Laptop):
54.1 fps
104%
GeForce RTX 2080 Mobile:
54.2 [X] MSI GT76 Titan DT 9SG Intel Core i9-9900K 3.6GHz
GeForce RTX 2080 Mobile
min:
26 fps
56.8 ~ 56 fps
63%
GeForce RTX 2060 Mobile:
32.5 32.8 35.1 35.1 35.3 [X] MSI GE65 Raider 9SE Intel Core i7-9750H 2.6GHz
GeForce RTX 2060 Mobile
min:
14 fps
~ 34 fps
100%
Quadro RTX 5000 (Laptop):
43.7 fps
101%
GeForce RTX 2080 Mobile:
44.3 [X] MSI GT76 Titan DT 9SG Intel Core i9-9900K 3.6GHz
GeForce RTX 2080 Mobile
min:
8 fps
fps
66%
GeForce RTX 2060 Mobile:
28.7 [X] MSI GE65 Raider 9SE Intel Core i7-9750H 2.6GHz
GeForce RTX 2060 Mobile
min:
8 fps
fps
100%
Quadro RTX 5000 (Laptop):
28.1 fps
106%
GeForce RTX 2080 Mobile:
29.7 [X] MSI GT76 Titan DT 9SG Intel Core i9-9900K 3.6GHz
GeForce RTX 2080 Mobile
min:
6 fps
fps
69%
GeForce RTX 2060 Mobile:
19.5 [X] MSI GE65 Raider 9SE Intel Core i7-9750H 2.6GHz
GeForce RTX 2060 Mobile
min:
11 fps
fps
100%
Quadro RTX 5000 (Laptop):
112.8 fps
108%
GeForce RTX 2080 Mobile:
122 [X] MSI GT76 Titan DT 9SG Intel Core i9-9900K 3.6GHz
GeForce RTX 2080 Mobile
min: