NVIDIA Quadro FX 370M vs NVIDIA GeForce GTX 1070 Max-Q vs NVIDIA Quadro FX 880M
NVIDIA Quadro FX 370M ► remove from comparison
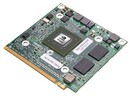
Die nVidia Quadro FX 370M ist eine Einsteiger Grafiklösung für mobile Workstations (Notebooks). Sie basiert auf den selben Kern wie die NVS 160M bzw. Consumer GeForce 9200M / 9300M GS . Die Treiber sind optimiert für CAD, DCC und Visualisierungsanwendungen und zeigen eine deutlich höhere OpenGL Leistung als bei den Consumer Grafikkarten. Ausserdem sind die Treiber für viele Anwendungen zertifiziert.
Die Spieleperformance der professionellen Grafikkarte für Laptops ist ähnlich zur 9200M / 9300M GS. Dadurch reicht die Spiele bzw 3D Performance nur für ältere Spiele bzw. Anwendungen mit geringen Anforderungen.
Wie auch die 9300M GS unterstützt die Quadro FX 370M PureVideo HD zur Dekodierung von (HD) Videos. Dadurch wird die CPU bei dieser Aufgabe entlastet.
Die Speichertaktung ist je nach eingesetzem Speicher unterschiedlich. GDDR3 Speicher wird mit 700 MHz getaktet, GDDR2 mit jediglich 400 MHz. Dies führt auch zu einer spürbar geringeren Leistung mit GDDR2.
Im getesteten Dell Precision M2400 war die Karte nur mit GDDR2 Grafikspeicher ausgestattet, welcher nur mit 400 MHz getaktet wird. Alte Spiele sollten ausreichend schnell laufen (Doom3 z.b. in der höchsten Qualitätsstufe mit knapp 40 fps). Moderne nur eingeschränkt (Unreal Tournament 3 z.B. nur in 800x600 in niedrigster Detailstufe). Laut Dell braucht die Karte mit speicher maximal 20 Watt (TDP).
NVIDIA GeForce GTX 1070 Max-Q ► remove from comparison
Die Nvidia GeForce GTX 1070 mit Max-Q Design ist eine mobile High-End-GPU der Pascal-Serie. Sie ist gedacht für dünne und leichte Notebook und je nach Kühlungsdesign etwa 10-15% langsamer als eine normale GTX 1070 für Laptops . Der Basistakt liegt mit 1101 - 1215 MHz deutlich unterhalb der normalen GTX 1070 (1433 MHz -10%) und auch der Boost erreicht mit 1265 - 1379 MHz (mind. -6%) bei weitem nicht die 1645 MHz der regulären GTX 1070. Der Speichertakt ist jedoch gleich.
Im Vergleich zur normalen GTX 1070 gibt es noch weitere Unterschiede als den Takt. Der Treiber wurde auf Effizienz (und nicht Leistung) optimiert (nur für die Max-Q Modelle), optimierte Spannungswandler für 1V Betreib, high-end Kühlungsmethoden und eine 40 dB Grenze für die Lüfterlautstärke (mit Taktanpasssungen um dies jederzeit zu gewährleisten) zeichnen die Max-Q Variante aus.
Features
Der GP104-Chip wird in einem 16nm-FinFET-Prozess bei TSMC gefertigt und bietet eine Reihe neuer Features, unter anderem Support für DisplayPort 1.4 (ready), HDMI 2.0b, HDR, Simultaneous Multi-Projection (SMP) sowie verbessertes H.265 Video De- und Encoding (PlayReady 3.0). Eine genaue Auflistung der Verbesserungen und Features der neuen Pascal Desktop-GPUs finden Sie in unserem Pascal-Architektur-Artikel .
Der Stromverbrauch der Max-Q Variante ist deutlich reduziert und beträgt je nach Laptopmodell zwischen 80 und 90 Watt (TGP).
NVIDIA Quadro FX 880M ► remove from comparison
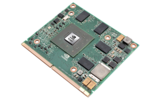
Die NVIDIA Q uadro FX 880M ist eine professionelle Mittelklasse Grafikkarte für mobile Workstations / Laptops. Sie basiert auf die Nvidia GeForce GT 330M mit etwas geringeren Taktraten und beherrscht dadurch DirectX 10.1. Durch ein spezielles BIOS und Treiber zeigt die Quadro FX 880M eine bessere Performance bei professionellen Anwendungen. Weiters ist die Grafikkarte für die gängigsten 3D Anwendungen (DCC, CAD, Modelling) zertifiziert und sollte dadurch fehlerfrei arbeiten. Außerdem bietet der Treiber verschiedene Profile um sich für die professionellen Anwendungen automatisch zu konfigurieren (ähnlich der Spieleprofile in GeForce Grafiktreibern).
Ohne Last taktet die FX 880M nur mit 135 / 270 / 135 MHz (Kern- / Shader- / Speichertakt) wodurch Strom gespart wird (Werte aus dem Lenovo Thinkpad W510).
Wie die GT330M verwendet auch die FX 880M den GT216 Kern. Dieser basiert laut Nvidia auf die High-End Desktop Architektur (GTX 200) und hat daher auch einige Verbesserungen gegenüber der Vorgängergeneration. Weiters wurde die Micro-Architektur verbessert um Akkulaufzeit und Performance zu steigern.
Die Quadro FX 880M unterstützt die Videodekodierung im Grafikchip (PureVideo HD) für weniger CPU Belastung bei HD Dekodierung. Der verbaute Video Processor 4 (VP4) unterstützt das vollständige Dekodieren von H.264, VC-1, MPEG-2, und jetzt auch MPEG-4 ASP (DivX oder xVID). Nur MPEG-1 wird nicht unterstützt (jedoch ist der Decodieraufwand hier minimal).
Wie auch bei der alten 9700M GTS übernehmen 48 so genannte Stream Prozessoren die anstehende Grafikarbeit (die früher die Pixel und Vertex Shader übernommen haben). Der Vorteil ist, daß es theortisch keinen Leerlauf der ALUs mehr gibt. Die Streamprozessoren sind bei NVIDIA 1-dimensional (1D) und können pro Takt eine Skalaroperation mit einer MADD- (Addition und Multiplikation) und MUL-Anweisung (Multiplikation) durführen. Ausserdem taktet NVIDIA die Shader-ALUs höher als den restlichen Chip (1100 versus 500 MHz).
Dank CUDA , DirectX Compute , OpenCL und PhysX Support können die Stream Prozessoren auch für andere Anwendungen (Video Kodierung, Physikeffekte, ...) eingesetzt werden und sind bei solchen Spezialanwendungen deutlich schneller als gängige Hauptprozessoren (durch die hohe Anzahl an Shadern die parallel arbeiten).
Moderne und anspruchsvolle DirectX 10 Spiele (wie Crysis) laufen auf der GT 330M mit mittleren Details bei mittleren Auflösungen flüssig. Da die FX 880M Treiber für professionelle Anwendungen optimiert sind, kann hier die Spieleperformance leiden. Spieler sollten deshalb klar zur GeForce Linie greifen.
Zum automatischen Umschalten auf die integrierte Grafik des Prozessors, unterstützt der Grafikchip Optimus. Dies wurde jedoch z.B. beim W510 nicht verbaut.
NVIDIA Quadro FX 370M NVIDIA GeForce GTX 1070 Max-Q NVIDIA Quadro FX 880M Quadro FX Serie Codename NB9M-GLM N17E-G2 Max-Q N10P-GLM Pipelines 8 - unified 2048 - unified 48 - unified Kerntakt 580 MHz 1101 - 1215 - 1265 - 1379 (Boost) MHz 550 MHz Shadertakt 1450 MHz 1210 MHz Speichertakt 700 MHz 8000 MHz 790 MHz Speicherbandbreite 64 Bit 256 Bit 128 Bit Speichertyp GDDR2, GDDR3 GDDR5 GDDR3, DDR3 Max. Speichergröße 256 MB 8 GB 1024 MB Shared Memory nein nein nein API DirectX 10, Shader 4.0 DirectX 12_1, OpenGL 4.5 DirectX 10.1, Shader 4.1 Stromverbrauch 20 Watt 35 Watt Herstellungsprozess 65 nm 16 nm 40 nm Erscheinungsdatum 15.08.2008 30.05.2017 07.01.2010 Informationen OpenGL 2.1, max. 1920x1200 (digital) bzw 2048x1536 (analog), max. 2 unabhängige Displays, PCI-Express x16, optionale Interfaces (des Chips): DP, VGA, DVI, LVDS, HDMI Herstellerseite www.nvidia.com www.nvidia.com Architektur Pascal GT2xx Transistors 7.2 Billion Features Multi-Projection, VR Ready, G-SYNC, Vulkan, Multi Monitor Notebookgröße groß (17" z.B.) mittel (15.4" z.B.)
Benchmarks Performance Rating - 3DMark 11 + Fire Strike + Time Spy - GeForce GTX 1070 Max-Q
6.5 pt (19%)
...
NVIDIA GeForce GTX 1070 Max-Q
...
max:
3DMark - 3DMark Time Spy Score
min: 4396 avg: 4641 median: 4616 (13%) max: 4856 Points
3DMark - 3DMark Time Spy Graphics
min: 4548 avg: 4687 median: 4708 (12%) max: 4795 Points
3DMark - 3DMark Ice Storm Unlimited Graphics
min: 328292 avg: 351332 median: 334256 (34%) max: 398350 Points
3DMark - 3DMark Ice Storm Extreme Graphics
min: 91895 avg: 209959 median: 215087 (25%) max: 312206 Points
3DMark - 3DMark Cloud Gate Score
min: 24117 avg: 29752 median: 28582.5 (27%) max: 35886 Points
3DMark - 3DMark Cloud Gate Graphics
min: 73739 avg: 97317 median: 99551.5 (24%) max: 107807 Points
3DMark - 3DMark Fire Strike Standard Score
min: 11857 avg: 12627 median: 12598.5 (21%) max: 14119 Points
3DMark - 3DMark Fire Strike Standard Graphics
min: 14146 avg: 14910 median: 14678.5 (17%) max: 16165 Points
3DMark - 3DMark Ice Storm Graphics
min: 92053 avg: 245427 median: 241124 (27%) max: 357428 Points
3DMark 11 - 3DM11 Performance Score
min: 13513 avg: 15401 median: 15409 (20%) max: 17408 Points
3DMark 11 - 3DM11 Performance GPU
min: 17680 avg: 19016 median: 18688 (16%) max: 20829 Points
3DMark Vantage 3DM Vant. Perf. total + NVIDIA GeForce GTX 1070 Max-Q 3DMark Vantage - 3DM Vant. Perf. total
44090 Points (13%)
3DM Vant. Perf. total + NVIDIA Quadro FX 880M
min: 2558 avg: 2643 median: 2638.5 (1%) max: 2735 Points
3DM Vant. Perf. GPU no PhysX + NVIDIA GeForce GTX 1070 Max-Q 3DMark Vantage - 3DM Vant. Perf. GPU no PhysX
47227 Points (26%)
3DM Vant. Perf. GPU no PhysX + NVIDIA Quadro FX 880M
min: 2128 avg: 2203 median: 2149.5 (1%) max: 2385 Points
3DMark 2001SE - 3DMark 2001 - Standard
13622 Points (14%)
min: 28169 avg: 32291 median: 33331 (35%) max: 34331 Points
3DMark 03 - 3DMark 03 - Standard
5532 Points (3%)
min: 18796 avg: 18980 median: 19002 (10%) max: 19137 Points
3DMark 05 - 3DMark 05 - Standard
3290 Points (4%)
min: 13154 avg: 13217 median: 13185 (14%) max: 13298 Points
3DMark 06 3DMark 06 - Standard 1280x1024 + NVIDIA Quadro FX 370M
1595 Points (2%)
3DMark 06 - Standard 1280x1024 + NVIDIA GeForce GTX 1070 Max-Q
min: 26805 avg: 30843 median: 30648.5 (40%) max: 35269 Points
3DMark 06 - Standard 1280x1024 + NVIDIA Quadro FX 880M
min: 6366 avg: 6401 median: 6378 (8%) max: 6473 Points
3DMark 06 - Standard 1280x768 + NVIDIA Quadro FX 880M
6392 Points (8%)
SPEC Viewperf 10.0 - SPEC Viewperf 10.0 - 3dsmax
12.3 Points (26%)
47.8 Points (99%)
SPEC Viewperf 10.0 - SPEC Viewperf 10.0 - Catia
16.8 Points (35%)
47.6 Points (100%)
SPEC Viewperf 10.0 - SPEC Viewperf 10.0 - EnSight
12 Points (25%)
SPEC Viewperf 10.0 - SPEC Viewperf 10.0 - Maya
27.3 Points (15%)
60.1 Points (32%)
SPEC Viewperf 10.0 - SPEC Viewperf 10.0 - Pro/Engeneer
13.7 Points (27%)
SPEC Viewperf 10.0 - SPEC Viewperf 10.0 - SolidWorks
21.8 Points (32%)
58 Points (86%)
SPEC Viewperf 10.0 - SPEC Viewperf 10.0 - UGS Teamcenter
6.8 Points (18%)
24.4 Points (63%)
SPEC Viewperf 10.0 - SPEC Viewperf 10.0 - UGS NX
5.1 Points (10%)
SPECviewperf 11 specvp11 snx-01 + NVIDIA GeForce GTX 1070 Max-Q SPECviewperf 11 - specvp11 snx-01
11.8 fps (7%)
specvp11 snx-01 + NVIDIA Quadro FX 880M
min: 9.18 avg: 9.7 median: 9.7 (6%) max: 10.27 fps
specvp11 tcvis-02 + NVIDIA GeForce GTX 1070 Max-Q SPECviewperf 11 - specvp11 tcvis-02
3.4 fps (2%)
specvp11 tcvis-02 + NVIDIA Quadro FX 880M
min: 11.04 avg: 11.2 median: 11.2 (6%) max: 11.32 fps
specvp11 sw-02 + NVIDIA GeForce GTX 1070 Max-Q SPECviewperf 11 - specvp11 sw-02
19.9 fps (15%)
specvp11 sw-02 + NVIDIA Quadro FX 880M
min: 7.56 avg: 16 median: 16 (12%) max: 24.45 fps
specvp11 proe-05 + NVIDIA GeForce GTX 1070 Max-Q SPECviewperf 11 - specvp11 proe-05
2.9 fps (3%)
specvp11 proe-05 + NVIDIA Quadro FX 880M
min: 4.28 avg: 5.2 median: 5.2 (6%) max: 6.21 fps
specvp11 maya-03 + NVIDIA GeForce GTX 1070 Max-Q SPECviewperf 11 - specvp11 maya-03
18.6 fps (14%)
specvp11 maya-03 + NVIDIA Quadro FX 880M
min: 6.94 avg: 8 median: 8 (6%) max: 9.09 fps
specvp11 lightwave-01 + NVIDIA GeForce GTX 1070 Max-Q SPECviewperf 11 - specvp11 lightwave-01
21 fps (23%)
specvp11 lightwave-01 + NVIDIA Quadro FX 880M
min: 9.81 avg: 23.8 median: 23.8 (26%) max: 37.84 fps
specvp11 ensight-04 + NVIDIA GeForce GTX 1070 Max-Q SPECviewperf 11 - specvp11 ensight-04
160.3 fps (77%)
specvp11 ensight-04 + NVIDIA Quadro FX 880M
min: 10 avg: 10.3 median: 10.3 (5%) max: 10.59 fps
specvp11 catia-03 + NVIDIA GeForce GTX 1070 Max-Q SPECviewperf 11 - specvp11 catia-03
20.3 fps (11%)
specvp11 catia-03 + NVIDIA Quadro FX 880M
min: 8.63 avg: 12.3 median: 12.3 (6%) max: 15.92 fps
SPECviewperf 12 specvp12 sw-03 + NVIDIA GeForce GTX 1070 Max-Q SPECviewperf 12 - specvp12 sw-03
min: 44.79 avg: 47.9 median: 47.8 (12%) max: 50.9 fps
specvp12 snx-02 + NVIDIA GeForce GTX 1070 Max-Q SPECviewperf 12 - specvp12 snx-02
min: 6.72 avg: 6.8 median: 6.8 (1%) max: 6.96 fps
specvp12 showcase-01 + NVIDIA GeForce GTX 1070 Max-Q SPECviewperf 12 - specvp12 showcase-01
min: 71.6 avg: 75.2 median: 75.2 (16%) max: 78.8 fps
specvp12 mediacal-01 + NVIDIA GeForce GTX 1070 Max-Q SPECviewperf 12 - specvp12 mediacal-01
min: 32.67 avg: 34.4 median: 34.4 (9%) max: 36.03 fps
specvp12 maya-04 + NVIDIA GeForce GTX 1070 Max-Q SPECviewperf 12 - specvp12 maya-04
min: 83.4 avg: 92.4 median: 92.4 (25%) max: 101.4 fps
specvp12 energy-01 + NVIDIA GeForce GTX 1070 Max-Q SPECviewperf 12 - specvp12 energy-01
6.9 fps (6%)
specvp12 creo-01 + NVIDIA GeForce GTX 1070 Max-Q SPECviewperf 12 - specvp12 creo-01
min: 45.05 avg: 45.2 median: 45.2 (18%) max: 45.43 fps
specvp12 catia-04 + NVIDIA GeForce GTX 1070 Max-Q SPECviewperf 12 - specvp12 catia-04
min: 62.7 avg: 63.3 median: 63.3 (10%) max: 63.9 fps
specvp12 3dsmax-05 + NVIDIA GeForce GTX 1070 Max-Q SPECviewperf 12 - specvp12 3dsmax-05
97.4 fps (17%)
Windows 7 Experience Index - Win7 Gaming graphics
6.4 Points (81%)
Windows 7 Experience Index - Win7 Graphics
6.4 Points (81%)
Cinebench R10 Cinebench R10 Shading (32bit) + NVIDIA Quadro FX 370M Cinebench R10 - Cinebench R10 Shading (32bit)
3031 Points (2%)
Cinebench R10 Shading (32bit) + NVIDIA GeForce GTX 1070 Max-Q
min: 6820 avg: 9726 median: 10777 (8%) max: 11810 Points
Cinebench R10 Shading (32bit) + NVIDIA Quadro FX 880M
min: 4809 avg: 4886 median: 4846 (3%) max: 5002 Points
Cinebench R11.5 Cinebench R11.5 OpenGL 64 Bit + NVIDIA GeForce GTX 1070 Max-Q Cinebench R11.5 - Cinebench R11.5 OpenGL 64 Bit
min: 62.7 avg: 68.5 median: 67.2 (22%) max: 76.3 fps
Cinebench R11.5 OpenGL 64 Bit + NVIDIA Quadro FX 880M
min: 15.84 avg: 16 median: 16 (5%) max: 16.14 fps
Cinebench R15 Cinebench R15 OpenGL 64 Bit + NVIDIA GeForce GTX 1070 Max-Q Cinebench R15 - Cinebench R15 OpenGL 64 Bit
min: 95.9 avg: 104.6 median: 102.1 (6%) max: 118.5 fps
Cinebench R15 OpenGL Ref. Match 64 Bit + NVIDIA GeForce GTX 1070 Max-Q Cinebench R15 - Cinebench R15 OpenGL Ref. Match 64 Bit
99.6 % (100%)
GFXBench 3.0 - GFXBench 3.0 Manhattan Offscreen
459 fps (27%)
LuxMark v2.0 64Bit - LuxMark v2.0 Room GPU
min: 2460 avg: 2523 median: 2523 (9%) max: 2586 Samples/s
LuxMark v2.0 64Bit - LuxMark v2.0 Sala GPU
min: 4877 avg: 4938 median: 4937.5 (9%) max: 4998 Samples/s
ComputeMark v2.1 - ComputeMark v2.1 Result
min: 10798 avg: 10998 median: 10917 (12%) max: 11390 Points
Power Consumption - Witcher 3 Power Consumption *
min: 120 avg: 136.2 median: 134.2 (29%) max: 154 Watt
Power Consumption - Witcher 3 ultra Power Efficiency
min: 0.3221 avg: 0.4 median: 0.4 (34%) max: 0.4389 fps per Watt
Emissions Witcher 3 Fan Noise + NVIDIA GeForce GTX 1070 Max-Q Emissions - Witcher 3 Fan Noise
min: 41.7 avg: 46.1 median: 45 (72%) max: 55 dB(A)
Clock Speed - GPU Clock Witcher 3 ultra
min: 1228 avg: 1344 median: 1342 (53%) max: 1480 MHz
Average Benchmarks NVIDIA Quadro FX 370M → 100% n=2 Average Benchmarks NVIDIA GeForce GTX 1070 Max-Q → 1139% n=2 Average Benchmarks NVIDIA Quadro FX 880M → 280% n=2
- Bereich der Benchmarkergebnisse für diese Grafikkarte
- Durchschnittliche Benchmarkergebnisse für diese Grafikkarte
* Smaller numbers mean a higher performance
1 This benchmark is not used for the average calculation
Spiele-Benchmarks Die folgenden Benchmarks basieren auf unseren Spieletests mit Testnotebooks. Die Performance dieser Grafikkarte bei den gelisteten Spielen ist abhängig von der verwendeten CPU, Speicherausstattung, Treiber und auch Betriebssystem. Dadurch müssen die untenstehenden Werte nicht repräsentativ sein. Detaillierte Informationen über das verwendete System sehen Sie nach einem Klick auf den fps-Wert.
GeForce GTX 1070 Max-Q:
126.1 fps
GeForce GTX 1070 Max-Q:
86.1 fps
GeForce GTX 1070 Max-Q:
78.8 fps
GeForce GTX 1070 Max-Q:
75.7 fps
GeForce GTX 1070 Max-Q:
169.2 fps
GeForce GTX 1070 Max-Q:
83.9 fps
GeForce GTX 1070 Max-Q:
68.3 fps
GeForce GTX 1070 Max-Q:
59.7 fps
GeForce GTX 1070 Max-Q:
140.7 fps
GeForce GTX 1070 Max-Q:
80.6 fps
GeForce GTX 1070 Max-Q:
70 91.7 ~ 81 fps
GeForce GTX 1070 Max-Q:
64.7 85.2 ~ 75 fps
GeForce GTX 1070 Max-Q:
214.4 fps
GeForce GTX 1070 Max-Q:
167.6 fps
GeForce GTX 1070 Max-Q:
110.4 fps
GeForce GTX 1070 Max-Q:
89.6 fps
GeForce GTX 1070 Max-Q:
60 fps
GeForce GTX 1070 Max-Q:
60 fps
GeForce GTX 1070 Max-Q:
92 fps
GeForce GTX 1070 Max-Q:
80.5 fps
GeForce GTX 1070 Max-Q:
68.1 74.8 ~ 71 fps
GeForce GTX 1070 Max-Q:
66.3 68.8 ~ 68 fps
GeForce GTX 1070 Max-Q:
169.8 fps
GeForce GTX 1070 Max-Q:
105 fps
GeForce GTX 1070 Max-Q:
91.4 98.9 ~ 95 fps
GeForce GTX 1070 Max-Q:
84.7 93.3 ~ 89 fps
GeForce GTX 1070 Max-Q:
64 fps
GeForce GTX 1070 Max-Q:
62 fps
GeForce GTX 1070 Max-Q:
52 61 ~ 57 fps
GeForce GTX 1070 Max-Q:
39 44 ~ 42 fps
GeForce GTX 1070 Max-Q:
21 fps
GeForce GTX 1070 Max-Q:
127 fps
GeForce GTX 1070 Max-Q:
101 fps
GeForce GTX 1070 Max-Q:
95 99 ~ 97 fps
GeForce GTX 1070 Max-Q:
78 80 ~ 79 fps
GeForce GTX 1070 Max-Q:
43 fps
GeForce GTX 1070 Max-Q:
199 fps
GeForce GTX 1070 Max-Q:
194 fps
GeForce GTX 1070 Max-Q:
91 130 ~ 111 fps
GeForce GTX 1070 Max-Q:
65 78 ~ 72 fps
GeForce GTX 1070 Max-Q:
62 67 72 ~ 67 fps
GeForce GTX 1070 Max-Q:
58 58 61 ~ 59 fps
GeForce GTX 1070 Max-Q:
20 fps
GeForce GTX 1070 Max-Q:
163 fps
GeForce GTX 1070 Max-Q:
130 fps
GeForce GTX 1070 Max-Q:
70 76 76 ~ 74 fps
GeForce GTX 1070 Max-Q:
59 fps
GeForce GTX 1070 Max-Q:
156.5 fps
GeForce GTX 1070 Max-Q:
88.4 fps
GeForce GTX 1070 Max-Q:
74.8 80.4 ~ 78 fps
GeForce GTX 1070 Max-Q:
56.9 60.3 ~ 59 fps
GeForce GTX 1070 Max-Q:
60 60 ~ 60 fps
GeForce GTX 1070 Max-Q:
60 60 ~ 60 fps
GeForce GTX 1070 Max-Q:
103 fps
GeForce GTX 1070 Max-Q:
81 fps
GeForce GTX 1070 Max-Q:
76 77 79 83 ~ 79 fps
GeForce GTX 1070 Max-Q:
72 74 75 78 ~ 75 fps
GeForce GTX 1070 Max-Q:
27 fps
GeForce GTX 1070 Max-Q:
109 fps
GeForce GTX 1070 Max-Q:
96.5 fps
GeForce GTX 1070 Max-Q:
81.1 fps
GeForce GTX 1070 Max-Q:
112.4 fps
GeForce GTX 1070 Max-Q:
95.9 fps
GeForce GTX 1070 Max-Q:
163.3 fps
GeForce GTX 1070 Max-Q:
133.5 fps
GeForce GTX 1070 Max-Q:
86 94 101 ~ 94 fps
GeForce GTX 1070 Max-Q:
63 70 ~ 67 fps
GeForce GTX 1070 Max-Q:
53 64 ~ 59 fps
GeForce GTX 1070 Max-Q:
52 62 71 71 ~ 64 fps
GeForce GTX 1070 Max-Q:
44 53 61 61 ~ 55 fps
GeForce GTX 1070 Max-Q:
26 fps
GeForce GTX 1070 Max-Q:
152.6 fps
GeForce GTX 1070 Max-Q:
137.4 fps
GeForce GTX 1070 Max-Q:
130.8 fps
GeForce GTX 1070 Max-Q:
111 fps
GeForce GTX 1070 Max-Q:
88.5 fps
GeForce GTX 1070 Max-Q:
53.3 fps
GeForce GTX 1070 Max-Q:
91 132 ~ 112 fps
GeForce GTX 1070 Max-Q:
82 114 ~ 98 fps
GeForce GTX 1070 Max-Q:
74 90 91 ~ 85 fps
GeForce GTX 1070 Max-Q:
62 69 71 ~ 67 fps
GeForce GTX 1070 Max-Q:
158.3 fps
GeForce GTX 1070 Max-Q:
62.7 fps
GeForce GTX 1070 Max-Q:
45.7 fps
GeForce GTX 1070 Max-Q:
31.9 fps
GeForce GTX 1070 Max-Q:
112 125 ~ 119 fps
GeForce GTX 1070 Max-Q:
79 80 81 ~ 80 fps
GeForce GTX 1070 Max-Q:
36 fps
GeForce GTX 1070 Max-Q:
109 [X] MSI GS63VR 7RG Intel Core i7-7700HQ 2.8GHz
GeForce GTX 1070 Max-Q
min:
66 fps
fps
GeForce GTX 1070 Max-Q:
93.7 [X] MSI GS63VR 7RG Intel Core i7-7700HQ 2.8GHz
GeForce GTX 1070 Max-Q
min:
54 fps
fps
GeForce GTX 1070 Max-Q:
86.3 [X] MSI GS63VR 7RG Intel Core i7-7700HQ 2.8GHz
GeForce GTX 1070 Max-Q
min:
56 fps
116 120 ~ 107 fps
GeForce GTX 1070 Max-Q:
68.2 [X] MSI GS63VR 7RG Intel Core i7-7700HQ 2.8GHz
GeForce GTX 1070 Max-Q
min:
51 fps
78.7 84.6 ~ 77 fps
GeForce GTX 1070 Max-Q:
22.4 [X] MSI GS63VR 7RG Intel Core i7-7700HQ 2.8GHz
GeForce GTX 1070 Max-Q
min:
17 fps
fps
GeForce GTX 1070 Max-Q:
128.4 fps
GeForce GTX 1070 Max-Q:
126.3 fps
GeForce GTX 1070 Max-Q:
122 fps
GeForce GTX 1070 Max-Q:
120.8 fps
GeForce GTX 1070 Max-Q:
115.4 121 [X] MSI GS63VR 7RG Intel Core i7-7700HQ 2.8GHz
GeForce GTX 1070 Max-Q
~ 118 fps
GeForce GTX 1070 Max-Q:
71.8 72.8 76.9 [X] MSI GS63VR 7RG Intel Core i7-7700HQ 2.8GHz
GeForce GTX 1070 Max-Q
82.7 ~ 76 fps
GeForce GTX 1070 Max-Q:
40.5 fps
GeForce GTX 1070 Max-Q:
196 196 208 [X] MSI GS63VR 7RG Intel Core i7-7700HQ 2.8GHz
GeForce GTX 1070 Max-Q
~ 200 fps
GeForce GTX 1070 Max-Q:
83.8 [X] MSI GS63VR 7RG Intel Core i7-7700HQ 2.8GHz
GeForce GTX 1070 Max-Q
fps
GeForce GTX 1070 Max-Q:
137 [X] MSI GS63VR 7RG Intel Core i7-7700HQ 2.8GHz
GeForce GTX 1070 Max-Q
fps
GeForce GTX 1070 Max-Q:
130 [X] MSI GS63VR 7RG Intel Core i7-7700HQ 2.8GHz
GeForce GTX 1070 Max-Q
132 138.7 140.8 ~ 135 fps
GeForce GTX 1070 Max-Q:
46.9 [X] MSI GS63VR 7RG Intel Core i7-7700HQ 2.8GHz
GeForce GTX 1070 Max-Q
48.1 ~ 48 fps
GeForce GTX 1070 Max-Q:
167.3 fps
GeForce GTX 1070 Max-Q:
106.4 fps
GeForce GTX 1070 Max-Q:
100.9 fps
GeForce GTX 1070 Max-Q:
89.9 fps
GeForce GTX 1070 Max-Q:
150.1 fps
GeForce GTX 1070 Max-Q:
110.8 fps
GeForce GTX 1070 Max-Q:
77.6 fps
GeForce GTX 1070 Max-Q:
68.5 fps
GeForce GTX 1070 Max-Q:
148.4 fps
GeForce GTX 1070 Max-Q:
86 fps
GeForce GTX 1070 Max-Q:
75.7 78.6 79.7 [X] MSI GS63VR 7RG Intel Core i7-7700HQ 2.8GHz
GeForce GTX 1070 Max-Q
~ 78 fps
GeForce GTX 1070 Max-Q:
42.8 43.7 45.4 [X] MSI GS63VR 7RG Intel Core i7-7700HQ 2.8GHz
GeForce GTX 1070 Max-Q
~ 44 fps
GeForce GTX 1070 Max-Q:
29 [X] MSI GS63VR 7RG Intel Core i7-7700HQ 2.8GHz
GeForce GTX 1070 Max-Q
fps
GeForce GTX 1070 Max-Q:
203.9 fps
GeForce GTX 1070 Max-Q:
128.6 fps
GeForce GTX 1070 Max-Q:
121 122.7 127 [X] MSI GS63VR 7RG Intel Core i7-7700HQ 2.8GHz
GeForce GTX 1070 Max-Q
~ 124 fps
GeForce GTX 1070 Max-Q:
93.4 [X] MSI GS63VR 7RG Intel Core i7-7700HQ 2.8GHz
GeForce GTX 1070 Max-Q
94.2 96 ~ 95 fps
GeForce GTX 1070 Max-Q:
39.1 [X] MSI GS63VR 7RG Intel Core i7-7700HQ 2.8GHz
GeForce GTX 1070 Max-Q
fps
GeForce GTX 1070 Max-Q:
135 138 [X] MSI GS63VR 7RG Intel Core i7-7700HQ 2.8GHz
GeForce GTX 1070 Max-Q
142 ~ 138 fps
GeForce GTX 1070 Max-Q:
116 [X] MSI GS63VR 7RG Intel Core i7-7700HQ 2.8GHz
GeForce GTX 1070 Max-Q
116 117 ~ 116 fps
GeForce GTX 1070 Max-Q:
38.6 [X] MSI GS63VR 7RG Intel Core i7-7700HQ 2.8GHz
GeForce GTX 1070 Max-Q
fps
GeForce GTX 1070 Max-Q:
68.8 71.1 [X] MSI GS63VR 7RG Intel Core i7-7700HQ 2.8GHz
GeForce GTX 1070 Max-Q
~ 70 fps
GeForce GTX 1070 Max-Q:
51.5 55.3 [X] MSI GS63VR 7RG Intel Core i7-7700HQ 2.8GHz
GeForce GTX 1070 Max-Q
~ 53 fps
GeForce GTX 1070 Max-Q:
28 [X] MSI GS63VR 7RG Intel Core i7-7700HQ 2.8GHz
GeForce GTX 1070 Max-Q
fps
GeForce GTX 1070 Max-Q:
79.5 81.2 [X] MSI GS63VR 7RG Intel Core i7-7700HQ 2.8GHz
GeForce GTX 1070 Max-Q
~ 80 fps
GeForce GTX 1070 Max-Q:
68 73.4 [X] MSI GS63VR 7RG Intel Core i7-7700HQ 2.8GHz
GeForce GTX 1070 Max-Q
~ 71 fps
GeForce GTX 1070 Max-Q:
115 [X] MSI GS63VR 7RG Intel Core i7-7700HQ 2.8GHz
GeForce GTX 1070 Max-Q
fps
GeForce GTX 1070 Max-Q:
106 [X] MSI GS63VR 7RG Intel Core i7-7700HQ 2.8GHz
GeForce GTX 1070 Max-Q
fps
GeForce GTX 1070 Max-Q:
52.4 [X] MSI GS63VR 7RG Intel Core i7-7700HQ 2.8GHz
GeForce GTX 1070 Max-Q
fps
GeForce GTX 1070 Max-Q:
118 [X] MSI GS63VR 7RG Intel Core i7-7700HQ 2.8GHz
GeForce GTX 1070 Max-Q
fps
GeForce GTX 1070 Max-Q:
104 [X] MSI GS63VR 7RG Intel Core i7-7700HQ 2.8GHz
GeForce GTX 1070 Max-Q
fps
GeForce GTX 1070 Max-Q:
37.4 [X] MSI GS63VR 7RG Intel Core i7-7700HQ 2.8GHz
GeForce GTX 1070 Max-Q
fps
GeForce GTX 1070 Max-Q:
123.2 fps
GeForce GTX 1070 Max-Q:
105.5 fps
GeForce GTX 1070 Max-Q:
91.5 106 108 [X] MSI GS63VR 7RG Intel Core i7-7700HQ 2.8GHz
GeForce GTX 1070 Max-Q
~ 102 fps
GeForce GTX 1070 Max-Q:
90.7 96.4 96.6 [X] MSI GS63VR 7RG Intel Core i7-7700HQ 2.8GHz
GeForce GTX 1070 Max-Q
~ 95 fps
GeForce GTX 1070 Max-Q:
38.9 [X] MSI GS63VR 7RG Intel Core i7-7700HQ 2.8GHz
GeForce GTX 1070 Max-Q
39.1 ~ 39 fps
GeForce GTX 1070 Max-Q:
51.6 51.8 [X] Smart7 Deimos GX15E G1 Intel Core i7-7700HQ 2.8GHz
GeForce GTX 1070 Max-Q
55.1 56 ~ 54 fps
GeForce GTX 1070 Max-Q:
20.6 fps
GeForce GTX 1070 Max-Q:
215 [X] MSI GS63VR 7RG Intel Core i7-7700HQ 2.8GHz
GeForce GTX 1070 Max-Q
fps
GeForce GTX 1070 Max-Q:
212 [X] MSI GS63VR 7RG Intel Core i7-7700HQ 2.8GHz
GeForce GTX 1070 Max-Q
fps
GeForce GTX 1070 Max-Q:
144 [X] MSI GS63VR 7RG Intel Core i7-7700HQ 2.8GHz
GeForce GTX 1070 Max-Q
fps
GeForce GTX 1070 Max-Q:
68.1 73.9 [X] MSI GS63VR 7RG Intel Core i7-7700HQ 2.8GHz
GeForce GTX 1070 Max-Q
~ 71 fps
GeForce GTX 1070 Max-Q:
37.9 40.4 [X] MSI GS63VR 7RG Intel Core i7-7700HQ 2.8GHz
GeForce GTX 1070 Max-Q
~ 39 fps
GeForce GTX 1070 Max-Q:
24.5 [X] MSI GS63VR 7RG Intel Core i7-7700HQ 2.8GHz
GeForce GTX 1070 Max-Q
fps
GeForce GTX 1070 Max-Q:
86.4 87.3 [X] MSI GS63VR 7RG Intel Core i7-7700HQ 2.8GHz
GeForce GTX 1070 Max-Q
~ 87 fps
GeForce GTX 1070 Max-Q:
78.6 80.2 [X] MSI GS63VR 7RG Intel Core i7-7700HQ 2.8GHz
GeForce GTX 1070 Max-Q
~ 79 fps
GeForce GTX 1070 Max-Q:
31.5 [X] MSI GS63VR 7RG Intel Core i7-7700HQ 2.8GHz
GeForce GTX 1070 Max-Q
fps
GeForce GTX 1070 Max-Q:
70.1 fps
GeForce GTX 1070 Max-Q:
115 [X] MSI GS63VR 7RG Intel Core i7-7700HQ 2.8GHz
GeForce GTX 1070 Max-Q
115 ~ 115 fps
GeForce GTX 1070 Max-Q:
106 112 [X] MSI GS63VR 7RG Intel Core i7-7700HQ 2.8GHz
GeForce GTX 1070 Max-Q
~ 109 fps
GeForce GTX 1070 Max-Q:
44.4 [X] MSI GS63VR 7RG Intel Core i7-7700HQ 2.8GHz
GeForce GTX 1070 Max-Q
fps
GeForce GTX 1070 Max-Q:
83.9 88.6 [X] MSI GS63VR 7RG Intel Core i7-7700HQ 2.8GHz
GeForce GTX 1070 Max-Q
~ 86 fps
GeForce GTX 1070 Max-Q:
65.3 72 [X] MSI GS63VR 7RG Intel Core i7-7700HQ 2.8GHz
GeForce GTX 1070 Max-Q
~ 69 fps
GeForce GTX 1070 Max-Q:
33.6 [X] MSI GS63VR 7RG Intel Core i7-7700HQ 2.8GHz
GeForce GTX 1070 Max-Q
fps
GeForce GTX 1070 Max-Q:
92 [X] MSI GS63VR 7RG Intel Core i7-7700HQ 2.8GHz
GeForce GTX 1070 Max-Q
fps
GeForce GTX 1070 Max-Q:
76 [X] MSI GS63VR 7RG Intel Core i7-7700HQ 2.8GHz
GeForce GTX 1070 Max-Q
fps
GeForce GTX 1070 Max-Q:
34 [X] MSI GS63VR 7RG Intel Core i7-7700HQ 2.8GHz
GeForce GTX 1070 Max-Q
fps
GeForce GTX 1070 Max-Q:
131.1 202.7 [X] Eurocom Q6 Intel Core i7-8750H 2.2GHz
GeForce GTX 1070 Max-Q
217.5 ~ 184 fps
GeForce GTX 1070 Max-Q:
126.7 166 166.2 [X] Eurocom Q6 Intel Core i7-8750H 2.2GHz
GeForce GTX 1070 Max-Q
~ 153 fps
GeForce GTX 1070 Max-Q:
85.7 97.7 97.8 [X] Eurocom Q6 Intel Core i7-8750H 2.2GHz
GeForce GTX 1070 Max-Q
100 [X] MSI GS63VR 7RG Intel Core i7-7700HQ 2.8GHz
GeForce GTX 1070 Max-Q
102.8 ~ 97 fps
GeForce GTX 1070 Max-Q:
77.1 79.7 80 [X] MSI GS63VR 7RG Intel Core i7-7700HQ 2.8GHz
GeForce GTX 1070 Max-Q
82.4 [X] Eurocom Q6 Intel Core i7-8750H 2.2GHz
GeForce GTX 1070 Max-Q
83.5 85.1 85.9 ~ 82 fps
GeForce GTX 1070 Max-Q:
32.1 33.6 36 [X] MSI GS63VR 7RG Intel Core i7-7700HQ 2.8GHz
GeForce GTX 1070 Max-Q
~ 34 fps
GeForce GTX 1070 Max-Q:
161 168 [X] MSI GS63VR 7RG Intel Core i7-7700HQ 2.8GHz
GeForce GTX 1070 Max-Q
~ 165 fps
GeForce GTX 1070 Max-Q:
143 144 [X] MSI GS63VR 7RG Intel Core i7-7700HQ 2.8GHz
GeForce GTX 1070 Max-Q
~ 144 fps
GeForce GTX 1070 Max-Q:
54.4 [X] MSI GS63VR 7RG Intel Core i7-7700HQ 2.8GHz
GeForce GTX 1070 Max-Q
fps
GeForce GTX 1070 Max-Q:
136 [X] MSI GS63VR 7RG Intel Core i7-7700HQ 2.8GHz
GeForce GTX 1070 Max-Q
fps
GeForce GTX 1070 Max-Q:
121 [X] MSI GS63VR 7RG Intel Core i7-7700HQ 2.8GHz
GeForce GTX 1070 Max-Q
fps
GeForce GTX 1070 Max-Q:
44.7 [X] MSI GS63VR 7RG Intel Core i7-7700HQ 2.8GHz
GeForce GTX 1070 Max-Q
fps
GeForce GTX 1070 Max-Q:
78.8 [X] MSI GS63VR 7RG Intel Core i7-7700HQ 2.8GHz
GeForce GTX 1070 Max-Q
fps
GeForce GTX 1070 Max-Q:
43.6 [X] MSI GS63VR 7RG Intel Core i7-7700HQ 2.8GHz
GeForce GTX 1070 Max-Q
fps
GeForce GTX 1070 Max-Q:
33.4 [X] MSI GS63VR 7RG Intel Core i7-7700HQ 2.8GHz
GeForce GTX 1070 Max-Q
fps
GeForce GTX 1070 Max-Q:
34.3 fps
GeForce GTX 1070 Max-Q:
205.4 fps
GeForce GTX 1070 Max-Q:
169.8 fps
GeForce GTX 1070 Max-Q:
146.3 fps
GeForce GTX 1070 Max-Q:
140.7 fps
GeForce GTX 1070 Max-Q:
60 fps
GeForce GTX 1070 Max-Q:
60 60 60 ~ 60 fps
GeForce GTX 1070 Max-Q:
59 fps
GeForce GTX 1070 Max-Q:
126.9 fps
GeForce GTX 1070 Max-Q:
118.2 fps
GeForce GTX 1070 Max-Q:
111.7 fps
GeForce GTX 1070 Max-Q:
109.7 fps
GeForce GTX 1070 Max-Q:
94 [X] Smart7 Deimos GX15E G1 Intel Core i7-7700HQ 2.8GHz
GeForce GTX 1070 Max-Q
106 111 112 [X] MSI GS63VR 7RG Intel Core i7-7700HQ 2.8GHz
GeForce GTX 1070 Max-Q
~ 106 fps
GeForce GTX 1070 Max-Q:
56 64 [X] Smart7 Deimos GX15E G1 Intel Core i7-7700HQ 2.8GHz
GeForce GTX 1070 Max-Q
73 [X] MSI GS63VR 7RG Intel Core i7-7700HQ 2.8GHz
GeForce GTX 1070 Max-Q
73 79 ~ 69 fps
GeForce GTX 1070 Max-Q:
37 40 [X] MSI GS63VR 7RG Intel Core i7-7700HQ 2.8GHz
GeForce GTX 1070 Max-Q
~ 39 fps
GeForce GTX 1070 Max-Q:
71.2 [X] Smart7 Deimos GX15E G1 Intel Core i7-7700HQ 2.8GHz
GeForce GTX 1070 Max-Q
89.9 90.3 90.4 91.3 91.6 92.8 93.2 94.5 95.5 96 97 [X] Eurocom Q6 Intel Core i7-8750H 2.2GHz
GeForce GTX 1070 Max-Q
97.1 [X] MSI GS63VR 7RG Intel Core i7-7700HQ 2.8GHz
GeForce GTX 1070 Max-Q
97.7 98.2 99.4 100 [X] Asus Zephyrus S GX531GS Turbo Mode Intel Core i7-8750H 2.2GHz
GeForce GTX 1070 Max-Q
101.6 ~ 94 fps
GeForce GTX 1070 Max-Q:
27.7 35.4 [X] MSI GS63VR 7RG Intel Core i7-7700HQ 2.8GHz
GeForce GTX 1070 Max-Q
~ 32 fps
GeForce GTX 1070 Max-Q:
166.7 fps
GeForce GTX 1070 Max-Q:
159.8 fps
GeForce GTX 1070 Max-Q:
145.9 fps
GeForce GTX 1070 Max-Q:
64.6 fps
GeForce GTX 1070 Max-Q:
70.8 [X] Smart7 Deimos GX15E G1 Intel Core i7-7700HQ 2.8GHz
GeForce GTX 1070 Max-Q
fps
GeForce GTX 1070 Max-Q:
68.3 [X] Smart7 Deimos GX15E G1 Intel Core i7-7700HQ 2.8GHz
GeForce GTX 1070 Max-Q
93.3 95.1 98.8 ~ 89 fps
GeForce GTX 1070 Max-Q:
170.4 [X] Smart7 Deimos GX15E G1 Intel Core i7-7700HQ 2.8GHz
GeForce GTX 1070 Max-Q
fps
GeForce GTX 1070 Max-Q:
72.8 [X] Smart7 Deimos GX15E G1 Intel Core i7-7700HQ 2.8GHz
GeForce GTX 1070 Max-Q
fps
GeForce GTX 1070 Max-Q:
161.5 188.4 [X] Smart7 Deimos GX15E G1 Intel Core i7-7700HQ 2.8GHz
GeForce GTX 1070 Max-Q
194.4 204.7 230.8 [X] Eurocom Q6 Intel Core i7-8750H 2.2GHz
GeForce GTX 1070 Max-Q
242.8 256 ~ 211 fps
GeForce GTX 1070 Max-Q:
62.2 70 ~ 66 fps
Quadro FX 880M:
129.2 [X] Fujitsu Celsius H700 LKN:H7000WF011PL Intel Core i7-840QM 1.9GHz
Quadro FX 880M
fps
Quadro FX 880M:
90.5 [X] Fujitsu Celsius H700 LKN:H7000WF011PL Intel Core i7-840QM 1.9GHz
Quadro FX 880M
fps
Quadro FX 880M:
50.4 [X] Fujitsu Celsius H700 LKN:H7000WF011PL Intel Core i7-840QM 1.9GHz
Quadro FX 880M
fps
Quadro FX 880M:
29.8 33.4 [X] Fujitsu Celsius H700 LKN:H7000WF011PL Intel Core i7-840QM 1.9GHz
Quadro FX 880M
~ 32 fps
Quadro FX 880M:
18.2 20.6 [X] Fujitsu Celsius H700 LKN:H7000WF011PL Intel Core i7-840QM 1.9GHz
Quadro FX 880M
~ 19 fps
Quadro FX 880M:
12.7 [X] Fujitsu Celsius H700 LKN:H7000WF011PL Intel Core i7-840QM 1.9GHz
Quadro FX 880M
fps
Quadro FX 880M:
45.7 [X] Fujitsu Celsius H700 LKN:H7000WF011PL Intel Core i7-840QM 1.9GHz
Quadro FX 880M
47.8 ~ 47 fps
Quadro FX 880M:
20 [X] Fujitsu Celsius H700 LKN:H7000WF011PL Intel Core i7-840QM 1.9GHz
Quadro FX 880M
39 ~ 30 fps
Quadro FX 880M:
59.7 60 131 147.3 [X] Fujitsu Celsius H700 LKN:H7000WF011PL Intel Core i7-840QM 1.9GHz
Quadro FX 880M
~ 100 fps
Quadro FX 880M:
19 19.1 20.5 23 [X] Fujitsu Celsius H700 LKN:H7000WF011PL Intel Core i7-840QM 1.9GHz
Quadro FX 880M
~ 20 fps
100%
Quadro FX 370M:
97 fps
100%
Quadro FX 370M:
97.1 fps
100%
Quadro FX 370M:
65.4 fps
100%
Quadro FX 370M:
39.9 fps
Average Gaming NVIDIA Quadro FX 370M → 100% Average Gaming 30-70 fps → 100%
NVIDIA Quadro FX 880M low med. high ultra QHD 4K Fifa 11 129.2 90.5 50.4 StarCraft 2 155 42 29 12 Battlefield: Bad Company 2 58.8 30.4 16.1 9.7 CoD Modern Warfare 2 124.1 42.2 35.4 21 Risen 75.4 32 19 12.7 Colin McRae: DIRT 2 79.3 47 30 12.8 Anno 1404 100 20 F.E.A.R. 2 179.6 65.9 42.3 Far Cry 2 93.3 32.39 Racedriver: GRID 48.7 28.9 Call of Duty 4 - Modern Warfare 225.7 60 59.9 Supreme Commander - FA Bench 29.92 28.18 < 30 fps < 60 fps < 120 fps ≥ 120 fps 1 4 4 1 6 2 1 5 5 1 6 1
NVIDIA Quadro FX 370M low med. high ultra QHD 4K Doom 3 97 97.1 65.4 39.9 < 30 fps < 60 fps < 120 fps ≥ 120 fps 1 1 1 1
v1.28
log 14. 05:26:09
#0 ran 0s before starting gpusingle class +0s ... 0s
#1 checking url part for id 1054 +0s ... 0s
#2 checking url part for id 8008 +0s ... 0s
#3 checking url part for id 1621 +0s ... 0s
#4 redirected to Ajax server, took 1731558369s time from redirect:0 +0s ... 0s
#5 did not recreate cache, as it is less than 5 days old! Created at Wed, 13 Nov 2024 05:16:40 +0100 +0s ... 0s
#6 composed specs +0.004s ... 0.005s
#7 did output specs +0s ... 0.005s
#8 start showIntegratedCPUs +0s ... 0.005s
#9 getting avg benchmarks for device 1054 +0.011s ... 0.016s
#10 got single benchmarks 1054 +0s ... 0.016s
#11 getting avg benchmarks for device 8008 +0.002s ... 0.018s
#12 got single benchmarks 8008 +0.002s ... 0.02s
#13 getting avg benchmarks for device 1621 +0s ... 0.021s
#14 got single benchmarks 1621 +0.007s ... 0.028s
#15 got avg benchmarks for devices +0s ... 0.028s
#16 min, max, avg, median took s +0.04s ... 0.068s
#17 before gaming benchmark output +0s ... 0.068s
#18 Got 541 rows for game benchmarks. +0.026s ... 0.094s
#19 composed SQL query for gamebenchmarks +0s ... 0.094s
#20 got data and put it in $dataArray +0.005s ... 0.099s
#21 benchmarks composed for output. +0.029s ... 0.128s
#22 calculated avg scores. +0s ... 0.128s
#23 return log +0.001s ... 0.129s
Teilen Sie diesen Artikel, um uns zu unterstützen. Jeder Link hilft!
Autor: Klaus Hinum, 8.09.2017 (Update: 1.07.2023)