Notebookcheck Logo

NVIDIA Quadro FX 2800M vs NVIDIA GeForce GTX 1050 (Desktop) vs NVIDIA Quadro FX 370M

NVIDIA Quadro FX 2800M

► remove from comparison NVIDIA Quadro FX 2800M
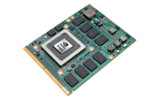
Die Nvidia Quadro FX 2800M ist eine mobile Grafikkarte für Workstation-Laptops. Sie basiert auf die selbe Architektur wie die GeForce 9800M GT, bietet jedoch eine höheren Kerntakt.

Die zertifizierten Treiber der Quadro FX Serie sorgen für eine optimierten Stabilität, Kompatibilität und Performance bei Professionellen Anwendungen (CAD-, DCC-, Medizin- und Prospektionsanwendungen). Besonders die OpenGL Performance soll bei den Quadro FX Karten im Vergleich zu GeForce Modellen deutlich besser sein.

Die Quadro FX2800M wird in mobilen Workstations, wie etwa dem Dell M6500 eingesetzt und unterstützt DirectX 10.0 und OpenGL 2.1. Sie kann maximal zwei Displays ansteuern (DisplayPort bis 2560x1600, HDMI/DVI bis 1920x1200). Dell gibt einen TDP von 65 Watt (Nvidia 75 Watt) an. Eventuell wird die FX2800M daher schon in 55nm gefertigt.

Durch den maximalen Stromverbrauch von 65/75 Watt (Idle 10 Watt) eignet sich die Grafikkarte nur für große und schwere Notebooks (minimal 15").

NVIDIA GeForce GTX 1050 (Desktop)

► remove from comparison NVIDIA GeForce GTX 1050 (Desktop)

Die Nvidia GeForce GTX 1050 ist Einstiegs-Desktop-Grafikkarte basierend auf den GP107 Chip der Pascal Architektur. Sie wird in 14nm FinFET bei Samsung gefertigt (im Unterschied zu den schnelleren Pascal Chips wie 1060). Die GTX 1050 ist mit dem selben TDP von 75 Watt wie die 1050 Ti spezifiziert, hat jedoch nur 640 statt 768 Shader und 2 statt 4 GB GDDR5. Die Desktop Variante wurde am 25. Okt. 2016 vorgestellt, die mobile Version (GTX 1050 für Laptops) soll jedoch erst später erscheinen (Anfang 2017).

Die Leistung soll in Spielen laut Nvidia rund 30% vor der Radeon RX 460 mit 2GB VRAM liegen. Die 4 GB RX 460 sollte daher nur etwa 10 % langsamer sein und die alte GTX 950 etwa gleich schnell wie die GTX 1050. Dadurch eignet sich die Grafikkarte am besten für 1920x1080 bei hohen (aber nicht maximalen) Details in aktuellen Spielen.

NVIDIA Quadro FX 370M

► remove from comparison NVIDIA Quadro FX 370M
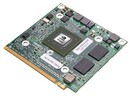
Die nVidia Quadro FX 370M ist eine Einsteiger Grafiklösung für mobile Workstations (Notebooks). Sie basiert auf den selben Kern wie die NVS 160M bzw. Consumer GeForce 9200M / 9300M GS. Die Treiber sind optimiert für CAD, DCC und Visualisierungsanwendungen und zeigen eine deutlich höhere OpenGL Leistung als bei den Consumer Grafikkarten. Ausserdem sind die Treiber für viele Anwendungen zertifiziert.

Die Spieleperformance der professionellen Grafikkarte für Laptops ist ähnlich zur 9200M / 9300M GS. Dadurch reicht die Spiele bzw 3D Performance nur für ältere Spiele bzw. Anwendungen mit geringen Anforderungen.

Wie auch die 9300M GS unterstützt die Quadro FX 370M PureVideo HD zur Dekodierung von (HD) Videos. Dadurch wird die CPU bei dieser Aufgabe entlastet.

Die Speichertaktung ist je nach eingesetzem Speicher unterschiedlich. GDDR3 Speicher wird mit 700 MHz getaktet, GDDR2 mit jediglich 400 MHz. Dies führt auch zu einer spürbar geringeren Leistung mit GDDR2.

Im getesteten Dell Precision M2400 war die Karte nur mit GDDR2 Grafikspeicher ausgestattet, welcher nur mit 400 MHz getaktet wird. Alte Spiele sollten ausreichend schnell laufen (Doom3 z.b. in der höchsten Qualitätsstufe mit knapp 40 fps). Moderne nur eingeschränkt (Unreal Tournament 3 z.B. nur in 800x600 in niedrigster Detailstufe). Laut Dell braucht die Karte mit speicher maximal 20 Watt (TDP).

NVIDIA Quadro FX 2800MNVIDIA GeForce GTX 1050 (Desktop)NVIDIA Quadro FX 370M
Quadro FX Serie
Quadro FX 3800M 128 @ 0.68 GHz256 Bit @ 1000 MHz
Quadro FX 3700M 128 @ 0.55 GHz256 Bit @ 800 MHz
Quadro FX 2800M 96 @ 0.6 GHz256 Bit @ 1000 MHz
Quadro FX 3600M 96 @ 0.5 GHz256 Bit @ 800 MHz
Quadro FX 1800M 72 @ 0.56 GHz128 Bit @ 1100 MHz
Quadro FX 2700M 48 @ 0.53 GHz256 Bit @ 800 MHz
Quadro FX 880M 48 @ 0.55 GHz128 Bit @ 790 MHz
Quadro FX 3500M 24/8 cores @ 0.58 GHz256 Bit @ 700 MHz
Quadro FX 2500M 24/8 cores @ 0.5 GHz256 Bit @ 600 MHz
Quadro FX 1700M 32 @ 0.63 GHz128 Bit @ 800 MHz
Quadro FX 1600M 32 @ 0.63 GHz128 Bit @ 800 MHz
Quadro FX 1500M 20/7 cores @ 0.38 GHz256 Bit @ 500 MHz
Quadro FX 770M 32 @ 0.5 GHz128 Bit @ 800 MHz
Quadro FX 570M 32 @ 0.48 GHz128 Bit @ 700 MHz
Quadro FX 380M 16 @ 0.63 GHz64 Bit @ 800 MHz
Quadro FX 370M 8 @ 0.58 GHz64 Bit @ 700 MHz
Quadro FX 360M 16 @ 0.4 GHz64 Bit @ 600 MHz
Quadro FX 350M 4/3 cores @ 0.45 GHz64 Bit @ 350 MHz
GeForce GTX 1080 Ti 3584 @ 1.48 - 1.6 GHz352 Bit @ 11000 MHz
GeForce GTX 1080 SLI (Laptop) 5120 @ 1.56 - 1.73 GHz256 Bit @ 10000 MHz
GeForce GTX 1070 SLI (Desktop) 3840 @ 1.51 - 1.68 GHz256 Bit @ 8000 MHz
GeForce GTX 1070 SLI (Laptop) 4096 @ 1.44 - 1.65 GHz256 Bit @ 8000 MHz
GeForce GTX 1080 (Desktop) 2560 @ 1.61 - 1.73 GHz256 Bit @ 10000 MHz
GeForce GTX 1080 Mobile 2560 @ 1.57 - 1.73 GHz256 Bit @ 10000 MHz
GeForce GTX 1070 Ti (Desktop) 2432 @ 1.61 - 1.68 GHz256 Bit @ 8000 MHz
GeForce GTX 1070 (Desktop) 1920 @ 1.51 - 1.68 GHz256 Bit @ 8000 MHz
GeForce GTX 1080 Max-Q 2560 @ 1.1 - 1.28 GHz256 Bit @ 10000 MHz
GeForce GTX 1070 Mobile 2048 @ 1.44 - 1.65 GHz256 Bit @ 8000 MHz
GeForce GTX 1070 Max-Q 2048 @ 1.1 - 1.27 GHz256 Bit @ 8000 MHz
GeForce GTX 1060 (Desktop) 1280 @ 1.51 - 1.71 GHz192 Bit @ 8000 MHz
GeForce GTX 1060 Mobile 1280 @ 1.4 - 1.67 GHz192 Bit @ 8000 MHz
GeForce GTX 1060 Max-Q 1280 @ 1.06 - 1.34 GHz192 Bit @ 8000 MHz
GeForce GTX 1050 Ti Mobile 768 @ 1.49 - 1.62 GHz128 Bit @ 7000 MHz
GeForce GTX 1050 Ti (Desktop) 768 @ 1.29 - 1.39 GHz128 Bit @ 7008 MHz
GeForce GTX 1050 Ti Max-Q 768 @ 1.15 - 1.29 GHz128 Bit @ 7000 MHz
GeForce GTX 1050 (Desktop) 640 @ 1.35 - 1.46 GHz128 Bit @ 7008 MHz
GeForce GTX 1050 Mobile 640 @ 1.35 - 1.49 GHz128 Bit @ 7000 MHz
GeForce GTX 1050 Max-Q 640 @ 1 - 1.14 GHz128 Bit @ 7000 MHz
GeForce GT 1030 (Desktop) 384 @ 1.23 - 1.67 GHz64 Bit @ 6000 MHz
Quadro FX 3800M 128 @ 0.68 GHz256 Bit @ 1000 MHz
Quadro FX 3700M 128 @ 0.55 GHz256 Bit @ 800 MHz
Quadro FX 2800M 96 @ 0.6 GHz256 Bit @ 1000 MHz
Quadro FX 3600M 96 @ 0.5 GHz256 Bit @ 800 MHz
Quadro FX 1800M 72 @ 0.56 GHz128 Bit @ 1100 MHz
Quadro FX 2700M 48 @ 0.53 GHz256 Bit @ 800 MHz
Quadro FX 880M 48 @ 0.55 GHz128 Bit @ 790 MHz
Quadro FX 3500M 24/8 cores @ 0.58 GHz256 Bit @ 700 MHz
Quadro FX 2500M 24/8 cores @ 0.5 GHz256 Bit @ 600 MHz
Quadro FX 1700M 32 @ 0.63 GHz128 Bit @ 800 MHz
Quadro FX 1600M 32 @ 0.63 GHz128 Bit @ 800 MHz
Quadro FX 1500M 20/7 cores @ 0.38 GHz256 Bit @ 500 MHz
Quadro FX 770M 32 @ 0.5 GHz128 Bit @ 800 MHz
Quadro FX 570M 32 @ 0.48 GHz128 Bit @ 700 MHz
Quadro FX 380M 16 @ 0.63 GHz64 Bit @ 800 MHz
Quadro FX 370M 8 @ 0.58 GHz64 Bit @ 700 MHz
Quadro FX 360M 16 @ 0.4 GHz64 Bit @ 600 MHz
Quadro FX 350M 4/3 cores @ 0.45 GHz64 Bit @ 350 MHz
CodenameNB10-GLM3N17P-G1NB9M-GLM
ArchitekturG9xPascal
Pipelines96 - unified640 - unified8 - unified
Kerntakt600 MHz1354 - 1455 (Boost) MHz580 MHz
Shadertakt1500 MHz1450 MHz
Speichertakt1000 MHz7008 MHz700 MHz
Speicherbandbreite256 Bit128 Bit64 Bit
SpeichertypGDDR3GDDR5GDDR2, GDDR3
Max. Speichergröße1024 MB2048 MB256 MB
Shared Memoryneinneinnein
APIDirectX 10, Shader 4.0DirectX 12_1, OpenGL 4.5DirectX 10, Shader 4.0
Stromverbrauch75 Watt20 Watt
Transistors754 Million
Herstellungsprozess55 nm14 nm65 nm
FeaturesOpenGL 2.1, CUDA, PowerMizer 8.0Multi-Projection, VR Ready, G-SYNC, Vulkan, Multi Monitor
Notebookgrößegroß (17" z.B.)
Erscheinungsdatum01.12.2009 25.10.2016 15.08.2008
Herstellerseitewww.nvidia.comwww.nvidia.com
InformationenOpenGL 2.1, max. 1920x1200 (digital) bzw 2048x1536 (analog), max. 2 unabhängige Displays, PCI-Express x16, optionale Interfaces (des Chips): DP, VGA, DVI, LVDS, HDMI

Benchmarks

3DMark - 3DMark Time Spy Score
1984 Points (6%)
3DMark - 3DMark Time Spy Graphics
1797 Points (5%)
3DMark - 3DMark Ice Storm Unlimited Graphics
349683 Points (35%)
3DMark - 3DMark Cloud Gate Score
21461 Points (20%)
3DMark - 3DMark Cloud Gate Graphics
40922 Points (10%)
3DMark - 3DMark Fire Strike Standard Score
6122 Points (10%)
3DMark - 3DMark Fire Strike Standard Graphics
6797 Points (8%)
3DMark 11 - 3DM11 Performance Score
8817 Points (11%)
3DMark 11 - 3DM11 Performance GPU
8571 Points (7%)
3DMark Vantage
3DM Vant. Perf. total + NVIDIA Quadro FX 2800M
3DMark Vantage - 3DM Vant. Perf. total
min: 5779     avg: 5783     median: 5783 (2%)     max: 5787 Points
3DM Vant. Perf. total + NVIDIA GeForce GTX 1050 (Desktop)
32463 Points (9%)
3DM Vant. Perf. GPU no PhysX + NVIDIA Quadro FX 2800M
3DMark Vantage - 3DM Vant. Perf. GPU no PhysX
min: 5000     avg: 5037     median: 5037 (3%)     max: 5074 Points
3DM Vant. Perf. GPU no PhysX + NVIDIA GeForce GTX 1050 (Desktop)
32494 Points (18%)
3DMark 2001SE - 3DMark 2001 - Standard
34844 Points (36%)
96234 Points (100%)
13622 Points (14%)
3DMark 03 - 3DMark 03 - Standard
33900 Points (18%)
5532 Points (3%)
3DMark 05 - 3DMark 05 - Standard
min: 16310     avg: 16936     median: 16935.5 (19%)     max: 17561 Points
3290 Points (4%)
3DMark 06 3DMark 06 - Standard 1280x1024 + NVIDIA Quadro FX 2800M
3DMark 06
min: 11162     avg: 11359     median: 11358.5 (15%)     max: 11555 Points
3DMark 06 - Standard 1280x1024 + NVIDIA GeForce GTX 1050 (Desktop)
min: 28000     avg: 30921     median: 29795 (39%)     max: 36095 Points
3DMark 06 - Standard 1280x1024 + NVIDIA Quadro FX 370M
1595 Points (2%)
Unigine Valley 1.0 - Unigine Valley 1.0 DX
37.6 fps (11%)
Unigine Heaven 3.0 - Unigine Heaven 3.0 DX 11
88.3 fps (29%)
Blender - Blender 3.3 Classroom CUDA *
271 Seconds (40%)
SPEC Viewperf 10.0 - SPEC Viewperf 10.0 - 3dsmax
32.3 Points (67%)
12.3 Points (26%)
SPEC Viewperf 10.0 - SPEC Viewperf 10.0 - Catia
39 Points (82%)
16.8 Points (35%)
SPEC Viewperf 10.0 - SPEC Viewperf 10.0 - EnSight
44 Points (93%)
12 Points (25%)
SPEC Viewperf 10.0 - SPEC Viewperf 10.0 - Maya
59.6 Points (32%)
27.3 Points (15%)
SPEC Viewperf 10.0 - SPEC Viewperf 10.0 - Pro/Engeneer
42.6 Points (83%)
13.7 Points (27%)
SPEC Viewperf 10.0 - SPEC Viewperf 10.0 - SolidWorks
59.5 Points (88%)
21.8 Points (32%)
SPEC Viewperf 10.0 - SPEC Viewperf 10.0 - UGS Teamcenter
35.2 Points (91%)
6.8 Points (18%)
SPEC Viewperf 10.0 - SPEC Viewperf 10.0 - UGS NX
31.3 Points (64%)
5.1 Points (10%)
SPECviewperf 11
specvp11 snx-01 + NVIDIA Quadro FX 2800M
SPECviewperf 11 - specvp11 snx-01
min: 13.58     avg: 14.7     median: 13.9 (8%)     max: 16.55 fps
specvp11 tcvis-02 + NVIDIA Quadro FX 2800M
SPECviewperf 11 - specvp11 tcvis-02
min: 15.1     avg: 16     median: 15.3 (9%)     max: 17.4 fps
specvp11 sw-02 + NVIDIA Quadro FX 2800M
SPECviewperf 11 - specvp11 sw-02
min: 6.73     avg: 14.1     median: 7.5 (6%)     max: 28 fps
specvp11 proe-05 + NVIDIA Quadro FX 2800M
SPECviewperf 11 - specvp11 proe-05
min: 4.67     avg: 5.1     median: 4.7 (6%)     max: 5.89 fps
specvp11 maya-03 + NVIDIA Quadro FX 2800M
SPECviewperf 11 - specvp11 maya-03
min: 6.2     avg: 7     median: 7.4 (6%)     max: 7.5 fps
specvp11 lightwave-01 + NVIDIA Quadro FX 2800M
SPECviewperf 11 - specvp11 lightwave-01
min: 7.99     avg: 16.2     median: 8.5 (9%)     max: 32 fps
specvp11 ensight-04 + NVIDIA Quadro FX 2800M
SPECviewperf 11 - specvp11 ensight-04
min: 10.8     avg: 11.9     median: 11.1 (5%)     max: 13.7 fps
specvp11 catia-03 + NVIDIA Quadro FX 2800M
SPECviewperf 11 - specvp11 catia-03
min: 9.53     avg: 13.4     median: 9.7 (5%)     max: 20.92 fps
SPECviewperf 12
specvp12 sw-03 + NVIDIA GeForce GTX 1050 (Desktop)
SPECviewperf 12 - specvp12 sw-03
37.8 fps (9%)
specvp12 snx-02 + NVIDIA GeForce GTX 1050 (Desktop)
SPECviewperf 12 - specvp12 snx-02
4.7 fps (1%)
specvp12 showcase-01 + NVIDIA GeForce GTX 1050 (Desktop)
SPECviewperf 12 - specvp12 showcase-01
29.3 fps (6%)
specvp12 mediacal-01 + NVIDIA GeForce GTX 1050 (Desktop)
SPECviewperf 12 - specvp12 mediacal-01
17.5 fps (4%)
specvp12 maya-04 + NVIDIA GeForce GTX 1050 (Desktop)
SPECviewperf 12 - specvp12 maya-04
57.8 fps (16%)
specvp12 energy-01 + NVIDIA GeForce GTX 1050 (Desktop)
SPECviewperf 12 - specvp12 energy-01
0.8 fps (1%)
specvp12 creo-01 + NVIDIA GeForce GTX 1050 (Desktop)
SPECviewperf 12 - specvp12 creo-01
18.2 fps (7%)
specvp12 catia-04 + NVIDIA GeForce GTX 1050 (Desktop)
SPECviewperf 12 - specvp12 catia-04
28.2 fps (5%)
Windows Vista Experience Index - Windows Vista Leistungsindex - Grafik (Spiele)
6.8 Points (100%)
Windows Vista Experience Index - Windows Vista Leistungsindex - Grafik
6.8 Points (100%)
Cinebench R10 Cinebench R10 Shading (32bit) + NVIDIA Quadro FX 370M
Cinebench R10 - Cinebench R10 Shading (32bit)
3031 Points (2%)
Cinebench R11.5 Cinebench R11.5 OpenGL 64 Bit + NVIDIA Quadro FX 2800M
Cinebench R11.5 - Cinebench R11.5 OpenGL 64 Bit
min: 28.16     avg: 28.8     median: 28.8 (9%)     max: 29.36 fps
Cinebench R15
Cinebench R15 OpenGL 64 Bit + NVIDIA GeForce GTX 1050 (Desktop)
Cinebench R15 - Cinebench R15 OpenGL 64 Bit
min: 109     avg: 132     median: 132 (8%)     max: 155 fps
Cinebench R15 OpenGL Ref. Match 64 Bit + NVIDIA GeForce GTX 1050 (Desktop)
Cinebench R15 - Cinebench R15 OpenGL Ref. Match 64 Bit
99.6 % (100%)
GFXBench - GFXBench Car Chase Offscreen
137.6 fps (15%)
GFXBench 3.1 - GFXBench Manhattan ES 3.1 Offscreen
200 fps (4%)
GFXBench 3.0 - GFXBench 3.0 Manhattan Offscreen
268 fps (16%)
GFXBench (DX / GLBenchmark) 2.7
GFXBench T-Rex HD Offscreen C24Z16 + NVIDIA GeForce GTX 1050 (Desktop)
GFXBench (DX / GLBenchmark) 2.7 - GFXBench T-Rex HD Offscreen C24Z16
472 fps (4%)
Basemark GPU 1.2 - Basemark GPU 1.2 Vulkan Official Medium Offscreen 1080
105 fps (1%)
LuxMark v2.0 64Bit - LuxMark v2.0 Room GPU
1037 Samples/s (4%)
LuxMark v2.0 64Bit - LuxMark v2.0 Sala GPU
1864 Samples/s (3%)
ComputeMark v2.1 - ComputeMark v2.1 Result
4749 Points (5%)
Power Consumption - Furmark Stress Test Power Consumption - external Monitor *
152 Watt (22%)
Power Consumption - The Witcher 3 Power Consumption - external Monitor *
155 Watt (22%)
Power Consumption - Witcher 3 ultra Power Efficiency - external Monitor
0.2 fps per Watt (13%)

Average Benchmarks NVIDIA Quadro FX 2800M → 100% n=2

Average Benchmarks NVIDIA GeForce GTX 1050 (Desktop) → 269% n=2

Average Benchmarks NVIDIA Quadro FX 370M → 27% n=2

- Bereich der Benchmarkergebnisse für diese Grafikkarte
- Durchschnittliche Benchmarkergebnisse für diese Grafikkarte
* Smaller numbers mean a higher performance
1 This benchmark is not used for the average calculation

Spiele-Benchmarks

Die folgenden Benchmarks basieren auf unseren Spieletests mit Testnotebooks. Die Performance dieser Grafikkarte bei den gelisteten Spielen ist abhängig von der verwendeten CPU, Speicherausstattung, Treiber und auch Betriebssystem. Dadurch müssen die untenstehenden Werte nicht repräsentativ sein. Detaillierte Informationen über das verwendete System sehen Sie nach einem Klick auf den fps-Wert.

med. 1920x1080
GeForce GTX 1050 (Desktop):
8  fps
high 1920x1080
GeForce GTX 1050 (Desktop):
5  fps
low 1920x1080
GeForce GTX 1050 (Desktop):
10.7  fps
med. 1920x1080
GeForce GTX 1050 (Desktop):
6 6 ~ 6 fps
F1 22

F1 22

2022
low 1920x1080
GeForce GTX 1050 (Desktop):
55.3  fps
med. 1920x1080
GeForce GTX 1050 (Desktop):
48.5  fps
high 1920x1080
GeForce GTX 1050 (Desktop):
31.6  fps
med. 1920x1080
GeForce GTX 1050 (Desktop):
16.4  fps
high 1920x1080
GeForce GTX 1050 (Desktop):
13.2  fps
QHD 2560x1440
GeForce GTX 1050 (Desktop):
9.6  fps
med. 1920x1080
GeForce GTX 1050 (Desktop):
18.3  fps
low 1280x720
GeForce GTX 1050 (Desktop):
0 (!)  fps
low 1280x720
GeForce GTX 1050 (Desktop):
32.1  fps
low 1280x720
GeForce GTX 1050 (Desktop):
47.1  fps
med. 1920x1080
GeForce GTX 1050 (Desktop):
19.2  fps
high 1920x1080
GeForce GTX 1050 (Desktop):
12.1  fps
ultra 1920x1080
GeForce GTX 1050 (Desktop):
5.5  fps
F1 2020

F1 2020

2020
low 1280x720
GeForce GTX 1050 (Desktop):
133  fps
med. 1920x1080
GeForce GTX 1050 (Desktop):
62  fps
high 1920x1080
GeForce GTX 1050 (Desktop):
40.8  fps
ultra 1920x1080
GeForce GTX 1050 (Desktop):
25.9  fps
low 1280x720
GeForce GTX 1050 (Desktop):
177  fps
med. 1920x1080
GeForce GTX 1050 (Desktop):
62.2  fps
high 1920x1080
GeForce GTX 1050 (Desktop):
38.2  fps
ultra 1920x1080
GeForce GTX 1050 (Desktop):
30.7  fps
QHD 2560x1440
GeForce GTX 1050 (Desktop):
19  fps
low 1280x720
GeForce GTX 1050 (Desktop):
52.5  fps
med. 1920x1080
GeForce GTX 1050 (Desktop):
39.3  fps
high 1920x1080
GeForce GTX 1050 (Desktop):
31.3  fps
ultra 1920x1080
GeForce GTX 1050 (Desktop):
28.2  fps
low 1280x720
GeForce GTX 1050 (Desktop):
115  fps
med. 1920x1080
GeForce GTX 1050 (Desktop):
63.9  fps
high 1920x1080
GeForce GTX 1050 (Desktop):
50.5  fps
ultra 1920x1080
GeForce GTX 1050 (Desktop):
29.9  fps
QHD 2560x1440
GeForce GTX 1050 (Desktop):
19.8  fps
low 1280x720
GeForce GTX 1050 (Desktop):
65  fps
med. 1920x1080
GeForce GTX 1050 (Desktop):
30.5  fps
high 1920x1080
GeForce GTX 1050 (Desktop):
18.5  fps
ultra 1920x1080
GeForce GTX 1050 (Desktop):
0 (!)  fps
low 1280x720
GeForce GTX 1050 (Desktop):
56.6  fps
med. 1920x1080
GeForce GTX 1050 (Desktop):
33.9  fps
high 1920x1080
GeForce GTX 1050 (Desktop):
30.7  fps
ultra 1920x1080
GeForce GTX 1050 (Desktop):
17.1  fps
FIFA 20

FIFA 20

2019
low 1280x720
GeForce GTX 1050 (Desktop):
196  fps
med. 1920x1080
GeForce GTX 1050 (Desktop):
167  fps
high 1920x1080
GeForce GTX 1050 (Desktop):
154  fps
ultra 1920x1080
GeForce GTX 1050 (Desktop):
124  fps
QHD 2560x1440
GeForce GTX 1050 (Desktop):
95  fps
4K 3840x2160
GeForce GTX 1050 (Desktop):
54.1  fps
low 1280x720
GeForce GTX 1050 (Desktop):
98  fps
med. 1920x1080
GeForce GTX 1050 (Desktop):
40.1  fps
high 1920x1080
GeForce GTX 1050 (Desktop):
25  fps
ultra 1920x1080
GeForce GTX 1050 (Desktop):
18.4  fps
4K 3840x2160
GeForce GTX 1050 (Desktop):
2.1  fps
Control

Control

2019
low 1280x720
GeForce GTX 1050 (Desktop):
75  fps
med. 1920x1080
GeForce GTX 1050 (Desktop):
23.6  fps
high 1920x1080
GeForce GTX 1050 (Desktop):
15.8  fps
F1 2019

F1 2019

2019
low 1280x720
GeForce GTX 1050 (Desktop):
166  fps
med. 1920x1080
GeForce GTX 1050 (Desktop):
71  fps
high 1920x1080
GeForce GTX 1050 (Desktop):
60  fps
ultra 1920x1080
GeForce GTX 1050 (Desktop):
33.4  fps
QHD 2560x1440
GeForce GTX 1050 (Desktop):
25.7  fps
low 1280x720
GeForce GTX 1050 (Desktop):
143  fps
med. 1920x1080
GeForce GTX 1050 (Desktop):
43.3  fps
high 1920x1080
GeForce GTX 1050 (Desktop):
22.5  fps
ultra 1920x1080
GeForce GTX 1050 (Desktop):
15  fps
QHD 2560x1440
GeForce GTX 1050 (Desktop):
6.3  fps
4K 3840x2160
GeForce GTX 1050 (Desktop):
1  fps
low 1280x720
GeForce GTX 1050 (Desktop):
124  fps
med. 1920x1080
GeForce GTX 1050 (Desktop):
43.2  fps
high 1920x1080
GeForce GTX 1050 (Desktop):
33  fps
ultra 1920x1080
GeForce GTX 1050 (Desktop):
24.4  fps
QHD 2560x1440
GeForce GTX 1050 (Desktop):
15.1  fps
4K 3840x2160
GeForce GTX 1050 (Desktop):
6  fps
low 1280x720
GeForce GTX 1050 (Desktop):
134  fps
med. 1920x1080
GeForce GTX 1050 (Desktop):
56.9  fps
high 1920x1080
GeForce GTX 1050 (Desktop):
45  fps
ultra 1920x1080
GeForce GTX 1050 (Desktop):
22.1  fps
QHD 2560x1440
GeForce GTX 1050 (Desktop):
20.5  fps
Anthem

Anthem

2019
low 1280x720
GeForce GTX 1050 (Desktop):
67  fps
med. 1920x1080
GeForce GTX 1050 (Desktop):
36.7  fps
high 1920x1080
GeForce GTX 1050 (Desktop):
30.5  fps
ultra 1920x1080
GeForce GTX 1050 (Desktop):
28.3  fps
QHD 2560x1440
GeForce GTX 1050 (Desktop):
16.5  fps
low 1280x720
GeForce GTX 1050 (Desktop):
77  fps
med. 1920x1080
GeForce GTX 1050 (Desktop):
41  fps
high 1920x1080
GeForce GTX 1050 (Desktop):
38  fps
ultra 1920x1080
GeForce GTX 1050 (Desktop):
35  fps
QHD 2560x1440
GeForce GTX 1050 (Desktop):
25  fps
4K 3840x2160
GeForce GTX 1050 (Desktop):
11  fps
low 1280x720
GeForce GTX 1050 (Desktop):
35.5  fps
med. 1920x1080
GeForce GTX 1050 (Desktop):
20.5  fps
high 1920x1080
GeForce GTX 1050 (Desktop):
16  fps
ultra 1920x1080
GeForce GTX 1050 (Desktop):
13  fps
low 1280x720
GeForce GTX 1050 (Desktop):
108  fps
med. 1920x1080
GeForce GTX 1050 (Desktop):
45.6  fps
high 1920x1080
GeForce GTX 1050 (Desktop):
37  fps
ultra 1920x1080
GeForce GTX 1050 (Desktop):
36.7  fps
4K 3840x2160
GeForce GTX 1050 (Desktop):
12  fps
ultra 1920x1080
GeForce GTX 1050 (Desktop):
32.2  fps
ultra 1920x1080
GeForce GTX 1050 (Desktop):
44.6  fps
low 1280x720
GeForce GTX 1050 (Desktop):
124  fps
med. 1920x1080
GeForce GTX 1050 (Desktop):
55.6  fps
high 1920x1080
GeForce GTX 1050 (Desktop):
43.1  fps
ultra 1920x1080
GeForce GTX 1050 (Desktop):
36.3  fps
QHD 2560x1440
GeForce GTX 1050 (Desktop):
27.1  fps
ultra 1920x1080
GeForce GTX 1050 (Desktop):
52.3  fps
ultra 1920x1080
GeForce GTX 1050 (Desktop):
38.2  fps
Hitman 2

Hitman 2

2018
ultra 1920x1080
GeForce GTX 1050 (Desktop):
29.2  fps
med. 1920x1080
GeForce GTX 1050 (Desktop):
43.3  fps
high 1920x1080
GeForce GTX 1050 (Desktop):
36.1  fps
ultra 1920x1080
GeForce GTX 1050 (Desktop):
32.9  fps
low 1280x720
GeForce GTX 1050 (Desktop):
71  fps
med. 1920x1080
GeForce GTX 1050 (Desktop):
38  fps
high 1920x1080
GeForce GTX 1050 (Desktop):
26  fps
ultra 1920x1080
GeForce GTX 1050 (Desktop):
15  fps
high 1920x1080
GeForce GTX 1050 (Desktop):
49  fps
ultra 1920x1080
GeForce GTX 1050 (Desktop):
34  fps
FIFA 19

FIFA 19

2018
ultra 1920x1080
GeForce GTX 1050 (Desktop):
95  fps
4K 3840x2160
GeForce GTX 1050 (Desktop):
33.8  fps
low 1280x720
GeForce GTX 1050 (Desktop):
61  fps
med. 1920x1080
GeForce GTX 1050 (Desktop):
27  fps
high 1920x1080
GeForce GTX 1050 (Desktop):
25 27 ~ 26 fps
ultra 1920x1080
GeForce GTX 1050 (Desktop):
22 23 ~ 23 fps
Strange Brigade

Strange Brigade

2018
low 1280x720
GeForce GTX 1050 (Desktop):
149  fps
med. 1920x1080
GeForce GTX 1050 (Desktop):
53.2  fps
high 1920x1080
GeForce GTX 1050 (Desktop):
34.7  fps
ultra 1920x1080
GeForce GTX 1050 (Desktop):
31.3  fps
QHD 2560x1440
GeForce GTX 1050 (Desktop):
18.4  fps
4K 3840x2160
GeForce GTX 1050 (Desktop):
11.1  fps
F1 2018

F1 2018

2018
low 1280x720
GeForce GTX 1050 (Desktop):
64  fps
med. 1920x1080
GeForce GTX 1050 (Desktop):
52  fps
high 1920x1080
GeForce GTX 1050 (Desktop):
36 54.1 ~ 45 fps
ultra 1920x1080
GeForce GTX 1050 (Desktop):
24 32.9 ~ 28 fps
4K 3840x2160
GeForce GTX 1050 (Desktop):
13.4  fps
low 1280x720
GeForce GTX 1050 (Desktop):
72.6  fps
med. 1920x1080
GeForce GTX 1050 (Desktop):
65.2  fps
high 1920x1080
GeForce GTX 1050 (Desktop):
56.1  fps
high 1920x1080
GeForce GTX 1050 (Desktop):
32.5  fps
ultra 1920x1080
GeForce GTX 1050 (Desktop):
22.9  fps
low 1280x720
GeForce GTX 1050 (Desktop):
54  fps
med. 1920x1080
GeForce GTX 1050 (Desktop):
26.2  fps
high 1920x1080
GeForce GTX 1050 (Desktop):
15.5  fps
4K 3840x2160
GeForce GTX 1050 (Desktop):
3  fps
Fortnite

Fortnite

2018
high 1920x1080
GeForce GTX 1050 (Desktop):
53.3  fps
ultra 1920x1080
GeForce GTX 1050 (Desktop):
42  fps
Prey

Prey

2017
high 1920x1080
GeForce GTX 1050 (Desktop):
71  fps
ultra 1920x1080
GeForce GTX 1050 (Desktop):
67  fps
med. 1920x1080
GeForce GTX 1050 (Desktop):
41.5  fps
high 1920x1080
GeForce GTX 1050 (Desktop):
26.5  fps
med. 1920x1080
GeForce GTX 1050 (Desktop):
47.1  fps
high 1920x1080
GeForce GTX 1050 (Desktop):
24.3  fps
ultra 1920x1080
GeForce GTX 1050 (Desktop):
19.9  fps
low 1280x720
GeForce GTX 1050 (Desktop):
62.2  fps
med. 1920x1080
GeForce GTX 1050 (Desktop):
31.7  fps
high 1920x1080
GeForce GTX 1050 (Desktop):
29.2  fps
ultra 1920x1080
GeForce GTX 1050 (Desktop):
13.8  fps
For Honor

For Honor

2017
low 1280x720
GeForce GTX 1050 (Desktop):
142.2  fps
med. 1920x1080
GeForce GTX 1050 (Desktop):
55.8 64.5 ~ 60 fps
high 1920x1080
GeForce GTX 1050 (Desktop):
53 53.2 ~ 53 fps
ultra 1920x1080
GeForce GTX 1050 (Desktop):
40.5 42.8 ~ 42 fps
4K 3840x2160
GeForce GTX 1050 (Desktop):
13.5  fps
high 1920x1080
GeForce GTX 1050 (Desktop):
59.3  fps
ultra 1920x1080
GeForce GTX 1050 (Desktop):
47.5  fps
4K 3840x2160
GeForce GTX 1050 (Desktop):
13.9  fps
med. 1366x768
GeForce GTX 1050 (Desktop):
78  fps
high 1920x1080
GeForce GTX 1050 (Desktop):
35.4  fps
ultra 1920x1080
GeForce GTX 1050 (Desktop):
20  fps
med. 1366x768
GeForce GTX 1050 (Desktop):
80  fps
high 1920x1080
GeForce GTX 1050 (Desktop):
37.3  fps
ultra 1920x1080
GeForce GTX 1050 (Desktop):
33.7  fps
ultra 1920x1080
GeForce GTX 1050 (Desktop):
55.4  fps
high 1920x1080
GeForce GTX 1050 (Desktop):
52.9  fps
ultra 1920x1080
GeForce GTX 1050 (Desktop):
45.7  fps
4K 3840x2160
GeForce GTX 1050 (Desktop):
15.6  fps
ultra 1920x1080
GeForce GTX 1050 (Desktop):
103  fps
4K 3840x2160
GeForce GTX 1050 (Desktop):
46.3  fps
low 1280x720
GeForce GTX 1050 (Desktop):
104  fps
med. 1366x768
GeForce GTX 1050 (Desktop):
71 113 ~ 92 fps
high 1920x1080
GeForce GTX 1050 (Desktop):
38.5 42.6 ~ 41 fps
ultra 1920x1080
GeForce GTX 1050 (Desktop):
35.2 39 ~ 37 fps
4K 3840x2160
GeForce GTX 1050 (Desktop):
13.9  fps
high 1920x1080
GeForce GTX 1050 (Desktop):
48  fps
ultra 1920x1080
GeForce GTX 1050 (Desktop):
40.2  fps
4K 3840x2160
GeForce GTX 1050 (Desktop):
31.5  fps
Mafia 3

Mafia 3

2016
med. 1366x768
GeForce GTX 1050 (Desktop):
41.1  fps
high 1920x1080
GeForce GTX 1050 (Desktop):
26.1  fps
FIFA 17

FIFA 17

2016
ultra 1920x1080
GeForce GTX 1050 (Desktop):
157  fps
4K 3840x2160
GeForce GTX 1050 (Desktop):
61  fps
low 1280x720
GeForce GTX 1050 (Desktop):
86  fps
med. 1366x768
GeForce GTX 1050 (Desktop):
63.1  fps
high 1920x1080
GeForce GTX 1050 (Desktop):
33.6  fps
ultra 1920x1080
GeForce GTX 1050 (Desktop):
12 21.4 ~ 17 fps
4K 3840x2160
GeForce GTX 1050 (Desktop):
9  fps
Overwatch

Overwatch

2016
high 1920x1080
GeForce GTX 1050 (Desktop):
108  fps
ultra 1920x1080
GeForce GTX 1050 (Desktop):
63  fps
4K 3840x2160
GeForce GTX 1050 (Desktop):
33.1  fps
Doom

Doom

2016
high 1920x1080
GeForce GTX 1050 (Desktop):
54  fps
ultra 1920x1080
GeForce GTX 1050 (Desktop):
46.5  fps
4K 3840x2160
GeForce GTX 1050 (Desktop):
18.3  fps
med. 1920x1080
GeForce GTX 1050 (Desktop):
37.4  fps
high 1920x1080
GeForce GTX 1050 (Desktop):
33.2  fps
4K 3840x2160
GeForce GTX 1050 (Desktop):
3.5  fps
med. 1366x768
GeForce GTX 1050 (Desktop):
44.7  fps
high 1920x1080
GeForce GTX 1050 (Desktop):
21.6  fps
ultra 1920x1080
GeForce GTX 1050 (Desktop):
18.9  fps
high 1920x1080
GeForce GTX 1050 (Desktop):
39.2  fps
ultra 1920x1080
GeForce GTX 1050 (Desktop):
30.3  fps
4K 3840x2160
GeForce GTX 1050 (Desktop):
14.1  fps
low 1280x720
GeForce GTX 1050 (Desktop):
125  fps
med. 1920x1080
GeForce GTX 1050 (Desktop):
57  fps
high 1920x1080
GeForce GTX 1050 (Desktop):
51  fps
ultra 1920x1080
GeForce GTX 1050 (Desktop):
38  fps
4K 3840x2160
GeForce GTX 1050 (Desktop):
15  fps
XCOM 2

XCOM 2

2016
med. 1920x1080
GeForce GTX 1050 (Desktop):
54.9  fps
high 1920x1080
GeForce GTX 1050 (Desktop):
33.2  fps
ultra 1920x1080
GeForce GTX 1050 (Desktop):
14.5  fps
low 1024x768
GeForce GTX 1050 (Desktop):
94.1  fps
med. 1366x768
GeForce GTX 1050 (Desktop):
53.5  fps
high 1920x1080
GeForce GTX 1050 (Desktop):
32.9 40.6 43.8 ~ 39 fps
ultra 1920x1080
GeForce GTX 1050 (Desktop):
28.9 36.9 ~ 33 fps
4K 3840x2160
GeForce GTX 1050 (Desktop):
15.6  fps
low 1024x768
GeForce GTX 1050 (Desktop):
247  fps
med. 1366x768
GeForce GTX 1050 (Desktop):
155  fps
high 1920x1080
GeForce GTX 1050 (Desktop):
82.4  fps
ultra 1920x1080
GeForce GTX 1050 (Desktop):
65.9  fps
4K 3840x2160
GeForce GTX 1050 (Desktop):
20.3  fps
high 1920x1080
GeForce GTX 1050 (Desktop):
44.1  fps
ultra 1920x1080
GeForce GTX 1050 (Desktop):
16.5  fps
Fallout 4

Fallout 4

2015
ultra 1920x1080
GeForce GTX 1050 (Desktop):
41.1  fps
Anno 2205

Anno 2205

2015
high 1920x1080
GeForce GTX 1050 (Desktop):
54.3  fps
ultra 1920x1080
GeForce GTX 1050 (Desktop):
17  fps
4K 3840x2160
GeForce GTX 1050 (Desktop):
19.6  fps
ultra 1920x1080
GeForce GTX 1050 (Desktop):
100  fps
4K 3840 x 2160
GeForce GTX 1050 (Desktop):
31.9  fps
Mad Max

Mad Max

2015
ultra 1920x1080
GeForce GTX 1050 (Desktop):
69  fps
4K 3840x2160
GeForce GTX 1050 (Desktop):
24.1  fps
low 1280x720
GeForce GTX 1050 (Desktop):
111 148 ~ 130 fps
med. 1366x768
GeForce GTX 1050 (Desktop):
107 136 ~ 122 fps
high 1920x1080
GeForce GTX 1050 (Desktop):
100 124 156 ~ 127 fps
ultra 1920x1080
GeForce GTX 1050 (Desktop):
96.4 112 139 ~ 116 fps
4K 3840x2160
GeForce GTX 1050 (Desktop):
47.4  fps
low 1024x768
GeForce GTX 1050 (Desktop):
81.7 131 ~ 106 fps
med. 1366x768
GeForce GTX 1050 (Desktop):
50.3 77.9 ~ 64 fps
high 1920x1080
GeForce GTX 1050 (Desktop):
31.7 43.7 ~ 38 fps
ultra 1920x1080
GeForce GTX 1050 (Desktop):
16.4 24.1 ~ 20 fps
4K 3840x2160
GeForce GTX 1050 (Desktop):
15.3  fps
ultra 1920x1080
GeForce GTX 1050 (Desktop):
76  fps
4K 3840x2160
GeForce GTX 1050 (Desktop):
49.8  fps
GTA V

GTA V

2015
low 1024x768
GeForce GTX 1050 (Desktop):
176  fps
med. 1366x768
GeForce GTX 1050 (Desktop):
170  fps
high 1920x1080
GeForce GTX 1050 (Desktop):
78.6  fps
ultra 1920x1080
GeForce GTX 1050 (Desktop):
25.7 28.5 ~ 27 fps
QHD 2560x1440
GeForce GTX 1050 (Desktop):
7.3  fps
4K 3840x2160
GeForce GTX 1050 (Desktop):
23.8  fps
ultra 1920x1080
GeForce GTX 1050 (Desktop):
75.2  fps
ultra 1920x1080
GeForce GTX 1050 (Desktop):
44.9  fps
ultra 1920x1080
GeForce GTX 1050 (Desktop):
54  fps
4K 3840x2160
GeForce GTX 1050 (Desktop):
24  fps
Dota 2

Dota 2

2013
low 1024x768
GeForce GTX 1050 (Desktop):
116.4  fps
med. 1366x768
GeForce GTX 1050 (Desktop):
101  fps
ultra 1920x1080
GeForce GTX 1050 (Desktop):
82.3  fps
ultra 1920x1080
GeForce GTX 1050 (Desktop):
49  fps
low 1280x720
GeForce GTX 1050 (Desktop):
203.7  fps
med. 1366x768
GeForce GTX 1050 (Desktop):
145.2  fps
high 1366x768
GeForce GTX 1050 (Desktop):
127.9  fps
ultra 1920x1080
GeForce GTX 1050 (Desktop):
54.8 71.6 ~ 63 fps
Crysis 3

Crysis 3

2013
ultra 1920x1080
GeForce GTX 1050 (Desktop):
31.9  fps
ultra 1920x1080
GeForce GTX 1050 (Desktop):
250  fps
Mafia 2

Mafia 2

2010
low 800x600
100%
Quadro FX 2800M:
63.2  fps
med. 1024x768
100%
Quadro FX 2800M:
56.1  fps
high 1360x768
100%
Quadro FX 2800M:
48.9  fps
ultra 1920x1080
100%
Quadro FX 2800M:
30.8  fps
low 1024x768
100%
Quadro FX 2800M:
158  fps
med. 1360x768
100%
Quadro FX 2800M:
60  fps
high 1360x768
100%
Quadro FX 2800M:
52  fps
ultra 1920x1080
100%
Quadro FX 2800M:
29.6  fps
med. 1366x768
100%
Quadro FX 2800M:
58.9  fps
high 1366x768
100%
Quadro FX 2800M:
41.5  fps
ultra 1920x1080
100%
Quadro FX 2800M:
23.1  fps
low 800x600
100%
Quadro FX 2800M:
158.1  fps
med. 1024x768
100%
Quadro FX 2800M:
78.9  fps
high 1366x768
100%
Quadro FX 2800M:
66.7  fps
ultra 1920x1080
100%
Quadro FX 2800M:
41.2  fps
Colin McRae: DIRT 2

Colin McRae: DIRT 2

2009
low 800x600
100%
Quadro FX 2800M:
96.3  fps
med. 1024x768
100%
Quadro FX 2800M:
89.5  fps
high 1360x768
100%
Quadro FX 2800M:
62.6  fps
ultra 1920x1080
100%
Quadro FX 2800M:
30.7  fps
Doom 3

Doom 3

2004
low 640x480
Quadro FX 370M:
97  fps
med. 640x480
Quadro FX 370M:
97.1  fps
high 800x600
Quadro FX 370M:
65.4  fps
ultra 1024x768
Quadro FX 370M:
39.9  fps

Average Gaming NVIDIA Quadro FX 2800M → 100%

Average Gaming 30-70 fps → 100%

NVIDIA GeForce GTX 1050 (Desktop)lowmed.highultraQHD4K
Black Myth: Wukong85
Cyberpunk 2077 2.1 Phantom Liberty10.76
F1 2255.348.531.6
Dying Light 216.413.29.56
God of War18.3
Guardians of the Galaxy
Cyberpunk 2077 1.032.1
Flight Simulator 202047.119.212.15.5
F1 20201336240.825.9
Gears Tactics17762.238.230.719
Doom Eternal52.539.331.328.2
Escape from Tarkov11563.950.529.919.8
Red Dead Redemption 26530.518.5
Call of Duty Modern Warfare 201956.633.930.717.1
FIFA 201961671541249554.1
Borderlands 39840.12518.42.1
Control7523.615.8
F1 2019166716033.425.7
Total War: Three Kingdoms14343.322.5156.31
The Division 212443.23324.415.16
Dirt Rally 2.013456.94522.120.5
Anthem6736.730.528.316.5
Far Cry New Dawn774138352511
Metro Exodus35.520.51613
Apex Legends10845.63736.712
Just Cause 432.2
Darksiders III44.6
Battlefield V12455.643.136.327.1
Farming Simulator 1952.3
Fallout 7638.2
Hitman 229.2
Call of Duty Black Ops 443.336.132.9
Assassin´s Creed Odyssey71382615
Forza Horizon 44934
FIFA 199533.8
Shadow of the Tomb Raider61272623
Strange Brigade14953.234.731.318.411.1
F1 20186452452813.4
X-Plane 11.1172.665.256.1
Kingdom Come: Deliverance32.522.9
Final Fantasy XV Benchmark5426.215.53
Fortnite53.342
Prey7167
Warhammer 40.000: Dawn of War III41.526.5
Mass Effect Andromeda47.124.319.9
Ghost Recon Wildlands62.231.729.213.8
For Honor142.260534213.5
Resident Evil 759.347.513.9
Watch Dogs 27835.420
Dishonored 28037.333.7
Call of Duty Infinite Warfare55.4
Titanfall 252.945.715.6
Farming Simulator 1710346.3
Battlefield 110492413713.9
Civilization VI4840.231.5
Mafia 341.126.1
FIFA 1715761
Deus Ex Mankind Divided8663.133.6179
Overwatch1086333.1
Doom5446.518.3
Ashes of the Singularity37.433.23.5
Hitman 201644.721.618.9
The Division39.230.314.1
Far Cry Primal12557513815
XCOM 254.933.214.5
Rise of the Tomb Raider94.153.5393315.6
Rainbow Six Siege24715582.465.920.3
Assassin's Creed Syndicate44.116.5
Fallout 441.1
Anno 220554.31719.6
World of Warships10031.9
Mad Max6924.1
Dota 2 Reborn13012212711647.4
The Witcher 310664382015.3
Dirt Rally7649.8
GTA V17617078.6277.3323.8
Alien: Isolation75.2
Middle-earth: Shadow of Mordor44.9
Battlefield 45424
Dota 2116.410182.3
Metro: Last Light49
BioShock Infinite203.7145.2127.963
Crysis 331.9
Counter-Strike: GO250
< 30 fps
< 60 fps
< 120 fps
≥ 120 fps
1
7
17
15
9
25
12
5
16
36
5
3
26
29
12
3
12

1
24
8
1
NVIDIA Quadro FX 2800Mlowmed.highultraQHD4K
Mafia 263.256.148.930.8
StarCraft 2158605229.6
Battlefield: Bad Company 258.941.5323.07
CoD Modern Warfare 2158.178.966.741.2
Colin McRae: DIRT 296.389.562.630.7
< 30 fps
< 60 fps
< 120 fps
≥ 120 fps


2
2

2
3

3
2
2
3


NVIDIA Quadro FX 370Mlowmed.highultraQHD4K
Doom 39797.165.439.9
< 30 fps
< 60 fps
< 120 fps
≥ 120 fps


1


1


1

1


Eine Liste mit weiteren Spielen und allen Grafikkarten finden Sie auf unserer Seite: Welches Spiel ist mit welcher Grafikkarte spielbar?

v1.28
log 10. 07:30:59

#0 ran 0s before starting gpusingle class +0s ... 0s

#1 checking url part for id 1544 +0s ... 0s

#2 checking url part for id 7583 +0s ... 0s

#3 checking url part for id 1054 +0s ... 0s

#4 redirected to Ajax server, took 1731220259s time from redirect:0 +0s ... 0s

#5 did not recreate cache, as it is less than 5 days old! Created at Sun, 10 Nov 2024 05:17:12 +0100 +0s ... 0s

#6 composed specs +0.005s ... 0.005s

#7 did output specs +0s ... 0.005s

#8 start showIntegratedCPUs +0s ... 0.005s

#9 getting avg benchmarks for device 1544 +0.028s ... 0.033s

#10 got single benchmarks 1544 +0.005s ... 0.038s

#11 getting avg benchmarks for device 7583 +0s ... 0.038s

#12 got single benchmarks 7583 +0.006s ... 0.044s

#13 getting avg benchmarks for device 1054 +0s ... 0.044s

#14 got single benchmarks 1054 +0.003s ... 0.047s

#15 got avg benchmarks for devices +0s ... 0.047s

#16 min, max, avg, median took s +0.03s ... 0.077s

#17 before gaming benchmark output +0s ... 0.077s

#18 Got 319 rows for game benchmarks. +0.008s ... 0.085s

#19 composed SQL query for gamebenchmarks +0s ... 0.085s

#20 got data and put it in $dataArray +0.004s ... 0.089s

#21 benchmarks composed for output. +0.031s ... 0.12s

#22 calculated avg scores. +0s ... 0.12s

#23 return log +0.001s ... 0.121s

Teilen Sie diesen Artikel, um uns zu unterstützen. Jeder Link hilft!
> Notebook Test, Laptop Test und News > Benchmarks / Technik > Benchmarks / Technik > Grafikkarten Vergleich - Head 2 Head
Autor: Klaus Hinum,  8.09.2017 (Update:  1.07.2023)