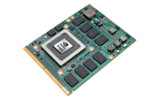
NVIDIA Quadro FX 2500M vs NVIDIA Quadro FX 2800M
NVIDIA Quadro FX 2500M
► remove from comparison
Professionelle auf CAD optimierte Grafikkarte für Notebooks von NVidia basierend auf 7900 GTX. Wurde von der 3500M bzw 3600M abgelöst.
Durch spezielle professionelle Treiber zeigt sie eine sehr gute Anwendungsleistung (3D Renderer, CAD), jedoch eine schlechtere Spieleleistung. Mit gemoddeten Treibern sollte sie sich jedoch wie eine 7900 GTX verhalten.
Die Treiber der Quadro FX Serie sind zertifiziert für CAD Anwendungen (z.B. AutoCad, Inventor, Solidstation, Solid Edge, ...) und DCC Anwendungen (z.B. Maya, 3DS Max, Lightwave 3D, ...) und bieten eine 12-Bit-Präzision für Subpixel, Vollbild-Antialiasing, Hardwarebeschleunigtes Antialiasing für Punkte und Linien und weitere für CAD und DCC optimierte Einstellungen.
Links zu gemoddeten Treibern finden Sie hier.
NVIDIA Quadro FX 2800M
► remove from comparison
Die Nvidia Quadro FX 2800M ist eine mobile Grafikkarte für Workstation-Laptops. Sie basiert auf die selbe Architektur wie die GeForce 9800M GT, bietet jedoch eine höheren Kerntakt.
Die zertifizierten Treiber der Quadro FX Serie sorgen für eine optimierten Stabilität, Kompatibilität und Performance bei Professionellen Anwendungen (CAD-, DCC-, Medizin- und Prospektionsanwendungen). Besonders die OpenGL Performance soll bei den Quadro FX Karten im Vergleich zu GeForce Modellen deutlich besser sein.
Die Quadro FX2800M wird in mobilen Workstations, wie etwa dem Dell M6500 eingesetzt und unterstützt DirectX 10.0 und OpenGL 2.1. Sie kann maximal zwei Displays ansteuern (DisplayPort bis 2560x1600, HDMI/DVI bis 1920x1200). Dell gibt einen TDP von 65 Watt (Nvidia 75 Watt) an. Eventuell wird die FX2800M daher schon in 55nm gefertigt.
Durch den maximalen Stromverbrauch von 65/75 Watt (Idle 10 Watt) eignet sich die Grafikkarte nur für große und schwere Notebooks (minimal 15").
| NVIDIA Quadro FX 2500M | NVIDIA Quadro FX 2800M | |||||||||||||||||||||||||||||||||||||||||||||||||||||||||||||||||||||||||||||||||||||||||||||||||||||||||||||
| Quadro FX Serie |
|
| ||||||||||||||||||||||||||||||||||||||||||||||||||||||||||||||||||||||||||||||||||||||||||||||||||||||||||||
| Codename | G71glm | NB10-GLM3 | ||||||||||||||||||||||||||||||||||||||||||||||||||||||||||||||||||||||||||||||||||||||||||||||||||||||||||||
| Architektur | G7x | G9x | ||||||||||||||||||||||||||||||||||||||||||||||||||||||||||||||||||||||||||||||||||||||||||||||||||||||||||||
| Pipelines | 24 / 8 Pixel- / Vertexshader | 96 - unified | ||||||||||||||||||||||||||||||||||||||||||||||||||||||||||||||||||||||||||||||||||||||||||||||||||||||||||||
| Kerntakt | 500 MHz | 600 MHz | ||||||||||||||||||||||||||||||||||||||||||||||||||||||||||||||||||||||||||||||||||||||||||||||||||||||||||||
| Speichertakt | 600 MHz | 1000 MHz | ||||||||||||||||||||||||||||||||||||||||||||||||||||||||||||||||||||||||||||||||||||||||||||||||||||||||||||
| Speicherbandbreite | 256 Bit | 256 Bit | ||||||||||||||||||||||||||||||||||||||||||||||||||||||||||||||||||||||||||||||||||||||||||||||||||||||||||||
| Speichertyp | GDDR3 | GDDR3 | ||||||||||||||||||||||||||||||||||||||||||||||||||||||||||||||||||||||||||||||||||||||||||||||||||||||||||||
| Max. Speichergröße | 512 MB | 1024 MB | ||||||||||||||||||||||||||||||||||||||||||||||||||||||||||||||||||||||||||||||||||||||||||||||||||||||||||||
| Shared Memory | nein | nein | ||||||||||||||||||||||||||||||||||||||||||||||||||||||||||||||||||||||||||||||||||||||||||||||||||||||||||||
| API | DirectX 9c, Shader 3.0 | DirectX 10, Shader 4.0 | ||||||||||||||||||||||||||||||||||||||||||||||||||||||||||||||||||||||||||||||||||||||||||||||||||||||||||||
| Stromverbrauch | 45 Watt | 75 Watt | ||||||||||||||||||||||||||||||||||||||||||||||||||||||||||||||||||||||||||||||||||||||||||||||||||||||||||||
| Transistors | 278 Million | 754 Million | ||||||||||||||||||||||||||||||||||||||||||||||||||||||||||||||||||||||||||||||||||||||||||||||||||||||||||||
| Herstellungsprozess | 90 nm | 55 nm | ||||||||||||||||||||||||||||||||||||||||||||||||||||||||||||||||||||||||||||||||||||||||||||||||||||||||||||
| Features | optimiert für professionelle 3D Anwendungen und CAD Programme | OpenGL 2.1, CUDA, PowerMizer 8.0 | ||||||||||||||||||||||||||||||||||||||||||||||||||||||||||||||||||||||||||||||||||||||||||||||||||||||||||||
| Notebookgröße | groß (17" z.B.) | groß (17" z.B.) | ||||||||||||||||||||||||||||||||||||||||||||||||||||||||||||||||||||||||||||||||||||||||||||||||||||||||||||
| Erscheinungsdatum | 29.09.2005 | 01.12.2009 | ||||||||||||||||||||||||||||||||||||||||||||||||||||||||||||||||||||||||||||||||||||||||||||||||||||||||||||
| Herstellerseite | www.nvidia.de | www.nvidia.com | ||||||||||||||||||||||||||||||||||||||||||||||||||||||||||||||||||||||||||||||||||||||||||||||||||||||||||||
| Shadertakt | 1500 MHz |
Benchmarks
3DM Vant. Perf. total + NVIDIA Quadro FX 2800M
specvp11 snx-01 + NVIDIA Quadro FX 2800M
Average Benchmarks NVIDIA Quadro FX 2500M → 100% n=3
Average Benchmarks NVIDIA Quadro FX 2800M → 170% n=3
* Smaller numbers mean a higher performance
1 This benchmark is not used for the average calculation
Spiele-Benchmarks
Die folgenden Benchmarks basieren auf unseren Spieletests mit Testnotebooks. Die Performance dieser Grafikkarte bei den gelisteten Spielen ist abhängig von der verwendeten CPU, Speicherausstattung, Treiber und auch Betriebssystem. Dadurch müssen die untenstehenden Werte nicht repräsentativ sein. Detaillierte Informationen über das verwendete System sehen Sie nach einem Klick auf den fps-Wert.

Mafia 2
2010
StarCraft 2
2010
CoD Modern Warfare 2
2009| NVIDIA Quadro FX 2800M | low | med. | high | ultra | QHD | 4K |
|---|---|---|---|---|---|---|
| Mafia 2 | 63.2 | 56.1 | 48.9 | 30.8 | ||
| StarCraft 2 | 158 | 60 | 52 | 29.6 | ||
| Battlefield: Bad Company 2 | 58.9 | 41.53 | 23.07 | |||
| CoD Modern Warfare 2 | 158.1 | 78.9 | 66.7 | 41.2 | ||
| Colin McRae: DIRT 2 | 96.3 | 89.5 | 62.6 | 30.7 | ||
| < 30 fps < 60 fps < 120 fps ≥ 120 fps | 2 2 | 2 3 | 3 2 | 2 3 | | |
Eine Liste mit weiteren Spielen und allen Grafikkarten finden Sie auf unserer Seite: Welches Spiel ist mit welcher Grafikkarte spielbar?


