Notebookcheck Logo

Intel Core 2 Duo P8400 vs Intel Core i7-1185G7

Intel Core 2 Duo P8400

► remove from comparison Intel P8400
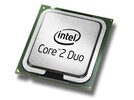
Der Intel Core 2 Duo P8400 Dual-Core Prozessor bietet zwei Prozessorkerne mit einem gemeinsamen Level 2 Cache von 3 MB. Im Vergleich zu den stärkeren Modellen bietet, der P8400 zwar nur die Hälfte an Level 2 Cache, jedoch bleibt dadurch der Stromverbrauch mit maximal 25 Watt auch geringer. Die Architektur des Prozessors basiert auf den Penryn Kern und wird in 45nm gefertigt.

Der P8400 ist sehr ähnlich zu der OEM Version Core 2 Duo P7550, welcher später auf den Markt kam.

Für Multimediaanwendungen und anspruchslose Spiele, sollte die Performance des Intel Core 2 Duo P8400 ausreichen. Im Vergleich zu AMD sollte die Performance auf Niveau der schnellsten Turion II Ultra mit 2.4 - 2.6 GHz liegen. Anspruchsvolle Spielefans sollten jedoch eher zu höher getakteten Core 2 Duo CPUs greifen (>2.5 GHz).

Der Penryn (Montevina Update) Kern bietet 2 Integer Units, 1 Floating Point Unit, 1 Load Unit und 1 Store Unit in einer 14-stufigen Pipeline. Mit der Wide Dynamic Execution Technologie kann der Kern bis zu vier volle Instruktionen gleichzeitig ausführen.

Dank Dynamic Acceleration (später Turbo Modus genannt), kann sich ein Kern um eine Stufe übertakten, wenn der zweite im Idle Modus (Leerlauf) ist.

Das integrierte Enhanced Speedstep kann die Taktfrequenz des Prozessors dynamisch an die Leistungsanforderungen anpassen. Dadurch läuft die CPU ohne Last nur mit 800 MHz.

Der Core 2 Duo P8400 passt in den Socket P (mit 479 Pins):

Socket P / Micro Flip-Chip Pin Grid Array (Micro-FCPGA) requires 479-pin surface mount Zero Insertion Force (ZIF) socket (mPGA479M socket) or Micro Flip-Chip Ball Grid Array (Micro-FCBGA) for surface mount (479-ball)

Intel Core i7-1185G7

► remove from comparison Intel i7-1185G7

Der Intel Core i7-1185G7 ist ein sparsamer Quad-Core-SoC für Notebooks und Ultrabooks, der auf der Tiger-Lake-Architektur basiert und im September 2020 vorgestellt wurde. Tiger Lake wird im verbesserten 10nm+-Verfahren (SuperFin genannt) bei Intel gefertigt und nutzt die neuen Willow Cove CPU-Kerne mit einer neuen Mikroarchitektur. Der i7-1185G7 bietet vier Kerne mit 3 GHz Basistakt (bei 28 W TDP, 1,2 GHz bei 12 W) und 4,8 GHz Turbo-Takt (4,3 GHz für alle Kerne). Dadurch liegt die Leistung deutlich oberhalb des alten Ice-Lake basierten Core i7-1065G7. Zum Zeitpunkt der Vorstellung ist der i7-1185G7 das schnellste Tiger-Lake-Modell. Seit Anfang 2021 unterstützt der i7-1185G7 offiziell vPro.

Eine weitere Neuerung ist die integrierte Intel Iris Xe G7 Grafikkarte (Gen 12) welche eine deutlich höhere Leistung wie die alte Iris Plus G7 in Ice Lake bieten soll. Im 1185G7 bietet die Iris Xe alle 96 EUs bei einem Takt von 400 - 1350 MHz.

Wie bisher wird auch weiterhin WLAN (Wifi 6) und nun auch Thunderbolt 4 / USB 4 und 4 Lanes PCIe 4 im Chip (teil-)integriert für schnellere, günstige und platzsparende Implementierungen in Notebooks.

Der TDP kann bei den UP3 CPUs von 12 - 28 Watt gewählt werden (mit unterschiedlichem Basistakt) und dadurch eignet sich die CPU auch für dünne und leichte Notebooks.

ModelIntel Core 2 Duo P8400Intel Core i7-1185G7
CodenamePenrynTiger Lake-UP3
SeriesIntel Core 2 DuoIntel Tiger Lake
Serie: Tiger Lake Tiger Lake-UP3
Intel Core 2 Duo T9900 compare3.06 GHz2 / 2 cores
Intel Core 2 Duo T9800 compare2.92 GHz2 / 2 cores
Intel Core 2 Duo P9700 compare2.8 GHz2 / 2 cores
Intel Core 2 Duo T9600 compare2.8 GHz2 / 2 cores
Intel Core 2 Duo P9600 compare2.66 GHz2 / 2 cores
Intel Core 2 Duo T9550 compare2.66 GHz2 / 2 cores
Intel Core 2 Duo T9500 compare2.6 GHz2 / 2 cores
Intel Core 2 Duo SP9600 compare2.53 GHz2 / 2 cores
Intel Core 2 Duo P9500 compare2.53 GHz2 / 2 cores
Intel Core 2 Duo T9400 compare2.53 GHz2 / 2 cores
Intel Core 2 Duo P8800 compare2.66 GHz2 / 2 cores
Intel Core 2 Duo T9300 compare2.5 GHz2 / 2 cores
Intel Core 2 Duo P8700 compare2.53 GHz2 / 2 cores
Intel Core 2 Duo SP9400 compare2.4 GHz2 / 2 cores
Intel Core 2 Duo P8600 compare2.4 GHz2 / 2 cores
Intel Core 2 Duo T8300 compare2.4 GHz2 / 2 cores
Intel Core 2 Duo SP9300 compare2.26 GHz2 / 2 cores
Intel Core 2 Duo P8400 « 2.26 GHz2 / 2 cores
Intel Core 2 Duo P7570 compare2.26 GHz2 / 2 cores
Intel Core 2 Duo P7550 compare2.26 GHz2 / 2 cores
Intel Core 2 Duo T6770 compare2.3 GHz2 / 2 cores
Intel Core 2 Duo SL9600 compare2.13 GHz2 / 2 cores
Intel Core 2 Duo P7450 compare2.13 GHz2 / 2 cores
Intel Core 2 Duo T6670 compare2.2 GHz2 / 2 cores
Intel Core 2 Duo T6600 compare2.2 GHz2 / 2 cores
Intel Core 2 Duo T8100 compare2.1 GHz2 / 2 cores
Intel Core 2 Duo P7370 compare2 GHz2 / 2 cores
Intel Core 2 Duo P7350 compare2 GHz2 / 2 cores
Intel Core 2 Duo T6570 compare2.1 GHz2 / 2 cores
Intel Core 2 Duo T6500 compare2.1 GHz2 / 2 cores
Intel Core 2 Duo SL9400 compare1.86 GHz2 / 2 cores
Intel Core 2 Duo SL9380 compare1.8 GHz2 / 2 cores
Intel Core 2 Duo T6400 compare2 GHz2 / 2 cores
Intel Core 2 Duo SL9300 compare1.6 GHz2 / 2 cores
Intel Core 2 Duo SU9600 compare1.6 GHz2 / 2 cores
Intel Core 2 Duo SU9400 compare1.4 GHz2 / 2 cores
Intel Core 2 Duo SU7300 compare1.3 GHz2 / 2 cores
Intel Core 2 Duo SU9300 compare1.2 GHz2 / 2 cores
Intel Core i7-1195G7 compare2.9 - 5 GHz4 / 8 cores12 MB L3
Intel Core i7-1185G7 « 3 - 4.8 GHz4 / 8 cores12 MB L3
Intel Core i7-1165G7 compare2.8 - 4.7 GHz4 / 8 cores12 MB L3
Intel Core i5-1155G7 compare2.5 - 4.5 GHz4 / 8 cores8 MB L3
Intel Core i5-1145G7 compare2.6 - 4.4 GHz4 / 8 cores8 MB L3
Intel Core i5-1135G7 compare2.4 - 4.2 GHz4 / 8 cores8 MB L3
Intel Core i3-1125G4 compare2 - 3.7 GHz4 / 8 cores8 MB L3
Intel Core i3-1115G4 compare3 - 4.1 GHz2 / 4 cores6 MB L3
Clock2260 MHz3000 - 4800 MHz
FSB1066
L1 Cache128 KB320 KB
L2 Cache3 MB5 MB
Cores / Threads2 / 24 / 8
TDP25 Watt28 Watt
Transistors410 Million
Technology45 nm10 nm
Voltage1.05-1.15 V
Die Size107 mm2
max. Temp.105 °C100 °C
SocketSocket PBGA1449
FeaturesSSE4.1, Virtualization Technology, Execute Disable Bit, Enhanced Speedstep, Ehnaced Halt State (C1E), 64 Bit, Trusted Execution TechnologyDDR4-3200/LPDDR4x-4266 RAM, PCIe 4, 4 GT/s bus, DL Boost, GNA, MMX, SSE, SSE2, SSE3, SSSE3, SSE4.1, SSE4.2, AVX, AVX2, AVX-512, BMI2, ABM, FMA, ADX, VMX, SMX, SMEP, SMAP, EIST, TM1, TM2, HT, Turbo, SST, AES-NI, RDRAND, RDSEED, SHA, TME
Architecturex86x86
$209 U.S.
Announced
Manufacturerark.intel.comark.intel.com
L3 Cache12 MB
iGPUIntel Iris Xe Graphics G7 96EUs (400 - 1350 MHz)

Benchmarks

Performance Rating - CB R15 + R20 + 7-Zip + X265 + Blender + 3DM11 CPU - i7-1185G7
32.3 pt (54%)
Cinebench R23 - Cinebench R23 Multi Core
min: 3610     avg: 5324     median: 5383.5 (5%)     max: 6383 Points
Cinebench R23 - Cinebench R23 Single Core
min: 1251     avg: 1449     median: 1455.5 (62%)     max: 1532 Points
Cinebench R20 - Cinebench R20 CPU (Single Core)
min: 489     avg: 557     median: 558.5 (62%)     max: 593 Points
Cinebench R20 - Cinebench R20 CPU (Multi Core)
min: 1425     avg: 2039     median: 2090 (5%)     max: 2493 Points
Cinebench R15 - Cinebench R15 CPU Multi 64 Bit
min: 617     avg: 859     median: 866 (5%)     max: 1066 Points
Cinebench R15 - Cinebench R15 CPU Single 64 Bit
min: 168     avg: 215.4     median: 217 (61%)     max: 230 Points
Cinebench R11.5 - Cinebench R11.5 CPU Multi 64 Bit
min: 8.99     avg: 9.3     median: 9.3 (12%)     max: 9.67 Points
Cinebench R11.5 - Cinebench R11.5 CPU Single 64 Bit
min: 2.52     avg: 2.5     median: 2.5 (60%)     max: 2.56 Points
Cinebench R10 - Cinebench R10 Rend. Single (32bit)
min: 2418     avg: 2527     median: 2497 (15%)     max: 2882 Points
min: 8782     avg: 8872     median: 8872 (54%)     max: 8962 Points
Cinebench R10 - Cinebench R10 Rend. Multi (32bit)
min: 4507     avg: 4701     median: 4630 (3%)     max: 5314 Points
min: 26426     avg: 27025     median: 27024.5 (20%)     max: 27623 Points
Cinebench R10 - Cinebench R10 Rend. Multi (64bit)
min: 35564     avg: 36392     median: 36391.5 (23%)     max: 37219 Points
Cinebench R10 - Cinebench R10 Rend. Single (64bit)
min: 10927     avg: 11135     median: 11135 (14%)     max: 11343 Points
wPrime 2.10 - wPrime 2.0 32m *
34.2 s (7%)
min: 5.71     avg: 6     median: 5.8 (1%)     max: 6.875 s
wPrime 2.10 - wPrime 2.0 1024m *
240.4 s (3%)
WinRAR - WinRAR 4.0
6045 Points (10%)
7-Zip 18.03 - 7-Zip 18.03 Multi Thread 4 runs
min: 18812     avg: 23288     median: 23471 (13%)     max: 27693 MIPS
7-Zip 18.03 - 7-Zip 18.03 Single Thread 4 runs
min: 3678     avg: 5112     median: 5153 (61%)     max: 5507 MIPS
X264 HD Benchmark 4.0 - x264 Pass 2
46.6 fps (16%)
X264 HD Benchmark 4.0 - x264 Pass 1
198.8 fps (46%)
HWBOT x265 Benchmark v2.2 - HWBOT x265 4k Preset
min: 5.02     avg: 6.6     median: 6.6 (12%)     max: 8.13 fps
TrueCrypt - TrueCrypt Serpent
0.5 GB/s (15%)
TrueCrypt - TrueCrypt Twofish
0.8 GB/s (14%)
TrueCrypt - TrueCrypt AES
5.8 GB/s (15%)
Blender - Blender 3.3 Classroom CPU *
min: 1099     avg: 1103     median: 1102.5 (14%)     max: 1106 Seconds
Blender - Blender 2.79 BMW27 CPU *
min: 478     avg: 588     median: 578.5 (4%)     max: 745 Seconds
R Benchmark 2.5 - R Benchmark 2.5 *
min: 0.55     avg: 0.6     median: 0.6 (13%)     max: 0.615 sec
3DMark 06 - CPU - 3DMark 06 - CPU
min: 1922     avg: 2030     median: 2036 (4%)     max: 2084 Points
9108 Points (19%)
Super Pi mod 1.5 XS 1M - Super Pi mod 1.5 XS 1M *
min: 21.75     avg: 22.1     median: 22 (5%)     max: 22.71 s
7.1 s (2%)
Super Pi mod 1.5 XS 2M - Super Pi mod 1.5 XS 2M *
min: 50.7     avg: 51.5     median: 51.8 (2%)     max: 52.2 s
15.6 s (1%)
Super Pi Mod 1.5 XS 32M - Super Pi mod 1.5 XS 32M *
1212 s (5%)
380.4 s (2%)
SiSoft Sandra Dhrystone (MIPS) - SiSoft Sandra Dhrystone (MIPS)
100%
1 P8400 +
21204 MIPS (10%)
SiSoft Sandra Whetstone (MFLOPS) - SiSoft Sandra Whetstone (MFLOPS)
100%
1 P8400 +
15993 MFLOPS (12%)
PCMark 05 - PCMark 05 - Standard
100%
1 P8400 +
min: 3410     avg: 5117     median: 5201.5 (11%)     max: 6255 Points
Windows Vista Experience Index - Windows Vista Leistungsindex - Prozessor
100%
1 P8400 +
5.2 Points (74%)
3DMark Vantage - 3DM Vant. Perf. CPU no Physx
min: 3518     avg: 4111     median: 4340 (3%)     max: 4475 Points
29182 Points (22%)
3DMark 11 - 3DM11 Performance Physics
min: 5707     avg: 10641     median: 11284 (28%)     max: 12726 Points
3DMark - 3DMark Ice Storm Physics
min: 69716     avg: 71020     median: 71351 (58%)     max: 71993 Points
3DMark - 3DMark Ice Storm Extreme Physics
min: 69895     avg: 70538     median: 70537.5 (57%)     max: 71180 Points
3DMark - 3DMark Ice Storm Unlimited Physics
min: 67339     avg: 69256     median: 69331.5 (58%)     max: 71022 Points
3DMark - 3DMark Cloud Gate Physics
min: 5114     avg: 8442     median: 8804 (22%)     max: 10133 Points
3DMark - 3DMark Fire Strike Standard Physics
min: 7886     avg: 13151     median: 13684 (24%)     max: 14680 Points
3DMark - 3DMark Time Spy CPU
min: 2489     avg: 4447     median: 4495 (19%)     max: 5608 Points
Geekbench 5.5 - Geekbench 5.1 - 5.5 64 Bit Single-Core
min: 1398     avg: 1520     median: 1529 (60%)     max: 1626 Points
Geekbench 5.5 - Geekbench 5.1 - 5.5 64 Bit Multi-Core
min: 4620     avg: 5460     median: 5550 (10%)     max: 5944 Points
Geekbench 5.0 - Geekbench 5.0 64 Bit Single-Core
min: 1217     avg: 1485     median: 1531.5 (7%)     max: 1561 Points
Geekbench 5.0 - Geekbench 5.0 64 Bit Multi-Core
min: 4542     avg: 5511     median: 5578.5 (18%)     max: 6349 Points
Geekbench 4.4 - Geekbench 4.1 - 4.4 64 Bit Single-Core
min: 5587     avg: 6340     median: 6437 (64%)     max: 6682 Points
Geekbench 4.4 - Geekbench 4.1 - 4.4 64 Bit Multi-Core
min: 20763     avg: 22357     median: 22175 (22%)     max: 25403 Points
Mozilla Kraken 1.1 - Kraken 1.1 Total Score *
min: 618     avg: 649     median: 645 (1%)     max: 695 ms
Octane V2 - Octane V2 Total Score
min: 59942     avg: 62365     median: 61608 (51%)     max: 66300 Points
WebXPRT 4 - WebXPRT 4 Score
min: 189.4     avg: 189.9     median: 189.9 (53%)     max: 190.4 Points
WebXPRT 3 - WebXPRT 3 Score
min: 230     avg: 251.2     median: 253 (46%)     max: 270 Points
CrossMark - CrossMark Overall
min: 1233     avg: 1343     median: 1325 (51%)     max: 1474 Points
Power Consumption - Prime95 Power Consumption - external Monitor *
min: 26.9     avg: 43.8     median: 44.6 (8%)     max: 59.4 Watt
Power Consumption - Cinebench R15 Multi Power Consumption - external Monitor *
min: 33.7     avg: 48.1     median: 46.9 (9%)     max: 68.3 Watt
Power Consumption - Idle Power Consumption - external Monitor *
10.6 Watt (7%)
Power Consumption - Idle Power Consumption 150cd 1min *
4.1 Watt (5%)
Power Consumption - Cinebench R15 Multi Power Efficiency - external Monitor
min: 12.3     avg: 17.3     median: 17.5 (13%)     max: 21.1 Points per Watt

Average Benchmarks Intel Core 2 Duo P8400 → 100% n=8

Average Benchmarks Intel Core i7-1185G7 → 451% n=8

- Bereich der Benchmarkergebnisse für diese Grafikkarte
red legend - Durchschnittliche Benchmarkergebnisse für diese Grafikkarte
* Smaller numbers mean a higher performance
1 This benchmark is not used for the average calculation

Add one or more devices and compare

In the following list you can select (and also search for) devices that should be added to the comparison. You can select more than one device.

restrict list:
v1.28
log 19. 10:09:17

#0 ran 0s before starting gpusingle class +0s ... 0s

#1 checking url part for id 398 +0s ... 0s

#2 checking url part for id 12248 +0s ... 0s

#3 redirected to Ajax server, took 1734599356s time from redirect:0 +0s ... 0s

#4 did not recreate cache, as it is less than 5 days old! Created at Thu, 19 Dec 2024 05:18:43 +0100 +0s ... 0s

#5 composed specs +0.004s ... 0.004s

#6 did output specs +0s ... 0.004s

#7 getting avg benchmarks for device 398 +0.001s ... 0.005s

#8 got single benchmarks 398 +0.022s ... 0.027s

#9 getting avg benchmarks for device 12248 +0.004s ... 0.031s

#10 got single benchmarks 12248 +0.026s ... 0.057s

#11 got avg benchmarks for devices +0s ... 0.057s

#12 min, max, avg, median took s +0.038s ... 0.094s

#13 return log +0.002s ... 0.096s

Teilen Sie diesen Artikel, um uns zu unterstützen. Jeder Link hilft!
Mail Logo
> Notebook Test, Laptop Test und News > Benchmarks / Technik > Benchmarks / Technik > Prozessor Vergleich - Head 2 Head
Autor: Klaus Hinum,  8.09.2017 (Update:  1.07.2023)