

NVIDIA GeForce RTX 4070 Ti SUPER vs Intel Arc A570M vs Intel Arc A550M
NVIDIA GeForce RTX 4070 Ti SUPER
► remove from comparison
Die Nvidia GeForce RTX 4070 Ti SUPER ist eine High-End-Desktop-Grafikkarte basierend auf die Ada Lovelace Architektur. Sie nutzt den AD103 Chip und bietet 8,448 Kerne und 16 GB GDDR6X Grafikspeicher (256 Bit Bus mit 22,4 Gbits).
Die Gaming-Performance reicht auch bei anspruchsvollen Spielen wie bei Cyberpunk noch für 4k mit ultra Settings, jedoch werden die 60 fps nicht mehr immer erreicht. Mit Raytracing empfiehlt sich der Einsatz von DLSS und eventuell das reduzieren der Auflösung. Im Konkurrenzvergleich reiht sich die SUPER Variante wie erwartet zwischen RTX 4080 und alter 4070 Ti ein.
Der AD103 Chip wird bei TSMC in 5nm (4N mit EUV) produziert und ist mit einem TGP (Total Graphics Power) von 285 Watt spezifiziert.
Intel Arc A570M
► remove from comparison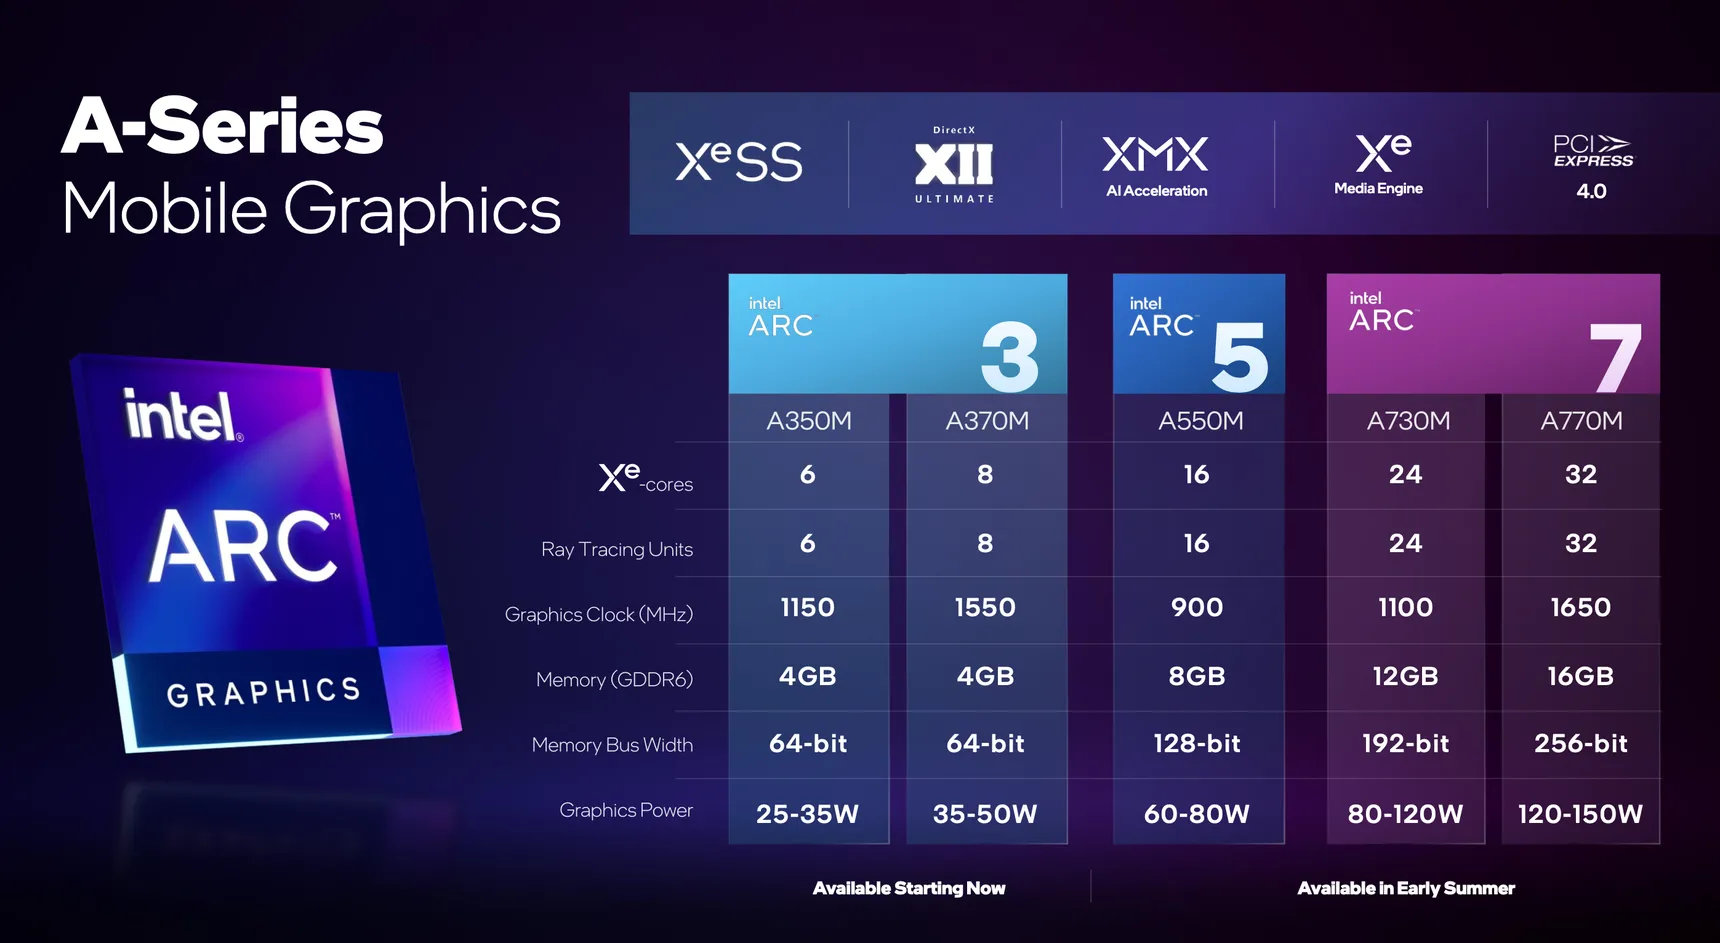
Die Intel Arc A570M (Device ID 5696) ist eine dedizierte Mittelklasse-Grafikkarte von Intel für Notebooks. Sie basiert auf den ACM-G12 Chip und bietet 16 Xe-Kerne (256 ALUs), 16 Ray-Tracing-Units und 8 MB L2-Cache. Die Kerne takten von 300 MHz über 1300 MHz (Gaming) bis zu 2,05+ GHz (Turbo). Das Speicherinterface ist 128 Bit breit und unterstützt 8 GB GDDR6 Grafikspeicher mit 14 Gbps. Der TGP ist zwischen 75 und 95 Watt je nach Modell.
Die Performance der A570M liegt in der unteren Mittelklasse von dedizierten Grafikkarten für Notebooks. Damit sollte die Performance wahrscheinlich zwischen Radeon RX 6500M und 6600M liegen und auch anspruchsvolle Spiele mit mittleren bis hohen Detailstufen flüssig darstellen können. Im Vergleich zur langsameren Arc A550M, unterscheidet sich die A570M nur durch die höhere Taktung und TDP Werte.
Der ACM-G12 Chip wird bei TSMC in 6nm gefertigt (N6 Prozess) und nutzt ein BGA2660 Package. Er integriert zwei Media Engines für VP9, AVC, HEVC, AV1 8k60 12-Bit HDR Dekodierung und 8k 10-Bit HDR Enkodierung. Die integrierten 4 Display Pipes unterstützen 4x 4k120 HDR, HDMI 2.0B, DP 2.0 10G und Adaptive Sync.
Mittels Deep Link kann mit einer CPU der 12. Generation (Alder Lake) Dynamic Power Share genutzt werden.
Intel Arc A550M
► remove from comparisonDie Intel Arc A550M (Device ID 5692) ist eine dedizierte Mittelklasse-Grafikkarte von Intel für Notebooks. Sie basiert auf den ACM-G10 Chip und bietet 16 der 32 Xe-Kerne (256 ALUs), 16 Ray-Tracing-Units, 3 MB L1-Cache und 16 MB L2-Cache. Die Kerne takten von 300 MHz über 900 MHz (Gaming) bis zu 2,05 GHz (Turbo). Das Speicherinterface ist 128 Bit breit und unterstützt 8 GB GDDR6 Grafikspeicher mit 14 Gbps. Der TGP ist zwischen 60 und 80 Watt je nach Modell.
Die Performance der A550M liegt in der unteren Mittelklasse von dedizierten Grafikkarten für Notebooks. Damit sollte die Performance wahrscheinlich zwischen Radeon RX 6500M und 6600M liegen und auch anspruchsvolle Spiele mit mittleren bis hohen Detailstufen flüssig darstellen können. Die langsamere Arc A370M basiert auf den kleineren ACM-G11 Chip und bietet eine deutlich schwächere Performance.
Der ACM-G10 Chip wird bei TSMC in 6nm gefertigt (N6 Prozess), nutzt ein BGA2660 Package, bietet 21,7 Mrd. Transistoren und ist 406 mm2 groß. Er integriert zwei Media Engines für VP9, AVC, HEVC, AV1 8k60 12-Bit HDR Dekodierung und 8k 10-Bit HDR Enkodierung. Die integrierten 4 Display Pipes unterstützen 4x 4k120 HDR, HDMI 2.0B, DP 2.0 10G und Adaptive Sync.
Mittels Deep Link kann mit einer CPU der 12. Generation (Alder Lake) Dynamic Power Share genutzt werden.
| NVIDIA GeForce RTX 4070 Ti SUPER | Intel Arc A570M | Intel Arc A550M | |||||||||||||||||||||||||||||||||||||||||||||||||||||||||||||||||||||||||||||||||||||||||||||||||||||||||||||
| Arc Serie |
|
|
| ||||||||||||||||||||||||||||||||||||||||||||||||||||||||||||||||||||||||||||||||||||||||||||||||||||||||||||
| Codename | AD103-275 | Alchemist | Alchemist | ||||||||||||||||||||||||||||||||||||||||||||||||||||||||||||||||||||||||||||||||||||||||||||||||||||||||||||
| Architektur | Ada Lovelace | Xe HPG | Xe HPG | ||||||||||||||||||||||||||||||||||||||||||||||||||||||||||||||||||||||||||||||||||||||||||||||||||||||||||||
| Pipelines | 8448 - unified | 16 - unified | 16 - unified | ||||||||||||||||||||||||||||||||||||||||||||||||||||||||||||||||||||||||||||||||||||||||||||||||||||||||||||
| TMUs | 264 | 128 | 128 | ||||||||||||||||||||||||||||||||||||||||||||||||||||||||||||||||||||||||||||||||||||||||||||||||||||||||||||
| ROPs | 96 | 64 | 64 | ||||||||||||||||||||||||||||||||||||||||||||||||||||||||||||||||||||||||||||||||||||||||||||||||||||||||||||
| Raytracing Cores | 66 | 16 | 16 | ||||||||||||||||||||||||||||||||||||||||||||||||||||||||||||||||||||||||||||||||||||||||||||||||||||||||||||
| Tensor / AI Cores | 264 | ||||||||||||||||||||||||||||||||||||||||||||||||||||||||||||||||||||||||||||||||||||||||||||||||||||||||||||||
| Kerntakt | 2340 - 2610 (Boost) MHz | 900 - 1300 (Boost) MHz | 900 - 2005 (Boost) MHz | ||||||||||||||||||||||||||||||||||||||||||||||||||||||||||||||||||||||||||||||||||||||||||||||||||||||||||||
| Theoretical Performance | 40.1 TFLOPS FP16, 40.1 TFLOPS FP32, 0.63 TFLOPS FP64 | ||||||||||||||||||||||||||||||||||||||||||||||||||||||||||||||||||||||||||||||||||||||||||||||||||||||||||||||
| Cache | L2: 48 MB | L2: 8 MB | L1: 3 MB, L2: 16 MB | ||||||||||||||||||||||||||||||||||||||||||||||||||||||||||||||||||||||||||||||||||||||||||||||||||||||||||||
| Speichertakt | 21000 effective = 1400 MHz | 14000 effective = 1750 MHz | 14000 effective = 1750 MHz | ||||||||||||||||||||||||||||||||||||||||||||||||||||||||||||||||||||||||||||||||||||||||||||||||||||||||||||
| Speicherbandbreite | 256 Bit | 128 Bit | 128 Bit | ||||||||||||||||||||||||||||||||||||||||||||||||||||||||||||||||||||||||||||||||||||||||||||||||||||||||||||
| Speichertyp | GDDR6X | GDDR6 | GDDR6 | ||||||||||||||||||||||||||||||||||||||||||||||||||||||||||||||||||||||||||||||||||||||||||||||||||||||||||||
| Max. Speichergröße | 16 GB | 8 GB | 8 GB | ||||||||||||||||||||||||||||||||||||||||||||||||||||||||||||||||||||||||||||||||||||||||||||||||||||||||||||
| Shared Memory | nein | nein | nein | ||||||||||||||||||||||||||||||||||||||||||||||||||||||||||||||||||||||||||||||||||||||||||||||||||||||||||||
| API | DirectX 12 Ultimate, Shader 6.7, OpenGL 4.6, OpenCL 3.0, Vulkan 1.3 | DirectX 12_2, Shader 6.6, OpenGL 4.6, OpenCL 3.0, Vulkan 1.3 | DirectX 12_2, Shader 6.6, OpenGL 4.6, OpenCL 3.0, Vulkan 1.3 | ||||||||||||||||||||||||||||||||||||||||||||||||||||||||||||||||||||||||||||||||||||||||||||||||||||||||||||
| Stromverbrauch | 285 Watt | 75 Watt (75 - 95 Watt TGP) | 80 Watt (60 - 80 Watt TGP) | ||||||||||||||||||||||||||||||||||||||||||||||||||||||||||||||||||||||||||||||||||||||||||||||||||||||||||||
| Transistors | 45.9 Billion | 21.7 Billion | |||||||||||||||||||||||||||||||||||||||||||||||||||||||||||||||||||||||||||||||||||||||||||||||||||||||||||||
| Die Size | 379 mm² | 406 mm² | |||||||||||||||||||||||||||||||||||||||||||||||||||||||||||||||||||||||||||||||||||||||||||||||||||||||||||||
| Herstellungsprozess | 5 nm | 6 nm | 6 nm | ||||||||||||||||||||||||||||||||||||||||||||||||||||||||||||||||||||||||||||||||||||||||||||||||||||||||||||
| PCIe | 4.0 x16 | 4 16x | 4 16x | ||||||||||||||||||||||||||||||||||||||||||||||||||||||||||||||||||||||||||||||||||||||||||||||||||||||||||||
| Displays | 4 Displays (max.), HDMI 2.1, DisplayPort 1.4a | 4 Displays (max.), HDMI 2.0b, DisplayPort 2.0 10G Ready | 4 Displays (max.), HDMI 2.0b, DisplayPort 2.0 10G Ready | ||||||||||||||||||||||||||||||||||||||||||||||||||||||||||||||||||||||||||||||||||||||||||||||||||||||||||||
| Erscheinungsdatum | 24.01.2024 | 31.07.2023 | 30.03.2022 | ||||||||||||||||||||||||||||||||||||||||||||||||||||||||||||||||||||||||||||||||||||||||||||||||||||||||||||
| Predecessor | NVIDIA GeForce RTX 4070 Ti | ||||||||||||||||||||||||||||||||||||||||||||||||||||||||||||||||||||||||||||||||||||||||||||||||||||||||||||||
| Memory Bandwidth | 224 GB/s | 224 GB/s | |||||||||||||||||||||||||||||||||||||||||||||||||||||||||||||||||||||||||||||||||||||||||||||||||||||||||||||
| Herstellerseite | www.intel.com | ark.intel.com |
Benchmarks
Cinebench R15 OpenGL 64 Bit + NVIDIA GeForce RTX 4070 Ti SUPER
Average Benchmarks NVIDIA GeForce RTX 4070 Ti SUPER → 0% n=0
Average Benchmarks Intel Arc A550M → 0% n=0
* Smaller numbers mean a higher performance
1 This benchmark is not used for the average calculation
Spiele-Benchmarks
Die folgenden Benchmarks basieren auf unseren Spieletests mit Testnotebooks. Die Performance dieser Grafikkarte bei den gelisteten Spielen ist abhängig von der verwendeten CPU, Speicherausstattung, Treiber und auch Betriebssystem. Dadurch müssen die untenstehenden Werte nicht repräsentativ sein. Detaillierte Informationen über das verwendete System sehen Sie nach einem Klick auf den fps-Wert.

Black Myth: Wukong
2024


Alan Wake 2
2023


Baldur's Gate 3
2023
F1 23
2023

F1 22
2022
Ghostwire Tokyo
2022
Cyberpunk 2077 1.6
2022
Dying Light 2
2022
Far Cry 6
2021
Watch Dogs Legion
2020

Borderlands 3
2019
Control
2019
Metro Exodus
2019

Strange Brigade
2018
Far Cry 5
2018
X-Plane 11.11
2018
Dota 2 Reborn
2015
The Witcher 3
2015
GTA V
2015Average Gaming NVIDIA GeForce RTX 4070 Ti SUPER → 100%
Average Gaming 30-70 fps → 100%
| NVIDIA GeForce RTX 4070 Ti SUPER | low | med. | high | ultra | QHD | 4K |
|---|---|---|---|---|---|---|
| Black Myth: Wukong | 26 | |||||
| Avatar Frontiers of Pandora | 163 | 141.8 | 113.2 | 76.6 | 39.8 | |
| Call of Duty Modern Warfare 3 2023 | 227 | 184 | 179 | 133 | 84 | |
| Alan Wake 2 | 124.7 | 114.4 | 82.5 | 44.7 | ||
| Assassin's Creed Mirage | 221 | 206 | 170 | 136 | 84 | |
| Cyberpunk 2077 2.1 Phantom Liberty | 188.5 | 188.5 | 170.8 | 150.3 | 94.9 | 43 |
| Baldur's Gate 3 | 246 | 223 | 218 | 157.8 | 117.2 | |
| F1 23 | 385 | 402 | 363 | 138.2 | 90 | 45.1 |
| The Callisto Protocol | 210.62 | 202.94 | 149.39 | 114.82 | 70.04 | |
| F1 22 | 371 | 384 | 336 | 144.9 | 95.1 | 48.9 |
| Ghostwire Tokyo | 278 | 282 | 283 | 217 | 99.2 | |
| Cyberpunk 2077 1.6 | 196.9 | 195.9 | 172.3 | 157.5 | 103.6 | 49.7 |
| Dying Light 2 | 213 | 162.2 | 121.5 | 63.7 | ||
| Far Cry 6 | 209 | 191 | 169 | 154 | 91 | |
| Watch Dogs Legion | 171.2 | 159.3 | 144.2 | 115.9 | 68.6 | |
| Mafia Definitive Edition | 239 | 231 | 181 | 96.6 | ||
| Borderlands 3 | 192.1 | 176.8 | 169.6 | 143.6 | 79.4 | |
| Control | 226 | 196.9 | 130.3 | 66.4 | ||
| Metro Exodus | 236 | 193.5 | 158.3 | 130.9 | 84.4 | |
| Shadow of the Tomb Raider | 273 | 269 | 256 | 205 | 109.5 | |
| Strange Brigade | 568 | 467 | 442 | 407 | 306 | 161.9 |
| Far Cry 5 | 203 | 197 | 188 | 187 | 119 | |
| X-Plane 11.11 | 224 | 196.7 | 150 | 127.8 | ||
| Final Fantasy XV Benchmark | 235 | 235 | 209 | 168.8 | 98.9 | |
| Dota 2 Reborn | 245 | 228 | 226 | 202 | 203 | |
| The Witcher 3 | 558 | 430 | 210 | 159.3 | ||
| GTA V | 187.6 | 187.6 | 187.4 | 160.1 | 155.3 | 182.1 |
| < 30 fps < 60 fps < 120 fps ≥ 120 fps | 9 | 26 | 1 25 | 1 19 | 8 16 | 1 6 15 4 |
Eine Liste mit weiteren Spielen und allen Grafikkarten finden Sie auf unserer Seite: Welches Spiel ist mit welcher Grafikkarte spielbar?