NVIDIA GeForce RTX 3050 ► remove from comparison Die Nvidia GeForce RTX 3050 ist eine Mid-Range Desktop Grafikkarte mit 8 GB Videospeicher. Im Januar wurde diese Grafikkarte präsentiert, wenngleich die Verfügbarkeit nur bedingt befriedigt werden konnte. Die GeForce RTX 3050 ist aktuell die kleinste Version der aktuellen RTX 3000 Serie, die mit der Ampere-Architektur Turing komplett abgelöst hat. Die GPU verfügt über 2.560 Shadereinheiten / Kerne und basiert auf dem GA106-Chip. Der VRAM ist mit 8-GB-GDDR6-Speicher ausreichend.
Features
Der GA106-Chip wird in 8 nm gefertigt und bietet weiterhin die bekannten Features, wie DLSS (Deep Learning Super Sampling) und Real Time Ray Tracing. Allerdings hat Nvidia hier stark nachgebessert um die Leistung bei Nutzung dieser Features nochmals deutlich zu steigern. Zudem ist der Grafikchip baugleich mit dem der auf der Nvidia GeForce RTX 3060 zum Einsatz kommt.
Performance
Die Performance der GeForce RTX 3050 liegt etwas unter dem Niveau einer Nvidia GeForce RTX 2060. Damit ordnet sich die RTX 3050 im guten Mittelfeld ein und kann die meisten Spiele der Jahre 2020 und 2021 in hohen Einstellungen und in 1.080p flüssig darstellen.
Leistungsaufnahme
Die Leistungsaufnahme der GeForce RTX 3050 wird vom Hersteller mit 130 Watt beziffert und ist damit etwas sparsamer als eine Nvidia GeForce RTX 2060 (160 Watt).
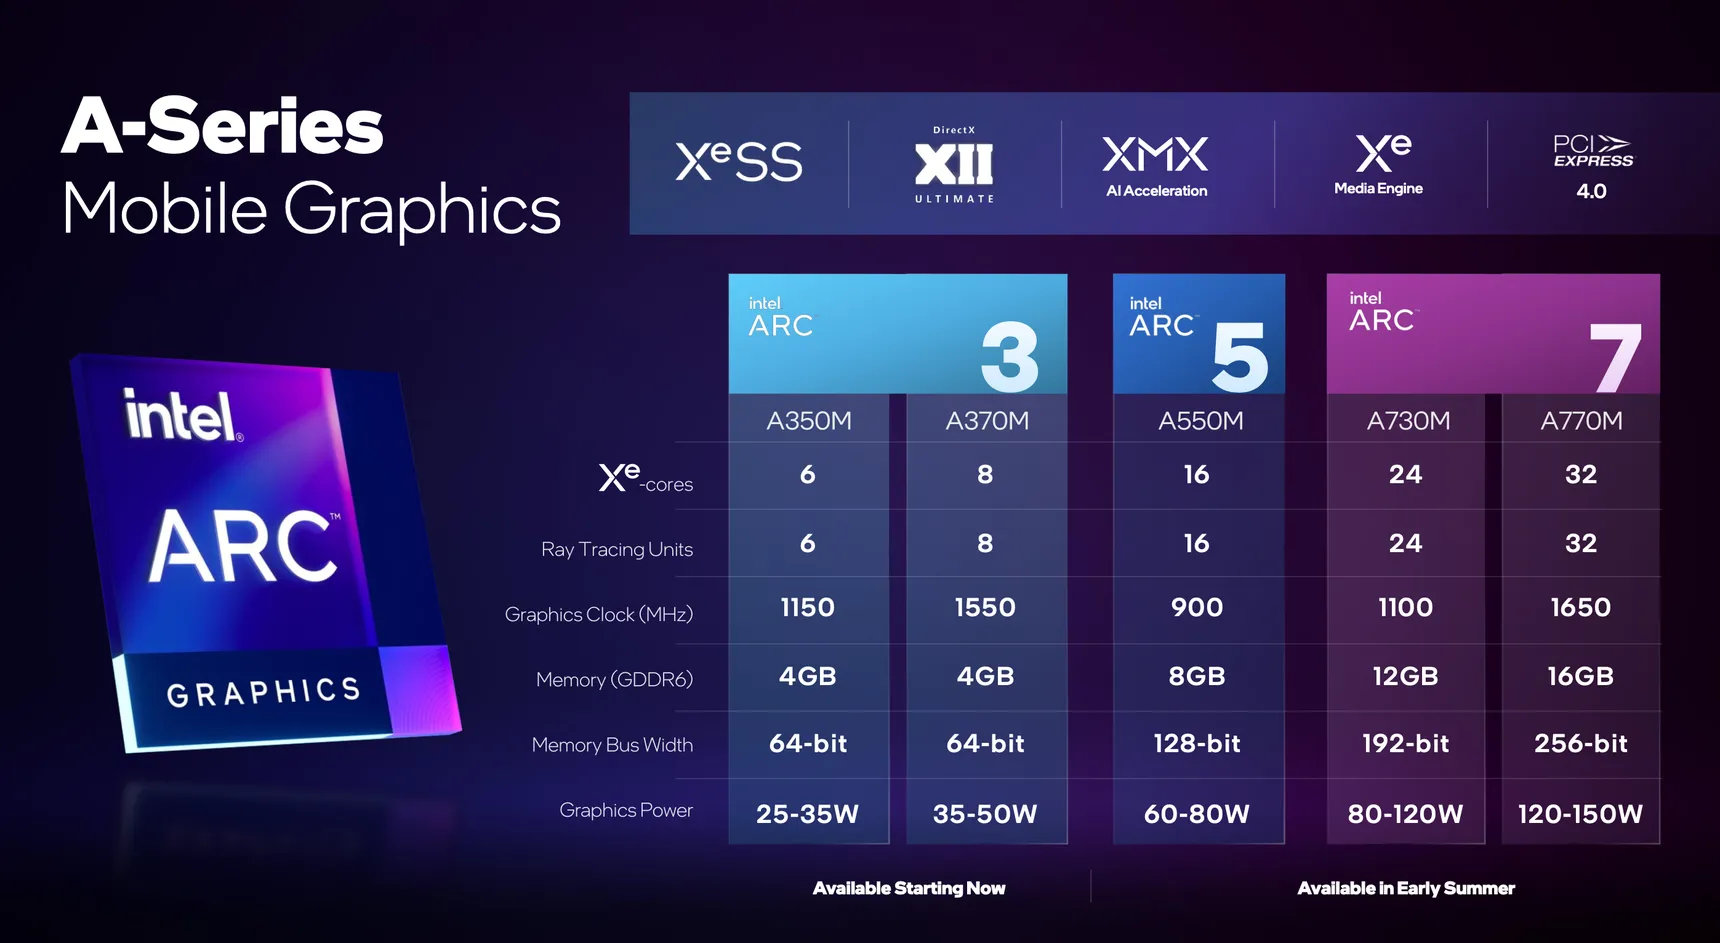
Intel Arc A310 ► remove from comparison Die Intel Arc A310 ist eine dedizierte Einstiegs-Grafikkarte von Intel für Desktops. Sie basiert auf den ACM-G11 Chip und bietet 6 der 8 Xe-Kerne (96 ALUs), 6 der 8 Ray-Tracing-Units, 1,152 MB L1-Cache und 4MB L2-Cache. Das Speicherinterface ist 64 Bit breit und unterstützt 4GB GDDR6 Grafikspeicher mit 15,5 Gbps. Der TGP ist zwischen 40 und 75 Watt je nach Modell.
Der A310 ist ähnlich zur mobilen Arc A350M , bis auf die höheren Taktraten der Kerne und des Speichers.
Der ACM-G11 Chip wird bei TSMC in 6nm gefertigt (N6 Prozess) und bietet 7,2 Mrd. Transistoren und ist 157 mm2 groß. Er integriert zwei Media Engines für VP9, AVC, HEVC, AV1 8k60 12-Bit HDR Dekodierung und 8k 10-Bit HDR Enkodierung. Die integrierten 4 Display Pipes unterstützen 4x 4k120 HDR, HDMI 2.0B, DP 2.0 10G und Adaptive Sync.
Intel Arc A350M ► remove from comparison Die Intel Arc A350M ist eine dedizierte Einstiegs-Grafikkarte von Intel für Notebooks. Sie basiert auf den ACM-G11 Chip und bietet 6 der 8 Xe-Kerne (96 ALUs), 6 der 8 Ray-Tracing-Units, 1,152 MB L1-Cache und 4MB L2-Cache. Das Speicherinterface ist 64 Bit breit und unterstützt 4GB GDDR6 Grafikspeicher mit 14 Gbps. Der TGP ist zwischen 25 und 35 Watt je nach Modell.
Die Performance sollte etwas oberhalb der älteren Intel Xe Max liegen (ebenfalls 96 ALUs) und dadurch in der Einstiegsklasse von dedizierten GPUs.
Der ACM-G11 Chip wird bei TSMC in 6nm gefertigt (N6 Prozess) und bietet 7,2 Mrd. Transistoren und ist 157 mm2 groß. Er integriert zwei Media Engines für VP9, AVC, HEVC, AV1 8k60 12-Bit HDR Dekodierung und 8k 10-Bit HDR Enkodierung. Die integrierten 4 Display Pipes unterstützen 4x 4k120 HDR, HDMI 2.0B, DP 2.0 10G und Adaptive Sync.
Mittels Deep Link kann mit einer CPU der 12. Generation (Alder Lake) Dynamic Power Share genutzt werden.
NVIDIA GeForce RTX 3050 Intel Arc A310 Intel Arc A350M Arc Serie Arc B580 2560 @ 2.67 - 2.67 GHz 192 Bit @ 19000 MHz Arc A770 4096 @ 2.1 - 2.4 GHz 256 Bit @ 16000 MHz Arc A750 3584 @ 2.05 - 2.4 GHz 256 Bit @ 16000 MHz Arc A580 3072 @ 1.7 - 2 GHz 256 Bit @ 16000 MHz A770M 4096 @ 1.65 GHz 256 Bit @ 16000 MHz A730M 3072 @ 1.1 GHz 192 Bit @ 14000 MHz A570M 16 @ 0.9 - 1.3 GHz 128 Bit @ 14000 MHz A550M 16 @ 0.9 - 2.01 GHz 128 Bit @ 14000 MHz A530M 12 @ 0.9 - 1.3 GHz 128 Bit @ 14000 MHz A370M 8 @ 1.55 GHz 64 Bit @ 14000 MHz Arc A380 1024 @ 2 GHz 96 Bit @ 15500 MHz A310 6 @ 2 GHz 64 Bit @ 15500 MHz A350M 6 @ 1.15 GHz 64 Bit @ 14000 MHz
Arc B580 2560 @ 2.67 - 2.67 GHz 192 Bit @ 19000 MHz Arc A770 4096 @ 2.1 - 2.4 GHz 256 Bit @ 16000 MHz Arc A750 3584 @ 2.05 - 2.4 GHz 256 Bit @ 16000 MHz Arc A580 3072 @ 1.7 - 2 GHz 256 Bit @ 16000 MHz A770M 4096 @ 1.65 GHz 256 Bit @ 16000 MHz A730M 3072 @ 1.1 GHz 192 Bit @ 14000 MHz A570M 16 @ 0.9 - 1.3 GHz 128 Bit @ 14000 MHz A550M 16 @ 0.9 - 2.01 GHz 128 Bit @ 14000 MHz A530M 12 @ 0.9 - 1.3 GHz 128 Bit @ 14000 MHz A370M 8 @ 1.55 GHz 64 Bit @ 14000 MHz Arc A380 1024 @ 2 GHz 96 Bit @ 15500 MHz A310 6 @ 2 GHz 64 Bit @ 15500 MHz A350M 6 @ 1.15 GHz 64 Bit @ 14000 MHz
Codename Ampere GA106 Alchemist Alchemist Architektur Ampere Xe HPG Xe HPG Pipelines 2560 - unified 6 - unified 6 - unified Kerntakt 1552 - 1777 (Boost) MHz 2000 (Boost) MHz 1150 MHz Speichertakt 1750 MHz 15500 MHz 14000 MHz Speicherbandbreite 128 Bit Bit 64 Bit 64 Bit Speichertyp GDDR6 GDDR6 GDDR6 Max. Speichergröße 8 GB 4 GB 4 GB Shared Memory nein nein nein API DirectX 12_2, Shader 6.6, OpenGL 4.6 DirectX 12_2, OpenGL 4.6, Vulkan 1.3 DirectX 12_2, OpenGL 4.6, Vulkan 1.3 Stromverbrauch 130 Watt 75 Watt (40 - 75 Watt TGP) 35 Watt (25 - 35 Watt TGP) Transistors 12 Billion 7.2 Billion 7.2 Billion Herstellungsprozess 8 nm 6 nm 6 nm Erscheinungsdatum 04.01.2022 01.09.2022 30.03.2022 Raytracing Cores 6 6 Cache L1: 1.1 MB, L2: 4 MB L1: 1.1 MB, L2: 4 MB Memory Bandwidth 124 GB/s 112 GB/s Die Size 157 mm² 157 mm² PCIe 4 8x 4 8x Displays 4 Displays (max.), HDMI 2.0b, DisplayPort 2.0 10G Ready 4 Displays (max.), HDMI 2.0b, DisplayPort 2.0 10G Ready Herstellerseite www.intel.com ark.intel.com
Performance Rating - 3DMark 11 + Fire Strike + Time Spy - NVIDIA GeForce RTX 3050
...
...
NVIDIA GeForce RTX 5090
Performance Rating - 3DMark 11 + Fire Strike + Time Spy - A310
...
...
NVIDIA GeForce RTX 5090
3DMark - 3DMark Time Spy Score
min: 6694 avg: 6726 median: 6725.5 (18%) max: 6757 Points
GPU TDP ? TDP 130 W 100% 99%
Modell CPU GPU RAM Wert Sparkle Intel Arc A310 Elf i9-13900K A310 75 W ? / 1937 MHz 4 GB 48 GB 3743
GPU TDP ? TDP 75 W TDP 130 W 100% 55% 99%
min: 2976 avg: 3289 median: 3397 (9%) max: 3494 Points
GPU TDP ? TDP 35 W TDP 75 W TDP 130 W 68% 44% 56% 100%
3DMark - 3DMark Time Spy Graphics
min: 6102 avg: 6150 median: 6150 (13%) max: 6198 Points
GPU TDP ? TDP 130 W 98% 100%
Modell CPU GPU RAM Wert Sparkle Intel Arc A310 Elf i9-13900K A310 75 W ? / 1937 MHz 4 GB 48 GB 3269
GPU TDP ? TDP 75 W TDP 130 W 98% 53% 100%
min: 2731 avg: 2993 median: 3050 (6%) max: 3197 Points
GPU TDP ? TDP 35 W TDP 75 W TDP 130 W 66% 44% 53% 100%
3DMark - 3DMark Ice Storm Unlimited Graphics
min: 492229 avg: 580371 median: 580370 (59%) max: 668512 Points
GPU TDP ? TDP 130 W 100% 74%
3DMark - 3DMark Ice Storm Extreme Graphics
min: 268651 avg: 276734 median: 276734 (32%) max: 284817 Points
GPU TDP ? TDP 130 W 100% 94%
3DMark - 3DMark Cloud Gate Score
min: 53465 avg: 56411 median: 56411 (53%) max: 59357 Points
GPU TDP ? TDP 130 W 100% 90%
Modell CPU GPU RAM Wert Sparkle Intel Arc A310 Elf i9-13900K A310 75 W ? / 1937 MHz 4 GB 48 GB 44891
GPU TDP ? TDP 75 W TDP 130 W 100% 76% 90%
min: 23965 avg: 25147 median: 25146.5 (24%) max: 26328 Points
GPU TDP ? TDP 35 W TDP 75 W TDP 130 W 78% 49% 84% 100%
3DMark - 3DMark Cloud Gate Graphics
min: 89245 avg: 90224 median: 90224 (22%) max: 91203 Points
GPU TDP ? TDP 130 W 100% 98%
Modell CPU GPU RAM Wert Sparkle Intel Arc A310 Elf i9-13900K A310 75 W ? / 1937 MHz 4 GB 48 GB 53244
GPU TDP ? TDP 75 W TDP 130 W 100% 58% 98%
min: 28623 avg: 36315 median: 36314.5 (9%) max: 44006 Points
GPU TDP ? TDP 35 W TDP 75 W TDP 130 W 67% 49% 60% 100%
3DMark - 3DMark Fire Strike Standard Score
min: 14713 avg: 14734 median: 14733.5 (22%) max: 14754 Points
GPU TDP ? TDP 130 W 100% 100%
Modell CPU GPU RAM Wert Sparkle Intel Arc A310 Elf i9-13900K A310 75 W ? / 1937 MHz 4 GB 48 GB 8192
GPU TDP ? TDP 75 W TDP 130 W 100% 56% 100%
min: 5961 avg: 6267 median: 6009 (9%) max: 6832 Points
GPU TDP ? TDP 35 W TDP 75 W TDP 130 W 62% 41% 56% 100%
3DMark - 3DMark Fire Strike Standard Graphics
min: 15545 avg: 15685 median: 15684.5 (14%) max: 15824 Points
GPU TDP ? TDP 130 W 98% 100%
Modell CPU GPU RAM Wert Sparkle Intel Arc A310 Elf i9-13900K A310 75 W ? / 1937 MHz 4 GB 48 GB 8464
GPU TDP ? TDP 75 W TDP 130 W 98% 53% 100%
min: 6800 avg: 7088 median: 7147 (7%) max: 7318 Points
GPU TDP ? TDP 35 W TDP 75 W TDP 130 W 63% 43% 53% 100%
3DMark - 3DMark Ice Storm Graphics
min: 329279 avg: 342986 median: 342986 (38%) max: 356693 Points
GPU TDP ? TDP 130 W 100% 92%
Modell CPU GPU RAM Wert Sparkle Intel Arc A310 Elf i9-13900K A310 75 W ? / 1937 MHz 4 GB 48 GB 257130
GPU TDP ? TDP 75 W TDP 130 W 100% 72% 92%
3DMark - 3DMark Wild Life Unlimited
3DMark - 3DMark Wild Life Extreme Unlimited
min: 5189 avg: 5300 median: 5299.5 (6%) max: 5410 Points
GPU TDP ? TDP 35 W 100% 96%
3DMark - 3DMark Night Raid
3DMark - 3DMark Night Raid Graphics Score
3DMark 11 - 3DM11 Performance Score
min: 21488 avg: 21938 median: 21937.5 (27%) max: 22387 Points
GPU TDP ? TDP 130 W 100% 96%
Modell CPU GPU RAM Wert Sparkle Intel Arc A310 Elf i9-13900K A310 75 W ? / 1937 MHz 4 GB 48 GB 13031
GPU TDP ? TDP 75 W TDP 130 W 100% 58% 96%
min: 10123 avg: 10766 median: 10766 (13%) max: 11409 Points
GPU TDP ? TDP 35 W TDP 75 W TDP 130 W 79% 47% 61% 100%
3DMark 11 - 3DM11 Performance GPU
min: 21288 avg: 21358 median: 21357.5 (16%) max: 21427 Points
GPU TDP ? TDP 130 W 99% 100%
Modell CPU GPU RAM Wert Sparkle Intel Arc A310 Elf i9-13900K A310 75 W ? / 1937 MHz 4 GB 48 GB 11915
GPU TDP ? TDP 75 W TDP 130 W 99% 56% 100%
min: 10687 avg: 10730 median: 10730 (8%) max: 10773 Points
GPU TDP ? TDP 35 W TDP 75 W TDP 130 W 75% 50% 56% 100%
3DMark Vantage + NVIDIA GeForce RTX 3050 3DMark Vantage - 3DM Vant. Perf. total
min: 72487 avg: 77234 median: 77233.5 (22%) max: 81980 Points
GPU TDP ? TDP 130 W 100% 88%
3DM Vant. Perf. total + Intel Arc A310 Modell CPU GPU RAM Wert Sparkle Intel Arc A310 Elf i9-13900K A310 75 W ? / 1937 MHz 4 GB 48 GB 46839
GPU TDP ? TDP 75 W TDP 130 W 100% 57% 88%
3DM Vant. Perf. total + Intel Arc A350M GPU TDP ? TDP 35 W TDP 75 W TDP 130 W 100% 38% 57% 88%
3DM Vant. Perf. GPU no PhysX + NVIDIA GeForce RTX 3050 3DMark Vantage - 3DM Vant. Perf. GPU no PhysX
min: 70014 avg: 73171 median: 73170.5 (40%) max: 76327 Points
GPU TDP ? TDP 130 W 100% 92%
3DM Vant. Perf. GPU no PhysX + Intel Arc A310 Modell CPU GPU RAM Wert Sparkle Intel Arc A310 Elf i9-13900K A310 75 W ? / 1937 MHz 4 GB 48 GB 39213
GPU TDP ? TDP 75 W TDP 130 W 100% 51% 92%
3DM Vant. Perf. GPU no PhysX + Intel Arc A350M GPU TDP ? TDP 35 W TDP 75 W TDP 130 W 100% 37% 51% 92%
3DMark 05 - 3DMark 05 - Standard
min: 61355 avg: 72916 median: 72915.5 (80%) max: 84476 Points
GPU TDP ? TDP 130 W 100% 73%
3DMark 06 3DMark 06 - Standard 1280x1024 + NVIDIA GeForce RTX 3050 3DMark 06
min: 47305 avg: 56504 median: 56504 (74%) max: 65703 Points
GPU TDP ? TDP 130 W 100% 72%
3DMark 06 - Standard 1280x1024 + Intel Arc A310 Modell CPU GPU RAM Wert 3DMark 06 - Standard 1280x1024 Sparkle Intel Arc A310 Elf (3DMark 06 - Standard 1280x1024) i9-13900K A310 75 W ? / 1937 MHz 4 GB 48 GB 53771
GPU TDP ? TDP 75 W TDP 130 W 100% 82% 72%
3DMark 06 - Standard 1280x1024 + Intel Arc A350M GPU TDP ? TDP 35 W TDP 75 W TDP 130 W 100% 48% 82% 72%
Unigine Valley 1.0 - Unigine Valley 1.0 DX
min: 72.7 avg: 73.5 median: 73.5 (22%) max: 74.3 fps
GPU TDP ? TDP 130 W 100% 98%
GPU TDP ? TDP 35 W TDP 130 W 100% 26% 98%
SPECviewperf 12 + NVIDIA GeForce RTX 3050 SPECviewperf 12 - specvp12 sw-03
min: 53.4 avg: 59.3 median: 59.3 (15%) max: 65.2 fps
GPU TDP ? TDP 130 W 100% 82%
specvp12 snx-02 + NVIDIA GeForce RTX 3050 SPECviewperf 12 - specvp12 snx-02
min: 7.45 avg: 7.6 median: 7.6 (1%) max: 7.83 fps
GPU TDP ? TDP 130 W 100% 95%
specvp12 showcase-01 + NVIDIA GeForce RTX 3050 SPECviewperf 12 - specvp12 showcase-01
min: 74.5 avg: 77 median: 77 (13%) max: 79.4 fps
GPU TDP ? TDP 130 W 94% 100%
specvp12 mediacal-01 + NVIDIA GeForce RTX 3050 SPECviewperf 12 - specvp12 mediacal-01
min: 31.5 avg: 35.7 median: 35.7 (9%) max: 39.9 fps
GPU TDP ? TDP 130 W 100% 79%
specvp12 maya-04 + NVIDIA GeForce RTX 3050 SPECviewperf 12 - specvp12 maya-04
min: 142 avg: 148 median: 148 (40%) max: 154 fps
GPU TDP ? TDP 130 W 100% 92%
specvp12 energy-01 + NVIDIA GeForce RTX 3050 SPECviewperf 12 - specvp12 energy-01
min: 7.14 avg: 7.2 median: 7.2 (6%) max: 7.29 fps
GPU TDP ? TDP 130 W 100% 98%
specvp12 creo-01 + NVIDIA GeForce RTX 3050 SPECviewperf 12 - specvp12 creo-01
min: 43.4 avg: 44.9 median: 44.9 (18%) max: 46.4 fps
GPU TDP ? TDP 130 W 100% 94%
specvp12 catia-04 + NVIDIA GeForce RTX 3050 SPECviewperf 12 - specvp12 catia-04
min: 53.4 avg: 55.2 median: 55.2 (9%) max: 56.9 fps
GPU TDP ? TDP 130 W 100% 94%
specvp12 3dsmax-05 + NVIDIA GeForce RTX 3050 SPECviewperf 12 - specvp12 3dsmax-05
min: 156 avg: 157.5 median: 157.5 (24%) max: 159 fps
GPU TDP ? TDP 130 W 100% 98%
SPECviewperf 13 specvp13 sw-04 + NVIDIA GeForce RTX 3050 SPECviewperf 13 - specvp13 sw-04
min: 74.5 avg: 87.2 median: 87.2 (23%) max: 99.9 fps
GPU TDP ? TDP 130 W 100% 75%
specvp13 sw-04 + Intel Arc A350M GPU TDP ? TDP 35 W TDP 130 W 100% 58% 75%
specvp13 snx-03 + NVIDIA GeForce RTX 3050 SPECviewperf 13 - specvp13 snx-03
min: 13.4 avg: 13.8 median: 13.8 (2%) max: 14.1 fps
GPU TDP ? TDP 130 W 100% 95%
specvp13 snx-03 + Intel Arc A350M GPU TDP ? TDP 35 W TDP 130 W 100% 23% 95%
specvp13 showcase-02 + NVIDIA GeForce RTX 3050 SPECviewperf 13 - specvp13 showcase-02
min: 74.5 avg: 77 median: 77 (13%) max: 79.5 fps
GPU TDP ? TDP 130 W 94% 100%
specvp13 showcase-02 + Intel Arc A350M GPU TDP ? TDP 35 W TDP 130 W 94% 35% 100%
specvp13 medical-02 + NVIDIA GeForce RTX 3050 SPECviewperf 13 - specvp13 medical-02
min: 43.4 avg: 43.6 median: 43.6 (7%) max: 43.8 fps
GPU TDP ? TDP 130 W 99% 100%
specvp13 medical-02 + Intel Arc A350M GPU TDP ? TDP 35 W TDP 130 W 99% 45% 100%
specvp13 maya-05 + NVIDIA GeForce RTX 3050 SPECviewperf 13 - specvp13 maya-05
min: 202 avg: 204.5 median: 204.5 (23%) max: 207 fps
GPU TDP ? TDP 130 W 100% 98%
specvp13 maya-05 + Intel Arc A350M GPU TDP ? TDP 35 W TDP 130 W 100% 31% 98%
specvp13 energy-02 + NVIDIA GeForce RTX 3050 SPECviewperf 13 - specvp13 energy-02
min: 8.2 avg: 8.2 median: 8.2 (3%) max: 8.23 fps
GPU TDP ? TDP 130 W 100% 100%
specvp13 energy-02 + Intel Arc A350M GPU TDP ? TDP 35 W TDP 130 W 69% 100% 70%
specvp13 creo-02 + NVIDIA GeForce RTX 3050 SPECviewperf 13 - specvp13 creo-02
min: 136 avg: 138 median: 138 (20%) max: 140 fps
GPU TDP ? TDP 130 W 100% 97%
specvp13 creo-02 + Intel Arc A350M GPU TDP ? TDP 35 W TDP 130 W 100% 35% 97%
specvp13 catia-05 + NVIDIA GeForce RTX 3050 SPECviewperf 13 - specvp13 catia-05
min: 76.3 avg: 77.1 median: 77.1 (9%) max: 77.8 fps
GPU TDP ? TDP 130 W 100% 98%
specvp13 catia-05 + Intel Arc A350M GPU TDP ? TDP 35 W TDP 130 W 100% 99% 98%
specvp13 3dsmax-06 + NVIDIA GeForce RTX 3050 SPECviewperf 13 - specvp13 3dsmax-06
min: 156 avg: 157.5 median: 157.5 (25%) max: 159 fps
GPU TDP ? TDP 130 W 100% 98%
specvp13 3dsmax-06 + Intel Arc A350M GPU TDP ? TDP 35 W TDP 130 W 100% 35% 98%
SPECviewperf 2020 specvp2020 solidworks-05 4k + NVIDIA GeForce RTX 3050 SPECviewperf 2020 - specvp2020 solidworks-05 4k
specvp2020 snx-04 4k + NVIDIA GeForce RTX 3050 SPECviewperf 2020 - specvp2020 snx-04 4k
min: 10 avg: 10.3 median: 10.3 (1%) max: 10.5 fps
GPU TDP ? TDP 130 W 100% 95%
specvp2020 medical-03 4k + NVIDIA GeForce RTX 3050 SPECviewperf 2020 - specvp2020 medical-03 4k
min: 6.51 avg: 7.2 median: 7.2 (5%) max: 7.87 fps
GPU TDP ? TDP 130 W 100% 83%
specvp2020 maya-06 4k + NVIDIA GeForce RTX 3050 SPECviewperf 2020 - specvp2020 maya-06 4k
min: 120 avg: 121 median: 121 (17%) max: 122 fps
GPU TDP ? TDP 130 W 100% 98%
specvp2020 energy-03 4k + NVIDIA GeForce RTX 3050 SPECviewperf 2020 - specvp2020 energy-03 4k
min: 9.86 avg: 12.7 median: 12.7 (2%) max: 15.5 fps
GPU TDP ? TDP 130 W 100% 64%
specvp2020 creo-03 4k + NVIDIA GeForce RTX 3050 SPECviewperf 2020 - specvp2020 creo-03 4k
min: 54.2 avg: 55.2 median: 55.2 (25%) max: 56.1 fps
GPU TDP ? TDP 130 W 100% 97%
specvp2020 catia-06 4k + NVIDIA GeForce RTX 3050 SPECviewperf 2020 - specvp2020 catia-06 4k
min: 21.5 avg: 21.7 median: 21.7 (14%) max: 21.8 fps
GPU TDP ? TDP 130 W 99% 100%
specvp2020 3dsmax-07 4k + NVIDIA GeForce RTX 3050 SPECviewperf 2020 - specvp2020 3dsmax-07 4k
min: 46.7 avg: 47.1 median: 47.1 (16%) max: 47.5 fps
GPU TDP ? TDP 130 W 100% 98%
specvp2020 solidworks-05 1080p + Intel Arc A350M SPECviewperf 2020 - specvp2020 solidworks-05 1080p
specvp2020 snx-04 1080p + Intel Arc A350M SPECviewperf 2020 - specvp2020 snx-04 1080p
specvp2020 medical-03 1080p + Intel Arc A350M SPECviewperf 2020 - specvp2020 medical-03 1080p
specvp2020 maya-06 1080p + Intel Arc A350M SPECviewperf 2020 - specvp2020 maya-06 1080p
specvp2020 energy-03 1080p + Intel Arc A350M SPECviewperf 2020 - specvp2020 energy-03 1080p
specvp2020 creo-03 1080p + Intel Arc A350M SPECviewperf 2020 - specvp2020 creo-03 1080p
specvp2020 catia-06 1080p + Intel Arc A350M SPECviewperf 2020 - specvp2020 catia-06 1080p
specvp2020 3dsmax-07 1080p + Intel Arc A350M SPECviewperf 2020 - specvp2020 3dsmax-07 1080p
Cinebench R15 + Intel Arc A350M Cinebench R15 - Cinebench R15 OpenGL 64 Bit
min: 138.13 avg: 149.3 median: 149.3 (9%) max: 160.4 fps
GPU TDP ? TDP 35 W 86% 100%
Cinebench R15 OpenGL Ref. Match 64 Bit + Intel Arc A350M Cinebench R15 - Cinebench R15 OpenGL Ref. Match 64 Bit
GPU TDP ? TDP 35 W 100% 100%
GFXBench - GFXBench 5.0 4K Aztec Ruins High Tier Offscreen
Modell CPU GPU RAM Wert Sparkle Intel Arc A310 Elf i9-13900K A310 75 W ? / 1937 MHz 4 GB 48 GB 35.9
GPU TDP 35 W TDP 75 W 82% 100%
GFXBench - GFXBench 5.0 Aztec Ruins High Tier Offscreen
Modell CPU GPU RAM Wert Sparkle Intel Arc A310 Elf i9-13900K A310 75 W ? / 1937 MHz 4 GB 48 GB 80.5
GPU TDP 35 W TDP 75 W 78% 100%
GFXBench - GFXBench 5.0 Aztec Ruins Normal Tier Offscreen
Modell CPU GPU RAM Wert Sparkle Intel Arc A310 Elf i9-13900K A310 75 W ? / 1937 MHz 4 GB 48 GB 199.7
GPU TDP 35 W TDP 75 W 80% 100%
GFXBench - GFXBench Car Chase Offscreen
GFXBench 3.1 - GFXBench Manhattan ES 3.1 Offscreen
GFXBench 3.0 - GFXBench 3.0 Manhattan Offscreen
GFXBench (DX / GLBenchmark) 2.7 + Intel Arc A350M GFXBench (DX / GLBenchmark) 2.7 - GFXBench T-Rex HD Offscreen C24Z16
LuxMark v2.0 64Bit - LuxMark v2.0 Room GPU
min: 980 avg: 1072 median: 1072 (4%) max: 1164 Samples/s
GPU TDP ? TDP 130 W 100% 84%
Modell CPU GPU RAM Wert Sparkle Intel Arc A310 Elf i9-13900K A310 75 W ? / 1937 MHz 4 GB 48 GB 854
GPU TDP ? TDP 75 W TDP 130 W 100% 73% 84%
GPU TDP ? TDP 35 W TDP 75 W TDP 130 W 100% 91% 73% 84%
LuxMark v2.0 64Bit - LuxMark v2.0 Sala GPU
min: 4579 avg: 4730 median: 4730 (8%) max: 4881 Samples/s
GPU TDP ? TDP 130 W 100% 94%
Modell CPU GPU RAM Wert Sparkle Intel Arc A310 Elf i9-13900K A310 75 W ? / 1937 MHz 4 GB 48 GB 2784
GPU TDP ? TDP 75 W TDP 130 W 100% 57% 94%
GPU TDP ? TDP 35 W TDP 75 W TDP 130 W 100% 57% 57% 94%
ComputeMark v2.1 - ComputeMark v2.1 Result
min: 15271 avg: 15274 median: 15273.5 (13%) max: 15276 Points
GPU TDP ? TDP 130 W 100% 100%
Modell CPU GPU RAM Wert Sparkle Intel Arc A310 Elf i9-13900K A310 75 W ? / 1937 MHz 4 GB 48 GB 5254
GPU TDP ? TDP 75 W TDP 130 W 100% 34% 100%
GPU TDP ? TDP 35 W TDP 75 W TDP 130 W 100% 29% 34% 100%
Power Consumption - Furmark Stress Test Power Consumption - external Monitor *
min: 60.5 avg: 69.4 median: 69.4 (9%) max: 78.3 Watt
GPU TDP ? TDP 35 W TDP 130 W 135% 138% 100%
Power Consumption - The Witcher 3 Power Consumption - external Monitor *
min: 53.2 avg: 65.1 median: 65.1 (9%) max: 77 Watt
GPU TDP ? TDP 35 W TDP 130 W 136% 141% 100%
Power Consumption - Witcher 3 Power Consumption *
min: 56.7 avg: 71.2 median: 71.2 (16%) max: 85.6 Watt
GPU TDP ? TDP 35 W 100% 108%
Power Consumption - Power Efficiency - Witcher 3 ultra
min: 0.2395 avg: 0.3 median: 0.3 (25%) max: 0.3245 fps per Watt
GPU TDP ? TDP 35 W 74% 100%
Power Consumption - Power Efficiency - Witcher 3 ultra external Monitor
GPU TDP 35 W TDP 130 W 100% 74%
Emissions Witcher 3 Fan Noise + Intel Arc A350M Emissions - Witcher 3 Fan Noise
Average Benchmarks NVIDIA GeForce RTX 3050 → 100% n=14 Average Benchmarks Intel Arc A310 → 61% n=14 Average Benchmarks Intel Arc A350M → 49% n=14
- Bereich der Benchmarkergebnisse für diese Grafikkarte
- Durchschnittliche Benchmarkergebnisse für diese Grafikkarte
* Smaller numbers mean a higher performance
1 This benchmark is not used for the average calculation
Die folgenden Benchmarks basieren auf unseren Spieletests mit Testnotebooks. Die Performance dieser Grafikkarte bei den gelisteten Spielen ist abhängig von der verwendeten CPU, Speicherausstattung, Treiber und auch Betriebssystem. Dadurch müssen die untenstehenden Werte nicht repräsentativ sein. Detaillierte Informationen über das verwendete System sehen Sie nach einem Klick auf den fps-Wert.
NVIDIA GeForce RTX 3050 low med. high ultra QHD 4K Company of Heroes 3 146.5 124.5 90.2 89.9 64.9 36.7 Sons of the Forest 60.2 56.2 65 39.8 23.7 Atomic Heart 127.3 98.6 56.9 44.7 33.9 19.6 Returnal 70 67 60 50 37 21 Hogwarts Legacy 86.8 67.2 53 42.2 29.2 15.2 Dead Space Remake 59.6 57 50.1 48.5 32 16.1 The Witcher 3 v4.00 145.8 128.2 88.7 70.7 50.4 28.2 High On Life 176.7 108.8 80.7 64.2 38.2 15.5 The Callisto Protocol 108.2 72.5 69 44.1 32.4 18.7 Need for Speed Unbound 149 104.1 83.5 70.7 48.4 24.6 Spider-Man Miles Morales 96.9 85 79.7 70.5 51.5 28.3 Call of Duty Modern Warfare 2 2022 94 96 66 62 44 27 Uncharted Legacy of Thieves Collection 61 58.2 54.7 52 36.2 15.7 A Plague Tale Requiem 76.6 57.8 42.1 31.9 22 12.3 FIFA 23 213 204 131.9 130.2 100.9 57.9 The Quarry 105.7 76.9 62.5 49 33.4 10.3 F1 22 209 185.2 132.2 39.9 24.9 12 Ghostwire Tokyo 115.9 109.2 108.2 106.2 65.3 30.3 Tiny Tina's Wonderlands 142.6 112.5 73.6 56.3 39 20.5 Cyberpunk 2077 1.6 105.8 82.7 61.1 60.5 29.8 12.2 GRID Legends 188.5 144.2 116.6 85.7 67.3 42 Elden Ring 60 60 60 60 51.6 31.1 Dying Light 2 64 54.3 48.3 32.6 16.5 Rainbow Six Extraction 169 135 132 102 66 33 God of War 95 79 62 41 35 23 Halo Infinite 90.9 78.5 73.8 70.4 64.5 Farming Simulator 22 271 159 95.4 95.5 73.3 44.5 Battlefield 2042 152 89.5 75.7 65.6 50.2 29.6 Forza Horizon 5 200 108 94 54 45 31 Call of Duty Vanguard 91.3 93 73.7 65.5 47.4 24.1 Riders Republic 167 97 77 69 49 25 Guardians of the Galaxy 129 99 98 94 62 34 Back 4 Blood 158 135 125 82.9 41.5 Far Cry 6 168 101 85 74 52 7 Alan Wake Remastered 135 131 117 69.3 New World 161 79.1 68.5 61.6 40.9 28.1 F1 2021 431 216 169 82 59 32 Mass Effect Legendary Edition 114 110 94.2 51.7 Cyberpunk 2077 1.0 77 63.2 50.6 41.9 26 12.2 Immortals Fenyx Rising 137 86 78 70 55 34 Assassin´s Creed Valhalla 106 75 62 53 40 24 Dirt 5 214 103 82 61 49 31 Watch Dogs Legion 124 85 73 71 33 19 Mafia Definitive Edition 157 81 75.6 50.4 25.8 Crysis Remastered 268 146 63.2 58.9 42.2 23.7 Horizon Zero Dawn 162 96 79 66 52 28 Death Stranding 167.8 108.5 101.6 98.3 68.2 37.2 F1 2020 402 207 158 107 78 44 Borderlands 3 213 119 76 57 40 22 Control 231 81 60 38 19 Anno 1800 129 123 83.1 40.8 28.6 17.4 Far Cry New Dawn 170 110 103 94 69 37 Metro Exodus 164 80 59 46 36 23 Shadow of the Tomb Raider 243 106 96 79 58 30 Strange Brigade 352 156 123 106 78 45 Far Cry 5 202 118 107 99 68 35 X-Plane 11.11 189 165 130 103 Final Fantasy XV Benchmark 171 91 67 49 28 Rise of the Tomb Raider 215 138 84.7 35 Dota 2 Reborn 256 223 200 181 94 The Witcher 3 363 282 168 65 44 GTA V 188 187 174 81 57 57 < 30 fps < 60 fps < 120 fps ≥ 120 fps 1 17 40 4 38 19 9 40 12 18 34 3 6 36 16 35 23 4
Intel Arc A350M low med. high ultra QHD 4K Hogwarts Legacy 37.5 25 19.8 15.3 10.1 2.96 The Witcher 3 v4.00 56.3 42.6 36.1 29.7 20.4 High On Life 71.9 42.6 38.2 27.8 18.8 4.36 The Callisto Protocol 42.1 28.3 12.3 13.9 8.3 3.1 Spider-Man Miles Morales 41.5 33.2 25.4 20.4 14.7 7.22 Call of Duty Modern Warfare 2 2022 41 37 23 12 7 6 A Plague Tale Requiem 29.9 24.3 20 15 6.4 F1 22 52.1 51.4 35.5 Vampire Bloodhunt 80.6 64.7 54.9 49.9 30.6 10.8 Ghostwire Tokyo 32.2 30.6 29.6 29.2 Cyberpunk 2077 1.6 27.4 18.5 16.2 11.6 GRID Legends 78 56 41 28 Dying Light 2 26.7 21.9 17.8 Rainbow Six Extraction 68 52 45 30 17 2.6 God of War 22 18 15 11 Farming Simulator 22 121 63 47 43 Forza Horizon 5 108 50 47 11 9 6 Riders Republic 60 32 25 21 12 7 Back 4 Blood 139.3 60.2 48.1 46 31 14.9 F1 2021 166.6 63.8 52.2 21.1 Assassin´s Creed Valhalla 65 35 20 16 14 Flight Simulator 2020 43.1 Doom Eternal 113.4 55.6 The Division 2 92 46 37 27 17 7 Strange Brigade 151 66 53 45 36.6 19 Far Cry 5 77 42 39 37 25 12 X-Plane 11.11 39 31 27 19.6 Final Fantasy XV Benchmark 62 32 19 13.6 7 Dota 2 Reborn 103 85 62 59 The Witcher 3 130 80 43 19 15.1 GTA V 153 133 37 15 10.1 11.1 < 30 fps < 60 fps < 120 fps ≥ 120 fps 4 9 12 6 6 16 7 1 13 15 1 17 7 15 3 18
log 14. 05:49:47
#0 ran 0s before starting gpusingle class +0s ... 0s
#1 checking url part for id 11144 +0s ... 0s
#2 checking url part for id 12464 +0s ... 0s
#3 checking url part for id 11149 +0s ... 0s
#4 did not recreate cache, as it is less than 5 days old! Created at Thu, 13 Mar 2025 11:17:12 +0100 +0.001s ... 0.001s
#5 composed specs +0.113s ... 0.114s
#6 did output specs +0s ... 0.114s
#7 start showIntegratedCPUs +0s ... 0.114s
#8 getting avg benchmarks for device 11144 +0.07s ... 0.184s
#9 got single benchmarks 11144 +0.015s ... 0.2s
#10 getting avg benchmarks for device 12464 +0.024s ... 0.224s
#11 got single benchmarks 12464 +0.009s ... 0.232s
#12 getting avg benchmarks for device 11149 +0.003s ... 0.235s
#13 got single benchmarks 11149 +0.017s ... 0.252s
#14 got avg benchmarks for devices +0s ... 0.252s
#15 min, max, avg, median took s +0.809s ... 1.061s
#16 before gaming benchmark output +0s ... 1.061s
#17 Got 776 rows for game benchmarks. +0.107s ... 1.168s
#18 composed SQL query for gamebenchmarks +0s ... 1.168s
#19 got data and put it in $dataArray +0.086s ... 1.254s
#20 benchmarks composed for output. +0.243s ... 1.497s
#21 calculated avg scores. +0s ... 1.497s
#22 return log +0.004s ... 1.501s