Notebookcheck Logo

NVIDIA Maxwell GPU Surface Book vs NVIDIA GeForce 910M

NVIDIA Maxwell GPU Surface Book

► remove from comparison NVIDIA Maxwell GPU (940M, GDDR5)
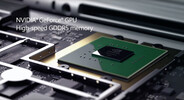
Die Nvidia Maxwell GPU im Surface Book ist eine Nvidia GeForce 940M mit 1 GB GDDR5 Grafikspeicher. Neben leicht abweichenden Taktraten ist der eingesetzte schnellere Grafikspeicher (GDDR5 vs DDR3) der Hauptunterschied. Wie die 940M basiert die Grafikkarte auf dem GM108 Chip mit 384 Shadereinheiten und einem 64-Bit Speicherinterface (hier jedoch wie angemerkt mit GDDR5).

Die Leistung ist durch den schnelleren GDDR5 Grafikspeicher zwischen 10 und 30 Prozent oberhalb der üblichen GeForce 940M anzusiedeln, bleibt jedoch noch klar hinter einer Nvidia Geforce 945M und GTX 950M. Bei anspruchsvollen Spielen reicht es daher meist nur für niedrige Detail-Settings. 

Mehr Details gibt es in unserem umfangreichen Test des Microsoft Surface Book mit dedizierter Grafikkarte (dGPU).

NVIDIA GeForce 910M

► remove from comparison NVIDIA GeForce 910M
Die NVIDIA GeForce 910M (fälschlich auch GT 910M) ist eine DirectX-12-Grafikkarte der Einstiegsklasse, welche im Herbst 2015 vorgestellt wurde. Sie basiert auf dem GK208-Chip, einem 28-Nanometer-Ableger der Kepler-Architektur. Technisch gesehen handelt es sich damit um eine (deutlich) niedriger taktende Nvidia GeForce 920M.

Architektur

GK208 verfügt als kleinste Kepler-Variante über nur 2 Shader-Blöcke (SMX). Zusammen mit zwei Polymorph Engines und einer gemeinsamen Raster Engine bilden diese einen sogenannten GPC (Graphics Processing Cluster). Da die Shader keine eigene Takt-Domain mehr besitzen (Hot Clock), entspricht die Rechenleistung der 384 ALUs in etwa 192 Einheiten der Fermi-Architektur mit doppelter Taktrate. Ferner bietet der GK208-Chip 16 TMUs und 8 ROPs an einem 64-Bit-Speicherinterface für DDR3-Speicher (1.000 MHz bzw. 2.000 MHz effektiv).

Der GK208 unterstützt PCIe 3.0 sowie einen Turbo-Modus namens GPU Boost 2.0. Bei der GeForce 910M scheint allerdings kein extra Boost-Clock definiert zu sein.

Leistung

Infolge der sehr niedrigen Kerntaktrate von lediglich 641 MHz liegt die GeForce 910M deutlich unterhalb der technisch identischen GeForce 920M und etwa auf dem Level der alten GeForce 820M. Auch Intels Prozessor-Grafik HD Graphics 520 wird nur marginal übertroffen. Dadurch sind nur anspruchslose 3D Spiele wie Dota 2 mit dieser Grafikkarte flüssig spielbar.

Features

Das Featureset der 910M entspricht prinzipiell dem anderer GK208-Karten wie der 920M. Dies umfasst unter anderem die Unterstützung von bis zu 4 aktiven Displays (mit Optimus u.U. weniger), die mit einer maximalen Auflösung von 3840 x 2160 Pixeln zum Beispiel über DisplayPort 1.2 (60 Hz) oder HDMI 1.4a (max. 30 Hz) angebunden werden können. HD-Audio-Formate wie Dolby True HD und DTS-HD lassen sich als Bitstream an einen geeigneten Receiver senden. Wie in der Vergangenheit kann jedoch auch weiterhin 3D Vision nicht mit Optimus-Unterstützung kombiniert werden.

Der PureVideo HD Videoprozessor (fünfte Generation (VP5) kann die Formate MPEG-1, MPEG-2, MPEG-4, H.264 und VC1/WMV9 bis zu einer Auflösung von 4k decodieren und somit den Prozessor entlasten. Auch zwei parallele Streams, beispielsweise für Picture-in-Picture bei einer Blu-Ray, sind möglich. Eine weitere Besonderheit ist die Integration eines dedizierten Videoencoders ähnlich Intels Quick Sync, der über die NVENC-API angesprochen werden kann.

Leistungsaufname

Die Leistungsaufnahme der GeForce 910M dürfte infolge der extrem niedrigen Taktraten bei lediglich 10 bis 15 Watt liegen. Damit eignet sich der Chip auch für sehr kompakte Subnotebooks.

NVIDIA Maxwell GPU Surface BookNVIDIA GeForce 910M
GeForce 900M Serie
GeForce 945M compare 512 @ 0.93 - 1.05 GHz128 Bit @ 2000 MHz
Maxwell GPU (940M, GDDR5) 384 @ 0.95 - 0.99 GHz64 Bit @ 5012 MHz
GeForce 940MX compare 384 @ 1.12 - 1.24 GHz64 Bit @ 4000 MHz
GeForce 940M compare 384 @ 1.07 - 1.18 GHz64 Bit @ 2000 MHz
GeForce 930MX compare 384 @ 0.95 - 1.02 GHz64 Bit @ 2000 MHz
GeForce 930M compare 384 @ 0.93 - 0.94 GHz64 Bit @ 1800 MHz
GeForce 920MX compare 256 @ 0.97 - 0.99 GHz64 Bit @ 1800 MHz
GeForce 920M compare 384 @ 0.95 GHz64 Bit @ 1800 MHz
GeForce 910M 384 @ 0.64 GHz64 Bit @ 2000 MHz
CodenameSurface BookN15V-GM
ArchitekturMaxwellKepler
Pipelines384 - unified384 - unified
Kerntakt954 - 993 (Boost) MHz641 MHz
Speichertakt5012 MHz2000 MHz
Speicherbandbreite64 Bit64 Bit
SpeichertypGDDR5DDR3
Max. Speichergröße1024 MB2048 MB
Shared Memoryneinnein
APIDirectX 12 (FL 11_0), Shader 5.0, OpenGL 4.5DirectX 12 (FL 11_0), Shader 5.0
Herstellungsprozess28 nm28 nm
FeaturesGPU Boost 2.0, Optimus, PhysX, CUDA, GeForce ExperiencePhysX, Verde Drivers, CUDA, Play, Optimus, GPU Boost 2.0
Erscheinungsdatum01.10.2015 01.09.2015
Stromverbrauch15 Watt
Transistors900 Million

Benchmarks

Performance Rating - 3DMark 11 + Fire Strike + Time Spy - Maxwell GPU (940M, GDDR5)
0.9 pt (3%)
Performance Rating - 3DMark 11 + Fire Strike + Time Spy - GeForce 910M
0.5 pt (1%)
3DMark - 3DMark Ice Storm Unlimited Graphics
123411 Points (12%)
42738 Points (4%)
3DMark - 3DMark Ice Storm Extreme Graphics
15597 Points (2%)
24517 Points (3%)
3DMark - 3DMark Cloud Gate Score
min: 7424     avg: 7465     median: 7464.5 (7%)     max: 7505 Points
3677 Points (3%)
3DMark - 3DMark Cloud Gate Graphics
min: 11340     avg: 11380     median: 11380 (3%)     max: 11420 Points
6636 Points (2%)
3DMark - 3DMark Fire Strike Standard Score
min: 1886     avg: 1919     median: 1919 (3%)     max: 1952 Points
913 Points (2%)
3DMark - 3DMark Fire Strike Standard Graphics
min: 2031     avg: 2076     median: 2075.5 (2%)     max: 2120 Points
1022 Points (1%)
3DMark - 3DMark Ice Storm Graphics
min: 54088     avg: 54397     median: 54397 (6%)     max: 54706 Points
28613 Points (3%)
3DMark 11 - 3DM11 Performance Score
min: 2711     avg: 2736     median: 2736 (4%)     max: 2761 Points
1432 Points (2%)
3DMark 11 - 3DM11 Performance GPU
min: 2548     avg: 2577     median: 2577 (2%)     max: 2606 Points
1413 Points (1%)
3DMark Vantage
3DM Vant. Perf. total + NVIDIA GeForce 910M
3DMark Vantage - 3DM Vant. Perf. total
4325 Points (1%)
3DM Vant. Perf. GPU no PhysX + NVIDIA GeForce 910M
3DMark Vantage - 3DM Vant. Perf. GPU no PhysX
4151 Points (2%)
3DMark 06 3DMark 06 - Standard 1280x1024 + NVIDIA Maxwell GPU Surface Book
3DMark 06
15111 Points (20%)
3DMark 06 - Standard 1280x1024 + NVIDIA GeForce 910M
6741 Points (9%)
Unigine Heaven 3.0 - Unigine Heaven 3.0 DX 11
14.4 fps (5%)
Unigine Heaven 3.0 - Unigine Heaven 3.0 OpenGL
13.3 fps (6%)
Unigine Heaven 2.1 - Heaven 2.1 high
18 fps (3%)
Cinebench R10 Cinebench R10 Shading (32bit) + NVIDIA Maxwell GPU Surface Book
Cinebench R10 - Cinebench R10 Shading (32bit)
min: 5247     avg: 5704     median: 5703.5 (4%)     max: 6160 Points
Cinebench R10 Shading (32bit) + NVIDIA GeForce 910M
2500 Points (2%)
Cinebench R11.5 Cinebench R11.5 OpenGL 64 Bit + NVIDIA Maxwell GPU Surface Book
Cinebench R11.5 - Cinebench R11.5 OpenGL 64 Bit
min: 29.03     avg: 30.3     median: 30.3 (10%)     max: 31.49 fps
Cinebench R15
Cinebench R15 OpenGL 64 Bit + NVIDIA Maxwell GPU Surface Book
Cinebench R15 - Cinebench R15 OpenGL 64 Bit
min: 32.35     avg: 35     median: 35 (2%)     max: 37.6 fps
Cinebench R15 OpenGL 64 Bit + NVIDIA GeForce 910M
24 fps (1%)
Cinebench R15 OpenGL Ref. Match 64 Bit + NVIDIA Maxwell GPU Surface Book
Cinebench R15 - Cinebench R15 OpenGL Ref. Match 64 Bit
99.6 % (100%)
Cinebench R15 OpenGL Ref. Match 64 Bit + NVIDIA GeForce 910M
99.6 % (100%)
GFXBench - GFXBench Car Chase Offscreen
22.3 fps (2%)
GFXBench 3.1 - GFXBench Manhattan ES 3.1 Offscreen
30.9 fps (1%)
GFXBench 3.0 - GFXBench 3.0 Manhattan Offscreen
42.6 fps (2%)
GFXBench (DX / GLBenchmark) 2.7
GFXBench T-Rex HD Offscreen C24Z16 + NVIDIA GeForce 910M
GFXBench (DX / GLBenchmark) 2.7 - GFXBench T-Rex HD Offscreen C24Z16
78.7 fps (1%)
LuxMark v2.0 64Bit - LuxMark v2.0 Room GPU
513 Samples/s (2%)
95 Samples/s (0%)
LuxMark v2.0 64Bit - LuxMark v2.0 Sala GPU
1065 Samples/s (2%)
189 Samples/s (0%)
ComputeMark v2.1 - ComputeMark v2.1 Result
1676 Points (2%)
929 Points (1%)

Average Benchmarks NVIDIA Maxwell GPU Surface Book → 100% n=16

Average Benchmarks NVIDIA GeForce 910M → 57% n=16

- Bereich der Benchmarkergebnisse für diese Grafikkarte
red legend - Durchschnittliche Benchmarkergebnisse für diese Grafikkarte
* Smaller numbers mean a higher performance
1 This benchmark is not used for the average calculation

Spiele-Benchmarks

Die folgenden Benchmarks basieren auf unseren Spieletests mit Testnotebooks. Die Performance dieser Grafikkarte bei den gelisteten Spielen ist abhängig von der verwendeten CPU, Speicherausstattung, Treiber und auch Betriebssystem. Dadurch müssen die untenstehenden Werte nicht repräsentativ sein. Detaillierte Informationen über das verwendete System sehen Sie nach einem Klick auf den fps-Wert.

low 1280x720
GeForce 910M:
22.6  fps
med. 1366x768
GeForce 910M:
13.8  fps
high 1920x1080
GeForce 910M:
6.5  fps
ultra 1920x1080
GeForce 910M:
3.9  fps
low 1280x720
GeForce 910M:
19.6  fps
med. 1366x768
GeForce 910M:
11.5  fps
high 1920x1080
GeForce 910M:
5.6  fps
ultra 1920x1080
GeForce 910M:
3.1  fps
low 1280x720
GeForce 910M:
16  fps
med. 1920x1080
GeForce 910M:
8  fps
high 1920x1080
GeForce 910M:
7  fps
ultra 1920x1080
GeForce 910M:
5  fps
XCOM 2

XCOM 2

2016
low 1280x720
GeForce 910M:
13.5  fps
med. 1920x1080
GeForce 910M:
7.1  fps
high 1920x1080
GeForce 910M:
4.9  fps
ultra 1920x1080
GeForce 910M:
2.1  fps
low 1024x768
GeForce 910M:
14.5  fps
med. 1366x768
GeForce 910M:
9.4  fps
high 1920x1080
GeForce 910M:
6.1  fps
ultra 1920x1080
GeForce 910M:
3.5  fps
low 1024x768
GeForce 910M:
38.8  fps
med. 1366x768
GeForce 910M:
25.3  fps
high 1920x1080
GeForce 910M:
12.6  fps
ultra 1920x1080
GeForce 910M:
10.7  fps
low 1024x768
GeForce 910M:
16.6  fps
med. 1366x768
GeForce 910M:
14.8  fps
high 1920x1080
GeForce 910M:
8.1  fps
ultra 1920x1080
GeForce 910M:
5.7  fps
low 1024x768
GeForce 910M:
23.2  fps
med. 1366x768
GeForce 910M:
16.2  fps
high 1920x1080
GeForce 910M:
7.7  fps
ultra 1920x1080
GeForce 910M:
4.3  fps
Anno 2205

Anno 2205

2015
low 1024x768
GeForce 910M:
22.1  fps
med. 1366x768
GeForce 910M:
13.7  fps
high 1920x1080
GeForce 910M:
6.3  fps
ultra 1920x1080
GeForce 910M:
3.1  fps
low 1366x768
GeForce 910M:
33.8  fps
med. 1366x768
GeForce 910M:
27.2  fps
high 1920x1080
GeForce 910M:
20  fps
ultra 1920x1080
GeForce 910M:
13.9  fps
low 1024x768
100%
Maxwell GPU (940M, GDDR5):
42  fps
97%
GeForce 910M:
40.9  fps
med. 1366x768
100%
Maxwell GPU (940M, GDDR5):
35.9  fps
82%
GeForce 910M:
29.3  fps
high 1920x1080
100%
Maxwell GPU (940M, GDDR5):
19.7  fps
67%
GeForce 910M:
13.2  fps
ultra 1920x1080
100%
Maxwell GPU (940M, GDDR5):
13.3  fps
65%
GeForce 910M:
8.7  fps
low 1280x720
100%
Maxwell GPU (940M, GDDR5):
23  fps
57%
GeForce 910M:
13  fps
med. 1366x768
100%
Maxwell GPU (940M, GDDR5):
14  fps
86%
GeForce 910M:
12  fps
high 1920x1080
GeForce 910M:
7  fps
ultra 1920x1080
GeForce 910M:
4  fps
low 1024x768
GeForce 910M:
46.8  fps
med. 1366x768
GeForce 910M:
24  fps
high 1920x1080
GeForce 910M:
16.8  fps
ultra 1920x1080
GeForce 910M:
12.5  fps
low 1024x768
GeForce 910M:
7.9  fps
med. 1366x768
GeForce 910M:
7.6  fps
high 1920x1080
GeForce 910M:
6.1  fps
ultra 1920x1080
GeForce 910M:
5.9  fps
low 1024x768
GeForce 910M:
28.2  fps
med. 1366x768
GeForce 910M:
20.1  fps
high 1920x1080
GeForce 910M:
7.2  fps
ultra 1920x1080
GeForce 910M:
4.4  fps
F1 2014

F1 2014

2014
low 1024x768
100%
Maxwell GPU (940M, GDDR5):
117  fps
35%
GeForce 910M:
41  fps
med. 1366x768
100%
Maxwell GPU (940M, GDDR5):
94  fps
34%
GeForce 910M:
32  fps
high 1920x1080
100%
Maxwell GPU (940M, GDDR5):
76  fps
32%
GeForce 910M:
24  fps
ultra 1920x1080
100%
Maxwell GPU (940M, GDDR5):
49  fps
33%
GeForce 910M:
16  fps
Thief

Thief

2014
low 1024x768
100%
Maxwell GPU (940M, GDDR5):
45.6  fps
med. 1366x768
100%
Maxwell GPU (940M, GDDR5):
28.2  fps
high 1366x768
100%
Maxwell GPU (940M, GDDR5):
22.3  fps
ultra 1920x1080
100%
Maxwell GPU (940M, GDDR5):
9.4  fps
low 1024x768
GeForce 910M:
33.7  fps
med. 1366x768
GeForce 910M:
24.6  fps
high 1366x768
GeForce 910M:
18.6  fps
ultra 1920x1080
GeForce 910M:
7.3  fps
low 1024x768
100%
Maxwell GPU (940M, GDDR5):
59.6  fps
med. 1366x768
100%
Maxwell GPU (940M, GDDR5):
44.7  fps
high 1366x768
100%
Maxwell GPU (940M, GDDR5):
30.7  fps
ultra 1920x1080
100%
Maxwell GPU (940M, GDDR5):
15.7  fps
low 1280x720
100%
Maxwell GPU (940M, GDDR5):
94.2  fps
54%
GeForce 910M:
50.4  fps
med. 1366x768
100%
Maxwell GPU (940M, GDDR5):
64.8  fps
46%
GeForce 910M:
29.9  fps
high 1366x768
100%
Maxwell GPU (940M, GDDR5):
56.5  fps
46%
GeForce 910M:
25.8  fps
ultra 1920x1080
100%
Maxwell GPU (940M, GDDR5):
20.8  fps
41%
GeForce 910M:
8.6  fps
low 1024x768
100%
Maxwell GPU (940M, GDDR5):
258  fps
med. 1366x768
100%
Maxwell GPU (940M, GDDR5):
141.2  fps
high 1366x768
100%
Maxwell GPU (940M, GDDR5):
74.2  fps
ultra 1920x1080
100%
Maxwell GPU (940M, GDDR5):
37.5  fps
low 1024x768
100%
Maxwell GPU (940M, GDDR5):
161.5  fps
46%
GeForce 910M:
73.6  fps
med. 1366x768
100%
Maxwell GPU (940M, GDDR5):
82.8  fps
46%
GeForce 910M:
38.3  fps
high 1366x768
100%
Maxwell GPU (940M, GDDR5):
55.2  fps
45%
GeForce 910M:
24.9  fps
ultra 1920x1080
100%
Maxwell GPU (940M, GDDR5):
25.8  fps
41%
GeForce 910M:
10.7  fps
low 1024x768
GeForce 910M:
39.1  fps
med. 1366x768
GeForce 910M:
36.3  fps
high 1366x768
GeForce 910M:
34.2  fps
ultra 1920x1080
GeForce 910M:
29.7  fps
low 1024x768
100%
Maxwell GPU (940M, GDDR5):
112.4  fps
med. 1366x768
100%
Maxwell GPU (940M, GDDR5):
85.6  fps
high 1366x768
100%
Maxwell GPU (940M, GDDR5):
42.8  fps
ultra 1920x1080
100%
Maxwell GPU (940M, GDDR5):
10.9  fps
low 1024x768
GeForce 910M:
52.8  fps
med. 1366x768
GeForce 910M:
48.6  fps
high 1366x768
GeForce 910M:
45.5  fps
ultra 1920x1080
GeForce 910M:
30.6  fps

Average Gaming NVIDIA Maxwell GPU Surface Book → 100%

Average Gaming 30-70 fps → 100%

Average Gaming NVIDIA GeForce 910M → 53%

Average Gaming 30-70 fps → 53%

NVIDIA GeForce 910Mlowmed.highultraQHD4K
Mirror's Edge Catalyst22.613.86.53.9
The Division19.611.55.63.1
Far Cry Primal16875
XCOM 213.57.14.92.1
Rise of the Tomb Raider14.59.46.13.5
Rainbow Six Siege38.825.312.610.7
Just Cause 316.614.88.15.7
Star Wars Battlefront23.216.27.74.3
Anno 220522.113.76.33.1
World of Warships33.827.22013.9
Metal Gear Solid V40.929.313.28.7
Batman: Arkham Knight131274
Dirt Rally46.82416.812.5
Battlefield Hardline7.97.66.15.9
Dragon Age: Inquisition28.220.17.24.4
F1 201441322416
Battlefield 433.724.618.67.3
BioShock Infinite50.429.925.88.6
Tomb Raider73.638.324.910.7
Counter-Strike: GO39.136.334.229.7
Diablo III52.848.645.530.6
< 30 fps
< 60 fps
< 120 fps
≥ 120 fps
11
9
1
17
4

19
2

20
1


NVIDIA Maxwell GPU Surface Booklowmed.highultraQHD4K
Metal Gear Solid V4235.919.713.3
Batman: Arkham Knight2314
F1 2014117947649
Thief45.628.222.39.4
Metro: Last Light59.644.730.715.7
BioShock Infinite94.264.856.520.8
StarCraft II: Heart of the Swarm258141.274.237.5
Tomb Raider161.582.855.225.8
Sleeping Dogs112.485.642.810.9
< 30 fps
< 60 fps
< 120 fps
≥ 120 fps
1
3
3
2
2
2
4
1
2
4
2
6
2


Eine Liste mit weiteren Spielen und allen Grafikkarten finden Sie auf unserer Seite: Welches Spiel ist mit welcher Grafikkarte spielbar?

Add one or more devices and compare

In the following list you can select (and also search for) devices that should be added to the comparison. You can select more than one device.

restrict list:
v1.28
log 21. 11:55:36

#0 ran 0s before starting gpusingle class +0s ... 0s

#1 checking url part for id 6927 +0s ... 0s

#2 checking url part for id 7366 +0s ... 0s

#3 redirected to Ajax server, took 1734778536s time from redirect:0 +0s ... 0s

#4 did not recreate cache, as it is less than 5 days old! Created at Thu, 19 Dec 2024 05:19:06 +0100 +0s ... 0s

#5 composed specs +0.005s ... 0.005s

#6 did output specs +0s ... 0.005s

#7 start showIntegratedCPUs +0s ... 0.005s

#8 getting avg benchmarks for device 6927 +0.014s ... 0.019s

#9 got single benchmarks 6927 +0.004s ... 0.024s

#10 getting avg benchmarks for device 7366 +0.004s ... 0.027s

#11 got single benchmarks 7366 +0.003s ... 0.031s

#12 got avg benchmarks for devices +0s ... 0.031s

#13 min, max, avg, median took s +0.019s ... 0.05s

#14 before gaming benchmark output +0s ... 0.05s

#15 Got 118 rows for game benchmarks. +0.006s ... 0.055s

#16 composed SQL query for gamebenchmarks +0s ... 0.055s

#17 got data and put it in $dataArray +0.001s ... 0.057s

#18 benchmarks composed for output. +0.008s ... 0.064s

#19 calculated avg scores. +0s ... 0.064s

#20 return log +0.002s ... 0.067s

Teilen Sie diesen Artikel, um uns zu unterstützen. Jeder Link hilft!
Mail Logo
> Notebook Test, Laptop Test und News > Benchmarks / Technik > Benchmarks / Technik > Grafikkarten Vergleich - Head 2 Head
Autor: Klaus Hinum,  8.09.2017 (Update:  1.07.2023)