Notebookcheck Logo

Mediatek MT6589 vs Mediatek MT8389

Mediatek MT6589

► remove from comparison  MT6589
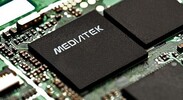
Der Mediatek MT6589 (oder zuvor auch als TMK6588 bekannt) ist ein System-on-a-Chip (SoC) für preisgünstige Tablets und Smartphones. Er wird in 28nm gefertigt und bietet einen Quad-Core Cortex-A7 Prozessorteil, eine PowerVR SGX 544 GPU, Dual-SIM UMTS HSPA+, 1080 30fps Videowiedergabe und Videoaufnahme und 802.11n WLAN, Bluetooth 4.0, GPS und FM. Die Performance ist mit anderen, preiswerten ARM-SoCs wie der Snapdragon-400-Serie von Qualcomm vergleichbar und für Alltagsaufgaben wie Browsing vollkommen ausreichend.

Mediatek MT8389

► remove from comparison  MT8389
Der Mediatek MT8389 ist ein preiswerter ARM-SoC (System on a Chip), der vorrangig in Tablets eingesetzt wird. Er wird in 28 nm gefertigt und integriert einen Quad-Core Cortex-A7-Prozessor sowie eine PowerVR SGX 544 GPU. Die Taktraten liegen bei typischerweise 1,2 - 1,5 GHz (CPU) respektive 300 MHz (GPU). Die veröffentlichten technischen Daten sind identisch zum MT8125.

Performance

Da die Cortex-A7-Architektur bei gleichem Takt etwas langsamer als ein Cortex-A9- oder Krait-Design arbeitet, liegt die Rechenleistung knapp unter dem Niveau von Nvidias Tegra 3 oder dem Samsung Exynos 4412. Auch die PowerVR-GPU zählt nur zur Einstiegsklasse und ist mit besonders hochauflösenden Displays oder anspruchsvollen Spielen schnell überfordert.

Features

Neben Prozessor und Grafikeinheit integriert der SoC auch einen Decoder für 1080p-Videos, WiFi, Bluetooth 4.0, FM, GPS sowie 2G- und 3G-Funk (bis HSPA+). Kameras werden bis zu einer Auflösung von 13 MP unterstützt.

Leistungsaufnahme

Dank der sparsamen A7-Kerne sowie der fortschrittlichen 28-nm-Fertigung dürfte der Stromverbrauch relativ gering ausfallen. Der Chip kann damit auch in kleineren Tablets problemlos eingesetzt werden.

ModelMediatek MT6589Mediatek MT8389
CodenameCortex-A7Cortex-A7
Series Mediatek Mediatek
Serie: Mediatek Cortex-A7
Mediatek MT6592 compare1.7 GHz8 / 8 cores Cortex-A7
Mediatek MT8127 compare1.5 GHz4 / 4 cores Cortex-A7
Mediatek MT6589T compare1.5 GHz4 / 4 cores Cortex-A7
Mediatek MT83891.2 GHz4 / 4 cores Cortex-A7
Mediatek MT8125 compare1.2 GHz4 / 4 cores Cortex-A7
Mediatek MT8321 compare1.3 GHz4 / 4 cores Cortex-A7
Mediatek MT8121 compare1.3 GHz4 / 4 cores Cortex-A7
Mediatek MT6582 compare1.3 GHz4 / 4 cores Cortex-A7
Mediatek MT6582M compare1.3 GHz4 / 4 cores Cortex-A7
Mediatek MT6580M compare1.3 GHz4 / 4 cores Cortex-A7
Mediatek MT6589 « 1.2 GHz4 / 4 cores Cortex-A7
MediaTek MT6572 compare1.2 GHz2 / 2 cores Cortex-A7
Mediatek MT6592 compare1.7 GHz8 / 8 cores Cortex-A7
Mediatek MT8127 compare1.5 GHz4 / 4 cores Cortex-A7
Mediatek MT6589T compare1.5 GHz4 / 4 cores Cortex-A7
Mediatek MT8389 « 1.2 GHz4 / 4 cores Cortex-A7
Mediatek MT8125 compare1.2 GHz4 / 4 cores Cortex-A7
Mediatek MT8321 compare1.3 GHz4 / 4 cores Cortex-A7
Mediatek MT8121 compare1.3 GHz4 / 4 cores Cortex-A7
Mediatek MT6582 compare1.3 GHz4 / 4 cores Cortex-A7
Mediatek MT6582M compare1.3 GHz4 / 4 cores Cortex-A7
Mediatek MT6580M compare1.3 GHz4 / 4 cores Cortex-A7
Mediatek MT65891.2 GHz4 / 4 cores Cortex-A7
MediaTek MT6572 compare1.2 GHz2 / 2 cores Cortex-A7
Clock1200 MHz1200 - 1500 MHz
Cores / Threads4 / 44 / 4
Technology28 nm28 nm
iGPUPowerVR SGX544PowerVR SGX544 (300 MHz)
ArchitectureARMARM
Announced
Manufacturerwww.mediatek.comwww.mediatek.com
L2 Cache1 MB
FeaturesWi-Fi, Bluetooth 4.0, GPS, FM, 3G/HSPA+, 2G/EDGE

Benchmarks

3DMark - 3DMark Ice Storm Physics
min: 6884     avg: 8119     median: 8136 (7%)     max: 9830 Points
min: 7384     avg: 7883     median: 8037 (7%)     max: 8227 Points
3DMark - 3DMark Ice Storm Extreme Physics
min: 7691     avg: 8234     median: 8067 (7%)     max: 9427 Points
min: 7174     avg: 7726     median: 7932 (6%)     max: 8071 Points
3DMark - 3DMark Ice Storm Unlimited Physics
min: 8134     avg: 9264     median: 9346 (8%)     max: 10309 Points
7962 Points (7%)
Geekbench 3 - Geekbench 3 32 Bit Multi-Core
min: 1049     avg: 1181     median: 1097 (2%)     max: 1425 Points
min: 1042     avg: 1069     median: 1069 (2%)     max: 1096 Points
Geekbench 3 - Geekbench 3 32 Bit Single-Core
min: 322     avg: 350     median: 327 (6%)     max: 399 Points
325 Points (6%)
Geekbench 2 - 32 Bit - Geekbench Stream
min: 259     avg: 284.9     median: 280 (2%)     max: 336 Points
min: 266     avg: 272     median: 271 (2%)     max: 279 Points
Geekbench 2 - 32 Bit - Geekbench Memory
min: 691     avg: 789     median: 779 (7%)     max: 911 Points
min: 767     avg: 806     median: 795 (7%)     max: 856 Points
Geekbench 2 - 32 Bit - Geekbench Floating Point
min: 2032     avg: 2191     median: 2068 (4%)     max: 2576 Points
min: 2005     avg: 2023     median: 2018 (4%)     max: 2047 Points
Geekbench 2 - 32 Bit - Geekbench Integer
min: 1196     avg: 1286     median: 1221 (2%)     max: 1498 Points
min: 1151     avg: 1184     median: 1181 (2%)     max: 1219 Points
Geekbench 2 - 32 Bit - Geekbench Total Score
min: 1305     avg: 1403     median: 1347 (4%)     max: 1641 Points
min: 1299     avg: 1311     median: 1301 (3%)     max: 1332 Points
Linpack Android / IOS - Linpack Multi Thread
min: 88.2     avg: 113     median: 98.8 (3%)     max: 149.3 MFLOPS
min: 35.21     avg: 87.9     median: 111.7 (4%)     max: 116.8 MFLOPS
Linpack Android / IOS - Linpack Single Thread
min: 34.22     avg: 46.8     median: 37 (4%)     max: 73.1 MFLOPS
min: 36.62     avg: 57.6     median: 37 (4%)     max: 99.2 MFLOPS
Mozilla Kraken 1.1 - Kraken 1.1 Total Score *
min: 15547     avg: 16970     median: 17170 (20%)     max: 18568 ms
18661 ms (22%)
Sunspider - Sunspider 1.0 Total Score *
min: 1138     avg: 1417     median: 1451 (16%)     max: 1576 ms
min: 1414     avg: 1455     median: 1464 (16%)     max: 1487 ms
Sunspider - Sunspider 0.9.1 Total Score *
min: 947     avg: 1270     median: 1331.5 (13%)     max: 1563 ms
min: 1319     avg: 1332     median: 1333 (13%)     max: 1344 ms
Octane V2 - Octane V2 Total Score
min: 1403     avg: 1564     median: 1449 (1%)     max: 1839 Points
1355 Points (1%)
Quadrant Standard Edition 2.0 - Quadrant Standard 2.0 Total Score
min: 3841     avg: 4622     median: 3973 (9%)     max: 5885 points
4706 points (11%)
AnTuTu v3 - AnTuTu v3 CPU
min: 5454     avg: 6159     median: 5931 (39%)     max: 7606 Points
5967 Points (39%)
AnTuTu v4 - AnTuTu v4 Total Score
min: 13383     avg: 14572     median: 14155 (33%)     max: 15979 Points
13430 Points (31%)
AndEBench - AndEBench Java
min: 300     avg: 344     median: 327 (10%)     max: 419 Iter./s
min: 294     avg: 317     median: 326 (10%)     max: 331 Iter./s
AndEBench - AndEBench Native
min: 6354     avg: 6842     median: 6463 (21%)     max: 8095 Iter./s
min: 6373     avg: 6440     median: 6437 (21%)     max: 6510 Iter./s
PassMark PerformanceTest Mobile V1 - PerformanceTest Mobile V1 CPU Tests
min: 6337     avg: 8521     median: 8336 (1%)     max: 10615 Points
min: 8173     avg: 8297     median: 8323 (1%)     max: 8396 Points

Average Benchmarks Mediatek MT6589 → 100% n=22

Average Benchmarks Mediatek MT8389 → 99% n=22

- Bereich der Benchmarkergebnisse für diese Grafikkarte
red legend - Durchschnittliche Benchmarkergebnisse für diese Grafikkarte
* Smaller numbers mean a higher performance
1 This benchmark is not used for the average calculation

Add one or more devices and compare

In the following list you can select (and also search for) devices that should be added to the comparison. You can select more than one device.

restrict list:

show all (including archived), 2024, 2023
v1.28
log 21. 15:31:06

#0 ran 0s before starting gpusingle class +0s ... 0s

#1 checking url part for id 4117 +0s ... 0s

#2 checking url part for id 4539 +0s ... 0s

#3 redirected to Ajax server, took 1732199466s time from redirect:0 +0s ... 0s

#4 did not recreate cache, as it is less than 5 days old! Created at Tue, 19 Nov 2024 05:17:18 +0100 +0s ... 0s

#5 composed specs +0.004s ... 0.004s

#6 did output specs +0s ... 0.004s

#7 getting avg benchmarks for device 4117 +0.001s ... 0.005s

#8 got single benchmarks 4117 +0.008s ... 0.013s

#9 getting avg benchmarks for device 4539 +0.001s ... 0.013s

#10 got single benchmarks 4539 +0.005s ... 0.019s

#11 got avg benchmarks for devices +0s ... 0.019s

#12 min, max, avg, median took s +0.019s ... 0.037s

#13 return log +0.002s ... 0.04s

Teilen Sie diesen Artikel, um uns zu unterstützen. Jeder Link hilft!
Mail Logo
> Notebook Test, Laptop Test und News > Benchmarks / Technik > Benchmarks / Technik > Prozessor Vergleich - Head 2 Head
Autor: Klaus Hinum,  8.09.2017 (Update:  1.07.2023)