Notebookcheck Logo

Apple M3 Max 40-Core GPU vs NVIDIA GeForce RTX 2060 Max-Q vs Apple M3 Pro 18-Core GPU

Apple M3 Max 40-Core GPU

► remove from comparison Apple M3 Max 40-Core GPU

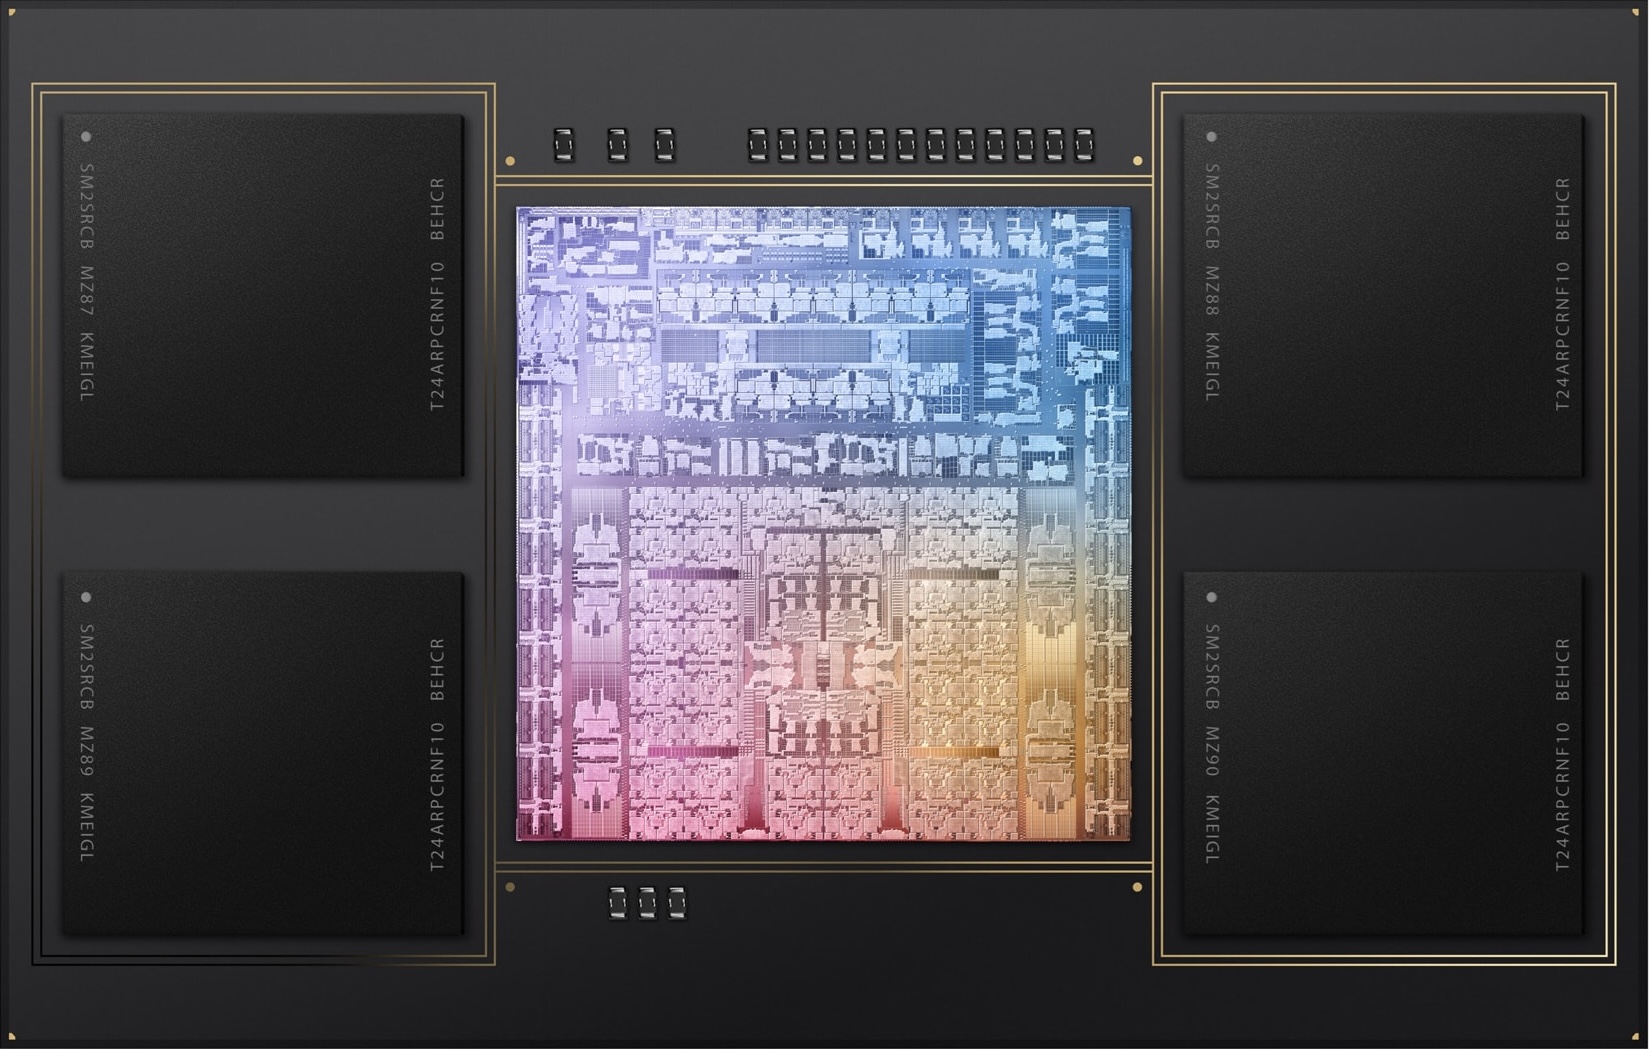
Die Apple M3 Max 40-Core GPU ist eine selbst designte Grafikkarte im Apple M3 SoC und laut Apple mit vierzig Kernen. Laut Apple nutzt die GPU eine neue Architektur und bietet nun Dynamic Caching, Mesh Shading und Ray Tracing-Beschleunigung.

Die GPU kann auf bis zu 128 GB LPDDR5-6400 Unified Memory zugreifen über einen 512 Bit Speicherbus (max 400 GBit/s). Dank Dynamic Caching, soll die GPU dabei nur soviel Speicher reservieren, wie benötigt wird.

Da der SoC im aktuellen 3nm (wahrscheinlich N3B) bei TSMC hergestellt. Laut powermetrics braucht die GPU bis zu 60 Watt (Chip inkl. CPU gesamt 78 Watt).

NVIDIA GeForce RTX 2060 Max-Q

► remove from comparison

Die Nvidia GeForce RTX 2060 mit Max-Q Design ist eine mobile Gaming-Grafikkarte der Oberklasse. Sie basiert auf die mobile RTX 2060 bei reduzierten Kerntaktraten und deutlich reduzierten Stromverbrauch. Sie wurde zuerst im Asus Zephyrus G14 eingesetzt.

Mit dem Refresh wurden die Max-Q Technologien überarbeitet und bieten nun neben einer verbesserten Effizienz durch (neue Spannungswandler, Low-Power-GDDR6) auch zwei optionale Features. Der Notebookhersteller kann Dynamic Boost implementieren um Strom von der CPU zur GPU zu verlagern (TDP in 5 Watt Schritten). Weiters gibt es einen neuen "Dynamic Display Switch" für Advanced Optimus der G-SYNC und bis zu 4K 120 Hz ermöglichen.

Der verwendete Turing Chip wird in 12nm gefertigt und bietet eine Reihe neuer Features, wie DLSS (Deep Learning Super Sampling) und Real Time Ray Tracing. Dadurch lassen sich vor allem Beleuchtungseffekte sehr viel realistischer darstellen. Weiterhin gibt es Support für DisplayPort 1.4 (ready), HDMI 2.0b, HDR, Simultaneous Multi-Projection (SMP) sowie H.265 Video De- und Encoding (PlayReady 3.0). 

Performance

Die Performance der Max-Q Version der GeForce RTX 2060 liegt durch die geringeren Taktraten leicht unter der mobilen RTX 2060. Damit eignet sie sich besonders für 1080p und maximale Details bzw. bis zu 4K bei weniger anspruchsvollen Spielen.

Der Stromverbrauch ist mit etwa 65 Watt TGP spezifiziert und damit deutlich niedriger als die 80 - 90 Watt der normalen GeForce RTX 2060.


Apple M3 Pro 18-Core GPU

► remove from comparison Apple M3 Pro 18-Core GPU

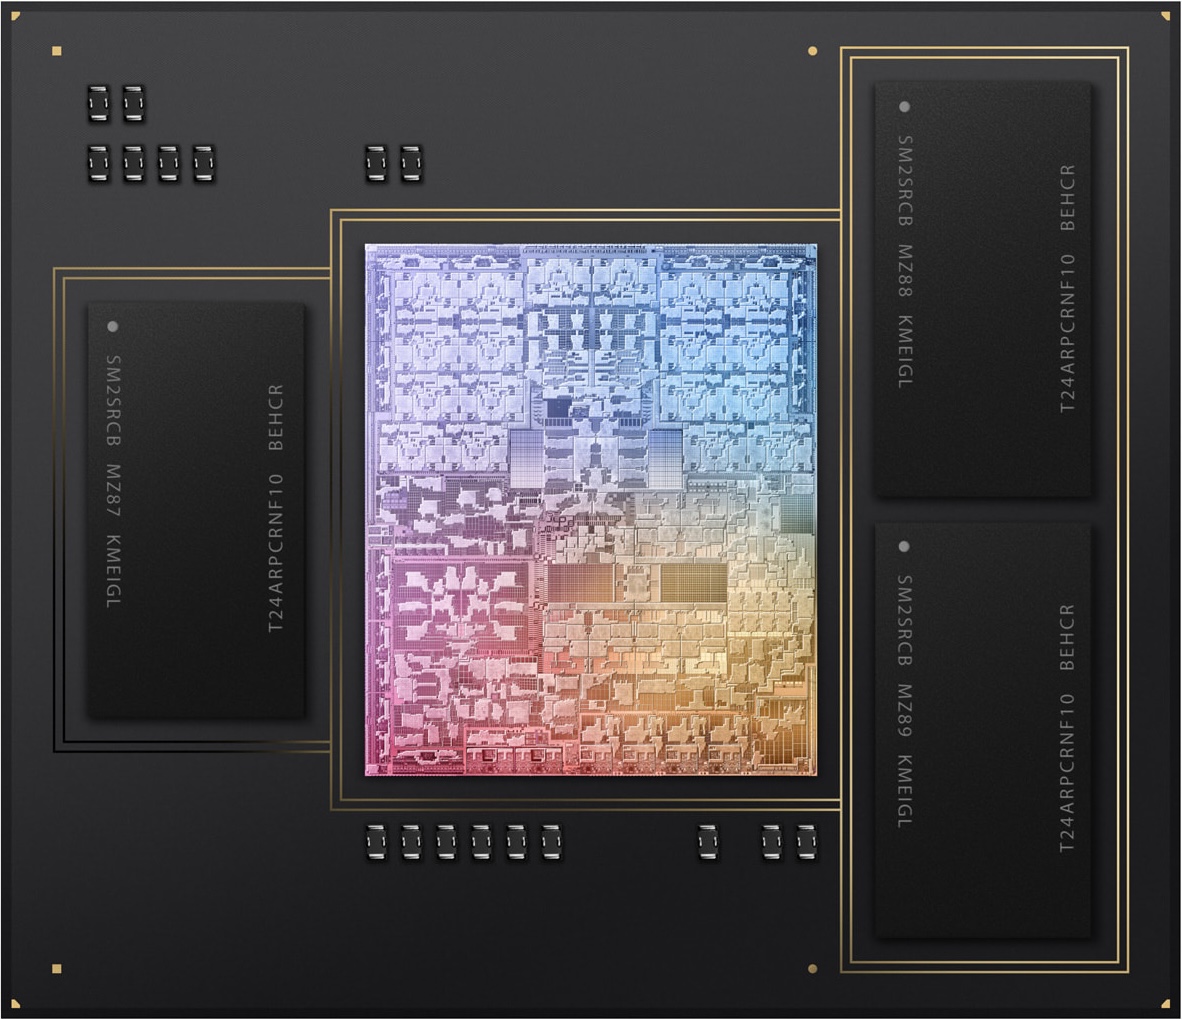
Die Apple M3 Pro 18-Core GPU ist eine selbst designte Grafikkarte im Apple M3 Pro (mit 12 CPU-Kernen) und bietet alle achtzehn Kerne welche auf dem Chip vorhanden sind. Die Grafikkarte nutzt eine neue Architektur und bietet nun Dynamic Caching, Mesh Shading und Ray Tracing-Beschleunigung.

Die GPU kann über einen 192 Bit Speicherbus (max 150 GBit/s) auf bis zu 36 GB LPDDR5-6400 Unified Memory zugreifen. Dank Dynamic Caching, soll die GPU dabei nur soviel Speicher reservieren, wie benötigt wird.

Da der gesamte Chip wird im aktuellen 3nm Prozess (wahrscheinlich N3B) bei TSMC hergestellt.

Apple M3 Max 40-Core GPUNVIDIA GeForce RTX 2060 Max-QApple M3 Pro 18-Core GPU
Apple M3 Serie
M3 Max 40-Core GPU 40
M3 Max 30-Core GPU 30
M3 Pro 18-Core GPU 18
M3 Pro 14-Core GPU 14
M3 10-Core GPU 10
M3 8-Core GPU 8
NVIDIA Titan RTX 4608 @ 1.35 - 1.77 GHz384 Bit @ 14000 MHz
GeForce RTX 2080 Ti (Desktop) 4352 @ 1.35 - 1.55 GHz352 Bit @ 14000 MHz
GeForce RTX 2080 Super (Desktop) 3072 @ 1.65 - 1.82 GHz256 Bit @ 15500 MHz
GeForce RTX 2080 (Desktop) 2944 @ 1.52 - 1.71 GHz256 Bit @ 14000 MHz
GeForce RTX 2080 Super Mobile 3072 @ 1.37 - 1.56 GHz256 Bit @ 14000 MHz
GeForce RTX 2080 Mobile 2944 @ 1.38 - 1.59 GHz256 Bit @ 14000 MHz
GeForce RTX 2070 Super (Desktop) 2560 @ 1.61 - 1.77 GHz256 Bit @ 14000 MHz
GeForce RTX 2070 (Desktop) 2304 @ 1.41 - 1.62 GHz256 Bit @ 14000 MHz
GeForce RTX 2070 Super Mobile 2560 @ 1.14 - 1.38 GHz256 Bit @ 14002 MHz
GeForce RTX 2080 Super Max-Q 3072 @ 0.98 - 1.23 GHz256 Bit @ 11000 MHz
GeForce RTX 2060 Super (Desktop) 2176 @ 1.47 - 1.65 GHz256 Bit @ 14000 MHz
GeForce RTX 2070 Mobile 2304 @ 1.22 - 1.44 GHz256 Bit @ 14000 MHz
GeForce RTX 2080 Max-Q 2944 @ 0.74 - 1.1 GHz256 Bit @ 12000 MHz
GeForce RTX 2060 (Desktop) 1920 @ 1.32 - 1.62 GHz192 Bit @ 14000 MHz
GeForce RTX 2070 Super Max-Q 2560 @ 0.93 - 1.16 GHz256 Bit @ 11000 MHz
GeForce RTX 2070 Max-Q 2304 @ 0.89 - 1.19 GHz256 Bit @ 12000 MHz
GeForce RTX 2060 Mobile 1920 @ 0.96 - 1.2 GHz192 Bit @ 14000 MHz
GeForce RTX 2060 Max-Q 1920 @ 0.98 - 1.19 GHz192 Bit @ 11000 MHz
GeForce RTX 2050 Mobile 2048 @ 1.48 GHz64 Bit @ 14000 MHz
M3 Max 40-Core GPU 40
M3 Max 30-Core GPU 30
M3 Pro 18-Core GPU 18
M3 Pro 14-Core GPU 14
M3 10-Core GPU 10
M3 8-Core GPU 8
Pipelines40 - unified1920 - unified18 - unified
SpeichertypLPDDR5-6400GDDR6LPDDR5-6400
Shared Memoryneinneinnein
Stromverbrauch53 Watt65 Watt
Herstellungsprozess5 nm12 nm5 nm
Notebookgrößemittel (15.4" z.B.)groß (17" z.B.)mittel (15.4" z.B.)
Erscheinungsdatum31.10.2023 06.01.2019 31.10.2023
CodenameN18E-G1 MAX-Q TU106
ArchitekturTuring
Kerntakt975 - 1185 (Boost) MHz
Speichertakt11000 MHz
Speicherbandbreite192 Bit
Max. Speichergröße6 GB
APIDirectX 12_1, OpenGL 4.6
FeaturesDLSS, Raytraycing, VR Ready, G-SYNC, Vulkan, Multi Monitor
CPU in M3 Max 40-Core GPUGPU Base SpeedGPU Boost / Turbo
Apple M3 Max 16-Core16 x 2748 MHz, 78 W? MHz? MHz
CPU in M3 Pro 18-Core GPUGPU Base SpeedGPU Boost / Turbo
Apple M3 Pro 12-Core12 x 2748 MHz, 27 W? MHz? MHz

Benchmarks

Performance Rating - 3DMark 11 + Fire Strike + Time Spy - GeForce RTX 2060 Max-Q
6.6 pt (20%)
3DMark - 3DMark Time Spy Score
min: 5390     avg: 5813     median: 5844.5 (17%)     max: 6171 Points
3DMark - 3DMark Time Spy Graphics
min: 5357     avg: 5637     median: 5638.5 (15%)     max: 5914 Points
3DMark - 3DMark Ice Storm Unlimited Graphics
308872 Points (31%)
3DMark - 3DMark Ice Storm Extreme Graphics
95079 Points (12%)
3DMark - 3DMark Cloud Gate Score
min: 25407     avg: 31253     median: 30659.5 (33%)     max: 38287 Points
3DMark - 3DMark Cloud Gate Graphics
min: 38074     avg: 58101     median: 58890 (15%)     max: 76551 Points
3DMark - 3DMark Fire Strike Standard Score
min: 12716     avg: 13699     median: 13716 (24%)     max: 14649 Points
3DMark - 3DMark Fire Strike Standard Graphics
min: 14129     avg: 14900     median: 14909.5 (17%)     max: 15650 Points
3DMark - 3DMark Ice Storm Graphics
95273 Points (11%)
3DMark - 3DMark Wild Life Extreme Unlimited
min: 31268     avg: 31336     median: 31335.5 (36%)     max: 31403 Points
14545 Points (17%)
3DMark 11 - 3DM11 Performance Score
min: 16516     avg: 17896     median: 18065 (25%)     max: 18937 Points
3DMark 11 - 3DM11 Performance GPU
min: 18863     avg: 19881     median: 19778.5 (17%)     max: 21105 Points
3DMark Vantage
3DM Vant. Perf. total + NVIDIA GeForce RTX 2060 Max-Q
3DMark Vantage - 3DM Vant. Perf. total
50957 Points (15%)
3DM Vant. Perf. GPU no PhysX + NVIDIA GeForce RTX 2060 Max-Q
3DMark Vantage - 3DM Vant. Perf. GPU no PhysX
49207 Points (27%)
3DMark 06 3DMark 06 - Standard 1280x1024 + NVIDIA GeForce RTX 2060 Max-Q
3DMark 06
37332 Points (49%)
Blender - Blender 3.3 Classroom METAL *
min: 29.6     avg: 30.8     median: 30.8 (3%)     max: 32 Seconds
69 Seconds (7%)
Cinebench R10 Cinebench R10 Shading (32bit) + NVIDIA GeForce RTX 2060 Max-Q
Cinebench R10 - Cinebench R10 Shading (32bit)
11800 Points (8%)
Cinebench R11.5 Cinebench R11.5 OpenGL 64 Bit + NVIDIA GeForce RTX 2060 Max-Q
Cinebench R11.5 - Cinebench R11.5 OpenGL 64 Bit
76.3 fps (25%)
Cinebench R15
Cinebench R15 OpenGL 64 Bit + Apple M3 Max 40-Core GPU
Cinebench R15 - Cinebench R15 OpenGL 64 Bit
min: 136.23     avg: 137.4     median: 137.4 (8%)     max: 138.52 fps
Cinebench R15 OpenGL 64 Bit + NVIDIA GeForce RTX 2060 Max-Q
min: 104.1     avg: 132.3     median: 137 (8%)     max: 151 fps
Cinebench R15 OpenGL Ref. Match 64 Bit + Apple M3 Max 40-Core GPU
Cinebench R15 - Cinebench R15 OpenGL Ref. Match 64 Bit
99.5 % (100%)
Cinebench R15 OpenGL Ref. Match 64 Bit + NVIDIA GeForce RTX 2060 Max-Q
99.6 % (100%)
GFXBench - GFXBench 5.0 4K Aztec Ruins High Tier Offscreen
min: 188.2     avg: 196     median: 196 (80%)     max: 203.7 fps
97.8 fps (40%)
GFXBench - GFXBench 5.0 Aztec Ruins High Tier Offscreen
min: 416     avg: 431     median: 431 (78%)     max: 446 fps
219.7 fps (40%)
GFXBench - GFXBench 5.0 Aztec Ruins Normal Tier Offscreen
min: 858     avg: 863     median: 863 (64%)     max: 868 fps
580 fps (43%)
GFXBench - GFXBench Car Chase Offscreen
min: 556     avg: 560     median: 560 (63%)     max: 564 fps
273 fps (31%)
436 fps (49%)
GFXBench 3.1 - GFXBench Manhattan ES 3.1 Offscreen
min: 1163     avg: 1178     median: 1178 (25%)     max: 1193 fps
411.3 fps (9%)
670 fps (14%)
GFXBench 3.0 - GFXBench 3.0 Manhattan Offscreen
min: 1557     avg: 1573     median: 1573 (92%)     max: 1589 fps
497.9 fps (29%)
936 fps (55%)
GFXBench (DX / GLBenchmark) 2.7
GFXBench T-Rex HD Offscreen C24Z16 + Apple M3 Max 40-Core GPU
GFXBench (DX / GLBenchmark) 2.7 - GFXBench T-Rex HD Offscreen C24Z16
min: 2893     avg: 2942     median: 2941.5 (23%)     max: 2990 fps
GFXBench T-Rex HD Offscreen C24Z16 + NVIDIA GeForce RTX 2060 Max-Q
1123 fps (9%)
GFXBench T-Rex HD Offscreen C24Z16 + Apple M3 Pro 18-Core GPU
1480 fps (12%)
Geekbench 6.2 - Geekbench 6.2 GPU OpenCL
min: 91413     avg: 91416     median: 91415.5 (26%)     max: 91418 Points
50373 Points (15%)
Geekbench 6.2 - Geekbench 6.2 GPU Metal
min: 154675     avg: 155214     median: 155214 (100%)     max: 155752 Points
78324 Points (50%)
LuxMark v2.0 64Bit - LuxMark v2.0 Room GPU
2664 Samples/s (12%)
LuxMark v2.0 64Bit - LuxMark v2.0 Sala GPU
5786 Samples/s (10%)
Power Consumption - Furmark Stress Test Power Consumption - external Monitor *
min: 96.6     avg: 116.3     median: 116.3 (17%)     max: 136 Watt
Power Consumption - The Witcher 3 Power Consumption - external Monitor *
min: 87.7     avg: 91.6     median: 91.6 (13%)     max: 95.4 Watt
min: 107.5     avg: 120.8     median: 120.8 (17%)     max: 134 Watt
40 Watt (6%)
Power Consumption - Witcher 3 Power Consumption *
min: 92.5     avg: 100.8     median: 100.8 (22%)     max: 109 Watt
min: 99.2     avg: 110.6     median: 108.9 (24%)     max: 125.5 Watt
52.1 Watt (11%)
Power Consumption - Witcher 3 ultra Power Efficiency
min: 0.633     avg: 0.8     median: 0.8 (73%)     max: 0.995 fps per Watt
min: 0.4858     avg: 0.5     median: 0.5 (46%)     max: 0.566 fps per Watt
0.8 fps per Watt (74%)
Power Consumption - Witcher 3 ultra Power Efficiency - external Monitor
min: 0.723     avg: 0.9     median: 0.9 (73%)     max: 1.207 fps per Watt
min: 0.4694     avg: 0.5     median: 0.5 (42%)     max: 0.543 fps per Watt
min: 1.075     avg: 1.1     median: 1.1 (89%)     max: 1.207 fps per Watt
Emissions Witcher 3 Fan Noise + Apple M3 Max 40-Core GPU
Emissions - Witcher 3 Fan Noise
min: 42.8     avg: 43.1     median: 43.1 (69%)     max: 43.4 dB(A)
Witcher 3 Fan Noise + NVIDIA GeForce RTX 2060 Max-Q
min: 41.3     avg: 49.4     median: 51.3 (82%)     max: 53.7 dB(A)
Witcher 3 Fan Noise + Apple M3 Pro 18-Core GPU
25.1 dB(A) (40%)
Clock Speed - GPU Clock Witcher 3 ultra
1418 MHz (56%)
Clock Speed - GPU Clock Speed Furmark
1171 MHz (46%)

Average Benchmarks Apple M3 Max 40-Core GPU → 100% n=4

Average Benchmarks NVIDIA GeForce RTX 2060 Max-Q → 38% n=4

Average Benchmarks Apple M3 Pro 18-Core GPU → 61% n=4

- Bereich der Benchmarkergebnisse für diese Grafikkarte
- Durchschnittliche Benchmarkergebnisse für diese Grafikkarte
* Smaller numbers mean a higher performance
1 This benchmark is not used for the average calculation

Spiele-Benchmarks

Die folgenden Benchmarks basieren auf unseren Spieletests mit Testnotebooks. Die Performance dieser Grafikkarte bei den gelisteten Spielen ist abhängig von der verwendeten CPU, Speicherausstattung, Treiber und auch Betriebssystem. Dadurch müssen die untenstehenden Werte nicht repräsentativ sein. Detaillierte Informationen über das verwendete System sehen Sie nach einem Klick auf den fps-Wert.

low 1920x1080
100%
M3 Max 40-Core GPU:
242  fps
88%
M3 Pro 18-Core GPU:
212  fps
med. 1920x1080
100%
M3 Max 40-Core GPU:
207 212 ~ 210 fps
67%
M3 Pro 18-Core GPU:
140  fps
high 1920x1080
100%
M3 Max 40-Core GPU:
138 139 ~ 139 fps
55%
M3 Pro 18-Core GPU:
77  fps
ultra 1920x1080
100%
M3 Max 40-Core GPU:
97 121 ~ 109 fps
53%
M3 Pro 18-Core GPU:
58  fps
QHD 2560x1440
100%
M3 Max 40-Core GPU:
82 82 ~ 82 fps
51%
M3 Pro 18-Core GPU:
42  fps
low 1920x1080
100%
M3 Max 40-Core GPU:
45  fps
118%
M3 Pro 18-Core GPU:
53  fps
med. 1920x1080
100%
M3 Max 40-Core GPU:
44  fps
97%
M3 Pro 18-Core GPU:
42.6  fps
high 1920x1080
100%
M3 Max 40-Core GPU:
43.7 44.4 ~ 44 fps
80%
M3 Pro 18-Core GPU:
35  fps
ultra 1920x1080
100%
M3 Max 40-Core GPU:
40.8 42.8 ~ 42 fps
73%
M3 Pro 18-Core GPU:
30.8  fps
QHD 2560x1440
100%
M3 Max 40-Core GPU:
35.5 37.4 ~ 36 fps
high 1920x1080
100%
M3 Max 40-Core GPU:
96  fps
55%
M3 Pro 18-Core GPU:
53  fps
ultra 1920x1080
100%
M3 Max 40-Core GPU:
90  fps
48%
M3 Pro 18-Core GPU:
43  fps
QHD 2560x1440
100%
M3 Max 40-Core GPU:
60  fps
high 1920x1080
M3 Pro 18-Core GPU:
30  fps
ultra 1920x1080
100%
M3 Max 40-Core GPU:
51  fps
51%
M3 Pro 18-Core GPU:
26  fps
QHD 2560x1440
M3 Pro 18-Core GPU:
17  fps
low 1280x720
GeForce RTX 2060 Max-Q:
257.9  fps
med. 1920x1080
GeForce RTX 2060 Max-Q:
120.4  fps
high 1920x1080
GeForce RTX 2060 Max-Q:
76.4  fps
ultra 1920x1080
GeForce RTX 2060 Max-Q:
56.9  fps
4K 3840x2160
GeForce RTX 2060 Max-Q:
18.9  fps
low 1280x720
GeForce RTX 2060 Max-Q:
176.1  fps
med. 1920x1080
GeForce RTX 2060 Max-Q:
108.7  fps
high 1920x1080
GeForce RTX 2060 Max-Q:
95.7  fps
ultra 1920x1080
GeForce RTX 2060 Max-Q:
93.3  fps
low 1280x720
GeForce RTX 2060 Max-Q:
194.2  fps
med. 1920x1080
GeForce RTX 2060 Max-Q:
96.3  fps
high 1920x1080
GeForce RTX 2060 Max-Q:
75.7  fps
low 1280x720
GeForce RTX 2060 Max-Q:
78.5  fps
med. 1920x1080
GeForce RTX 2060 Max-Q:
68.5  fps
high 1920x1080
GeForce RTX 2060 Max-Q:
68.2  fps
ultra 1920x1080
GeForce RTX 2060 Max-Q:
85.3  fps
med. 1920x1080
GeForce RTX 2060 Max-Q:
92.9  fps
high 1920x1080
GeForce RTX 2060 Max-Q:
88  fps
ultra 1920x1080
GeForce RTX 2060 Max-Q:
77.8  fps
low 1280x720
GeForce RTX 2060 Max-Q:
103.2  fps
med. 1920x1080
GeForce RTX 2060 Max-Q:
88.7  fps
high 1920x1080
GeForce RTX 2060 Max-Q:
82.2  fps
ultra 1920x1080
GeForce RTX 2060 Max-Q:
79  fps
GRID 2019

GRID 2019

2019
low 1280x720
GeForce RTX 2060 Max-Q:
157.4  fps
med. 1920x1080
GeForce RTX 2060 Max-Q:
109.4  fps
high 1920x1080
GeForce RTX 2060 Max-Q:
103.4  fps
ultra 1920x1080
GeForce RTX 2060 Max-Q:
73.5  fps
4K 3840x2160
GeForce RTX 2060 Max-Q:
33.1  fps
low 1280x720
GeForce RTX 2060 Max-Q:
123  fps
med. 1920x1080
GeForce RTX 2060 Max-Q:
82  fps
high 1920x1080
GeForce RTX 2060 Max-Q:
75  fps
ultra 1920x1080
GeForce RTX 2060 Max-Q:
55  fps
low 1280x720
GeForce RTX 2060 Max-Q:
117  fps
med. 1920x1080
GeForce RTX 2060 Max-Q:
89.5  fps
high 1920x1080
GeForce RTX 2060 Max-Q:
61.9  fps
ultra 1920x1080
GeForce RTX 2060 Max-Q:
48.3  fps
Control

Control

2019
low 1280x720
GeForce RTX 2060 Max-Q:
183.7  fps
med. 1920x1080
GeForce RTX 2060 Max-Q:
67.1  fps
high 1920x1080
GeForce RTX 2060 Max-Q:
50.4  fps
F1 2019

F1 2019

2019
low 1280x720
GeForce RTX 2060 Max-Q:
196  fps
med. 1920x1080
GeForce RTX 2060 Max-Q:
137  fps
high 1920x1080
GeForce RTX 2060 Max-Q:
116  fps
ultra 1920x1080
GeForce RTX 2060 Max-Q:
101  fps
low 1280x720
GeForce RTX 2060 Max-Q:
201.1  fps
med. 1920x1080
100%
M3 Max 40-Core GPU:
170 170 ~ 170 fps
61%
GeForce RTX 2060 Max-Q:
103.3  fps
51%
M3 Pro 18-Core GPU:
87  fps
high 1920x1080
100%
M3 Max 40-Core GPU:
109 113 ~ 111 fps
62%
GeForce RTX 2060 Max-Q:
69.2  fps
50%
M3 Pro 18-Core GPU:
56  fps
ultra 1920x1080
100%
M3 Max 40-Core GPU:
80 84 ~ 82 fps
62%
GeForce RTX 2060 Max-Q:
50.7  fps
50%
M3 Pro 18-Core GPU:
41  fps
QHD 2560x1440
100%
M3 Max 40-Core GPU:
54 58 ~ 56 fps
45%
M3 Pro 18-Core GPU:
25  fps
Anno 1800

Anno 1800

2019
low 1280x720
GeForce RTX 2060 Max-Q:
81.5  fps
med. 1920x1080
GeForce RTX 2060 Max-Q:
81.6  fps
high 1920x1080
GeForce RTX 2060 Max-Q:
61.4  fps
ultra 1920x1080
GeForce RTX 2060 Max-Q:
36.5  fps
low 1280x720
GeForce RTX 2060 Max-Q:
154  fps
med. 1920x1080
GeForce RTX 2060 Max-Q:
92  fps
high 1920x1080
GeForce RTX 2060 Max-Q:
74  fps
ultra 1920x1080
GeForce RTX 2060 Max-Q:
56  fps
low 1280x720
GeForce RTX 2060 Max-Q:
276.7  fps
med. 1920x1080
GeForce RTX 2060 Max-Q:
125.3  fps
high 1920x1080
GeForce RTX 2060 Max-Q:
105.3  fps
ultra 1920x1080
GeForce RTX 2060 Max-Q:
60.5  fps
4K 3840x2160
GeForce RTX 2060 Max-Q:
24.4  fps
low 1280x720
GeForce RTX 2060 Max-Q:
105  fps
med. 1920x1080
GeForce RTX 2060 Max-Q:
75  fps
high 1920x1080
GeForce RTX 2060 Max-Q:
70  fps
ultra 1920x1080
GeForce RTX 2060 Max-Q:
63  fps
low 1280x720
GeForce RTX 2060 Max-Q:
129.6  fps
med. 1920x1080
GeForce RTX 2060 Max-Q:
72.7  fps
high 1920x1080
GeForce RTX 2060 Max-Q:
55.2  fps
ultra 1920x1080
GeForce RTX 2060 Max-Q:
43.8  fps
low 1280x720
GeForce RTX 2060 Max-Q:
143.6  fps
med. 1920x1080
GeForce RTX 2060 Max-Q:
142.8  fps
high 1920x1080
GeForce RTX 2060 Max-Q:
126.2  fps
ultra 1920x1080
GeForce RTX 2060 Max-Q:
116.6  fps
low 1280x720
GeForce RTX 2060 Max-Q:
97  fps
med. 1920x1080
GeForce RTX 2060 Max-Q:
79  fps
high 1920x1080
GeForce RTX 2060 Max-Q:
65  fps
ultra 1920x1080
GeForce RTX 2060 Max-Q:
45  fps
low 1280x720
GeForce RTX 2060 Max-Q:
118 118 ~ 118 fps
med. 1920x1080
100%
M3 Max 40-Core GPU:
145 150 ~ 148 fps
59%
GeForce RTX 2060 Max-Q:
84 90 ~ 87 fps
48%
M3 Pro 18-Core GPU:
71  fps
high 1920x1080
100%
M3 Max 40-Core GPU:
135 143 ~ 139 fps
58%
GeForce RTX 2060 Max-Q:
75 84 ~ 80 fps
47%
M3 Pro 18-Core GPU:
65  fps
ultra 1920x1080
100%
M3 Max 40-Core GPU:
118 122 ~ 120 fps
58%
GeForce RTX 2060 Max-Q:
65 74 ~ 70 fps
48%
M3 Pro 18-Core GPU:
57  fps
QHD 2560x1440
100%
M3 Max 40-Core GPU:
86 88 ~ 87 fps
43%
M3 Pro 18-Core GPU:
37  fps
4K 3840x2160
GeForce RTX 2060 Max-Q:
20  fps
Strange Brigade

Strange Brigade

2018
low 1280x720
GeForce RTX 2060 Max-Q:
276  fps
med. 1920x1080
GeForce RTX 2060 Max-Q:
130  fps
high 1920x1080
GeForce RTX 2060 Max-Q:
106  fps
ultra 1920x1080
GeForce RTX 2060 Max-Q:
93.1  fps
low 1280x720
GeForce RTX 2060 Max-Q:
104.5  fps
med. 1920x1080
GeForce RTX 2060 Max-Q:
94.2  fps
high 1920x1080
GeForce RTX 2060 Max-Q:
75.6  fps
ultra 1920x1080
GeForce RTX 2060 Max-Q:
63.6  fps
Far Cry 5

Far Cry 5

2018
med. 1920x1080
100%
M3 Max 40-Core GPU:
56  fps
high 1920x1080
100%
M3 Max 40-Core GPU:
53 54 ~ 54 fps
ultra 1920x1080
100%
M3 Max 40-Core GPU:
50 51 ~ 51 fps
QHD 2560x1440
100%
M3 Max 40-Core GPU:
49 49 ~ 49 fps
low 1280x720
GeForce RTX 2060 Max-Q:
94.9 102 103 111 ~ 103 fps
med. 1920x1080
GeForce RTX 2060 Max-Q:
81.9 90 90.7 97.8 ~ 90 fps
high 1920x1080
GeForce RTX 2060 Max-Q:
69.7 75.6 77.4 79.8 ~ 76 fps
4K 3840x2160
GeForce RTX 2060 Max-Q:
59.3 63.7 ~ 62 fps
low 1280x720
GeForce RTX 2060 Max-Q:
126 139 141 ~ 135 fps
med. 1920x1080
GeForce RTX 2060 Max-Q:
74.1 79 82.7 ~ 79 fps
high 1920x1080
GeForce RTX 2060 Max-Q:
55.7 61.3 62.4 ~ 60 fps
QHD 2560x1440
GeForce RTX 2060 Max-Q:
43.6  fps
4K 3840x2160
GeForce RTX 2060 Max-Q:
24.9  fps
Fortnite

Fortnite

2018
low 1280x720
GeForce RTX 2060 Max-Q:
124  fps
med. 1920x1080
GeForce RTX 2060 Max-Q:
110.2  fps
high 1920x1080
GeForce RTX 2060 Max-Q:
107.4  fps
ultra 1920x1080
GeForce RTX 2060 Max-Q:
81.2  fps
low 1280x720
GeForce RTX 2060 Max-Q:
155  fps
med. 1920x1080
GeForce RTX 2060 Max-Q:
123  fps
high 1920x1080
GeForce RTX 2060 Max-Q:
97  fps
ultra 1920x1080
GeForce RTX 2060 Max-Q:
76  fps
low 1280x720
GeForce RTX 2060 Max-Q:
246.9  fps
med. 1920x1080
GeForce RTX 2060 Max-Q:
249.7  fps
high 1920x1080
GeForce RTX 2060 Max-Q:
219.3  fps
Overwatch

Overwatch

2016
low 1280x720
GeForce RTX 2060 Max-Q:
299.9  fps
med. 1366x768
GeForce RTX 2060 Max-Q:
299.7  fps
high 1920x1080
GeForce RTX 2060 Max-Q:
229.7  fps
ultra 1920x1080
GeForce RTX 2060 Max-Q:
146.9  fps
Doom

Doom

2016
low 1280x720
GeForce RTX 2060 Max-Q:
125  fps
med. 1366x768
GeForce RTX 2060 Max-Q:
125  fps
high 1920x1080
GeForce RTX 2060 Max-Q:
118.2  fps
ultra 1920x1080
GeForce RTX 2060 Max-Q:
111.5  fps
low 1280x768
GeForce RTX 2060 Max-Q:
100.4  fps
med. 1920x1080
GeForce RTX 2060 Max-Q:
72.8  fps
high 1920x1080
GeForce RTX 2060 Max-Q:
66.8  fps
low 1024x768
GeForce RTX 2060 Max-Q:
60  fps
med. 1366x768
GeForce RTX 2060 Max-Q:
60  fps
high 1920x1080
GeForce RTX 2060 Max-Q:
60  fps
ultra 1920x1080
GeForce RTX 2060 Max-Q:
59.2  fps
low 1280x720
GeForce RTX 2060 Max-Q:
120.8 141 144 152 ~ 139 fps
med. 1366x768
GeForce RTX 2060 Max-Q:
115.1 129 130 140 ~ 129 fps
high 1920x1080
GeForce RTX 2060 Max-Q:
107.8 119 120 131 ~ 119 fps
ultra 1920x1080
GeForce RTX 2060 Max-Q:
103.8 114 116 123 ~ 114 fps
4K 3840x2160
GeForce RTX 2060 Max-Q:
75.5 83.2 ~ 79 fps
low 1024x768
GeForce RTX 2060 Max-Q:
232.2 235.1 284.8 310.8 ~ 266 fps
med. 1366x768
GeForce RTX 2060 Max-Q:
139.9 168.2 182.1 209.6 ~ 175 fps
high 1920x1080
100%
M3 Max 40-Core GPU:
87  fps
120%
GeForce RTX 2060 Max-Q:
88.9 100.6 109 119 ~ 104 fps
ultra 1920x1080
100%
M3 Max 40-Core GPU:
69 92 ~ 81 fps
70%
GeForce RTX 2060 Max-Q:
51.2 56.1 58.4 62.9 ~ 57 fps
53%
M3 Pro 18-Core GPU:
43  fps
4K 3840x2160
GeForce RTX 2060 Max-Q:
24.9 45.5 ~ 35 fps
GTA V

GTA V

2015
low 1024x768
GeForce RTX 2060 Max-Q:
173  fps
med. 1366x768
GeForce RTX 2060 Max-Q:
164  fps
M3 Pro 18-Core GPU:
90  fps
high 1920x1080
100%
M3 Max 40-Core GPU:
77 79 ~ 78 fps
153%
GeForce RTX 2060 Max-Q:
119  fps
101%
M3 Pro 18-Core GPU:
79  fps
ultra 1920x1080
100%
M3 Max 40-Core GPU:
53 54 ~ 54 fps
126%
GeForce RTX 2060 Max-Q:
68.2  fps
96%
M3 Pro 18-Core GPU:
52  fps
QHD 2560x1440
100%
M3 Max 40-Core GPU:
51 52 ~ 52 fps
94%
M3 Pro 18-Core GPU:
49  fps
low 1280x720
GeForce RTX 2060 Max-Q:
278.3  fps
med. 1366x768
GeForce RTX 2060 Max-Q:
252.3  fps
high 1366x768
GeForce RTX 2060 Max-Q:
229.5  fps
ultra 1920x1080
GeForce RTX 2060 Max-Q:
126.2  fps
low 1024x768
GeForce RTX 2060 Max-Q:
130.3  fps
high 1366x768
GeForce RTX 2060 Max-Q:
67.3  fps
ultra 1920x1080
GeForce RTX 2060 Max-Q:
67.4  fps

Average Gaming Apple M3 Max 40-Core GPU → 100%

Average Gaming 30-70 fps → 100%

Average Gaming NVIDIA GeForce RTX 2060 Max-Q → 83%

Average Gaming 30-70 fps → 80%

Average Gaming Apple M3 Pro 18-Core GPU → 65%

Average Gaming 30-70 fps → 66%

Apple M3 Max 40-Core GPUlowmed.highultraQHD4K
Total War Pharaoh24221013910982
Cyberpunk 2077 2.1 Phantom Liberty4544444236
Baldur's Gate 3969060
Star Wars Jedi Survivor51
Total War: Three Kingdoms1701118256
Shadow of the Tomb Raider14813912087
Far Cry 556545149
The Witcher 38781
GTA V785452
< 30 fps
< 60 fps
< 120 fps
≥ 120 fps

1

1

2

3

2
4
2

4
4
1

4
3


Apple M3 Pro 18-Core GPUlowmed.highultraQHD4K
Total War Pharaoh212140775842
Cyberpunk 2077 2.1 Phantom Liberty5342.63530.8
Baldur's Gate 35343
Star Wars Jedi Survivor302617
Total War: Three Kingdoms87564125
Shadow of the Tomb Raider71655737
The Witcher 343
GTA V90795249
< 30 fps
< 60 fps
< 120 fps
≥ 120 fps

1

1

1
3
1

4
3
1
7

2
3


NVIDIA GeForce RTX 2060 Max-Qlowmed.highultraQHD4K
Gears Tactics257.9120.476.456.918.9
Doom Eternal176.1108.795.793.3
Hunt Showdown194.296.375.7
Escape from Tarkov78.568.568.285.3
Star Wars Jedi Fallen Order92.98877.8
Need for Speed Heat103.288.782.279
GRID 2019157.4109.4103.473.533.1
Ghost Recon Breakpoint123827555
Borderlands 311789.561.948.3
Control183.767.150.4
F1 2019196137116101
Total War: Three Kingdoms201.1103.369.250.7
Anno 180081.581.661.436.5
The Division 2154927456
Dirt Rally 2.0276.7125.3105.360.524.4
Far Cry New Dawn105757063
Metro Exodus129.672.755.243.8
Apex Legends143.6142.8126.2116.6
Assassin´s Creed Odyssey97796545
Shadow of the Tomb Raider11887807020
Strange Brigade27613010693.1
Monster Hunter World104.594.275.663.6
X-Plane 11.11103907662
Final Fantasy XV Benchmark135796043.624.9
Fortnite124110.2107.481.2
Middle-earth: Shadow of War1551239776
Rocket League246.9249.7219.3
Overwatch299.9299.7229.7146.9
Doom125125118.2111.5
Ashes of the Singularity100.472.866.8
Metal Gear Solid V60606059.2
Dota 2 Reborn13912911911479
The Witcher 32661751045735
GTA V17316411968.2
BioShock Infinite278.3252.3229.5126.2
Guild Wars 2130.367.367.4
< 30 fps
< 60 fps
< 120 fps
≥ 120 fps


11
24


22
13

2
30
4

10
18
2

1

4
2
2

Eine Liste mit weiteren Spielen und allen Grafikkarten finden Sie auf unserer Seite: Welches Spiel ist mit welcher Grafikkarte spielbar?

v1.28
log 19. 23:31:29

#0 ran 0s before starting gpusingle class +0s ... 0s

#1 checking url part for id 11636 +0s ... 0s

#2 checking url part for id 9631 +0s ... 0s

#3 checking url part for id 11638 +0s ... 0s

#4 redirected to Ajax server, took 1726781489s time from redirect:0 +0s ... 0s

#5 did not recreate cache, as it is less than 5 days old! Created at Thu, 19 Sep 2024 05:16:33 +0200 +0s ... 0s

#6 composed specs +0.004s ... 0.004s

#7 did output specs +0s ... 0.004s

#8 start showIntegratedCPUs +0s ... 0.004s

#9 getting avg benchmarks for device 11636 +0.028s ... 0.033s

#10 got single benchmarks 11636 +0.005s ... 0.038s

#11 getting avg benchmarks for device 9631 +0.004s ... 0.041s

#12 got single benchmarks 9631 +0.011s ... 0.052s

#13 getting avg benchmarks for device 11638 +0s ... 0.052s

#14 got single benchmarks 11638 +0.003s ... 0.055s

#15 got avg benchmarks for devices +0s ... 0.055s

#16 min, max, avg, median took s +0.029s ... 0.084s

#17 before gaming benchmark output +0s ... 0.084s

#18 Got 271 rows for game benchmarks. +0.019s ... 0.103s

#19 composed SQL query for gamebenchmarks +0s ... 0.103s

#20 got data and put it in $dataArray +0.002s ... 0.105s

#21 benchmarks composed for output. +0.013s ... 0.119s

#22 calculated avg scores. +0s ... 0.119s

#23 return log +0.001s ... 0.12s

Teilen Sie diesen Artikel, um uns zu unterstützen. Jeder Link hilft!
> Notebook Test, Laptop Test und News > Benchmarks / Technik > Benchmarks / Technik > Grafikkarten Vergleich - Head 2 Head
Autor: Klaus Hinum,  8.09.2017 (Update:  1.07.2023)