Notebookcheck Logo

Apple M1 Max 24-Core GPU vs NVIDIA GeForce RTX 3090 Ti vs Apple M1 8-Core GPU

Apple M1 Max 24-Core GPU

► remove from comparison Apple M1 Max 24-Core GPU

Die Apple M1 Max 24-Core GPU ist eine von Apple selbst designte Grafikkarte im Apple M1 Pro SoC und bietet 24 der 32 im Chip integrierten Grafikkerne (daher 3.072 der 4.096 ALUs). Die 32-Kern-Variante bietet eine theoretische Maximalleistung von 10,4 Teraflops, wodurch die 24-Kern-Variante ca 8 Teraflops bieten soll. Im Vergleich zum kleineren M1 Pro mit 16-Kern-GPU bietet der Max-Chip auch eine doppelt so breite Speicheranbindung (512 Bit - 400 GB/s) and den schnellen LPDDR5-6400 Unified Memory.

Die GPU kann in allen M1 Pro und Max Varianten von 389 - 1296 MHz takten und bietet keinen kurzzeitlichen Turbo (389, 486, 648, 778, 972, 1296 MHz Stufen laut Powermetrics).

Sie unterstützt Apple's Metal 2 Schnittstelle und dürfte eine ähnliche Architektur wie die älteren PowerVR Grafikeinheiten (z.B. im Apple A10) aufweisen.

Da der SoC im 5nm Prozess bei TSMC hergestellt wird, sollte die Energieeffizienz hervorragend sein.

NVIDIA GeForce RTX 3090 Ti

► remove from comparison NVIDIA NVIDIA GeForce RTX 3090 Ti

Die Nvidia GeForce RTX 3090 Ti is zum Launch Anfang 2022 die schnellste GeForce Grafikkarte der Ampere-Generation. Sie nutzt den großen GA102-Chip mit 10.752 Shader und 24 GB GDDR6X Grafikspeicher.

Mit einer Leistungsaufnahme von 450 Watt braucht die GPU zwar sehr viel Strom unter Last, die Energieeffizienz ist jedoch trotzdem sehr gut (Leistung pro Watt).

Apple M1 8-Core GPU

► remove from comparison Apple M1 8-Core GPU

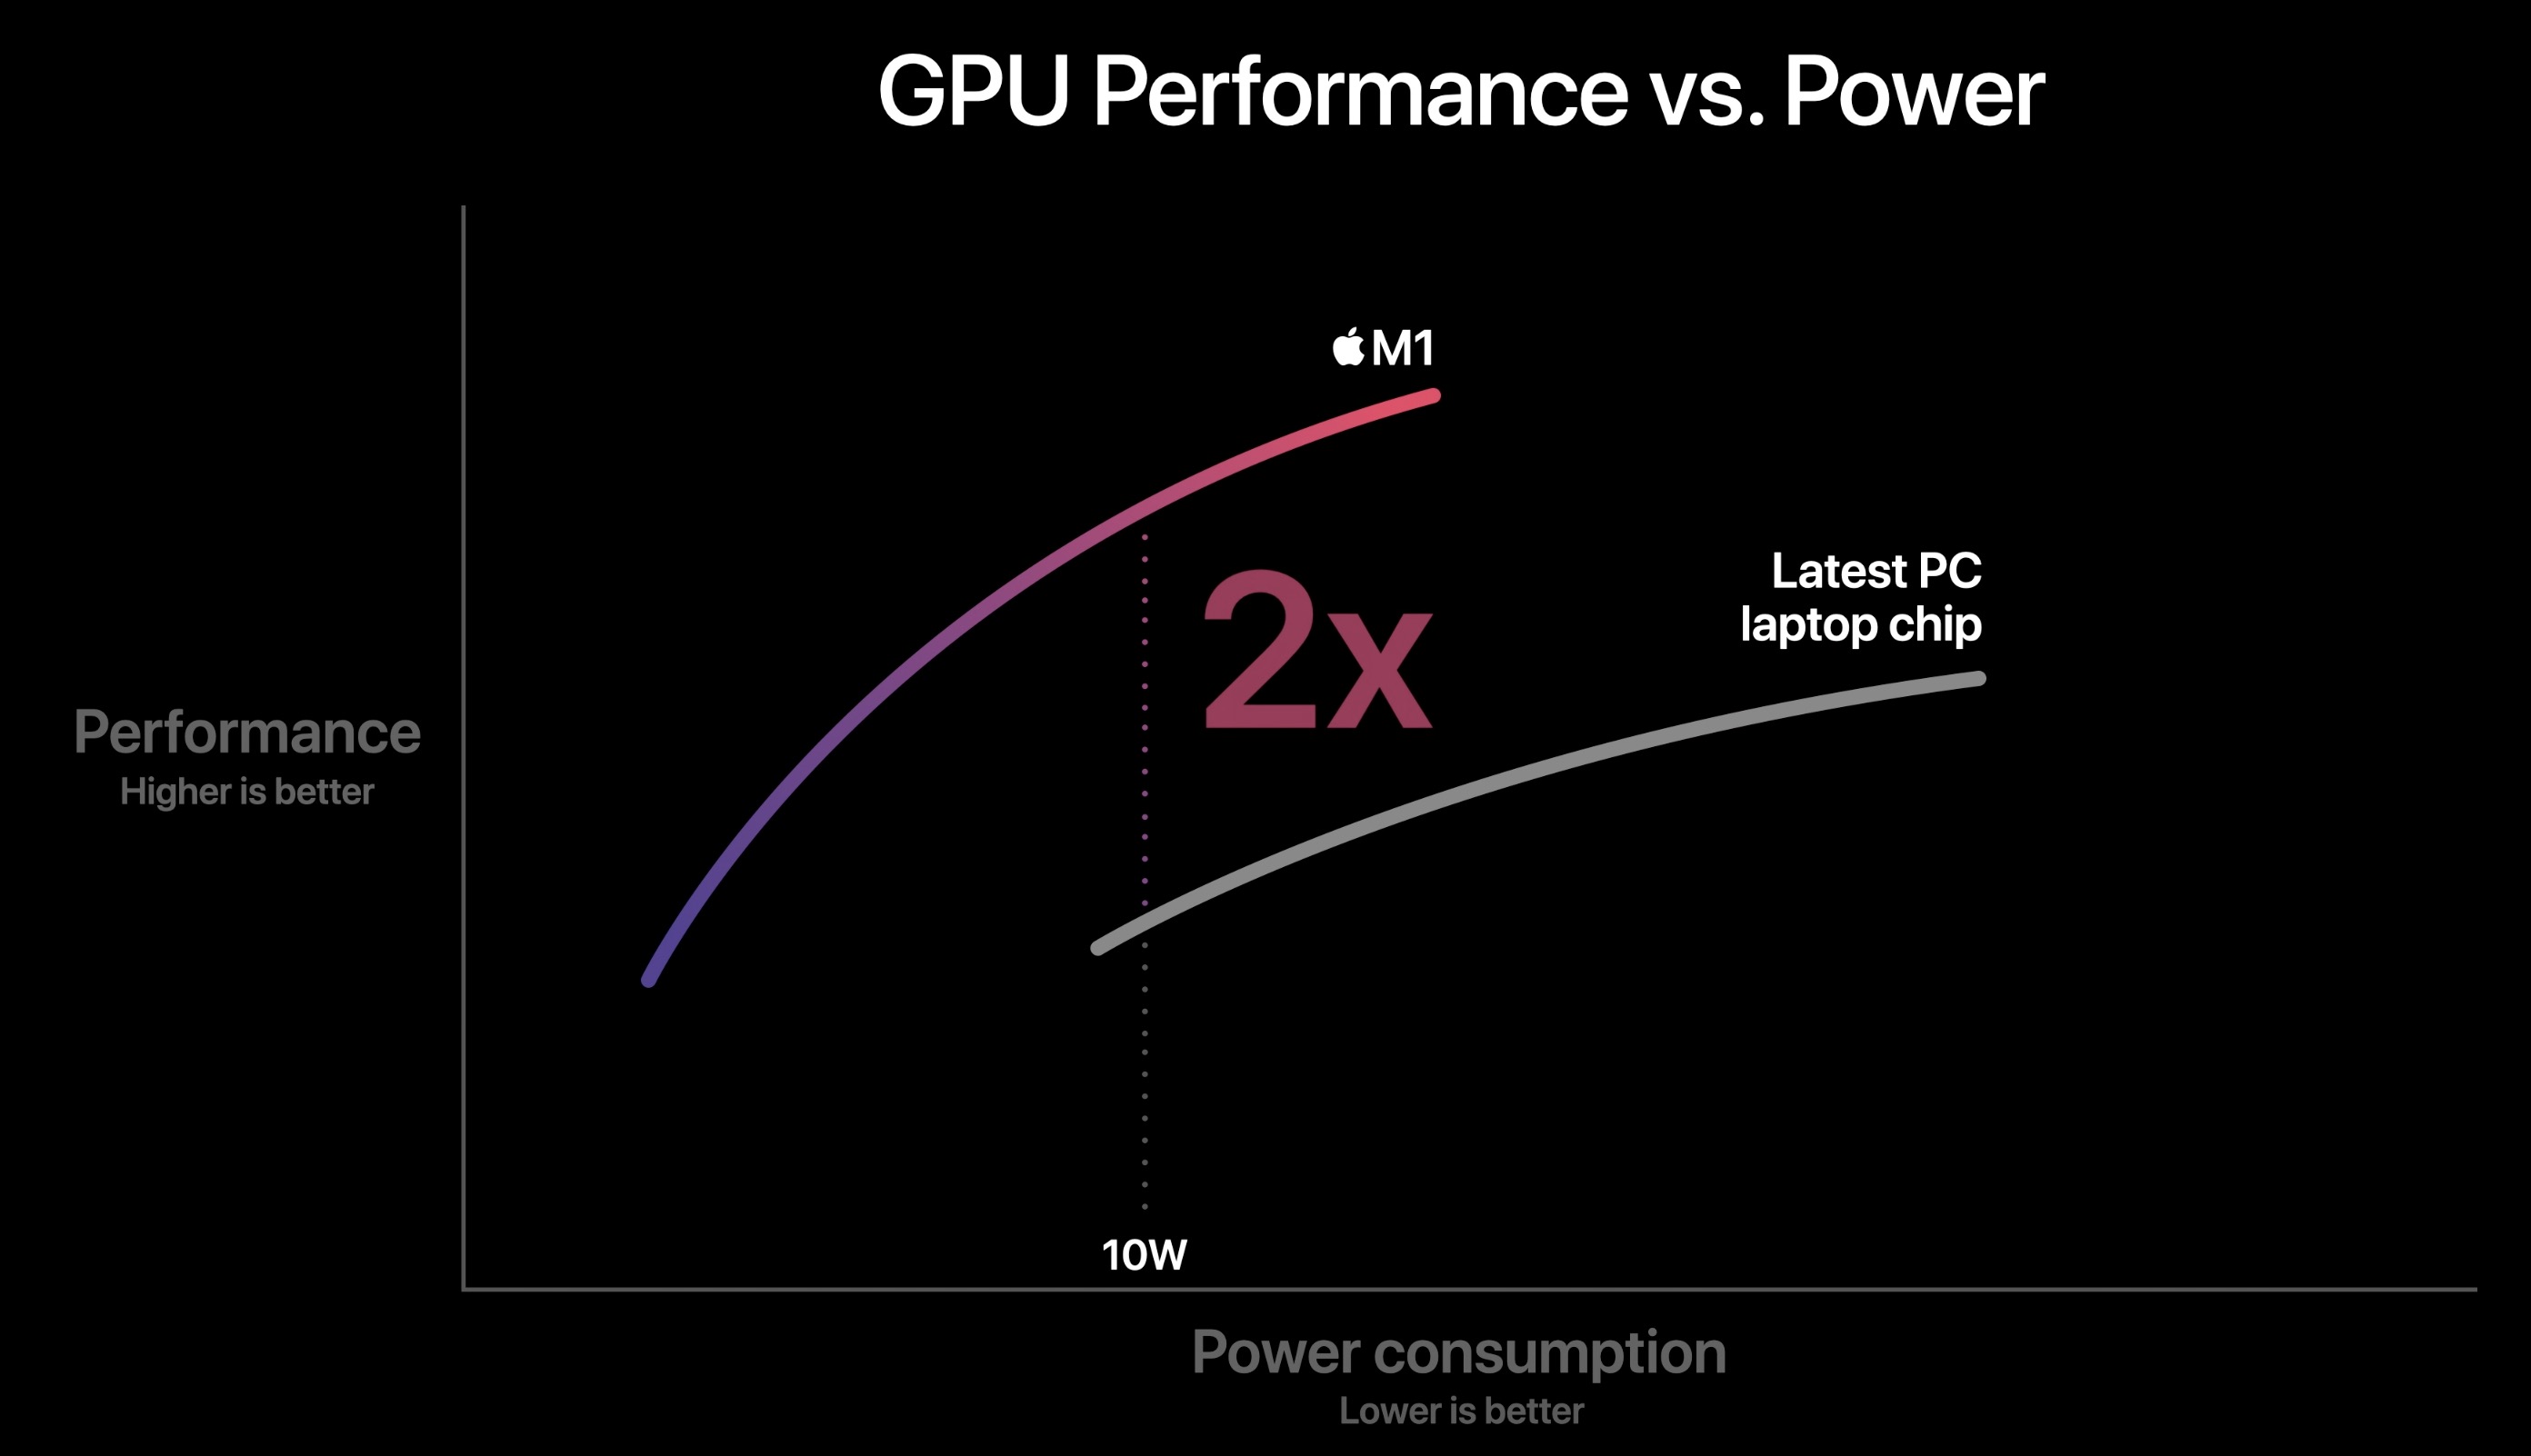
Die Apple M1 GPU ist eine selbst designte Grafikkarte im Apple M1 SoC und laut Apple mit sieben oder acht Kernen (im Einstiegs-MacBook Air sind nur 7 aktiviert). Die 8-Kern-Variante bietet 128 Ausführungseinheiten und eine theoretische Maximalleistung von 2,6 Teraflops. Laut Apple soll die GPU schneller sein als z.b. die iGPU in Tiger Lake.

Sie unterstützt Apple's Metal 2 Schnittstelle und dürfte eine ähnliche Architektur wie die älteren PowerVR Grafikeinheiten (z.B. im Apple A10) aufweisen.

Da der SoC im 5nm Prozess bei TSMC hergestellt wird, sollte die Energieeffizienz hervorragend sein. Die GPU nutzt laut internen Tools unter Last in etwa 10 Watt (11,5 Watt Package inkl. RAM).

Apple M1 Max 24-Core GPUNVIDIA GeForce RTX 3090 TiApple M1 8-Core GPU
Apple M1 Serie
M1 Max 32-Core GPU 32 @ 1.3 GHz512 Bit
M1 Max 24-Core GPU 24 @ 1.3 GHz
M1 Pro 16-Core GPU 16 @ 1.3 GHz
M1 Pro 14-Core GPU 14 @ 1.3 GHz
M1 8-Core GPU 8 @ 1.28 GHz
M1 7-Core GPU 7 @ 1.28 GHz
NVIDIA GeForce RTX 3090 Ti 10752 @ 1.56 - 1.86 GHz384 Bit @ 21000 MHz
NVIDIA GeForce RTX 3090 10496 @ 1.4 - 1.7 GHz384 Bit @ 19500 MHz
NVIDIA GeForce RTX 3080 Ti 10240 @ 1.37 - 1.67 GHz384 Bit @ 19000 MHz
NVIDIA GeForce RTX 3080 12 GB 8960/ cores @ 1.26 - 1.71 GHz384 Bit @ 19000 MHz
NVIDIA GeForce RTX 3080 8704 @ 1.45 - 1.71 GHz320 Bit @ 19000 MHz
GeForce RTX 3070 Ti 6144 @ 1.58 - 1.77 GHz256 Bit @ 19000 MHz
GeForce RTX 3080 Ti Laptop GPU 7424 @ 0.98 - 1.59 GHz256 Bit @ 14000 MHz
NVIDIA GeForce RTX 3070 5888 @ 1.5 - 1.73 GHz256 Bit @ 14000 MHz
GeForce RTX 3080 Laptop GPU 6144 @ 0.78 - 1.25 GHz256 Bit @ 14000 MHz
NVIDIA GeForce RTX 3060 Ti 4864 @ 1.41 - 1.67 GHz256 Bit @ 14000 MHz
GeForce RTX 3070 Ti Laptop GPU 5888 @ 0.92 - 1.48 GHz256 Bit @ 14000 MHz
GeForce RTX 3070 Laptop GPU 5120 @ 0.78 - 1.29 GHz256 Bit @ 14000 MHz
NVIDIA GeForce RTX 3060 3584 @ 1.32 - 1.78 GHz192 Bit @ 15000 MHz
GeForce RTX 3080 Max-Q 6144 @ 0.78 - 1.25 GHz256 Bit @ 6000 MHz
GeForce RTX 3070 Max-Q 5120 @ 1.29 GHz256 Bit
GeForce RTX 3060 Laptop GPU 3840 @ 0.82 - 1.7 GHz192 Bit @ 14000 MHz
GeForce RTX 3060 Max-Q 3840 @ 1.28 GHz192 Bit
NVIDIA GeForce RTX 3050 2560 @ 1.55 - 1.78 GHz128 Bit Bit @ 1750 MHz
GeForce RTX 3050 Ti Laptop GPU 2560 @ 1.22 - 1.49 GHz128 Bit @ 12000 MHz
GeForce RTX 3050 6GB Laptop GPU 2560 @ 1.24 - 1.49 GHz96 Bit @ 12000 MHz
GeForce RTX 3050 A Laptop GPU 1792 64 Bit
GeForce RTX 3050 4GB Laptop GPU 2048 @ 1.24 - 1.5 GHz128 Bit @ 12000 MHz
M1 Max 32-Core GPU 32 @ 1.3 GHz512 Bit
M1 Max 24-Core GPU 24 @ 1.3 GHz
M1 Pro 16-Core GPU 16 @ 1.3 GHz
M1 Pro 14-Core GPU 14 @ 1.3 GHz
M1 8-Core GPU 8 @ 1.28 GHz
M1 7-Core GPU 7 @ 1.28 GHz
Pipelines24 - unified10752 - unified8 - unified
Kerntakt1296 MHz1560 - 1860 (Boost) MHz1278 MHz
SpeichertypLPDDR5-6400GDDR6XLPDDR4X-4266
Shared Memoryneinneinnein
Stromverbrauch10 Watt450 Watt10 Watt
Herstellungsprozess5 nm8 nm5 nm
Erscheinungsdatum10.11.2020 27.01.2022 10.11.2020
CodenameAmpere GA102
ArchitekturAmpere
TMUs336
ROPs112
Raytracing Cores84
Tensor / AI Cores336
Theoretical Performance40 TFLOPS FP16, 40 TFLOPS FP32, 625 TFLOPS FP642.6 TFLOPS FP32
CacheL1: 10.5 MB, L2: 6 MB
Speichertakt21000 effective = 1313 MHz
Speicherbandbreite384 Bit
Max. Speichergröße24 GB
Memory Bandwidth1008 GB/s
APIDirectX 12_2, Shader 6.7, OpenGL 4.6
Transistors28.3 Billion
Die Size 628 mm²
PCIe4.0 x16
Displays4 Displays (max.), HDMI 2.1, DisplayPort 1.4a
PredecessorGeForce RTX 2080 Ti (Desktop)
CPU in M1 8-Core GPUGPU Base SpeedGPU Boost / Turbo
Apple M18 x 2064 MHz? MHz? MHz

Benchmarks

Performance Rating - 3DMark 11 + Fire Strike + Time Spy - NVIDIA GeForce RTX 3090 Ti
23.5 pt (71%)
3DMark - 3DMark Time Spy Score
19241 Points (55%)
3DMark - 3DMark Time Spy Graphics
21645 Points (57%)
3DMark - 3DMark Ice Storm Unlimited Graphics
564087 Points (57%)
280200 Points (28%)
3DMark - 3DMark Ice Storm Extreme Graphics
444102 Points (55%)
3DMark - 3DMark Cloud Gate Score
75753 Points (81%)
3DMark - 3DMark Cloud Gate Graphics
246319 Points (65%)
3DMark - 3DMark Fire Strike Standard Score
36563 Points (65%)
3DMark - 3DMark Fire Strike Standard Graphics
53110 Points (60%)
3DMark - 3DMark Ice Storm Graphics
465704 Points (54%)
3DMark - 3DMark Sling Shot (ES 3.0) Unlimited
min: 7588     avg: 10635     median: 10635 (46%)     max: 13682 Points
3DMark - 3DMark Sling Shot (ES 3.0) Unlimited Graphics
min: 35978     avg: 39365     median: 39364.5 (87%)     max: 42751 Points
3DMark - 3DMark Sling Shot Extreme (ES 3.1) Unlimited
min: 8911     avg: 9606     median: 9605.5 (48%)     max: 10300 Points
3DMark - 3DMark Sling Shot Extreme (ES 3.1) Unlimited Graphics
25707 Points (77%)
3DMark - 3DMark Sling Shot (ES 3.0)
0 Points (0%)
3DMark - 3DMark Sling Shot (ES 3.0) Graphics
0 Points (0%)
3DMark - 3DMark Wild Life Unlimited
118439 Points (60%)
3DMark - 3DMark Wild Life Extreme Unlimited
15730 Points (18%)
46562 Points (54%)
min: 4144     avg: 4696     median: 4821 (6%)     max: 4997 Points
3DMark - 3DMark Night Raid
64315 Points (61%)
3DMark - 3DMark Night Raid Graphics Score
139165 Points (54%)
3DMark 11 - 3DM11 Performance Score
49471 Points (69%)
3DMark 11 - 3DM11 Performance GPU
69481 Points (60%)
Unigine Valley 1.0 - Unigine Valley 1.0 DX
201.7 fps (62%)
SPECviewperf 12
specvp12 sw-03 + NVIDIA GeForce RTX 3090 Ti
SPECviewperf 12 - specvp12 sw-03
85.7 fps (21%)
specvp12 snx-02 + NVIDIA GeForce RTX 3090 Ti
SPECviewperf 12 - specvp12 snx-02
15.6 fps (2%)
specvp12 showcase-01 + NVIDIA GeForce RTX 3090 Ti
SPECviewperf 12 - specvp12 showcase-01
265 fps (58%)
specvp12 mediacal-01 + NVIDIA GeForce RTX 3090 Ti
SPECviewperf 12 - specvp12 mediacal-01
87.1 fps (22%)
specvp12 maya-04 + NVIDIA GeForce RTX 3090 Ti
SPECviewperf 12 - specvp12 maya-04
197 fps (54%)
specvp12 energy-01 + NVIDIA GeForce RTX 3090 Ti
SPECviewperf 12 - specvp12 energy-01
27.6 fps (25%)
specvp12 creo-01 + NVIDIA GeForce RTX 3090 Ti
SPECviewperf 12 - specvp12 creo-01
76.4 fps (31%)
specvp12 catia-04 + NVIDIA GeForce RTX 3090 Ti
SPECviewperf 12 - specvp12 catia-04
150 fps (25%)
specvp12 3dsmax-05 + NVIDIA GeForce RTX 3090 Ti
SPECviewperf 12 - specvp12 3dsmax-05
371 fps (65%)
SPECviewperf 13 specvp13 sw-04 + NVIDIA GeForce RTX 3090 Ti
SPECviewperf 13 - specvp13 sw-04
118 fps (32%)
specvp13 snx-03 + NVIDIA GeForce RTX 3090 Ti
SPECviewperf 13 - specvp13 snx-03
28 fps (3%)
specvp13 showcase-02 + NVIDIA GeForce RTX 3090 Ti
SPECviewperf 13 - specvp13 showcase-02
265 fps (58%)
specvp13 medical-02 + NVIDIA GeForce RTX 3090 Ti
SPECviewperf 13 - specvp13 medical-02
113 fps (24%)
specvp13 maya-05 + NVIDIA GeForce RTX 3090 Ti
SPECviewperf 13 - specvp13 maya-05
493 fps (56%)
specvp13 energy-02 + NVIDIA GeForce RTX 3090 Ti
SPECviewperf 13 - specvp13 energy-02
48.4 fps (16%)
specvp13 creo-02 + NVIDIA GeForce RTX 3090 Ti
SPECviewperf 13 - specvp13 creo-02
353 fps (52%)
specvp13 catia-05 + NVIDIA GeForce RTX 3090 Ti
SPECviewperf 13 - specvp13 catia-05
230 fps (26%)
specvp13 3dsmax-06 + NVIDIA GeForce RTX 3090 Ti
SPECviewperf 13 - specvp13 3dsmax-06
373 fps (65%)
SPECviewperf 2020 specvp2020 solidworks-05 4k + NVIDIA GeForce RTX 3090 Ti
SPECviewperf 2020 - specvp2020 solidworks-05 4k
197 fps (58%)
specvp2020 snx-04 4k + NVIDIA GeForce RTX 3090 Ti
SPECviewperf 2020 - specvp2020 snx-04 4k
23.7 fps (2%)
specvp2020 medical-03 4k + NVIDIA GeForce RTX 3090 Ti
SPECviewperf 2020 - specvp2020 medical-03 4k
22.2 fps (21%)
specvp2020 maya-06 4k + NVIDIA GeForce RTX 3090 Ti
SPECviewperf 2020 - specvp2020 maya-06 4k
353 fps (57%)
specvp2020 energy-03 4k + NVIDIA GeForce RTX 3090 Ti
SPECviewperf 2020 - specvp2020 energy-03 4k
31.6 fps (7%)
specvp2020 creo-03 4k + NVIDIA GeForce RTX 3090 Ti
SPECviewperf 2020 - specvp2020 creo-03 4k
84.5 fps (40%)
specvp2020 catia-06 4k + NVIDIA GeForce RTX 3090 Ti
SPECviewperf 2020 - specvp2020 catia-06 4k
58.6 fps (38%)
specvp2020 3dsmax-07 4k + NVIDIA GeForce RTX 3090 Ti
SPECviewperf 2020 - specvp2020 3dsmax-07 4k
145 fps (60%)
Cinebench R11.5 Cinebench R11.5 OpenGL 64 Bit + NVIDIA GeForce RTX 3090 Ti
Cinebench R11.5 - Cinebench R11.5 OpenGL 64 Bit
108.2 fps (36%)
Cinebench R15
Cinebench R15 OpenGL 64 Bit + Apple M1 Max 24-Core GPU
Cinebench R15 - Cinebench R15 OpenGL 64 Bit
94 fps (5%)
Cinebench R15 OpenGL 64 Bit + NVIDIA GeForce RTX 3090 Ti
204 fps (12%)
Cinebench R15 OpenGL 64 Bit + Apple M1 8-Core GPU
min: 88.1     avg: 89.1     median: 89.4 (5%)     max: 89.8 fps
Cinebench R15 OpenGL Ref. Match 64 Bit + Apple M1 Max 24-Core GPU
Cinebench R15 - Cinebench R15 OpenGL Ref. Match 64 Bit
99.5 % (100%)
Cinebench R15 OpenGL Ref. Match 64 Bit + NVIDIA GeForce RTX 3090 Ti
99.6 % (100%)
Cinebench R15 OpenGL Ref. Match 64 Bit + Apple M1 8-Core GPU
99.5 % (100%)
GFXBench - GFXBench 5.0 Aztec Ruins High Tier Offscreen
240 fps (44%)
GFXBench - GFXBench 5.0 Aztec Ruins Normal Tier Offscreen
636 fps (47%)
GFXBench - GFXBench Car Chase Offscreen
416 fps (47%)
GFXBench 3.1 - GFXBench Manhattan ES 3.1 Offscreen
686 fps (15%)
GFXBench 3.0 - GFXBench 3.0 Manhattan Offscreen
1153 fps (68%)
min: 317     avg: 358.5     median: 345 (20%)     max: 408 fps
GFXBench (DX / GLBenchmark) 2.7
GFXBench T-Rex HD Offscreen C24Z16 + Apple M1 Max 24-Core GPU
GFXBench (DX / GLBenchmark) 2.7 - GFXBench T-Rex HD Offscreen C24Z16
2027 fps (16%)
GFXBench T-Rex HD Offscreen C24Z16 + Apple M1 8-Core GPU
min: 557     avg: 610     median: 588 (5%)     max: 670 fps
Antutu v9 - AnTuTu v9 GPU
min: 549301     avg: 598951     median: 598951 (75%)     max: 648601 Points
LuxMark v2.0 64Bit - LuxMark v2.0 Room GPU
6221 Samples/s (28%)
LuxMark v2.0 64Bit - LuxMark v2.0 Sala GPU
16046 Samples/s (28%)
ComputeMark v2.1 - ComputeMark v2.1 Result
52258 Points (56%)
Power Consumption - Furmark Stress Test Power Consumption - external Monitor *
min: 598     avg: 615     median: 599 (85%)     max: 648 Watt
Power Consumption - The Witcher 3 Power Consumption - external Monitor *
60 Watt (8%)
min: 561     avg: 564     median: 561 (78%)     max: 569 Watt
Power Consumption - Witcher 3 Power Consumption *
76.3 Watt (17%)
min: 19.6     avg: 39.4     median: 39.4 (9%)     max: 59.2 Watt
Power Consumption - GFXBench Aztec Ruins Normal Tier Offscreen Power Consumption 150cd *
min: 16     avg: 16.4     median: 16.5 (6%)     max: 16.6 Watt
Power Consumption - Witcher 3 ultra Power Efficiency - external Monitor
min: 0.3447     avg: 0.3     median: 0.3 (29%)     max: 0.345 fps per Watt
Emissions Witcher 3 Fan Noise + Apple M1 Max 24-Core GPU
Emissions - Witcher 3 Fan Noise
35.8 dB(A) (57%)

Average Benchmarks Apple M1 Max 24-Core GPU → 100% n=3

Average Benchmarks NVIDIA GeForce RTX 3090 Ti → 204% n=3

Average Benchmarks Apple M1 8-Core GPU → 75% n=3

- Bereich der Benchmarkergebnisse für diese Grafikkarte
- Durchschnittliche Benchmarkergebnisse für diese Grafikkarte
* Smaller numbers mean a higher performance
1 This benchmark is not used for the average calculation

Spiele-Benchmarks

Die folgenden Benchmarks basieren auf unseren Spieletests mit Testnotebooks. Die Performance dieser Grafikkarte bei den gelisteten Spielen ist abhängig von der verwendeten CPU, Speicherausstattung, Treiber und auch Betriebssystem. Dadurch müssen die untenstehenden Werte nicht repräsentativ sein. Detaillierte Informationen über das verwendete System sehen Sie nach einem Klick auf den fps-Wert.

low 1920x1080
NVIDIA GeForce RTX 3090 Ti:
263 263 ~ 263 fps
med. 1920x1080
NVIDIA GeForce RTX 3090 Ti:
260 260 ~ 260 fps
high 1920x1080
NVIDIA GeForce RTX 3090 Ti:
261 261 ~ 261 fps
ultra 1920x1080
NVIDIA GeForce RTX 3090 Ti:
261 261 ~ 261 fps
QHD 2560x1440
NVIDIA GeForce RTX 3090 Ti:
210 210 ~ 210 fps
4K 3840x2160
NVIDIA GeForce RTX 3090 Ti:
113.2 113.2 ~ 113 fps
low 1920x1080
NVIDIA GeForce RTX 3090 Ti:
324  fps
med. 1920x1080
NVIDIA GeForce RTX 3090 Ti:
277 277 ~ 277 fps
high 1920x1080
NVIDIA GeForce RTX 3090 Ti:
231 231 ~ 231 fps
ultra 1920x1080
NVIDIA GeForce RTX 3090 Ti:
190.2 190.2 ~ 190 fps
QHD 2560x1440
NVIDIA GeForce RTX 3090 Ti:
142.6 142.6 ~ 143 fps
4K 3840x2160
NVIDIA GeForce RTX 3090 Ti:
81.1 81.1 ~ 81 fps
low 1920x1080
NVIDIA GeForce RTX 3090 Ti:
219 219 ~ 219 fps
med. 1920x1080
NVIDIA GeForce RTX 3090 Ti:
201 201 ~ 201 fps
high 1920x1080
NVIDIA GeForce RTX 3090 Ti:
172.8 172.8 ~ 173 fps
ultra 1920x1080
NVIDIA GeForce RTX 3090 Ti:
151.8 151.8 ~ 152 fps
QHD 2560x1440
NVIDIA GeForce RTX 3090 Ti:
103.9 103.9 ~ 104 fps
4K 3840x2160
NVIDIA GeForce RTX 3090 Ti:
53.3 53.3 ~ 53 fps
low 1920x1080
NVIDIA GeForce RTX 3090 Ti:
228 228 ~ 228 fps
med. 1920x1080
NVIDIA GeForce RTX 3090 Ti:
202 202 ~ 202 fps
high 1920x1080
NVIDIA GeForce RTX 3090 Ti:
173.4 173.4 ~ 173 fps
ultra 1920x1080
NVIDIA GeForce RTX 3090 Ti:
156.6 156.6 ~ 157 fps
QHD 2560x1440
NVIDIA GeForce RTX 3090 Ti:
153.2 153.2 ~ 153 fps
4K 3840x2160
NVIDIA GeForce RTX 3090 Ti:
120.5 120.5 ~ 121 fps
low 1920x1080
NVIDIA GeForce RTX 3090 Ti:
60 60 ~ 60 fps
med. 1920x1080
NVIDIA GeForce RTX 3090 Ti:
60 60 ~ 60 fps
high 1920x1080
NVIDIA GeForce RTX 3090 Ti:
60 60 ~ 60 fps
ultra 1920x1080
NVIDIA GeForce RTX 3090 Ti:
60 60 ~ 60 fps
QHD 2560x1440
NVIDIA GeForce RTX 3090 Ti:
60 60 ~ 60 fps
4K 3840x2160
NVIDIA GeForce RTX 3090 Ti:
60 60 ~ 60 fps
low 1920x1080
NVIDIA GeForce RTX 3090 Ti:
202 202 ~ 202 fps
med. 1920x1080
NVIDIA GeForce RTX 3090 Ti:
171.4 171.4 ~ 171 fps
high 1920x1080
NVIDIA GeForce RTX 3090 Ti:
153 153 ~ 153 fps
QHD 2560x1440
NVIDIA GeForce RTX 3090 Ti:
113.2 113.2 ~ 113 fps
4K 3840x2160
NVIDIA GeForce RTX 3090 Ti:
64.3 64.3 ~ 64 fps
low 1920x1080
NVIDIA GeForce RTX 3090 Ti:
411 411 ~ 411 fps
med. 1920x1080
NVIDIA GeForce RTX 3090 Ti:
347 347 ~ 347 fps
high 1920x1080
NVIDIA GeForce RTX 3090 Ti:
315 315 ~ 315 fps
ultra 1920x1080
NVIDIA GeForce RTX 3090 Ti:
290 290 ~ 290 fps
QHD 2560x1440
NVIDIA GeForce RTX 3090 Ti:
208 208 ~ 208 fps
4K 3840x2160
NVIDIA GeForce RTX 3090 Ti:
116 116 ~ 116 fps
low 1280x720
NVIDIA GeForce RTX 3090 Ti:
231  fps
med. 1920x1080
NVIDIA GeForce RTX 3090 Ti:
200 200 ~ 200 fps
high 1920x1080
NVIDIA GeForce RTX 3090 Ti:
188 188 ~ 188 fps
ultra 1920x1080
NVIDIA GeForce RTX 3090 Ti:
127 127 ~ 127 fps
QHD 2560x1440
NVIDIA GeForce RTX 3090 Ti:
114 114 ~ 114 fps
4K 3840x2160
NVIDIA GeForce RTX 3090 Ti:
89 89 ~ 89 fps
med. 1920x1080
NVIDIA GeForce RTX 3090 Ti:
195.5 195.5 ~ 196 fps
high 1920x1080
NVIDIA GeForce RTX 3090 Ti:
207 207 ~ 207 fps
ultra 1920x1080
NVIDIA GeForce RTX 3090 Ti:
191.2 191.2 ~ 191 fps
QHD 2560x1440
NVIDIA GeForce RTX 3090 Ti:
149.9 149.9 ~ 150 fps
4K 3840x2160
NVIDIA GeForce RTX 3090 Ti:
93.7 93.7 ~ 94 fps
Far Cry 6

Far Cry 6

2021
med. 1920x1080
NVIDIA GeForce RTX 3090 Ti:
179 179 ~ 179 fps
high 1920x1080
NVIDIA GeForce RTX 3090 Ti:
161.6 162 ~ 162 fps
ultra 1920x1080
NVIDIA GeForce RTX 3090 Ti:
142 142 ~ 142 fps
QHD 2560x1440
NVIDIA GeForce RTX 3090 Ti:
132.9 132.9 ~ 133 fps
4K 3840x2160
NVIDIA GeForce RTX 3090 Ti:
89.9 90 ~ 90 fps
F1 2021

F1 2021

2021
med. 1920x1080
NVIDIA GeForce RTX 3090 Ti:
537 537 ~ 537 fps
high 1920x1080
NVIDIA GeForce RTX 3090 Ti:
470 470 ~ 470 fps
ultra 1920x1080
NVIDIA GeForce RTX 3090 Ti:
242 242 ~ 242 fps
QHD 2560x1440
NVIDIA GeForce RTX 3090 Ti:
189.3 189.3 ~ 189 fps
4K 3840x2160
NVIDIA GeForce RTX 3090 Ti:
114.9 114.9 ~ 115 fps
League of Legends: Wild Rift

League of Legends: Wild Rift

2020
ultra
M1 8-Core GPU:
60  fps
med. 1920x1080
NVIDIA GeForce RTX 3090 Ti:
160 160 ~ 160 fps
high 1920x1080
NVIDIA GeForce RTX 3090 Ti:
138 138 ~ 138 fps
ultra 1920x1080
NVIDIA GeForce RTX 3090 Ti:
123 123 ~ 123 fps
QHD 2560x1440
NVIDIA GeForce RTX 3090 Ti:
108 108 ~ 108 fps
4K 3840x2160
NVIDIA GeForce RTX 3090 Ti:
73 73 ~ 73 fps
med. 1920x1080
NVIDIA GeForce RTX 3090 Ti:
171.4 171.4 ~ 171 fps
high 1920x1080
NVIDIA GeForce RTX 3090 Ti:
154.2 154.2 ~ 154 fps
ultra 1920x1080
NVIDIA GeForce RTX 3090 Ti:
130.2 130.2 ~ 130 fps
QHD 2560x1440
NVIDIA GeForce RTX 3090 Ti:
107.8 107.8 ~ 108 fps
4K 3840x2160
NVIDIA GeForce RTX 3090 Ti:
70.1 70.1 ~ 70 fps
Call of Duty Mobile

Call of Duty Mobile

2020
high
M1 8-Core GPU:
59 60 ~ 60 fps
ultra
M1 8-Core GPU:
59 60 60 ~ 60 fps
Genshin Impact

Genshin Impact

2020
ultra
M1 8-Core GPU:
59 60 ~ 60 fps
med. 1920x1080
NVIDIA GeForce RTX 3090 Ti:
240 240 240 ~ 240 fps
high 1920x1080
NVIDIA GeForce RTX 3090 Ti:
231 231 ~ 231 fps
QHD 2560x1440
NVIDIA GeForce RTX 3090 Ti:
173.9 173.9 ~ 174 fps
4K 3840x2160
NVIDIA GeForce RTX 3090 Ti:
99.2 99.2 ~ 99 fps
Armajet

Armajet

2020
high
M1 8-Core GPU:
59 60 ~ 60 fps
low 1280x720
100%
M1 Max 24-Core GPU:
57.2  fps
84%
M1 8-Core GPU:
30.4 52.5 54 56.7 ~ 48 fps
med. 1920x1080
100%
M1 Max 24-Core GPU:
47.7  fps
428%
NVIDIA GeForce RTX 3090 Ti:
204 204 ~ 204 fps
61%
M1 8-Core GPU:
20.3 30.7 32.5 33 ~ 29 fps
high 1920x1080
100%
M1 Max 24-Core GPU:
40.7  fps
462%
NVIDIA GeForce RTX 3090 Ti:
187.6 187.6 ~ 188 fps
49%
M1 8-Core GPU:
19 20 20.5 ~ 20 fps
ultra 1920x1080
100%
M1 Max 24-Core GPU:
34.6  fps
500%
NVIDIA GeForce RTX 3090 Ti:
173.3 173.3 ~ 173 fps
QHD 2560x1440
NVIDIA GeForce RTX 3090 Ti:
143.1 143.1 ~ 143 fps
4K 3840x2160
NVIDIA GeForce RTX 3090 Ti:
83.8 83.8 ~ 84 fps
Control

Control

2019
med. 1920x1080
NVIDIA GeForce RTX 3090 Ti:
240 240 ~ 240 fps
high 1920x1080
NVIDIA GeForce RTX 3090 Ti:
209 209 ~ 209 fps
QHD 2560x1440
NVIDIA GeForce RTX 3090 Ti:
142.5 142.5 ~ 143 fps
4K 3840x2160
NVIDIA GeForce RTX 3090 Ti:
73.9 73.9 ~ 74 fps
low 1280x720
100%
M1 Max 24-Core GPU:
201  fps
49%
M1 8-Core GPU:
93.4 100 100 100.1 ~ 98 fps
med. 1920x1080
100%
M1 Max 24-Core GPU:
96  fps
357%
NVIDIA GeForce RTX 3090 Ti:
342.6 342.6 ~ 343 fps
36%
M1 8-Core GPU:
32.2 33 33 42.3 ~ 35 fps
high 1920x1080
100%
M1 Max 24-Core GPU:
62  fps
402%
NVIDIA GeForce RTX 3090 Ti:
248.9 248.9 ~ 249 fps
35%
M1 8-Core GPU:
20 20.3 20.6 25.5 ~ 22 fps
ultra 1920x1080
100%
M1 Max 24-Core GPU:
46  fps
385%
NVIDIA GeForce RTX 3090 Ti:
176.6 176.6 ~ 177 fps
33%
M1 8-Core GPU:
15 15 ~ 15 fps
QHD 2560x1440
NVIDIA GeForce RTX 3090 Ti:
117.9 117.9 ~ 118 fps
4K 3840x2160
NVIDIA GeForce RTX 3090 Ti:
59.9 59.9 ~ 60 fps
med. 1920x1080
NVIDIA GeForce RTX 3090 Ti:
213 213 ~ 213 fps
high 1920x1080
NVIDIA GeForce RTX 3090 Ti:
175.2 175.2 ~ 175 fps
ultra 1920x1080
NVIDIA GeForce RTX 3090 Ti:
145.9 145.9 ~ 146 fps
QHD 2560x1440
NVIDIA GeForce RTX 3090 Ti:
125.3 125.3 ~ 125 fps
4K 3840x2160
NVIDIA GeForce RTX 3090 Ti:
84.3 84.3 ~ 84 fps
low 1280x720
100%
M1 Max 24-Core GPU:
141  fps
49%
M1 8-Core GPU:
64 66 78 ~ 69 fps
med. 1920x1080
100%
M1 Max 24-Core GPU:
85  fps
312%
NVIDIA GeForce RTX 3090 Ti:
265 265 ~ 265 fps
38%
M1 8-Core GPU:
25 27 45 ~ 32 fps
high 1920x1080
100%
M1 Max 24-Core GPU:
79  fps
325%
NVIDIA GeForce RTX 3090 Ti:
257 257 ~ 257 fps
38%
M1 8-Core GPU:
23 25 43 ~ 30 fps
ultra 1920x1080
100%
M1 Max 24-Core GPU:
77  fps
317%
NVIDIA GeForce RTX 3090 Ti:
244 244 ~ 244 fps
49%
M1 8-Core GPU:
38  fps
QHD 2560x1440
NVIDIA GeForce RTX 3090 Ti:
184 184 ~ 184 fps
4K 3840x2160
NVIDIA GeForce RTX 3090 Ti:
106 106 ~ 106 fps
PUBG Mobile

PUBG Mobile

2018
low
M1 8-Core GPU:
39  fps
high
M1 8-Core GPU:
39 39.9 40 ~ 40 fps
ultra
M1 8-Core GPU:
39 44 ~ 42 fps
World of Tanks Blitz

World of Tanks Blitz

2018
high
M1 8-Core GPU:
59  fps
low 1280x720
NVIDIA GeForce RTX 3090 Ti:
169.1 169.1 ~ 169 fps
med. 1920x1080
NVIDIA GeForce RTX 3090 Ti:
158.1 158.1 ~ 158 fps
high 1920x1080
NVIDIA GeForce RTX 3090 Ti:
135.9 135.9 ~ 136 fps
4K 3840x2160
NVIDIA GeForce RTX 3090 Ti:
115.7 115.7 ~ 116 fps
low 1280x720
NVIDIA GeForce RTX 3090 Ti:
222 222 ~ 222 fps
med. 1920x1080
NVIDIA GeForce RTX 3090 Ti:
226 226 ~ 226 fps
high 1920x1080
NVIDIA GeForce RTX 3090 Ti:
186.1 186.1 ~ 186 fps
QHD 2560x1440
NVIDIA GeForce RTX 3090 Ti:
151.6 151.6 ~ 152 fps
4K 3840x2160
NVIDIA GeForce RTX 3090 Ti:
96.3 96.3 ~ 96 fps
ultra 1920x1080
M1 8-Core GPU:
39.6  fps
low 1280x720
NVIDIA GeForce RTX 3090 Ti:
257.7 257.7 ~ 258 fps
med. 1366x768
NVIDIA GeForce RTX 3090 Ti:
231.2 231.2 ~ 231 fps
high 1920x1080
NVIDIA GeForce RTX 3090 Ti:
217.1 217.1 ~ 217 fps
ultra 1920x1080
NVIDIA GeForce RTX 3090 Ti:
194.1 195.8 ~ 195 fps
4K 3840x2160
NVIDIA GeForce RTX 3090 Ti:
184.2 184.2 ~ 184 fps
high 1920x1080
NVIDIA GeForce RTX 3090 Ti:
394 394 ~ 394 fps
ultra 1920x1080
NVIDIA GeForce RTX 3090 Ti:
193.4 193.4 196.3 ~ 194 fps
4K 3840x2160
NVIDIA GeForce RTX 3090 Ti:
172.9 172.9 ~ 173 fps
GTA V

GTA V

2015
high 1920x1080
NVIDIA GeForce RTX 3090 Ti:
179.9 185.6 ~ 183 fps
ultra 1920x1080
NVIDIA GeForce RTX 3090 Ti:
151.8 160.7 ~ 156 fps
QHD 2560x1440
NVIDIA GeForce RTX 3090 Ti:
146.4 155.3 ~ 151 fps
4K 3840x2160
NVIDIA GeForce RTX 3090 Ti:
179.5 182.6 ~ 181 fps

Average Gaming Apple M1 Max 24-Core GPU → 100%

Average Gaming 30-70 fps → 100%

Average Gaming NVIDIA GeForce RTX 3090 Ti → 387%

Average Gaming Apple M1 8-Core GPU → 47%

Average Gaming 30-70 fps → 51%

NVIDIA GeForce RTX 3090 Tilowmed.highultraQHD4K
Ghostwire Tokyo263260261261210113
Tiny Tina's Wonderlands32427723119014381
Cyberpunk 2077 1.621920117315210453
GRID Legends228202173157153121
Elden Ring606060606060
Dying Light 220217115311364
Rainbow Six Extraction411347315290208116
Forza Horizon 523120018812711489
Call of Duty Vanguard19620719115094
Far Cry 617916214213390
F1 2021537470242189115
Assassin´s Creed Valhalla16013812310873
Watch Dogs Legion17115413010870
Mafia Definitive Edition24023117499
Borderlands 320418817314384
Control24020914374
Total War: Three Kingdoms34324917711860
Metro Exodus21317514612584
Shadow of the Tomb Raider265257244184106
X-Plane 11.11169158136116
Final Fantasy XV Benchmark22222618615296
Dota 2 Reborn258231217195184
The Witcher 3394194173
GTA V183156151181
< 30 fps
< 60 fps
< 120 fps
≥ 120 fps


1
10


1
21


1
23


1
18


7
14

1
19
4
Apple M1 8-Core GPUlowmed.highultraQHD4K
League of Legends: Wild Rift60
Call of Duty Mobile6060
Genshin Impact60
Armajet60
Borderlands 3482920
Total War: Three Kingdoms98352215
Shadow of the Tomb Raider69323038
PUBG Mobile394042
World of Tanks Blitz59
Rise of the Tomb Raider39.6
< 30 fps
< 60 fps
< 120 fps
≥ 120 fps

2
2
1
2

2
3
2
1
3
3


Apple M1 Max 24-Core GPUlowmed.highultraQHD4K
Borderlands 357.247.740.734.6
Total War: Three Kingdoms201966246
Shadow of the Tomb Raider141857977
< 30 fps
< 60 fps
< 120 fps
≥ 120 fps

1

2

1
2

1
2

2
1


Eine Liste mit weiteren Spielen und allen Grafikkarten finden Sie auf unserer Seite: Welches Spiel ist mit welcher Grafikkarte spielbar?

v1.28
log 19. 21:57:44

#0 ran 0s before starting gpusingle class +0s ... 0s

#1 checking url part for id 10967 +0s ... 0s

#2 checking url part for id 11324 +0s ... 0s

#3 checking url part for id 10552 +0s ... 0s

#4 redirected to Ajax server, took 1726775864s time from redirect:0 +0s ... 0s

#5 did not recreate cache, as it is less than 5 days old! Created at Thu, 19 Sep 2024 05:16:33 +0200 +0s ... 0s

#6 composed specs +0.005s ... 0.005s

#7 did output specs +0s ... 0.005s

#8 start showIntegratedCPUs +0s ... 0.005s

#9 getting avg benchmarks for device 10967 +0.018s ... 0.023s

#10 got single benchmarks 10967 +0.004s ... 0.027s

#11 getting avg benchmarks for device 11324 +0.005s ... 0.032s

#12 got single benchmarks 11324 +0.005s ... 0.037s

#13 getting avg benchmarks for device 10552 +0s ... 0.037s

#14 got single benchmarks 10552 +0.001s ... 0.038s

#15 got avg benchmarks for devices +0s ... 0.038s

#16 No cached benchmark found, getting uncached values +0.006s ... 0.044s

#17 No cached benchmark found, getting uncached values +0s ... 0.044s

#18 min, max, avg, median took s +0.025s ... 0.069s

#19 before gaming benchmark output +0s ... 0.069s

#20 Got 307 rows for game benchmarks. +0.017s ... 0.086s

#21 composed SQL query for gamebenchmarks +0s ... 0.086s

#22 got data and put it in $dataArray +0.002s ... 0.088s

#23 benchmarks composed for output. +0.01s ... 0.099s

#24 calculated avg scores. +0s ... 0.099s

#25 return log +0.001s ... 0.099s

Teilen Sie diesen Artikel, um uns zu unterstützen. Jeder Link hilft!
> Notebook Test, Laptop Test und News > Benchmarks / Technik > Benchmarks / Technik > Grafikkarten Vergleich - Head 2 Head
Autor: Klaus Hinum,  8.09.2017 (Update:  1.07.2023)