

Apple M1 8-Core GPU vs NVIDIA GeForce RTX 3070 Max-Q vs Apple M1 Pro 16-Core GPU
Apple M1 8-Core GPU
► remove from comparison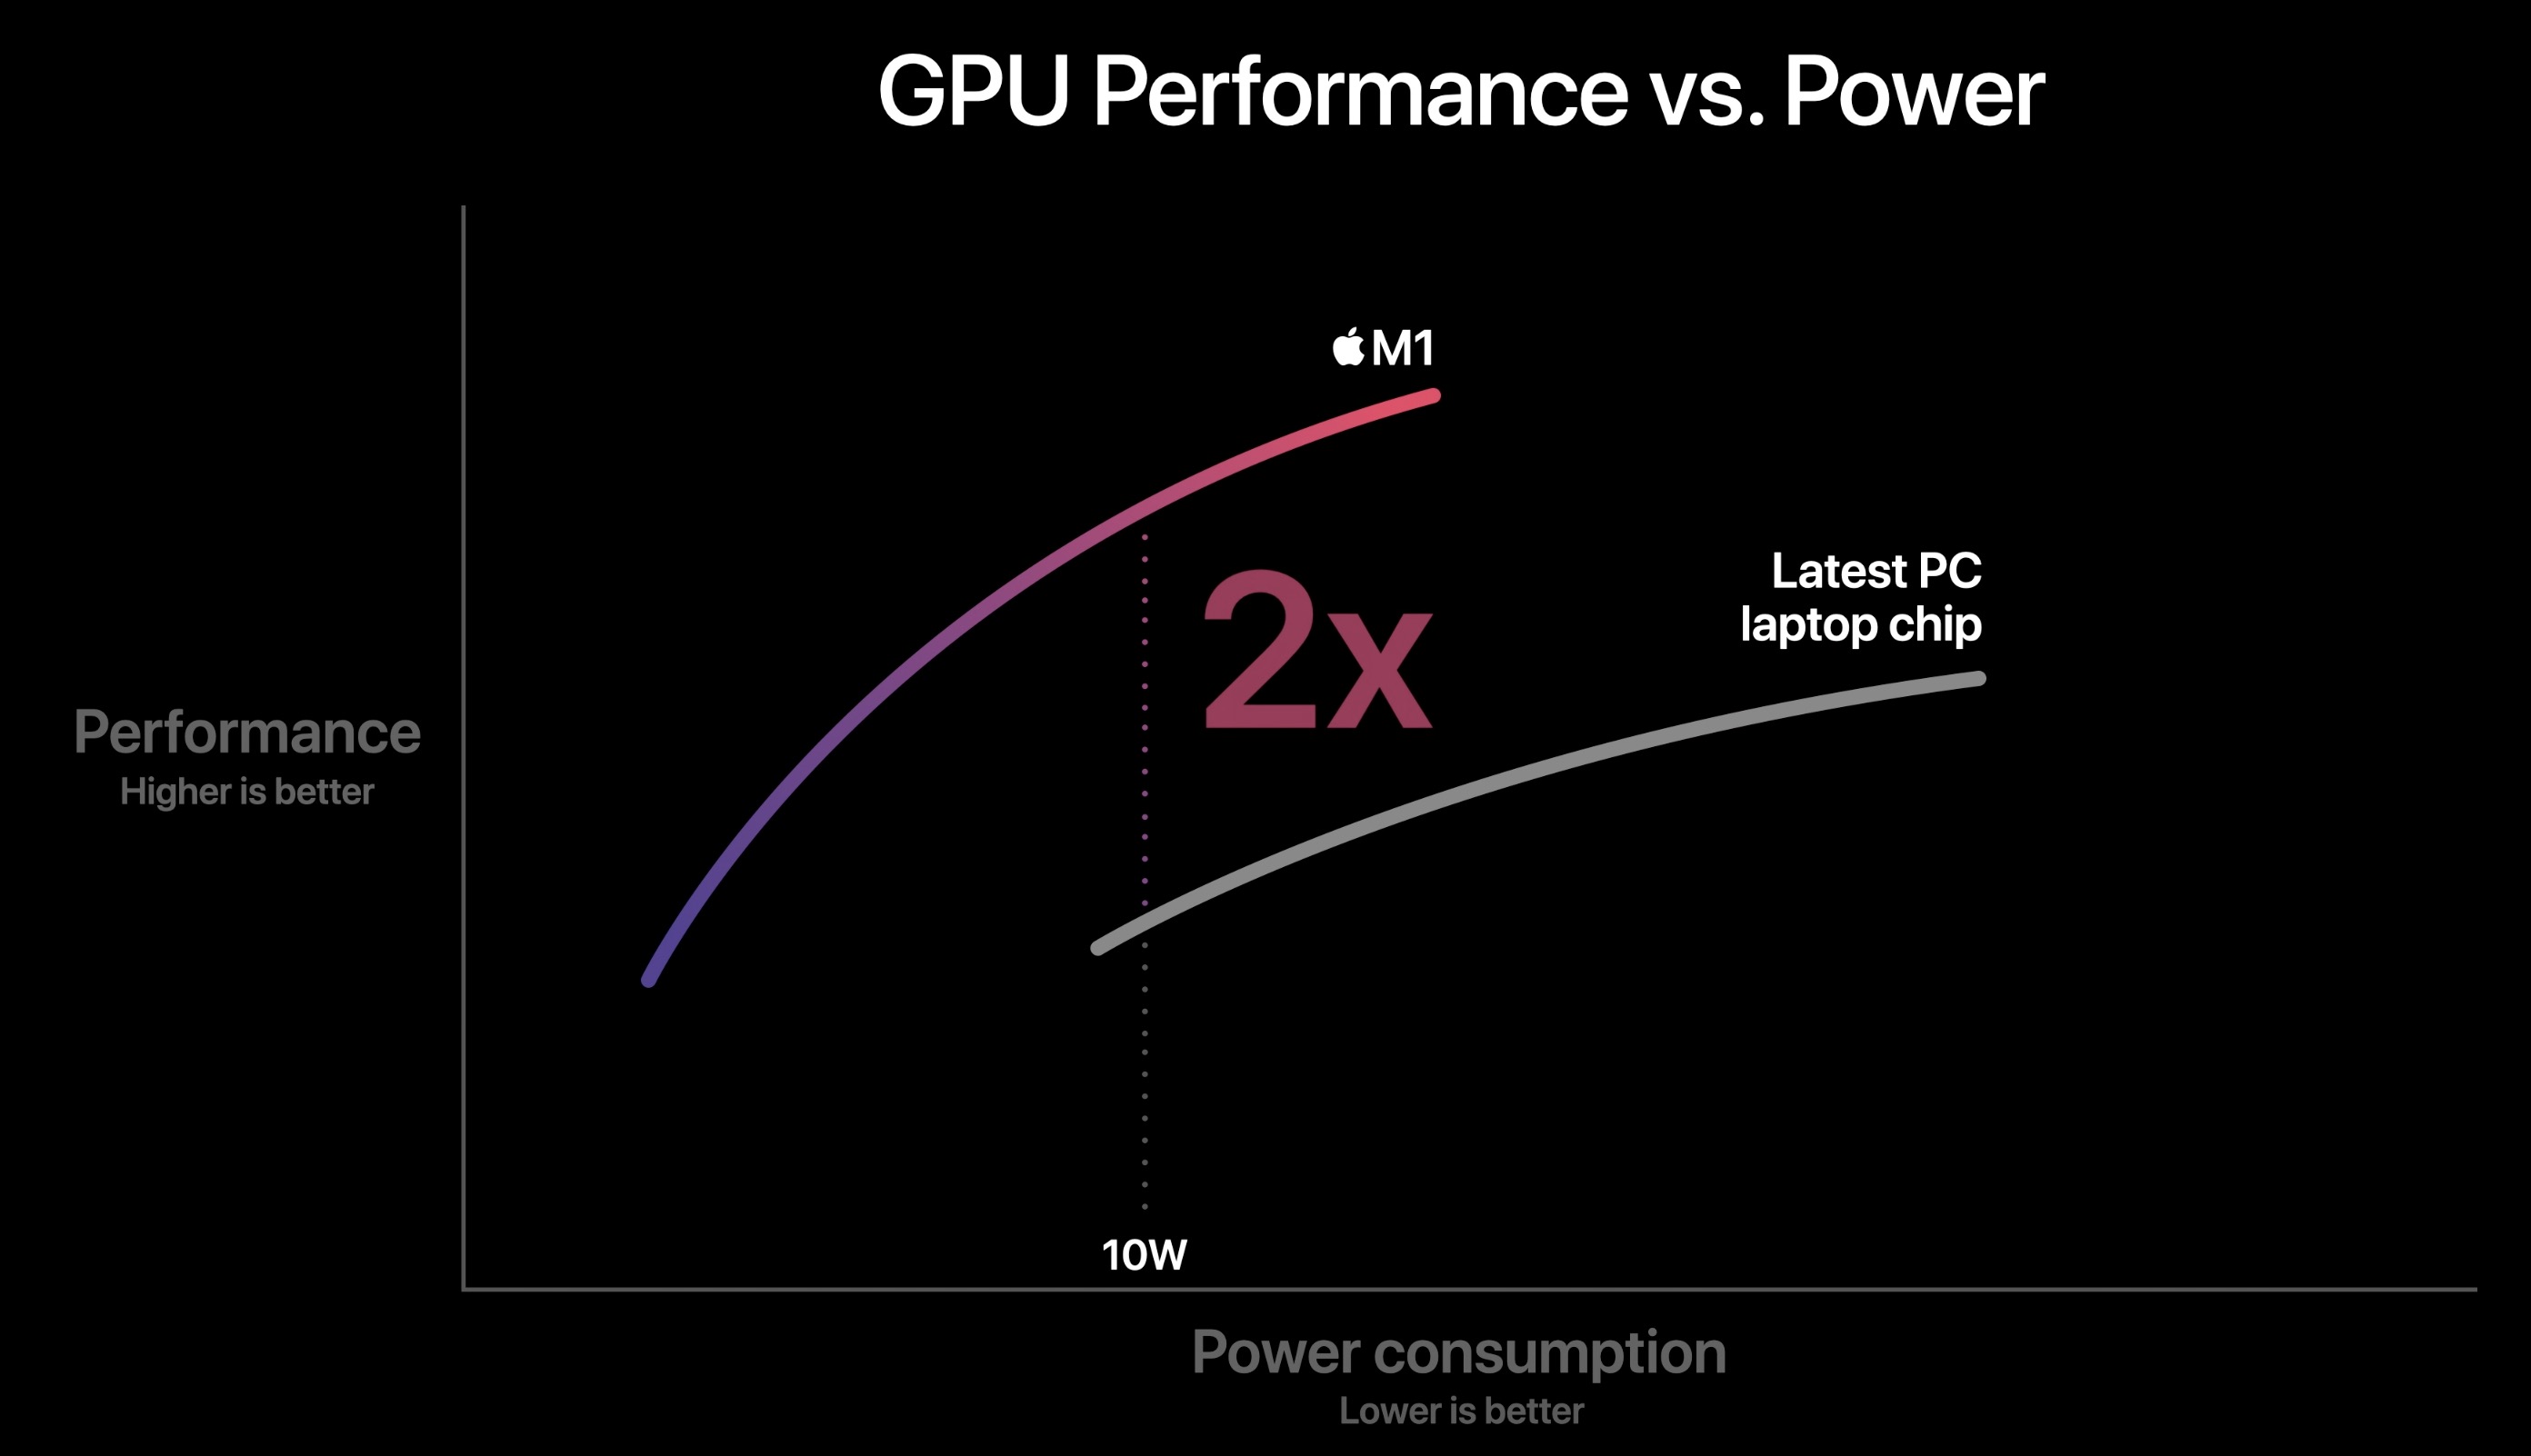
Die Apple M1 GPU ist eine selbst designte Grafikkarte im Apple M1 SoC und laut Apple mit sieben oder acht Kernen (im Einstiegs-MacBook Air sind nur 7 aktiviert). Die 8-Kern-Variante bietet 128 Ausführungseinheiten und eine theoretische Maximalleistung von 2,6 Teraflops. Laut Apple soll die GPU schneller sein als z.b. die iGPU in Tiger Lake.
Sie unterstützt Apple's Metal 2 Schnittstelle und dürfte eine ähnliche Architektur wie die älteren PowerVR Grafikeinheiten (z.B. im Apple A10) aufweisen.
Da der SoC im 5nm Prozess bei TSMC hergestellt wird, sollte die Energieeffizienz hervorragend sein. Die GPU nutzt laut internen Tools unter Last in etwa 10 Watt (11,5 Watt Package inkl. RAM).
NVIDIA GeForce RTX 3070 Max-Q
► remove from comparison
Die Nvidia GeForce RTX 3070 Max-Q (für Laptops, GN20-E5) bezeichnet eine GeForce RTX 3070 Laptop GPU mit Max-Q Technologien. Früher waren die Max-Q-Varianten die Stromsparversionen, mit der RTX 3000 Serie kann jedoch jede TGP-Variante mit Max-Q Technologien ausgestattet werden.
Apple M1 Pro 16-Core GPU
► remove from comparison
Die Apple M1 Pro 16-Core GPU ist eine von Apple selbst designte Grafikkarte im Apple M1 Pro SoC und laut Apple mit allen sechszehn Kernen (im Einstiegs-MacBook Pro 14 sind nur 14 aktiviert). Die 16-Kern-Variante bietet 2048 ALUs und eine theoretische Maximalleistung von 5,3 Teraflops. Die GPU hat keinen dedizierten Grafikspeicher aber kann auf den schnellen gemeinsamen LPDDR5-6400 Speicher (unified Memory) zugreifen.
Die GPU kann in allen M1 Pro und Max Varianten von 389 - 1296 MHz takten und bietet keinen kurzzeitlichen Turbo (389, 486, 648, 778, 972, 1296 MHz Stufen laut Powermetrics).
Sie unterstützt Apple's Metal 2 Schnittstelle und dürfte eine ähnliche Architektur wie die älteren PowerVR Grafikeinheiten (z.B. im Apple A10) aufweisen.
Da der SoC im 5nm Prozess bei TSMC hergestellt wird, sollte die Energieeffizienz hervorragend sein.
| Apple M1 8-Core GPU | NVIDIA GeForce RTX 3070 Max-Q | Apple M1 Pro 16-Core GPU | |||||||||||||||||||||||||||||||||||||||||||||||||||||||||||||||||||||||||||||||||||||||||||||||||||||||
| Apple M1 Serie |
|
|
| ||||||||||||||||||||||||||||||||||||||||||||||||||||||||||||||||||||||||||||||||||||||||||||||||||||||
| Pipelines | 8 - unified | 5120 - unified | 16 - unified | ||||||||||||||||||||||||||||||||||||||||||||||||||||||||||||||||||||||||||||||||||||||||||||||||||||||
| Kerntakt | 1278 MHz | 1290 (Boost) MHz | 1296 MHz | ||||||||||||||||||||||||||||||||||||||||||||||||||||||||||||||||||||||||||||||||||||||||||||||||||||||
| Theoretical Performance | 2.6 TFLOPS FP32 | ||||||||||||||||||||||||||||||||||||||||||||||||||||||||||||||||||||||||||||||||||||||||||||||||||||||||
| Speichertyp | LPDDR4X-4266 | GDDR6 | LPDDR5-6400 | ||||||||||||||||||||||||||||||||||||||||||||||||||||||||||||||||||||||||||||||||||||||||||||||||||||||
| Shared Memory | nein | nein | nein | ||||||||||||||||||||||||||||||||||||||||||||||||||||||||||||||||||||||||||||||||||||||||||||||||||||||
| Stromverbrauch | 10 Watt | 80 Watt | 10 Watt | ||||||||||||||||||||||||||||||||||||||||||||||||||||||||||||||||||||||||||||||||||||||||||||||||||||||
| Herstellungsprozess | 5 nm | 8 nm | 5 nm | ||||||||||||||||||||||||||||||||||||||||||||||||||||||||||||||||||||||||||||||||||||||||||||||||||||||
| Erscheinungsdatum | 10.11.2020 | 04.01.2021 | 10.11.2020 | ||||||||||||||||||||||||||||||||||||||||||||||||||||||||||||||||||||||||||||||||||||||||||||||||||||||
| Codename | GN20-E5 GA104 | ||||||||||||||||||||||||||||||||||||||||||||||||||||||||||||||||||||||||||||||||||||||||||||||||||||||||
| Architektur | Ampere | ||||||||||||||||||||||||||||||||||||||||||||||||||||||||||||||||||||||||||||||||||||||||||||||||||||||||
| Speicherbandbreite | 256 Bit | ||||||||||||||||||||||||||||||||||||||||||||||||||||||||||||||||||||||||||||||||||||||||||||||||||||||||
| Max. Speichergröße | 8 GB | ||||||||||||||||||||||||||||||||||||||||||||||||||||||||||||||||||||||||||||||||||||||||||||||||||||||||
| API | DirectX 12_2, Shader 6.7, OpenGL 4.6 | ||||||||||||||||||||||||||||||||||||||||||||||||||||||||||||||||||||||||||||||||||||||||||||||||||||||||
| Notebookgröße | groß (17" z.B.) |
|
| |||||||||||||||||
Benchmarks
Cinebench R15 OpenGL 64 Bit + Apple M1 8-Core GPU
GFXBench T-Rex HD Offscreen C24Z16 + Apple M1 8-Core GPU
Average Benchmarks Apple M1 8-Core GPU → 0% n=0
Average Benchmarks Apple M1 Pro 16-Core GPU → 0% n=0
* Smaller numbers mean a higher performance
1 This benchmark is not used for the average calculation
Spiele-Benchmarks
Die folgenden Benchmarks basieren auf unseren Spieletests mit Testnotebooks. Die Performance dieser Grafikkarte bei den gelisteten Spielen ist abhängig von der verwendeten CPU, Speicherausstattung, Treiber und auch Betriebssystem. Dadurch müssen die untenstehenden Werte nicht repräsentativ sein. Detaillierte Informationen über das verwendete System sehen Sie nach einem Klick auf den fps-Wert.

League of Legends: Wild Rift
2020
Call of Duty Mobile
2020


Borderlands 3
2019


PUBG Mobile
2018World of Tanks Blitz
2018
Civilization VI
2016
Average Gaming Apple M1 8-Core GPU → 100%
Average Gaming 30-70 fps → 100%
Average Gaming Apple M1 Pro 16-Core GPU → 170%
Average Gaming 30-70 fps → 176%
| Apple M1 8-Core GPU | low | med. | high | ultra | QHD | 4K |
|---|---|---|---|---|---|---|
| League of Legends: Wild Rift | 60 | |||||
| Call of Duty Mobile | 60 | 60 | ||||
| Genshin Impact | 60 | |||||
| Armajet | 60 | |||||
| Borderlands 3 | 48 | 29 | 20 | |||
| Total War: Three Kingdoms | 98 | 35 | 22 | 15 | ||
| Shadow of the Tomb Raider | 69 | 32 | 30 | 38 | ||
| PUBG Mobile | 39 | 40 | 42 | |||
| World of Tanks Blitz | 59 | |||||
| Rise of the Tomb Raider | 39.6 | |||||
| < 30 fps < 60 fps < 120 fps ≥ 120 fps | 2 2 | 1 2 | 2 3 2 | 1 3 3 | | |
| Apple M1 Pro 16-Core GPU | low | med. | high | ultra | QHD | 4K |
|---|---|---|---|---|---|---|
| Borderlands 3 | 56.6 | 48 | 34.8 | 26.2 | ||
| Total War: Three Kingdoms | 114 | 69.6 | 43.8 | 31.8 | ||
| Shadow of the Tomb Raider | 63 | 57 | 50 | |||
| Civilization VI | 45.5 | 45.5 | ||||
| Deus Ex Mankind Divided | 54.2 | 43.1 | ||||
| < 30 fps < 60 fps < 120 fps ≥ 120 fps | 1 1 | 1 2 | 5 | 1 4 | | |
Eine Liste mit weiteren Spielen und allen Grafikkarten finden Sie auf unserer Seite: Welches Spiel ist mit welcher Grafikkarte spielbar?