

Intel Iris Xe Graphics G7 80EUs vs NVIDIA GeForce GTX 1650 Mobile
Intel Iris Xe Graphics G7 80EUs
► remove from comparisonDie Intel Xe Graphics G7 (Tiger-Lake mit 80 EUs) ist eine Prozessorgrafikkarte, die im späteren Verlauf von 2020 vorgestellt wird. Sie basiert auf die neue Xe Architektur (Gen12) und soll eine Leistung auf dem Niveau einer GeForce MX330 bieten. Laut ersten Leaks soll die GPU fast doppelt so schnell sein wie eine Iris Plus G4 der Ice Lake Generation. Dies ist aber abhängig von TDP Settings (15 - 25 Watt Default) und Kühlung.
In unseren Benchmarks variiert die Grafikleistung je nach eingesetztem Notebook (Kühlung und TDP-Settings entscheiden). Im Durchschnitt ist die schnellere Xe Graphics G7 mit 96 EUs in den Topmodellen 22% schneller (Durchschnitt 3DMark 11, Time Spy GPU und The Witcher 3 low). Eine dedizierte GeForce MX350 kann 14% herausholen. Die MX330 ist sogar 5% langsamer, hat aber den Vorteil eines besseren Treibersupports bei Spielen. Im Vergleich zu AMD positioniert sich die 80EU Variante zwischen Vega 7 und Vega 8. Die alte UHD Graphics 620 kann deutlich abgehängt werden (-70%). Siehe Benchmarkchart am Ende der Seite.
Trotzdem reicht die Leistung nicht für manche sehr anspruchsvolle aktuelle Spiele (wie Days Gone oder Cyberpunk 2077). Weniger anspruchsvolle moderne Spiele Hitman 3 oder Star Wars Squadrons können auch in mittlerer Detailstufe gespielt werden. Weiter unten sehen sie alle von uns getesteten Spiele mit verschiedensten Notebooks.
Die Xe Graphics G4 wird im modernen 10nm+ (10nm SuperFin) Prozess bei Intel gefertigt und ist als Prozessorgrafikkarte sehr sparsam.
NVIDIA GeForce GTX 1650 Mobile
► remove from comparison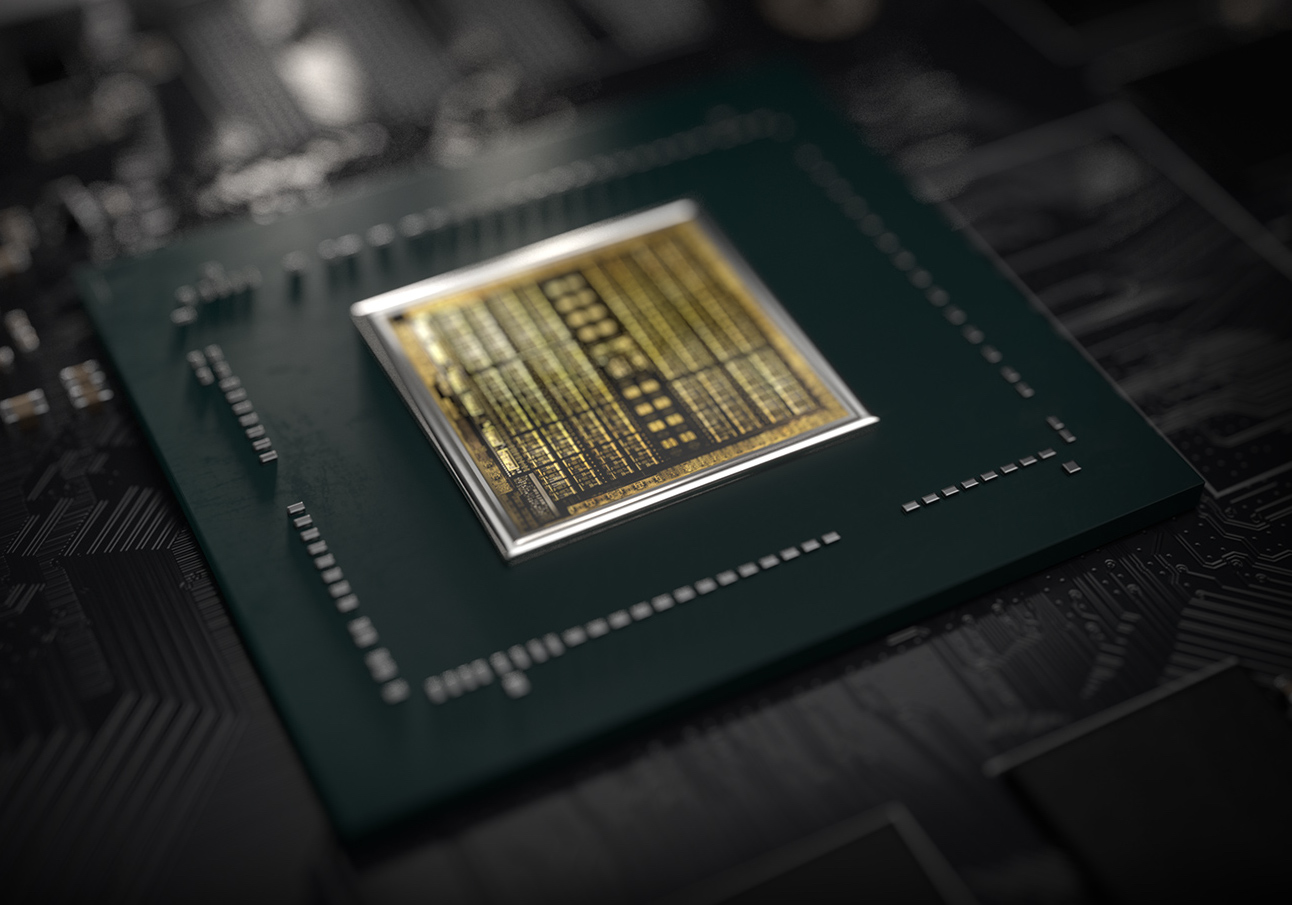
Die Nvidia GeForce GTX 1650 für Laptops ist eine mobile Grafikkarte basierend auf der Turing Architektur. Sie basiert wie die Desktop-Version auf den TU117 Chip und nutzt entweder 896 oder 1024 Shader. Die GTX 1650 Serie bietet im Unterschied zu den stärkeren RTX 2000er Karten (z.B. RTX 2060) keine Raytracing und Tensor Kerne. Die Leistung sollte etwas oberhalb einer mobilen GTX 1050 Ti sein, jedoch bei deutlich geringerem Stromverbrauch.
Mit dem Refresh im März 2020 ist auch eine GDDR6 Variante (N18P-G61, 896 Shader, max. 4 GB 12 Gbits) erhältlich.
Bei der Turing Architektur gab es auch auf der Ebene der CUDA-Kerne deutliche Verbesserungen. Float und INT Operationen können nun gleichzeitig ausgeführt werden, der Cache wurde vereinheitlicht und verbessert und Adaptive Shading eingeführt. Nvidia spricht dadurch von einer bis zu 50% höheren Leistung pro Kern im Vergleich zu Pascal.
Im Gegensatz zu den größeren Turing Chips (wie den TU116 der GTX 1660 Ti) bietet der TU117 nur die älteren NVENC Videoenkodierung der Pascal / Volta Generation.
Nvidia spezifiziert einen Stromverbrauch von 50 Watt TGP (Total Graphics Power) für die Grafikkarte und damit 15 Watt mehr als die langsamere und effizientere Max-Q Variante der GTX1650. Der TU117 Chip wird bei TSMC im 12nm FFN Verfahren gefertigt.
| Intel Iris Xe Graphics G7 80EUs | NVIDIA GeForce GTX 1650 Mobile | |||||||||||||||||||||||||||||||||||||||||||||||||||||||||||||
| GeForce GTX 1600 Serie |
|
| ||||||||||||||||||||||||||||||||||||||||||||||||||||||||||||
| Codename | Tiger Lake Xe | N18P-G0, N18P-G61 | ||||||||||||||||||||||||||||||||||||||||||||||||||||||||||||
| Architektur | Gen. 11 Ice Lake | Turing | ||||||||||||||||||||||||||||||||||||||||||||||||||||||||||||
| Pipelines | 80 - unified | 1024 - unified | ||||||||||||||||||||||||||||||||||||||||||||||||||||||||||||
| Kerntakt | 400 - 1350 (Boost) MHz | 1380 - 1560 (Boost) MHz | ||||||||||||||||||||||||||||||||||||||||||||||||||||||||||||
| Shared Memory | ja | nein | ||||||||||||||||||||||||||||||||||||||||||||||||||||||||||||
| API | DirectX 12_1, OpenGL 4.6 | DirectX 12_1, OpenGL 4.6 | ||||||||||||||||||||||||||||||||||||||||||||||||||||||||||||
| Stromverbrauch | 28 Watt | 50 Watt | ||||||||||||||||||||||||||||||||||||||||||||||||||||||||||||
| Herstellungsprozess | 10 nm | 12 nm | ||||||||||||||||||||||||||||||||||||||||||||||||||||||||||||
| Features | QuickSync | |||||||||||||||||||||||||||||||||||||||||||||||||||||||||||||
| Erscheinungsdatum | 15.08.2020 | 23.04.2019 | ||||||||||||||||||||||||||||||||||||||||||||||||||||||||||||
| TMUs | 56 | |||||||||||||||||||||||||||||||||||||||||||||||||||||||||||||
| ROPs | 32 | |||||||||||||||||||||||||||||||||||||||||||||||||||||||||||||
| Speichertakt | 12000 effective = 1500 MHz | |||||||||||||||||||||||||||||||||||||||||||||||||||||||||||||
| Speicherbandbreite | 128 Bit | |||||||||||||||||||||||||||||||||||||||||||||||||||||||||||||
| Speichertyp | GDDR5, GDDR6 | |||||||||||||||||||||||||||||||||||||||||||||||||||||||||||||
| Max. Speichergröße | 4 GB | |||||||||||||||||||||||||||||||||||||||||||||||||||||||||||||
| Memory Bandwidth | 192 GB/s | |||||||||||||||||||||||||||||||||||||||||||||||||||||||||||||
| PCIe | 4.0 | |||||||||||||||||||||||||||||||||||||||||||||||||||||||||||||
| Notebookgröße | mittel (15.4" z.B.) | |||||||||||||||||||||||||||||||||||||||||||||||||||||||||||||
| Herstellerseite | www.nvidia.com |
| |||||||||||||||||||||||||||||||||||||||||||||||||||||||||||||||||||||||||||||||||||||||||||||||||||||||||||||
Benchmarks
| GPU TDP ? | TDP 11 W | TDP 28 W |
|---|---|---|
| 88% | 100% | 100% |
| GPU TDP ? | TDP 11 W | TDP 28 W | TDP 30 W | TDP 35 W | TDP 40 W |
|---|---|---|---|---|---|
| 53% | 44% | 44% | 99% | 93% | 100% |
| GPU TDP ? | TDP 11 W | TDP 28 W |
|---|---|---|
| 86% | 98% | 100% |
| GPU TDP ? | TDP 11 W | TDP 28 W | TDP 30 W | TDP 35 W | TDP 40 W |
|---|---|---|---|---|---|
| 53% | 42% | 43% | 97% | 93% | 100% |
| GPU TDP ? | TDP 40 W |
|---|---|
| 58% | 100% |
| Modell | CPU | GPU | RAM | Wert |
|---|---|---|---|---|
| Asus TUF FX505DT-EB73 | R7 3750H | GeForce GTX 1650 Mobile 1395 / 2001 MHz 4 GB | 8 GB | 57517 |
| Asus TUF FX705DT-AU068T | R5 3550H | GeForce GTX 1650 Mobile 1560 / 2000 MHz 4 GB | 8 GB | 57698 |
| HP Omen 15-dc1020ng | i5-9300H | GeForce GTX 1650 Mobile 1560 / 2000 MHz 4 GB | 8 GB | 77920 |
| Lenovo Ideapad L340-17IRH 81LL001YGE | i5-9300H | GeForce GTX 1650 Mobile 1560 / 2000 MHz 4 GB | 16 GB | 81499 |
| MSI GF75 Thin 10SCXR | i5-10300H | GeForce GTX 1650 Mobile 1380 / 1500 MHz 4 GB | 8 GB | 83748 |
| Dell G3 3590 | i5-9300H | GeForce GTX 1650 Mobile 1395 / 2001 MHz 4 GB | 8 GB | 112518 |
| Acer Aspire 7 A715-74G-50U5 | i5-9300H | GeForce GTX 1650 Mobile 1560 / 2000 MHz 4 GB | 8 GB | 120012 |
| Lenovo IdeaPad Gaming 3i 15IMH05 | i5-10300H | GeForce GTX 1650 Mobile 1515 / 1500 MHz 4 GB | 8 GB | 141041 |
| GPU TDP ? | TDP 11 W |
|---|---|
| 88% | 100% |
| GPU TDP ? | TDP 11 W | TDP 40 W |
|---|---|---|
| 61% | 63% | 100% |
| GPU TDP ? | TDP 11 W |
|---|---|
| 71% | 100% |
| GPU TDP ? | TDP 11 W | TDP 40 W |
|---|---|---|
| 49% | 54% | 100% |
| GPU TDP ? | TDP 11 W | TDP 28 W |
|---|---|---|
| 80% | 100% | 96% |
| GPU TDP ? | TDP 11 W | TDP 28 W | TDP 30 W | TDP 35 W | TDP 40 W |
|---|---|---|---|---|---|
| 56% | 54% | 52% | 99% | 95% | 100% |
| GPU TDP ? | TDP 11 W | TDP 28 W |
|---|---|---|
| 80% | 100% | 100% |
| GPU TDP ? | TDP 11 W | TDP 28 W | TDP 30 W | TDP 35 W | TDP 40 W |
|---|---|---|---|---|---|
| 58% | 55% | 55% | 97% | 93% | 100% |
| Modell | CPU | GPU | RAM | Wert |
|---|---|---|---|---|
| Asus TUF FX705DT-AU068T | R5 3550H | GeForce GTX 1650 Mobile 1560 / 2000 MHz 4 GB | 8 GB | 60813 |
| HP Omen 15-dc1020ng | i5-9300H | GeForce GTX 1650 Mobile 1560 / 2000 MHz 4 GB | 8 GB | 78017 |
| Acer Aspire 7 A715-42G-R0XB | R5 5500U @4 GHz 46 W / 37 W | GeForce GTX 1650 Mobile 4 GB | 8 GB | 80097 |
| Lenovo Ideapad L340-17IRH 81LL001YGE | i5-9300H | GeForce GTX 1650 Mobile 1560 / 2000 MHz 4 GB | 16 GB | 81864 |
| MSI GF75 Thin 10SCXR | i5-10300H | GeForce GTX 1650 Mobile 1380 / 1500 MHz 4 GB | 8 GB | 85847 |
| Dell G5 15 5590-PCNJJ | i5-9300H | GeForce GTX 1650 Mobile 1395 / 8000 MHz 4 GB | 8 GB | 122041 |
| Acer Aspire 7 A715-74G-50U5 | i5-9300H | GeForce GTX 1650 Mobile 1560 / 2000 MHz 4 GB | 8 GB | 135492 |
| Acer Nitro 5 | i5-9300H | GeForce GTX 1650 Mobile 1395 / 8000 MHz 4 GB | 32 GB | 149698 |
| Lenovo IdeaPad Gaming 3i 15IMH05 | i5-10300H | GeForce GTX 1650 Mobile 1515 / 1500 MHz 4 GB | 8 GB | 161091 |
| Modell | CPU | GPU | RAM | Wert |
|---|---|---|---|---|
| Acer Extensa 15 EX215-54-5103 | i5-1135G7 64 W / 28 W | Iris Xe G7 80EUs 1300 MHz | 8 GB | 5244 |
| Acer TravelMate P4 TMP414-51-59MR | i5-1135G7 64 W / 28 W | Iris Xe G7 80EUs 1300 MHz | 8 GB | 5420 |
| Lenovo ThinkPad L14 G4 21H1003DGE | i5-1335U 45 W / 15 W | Iris Xe G7 80EUs | 16 GB | 6428 |
| Lenovo Yoga Slim 7 14ITL05 82A300CNGE | i5-1135G7 36 W / 25 W | Iris Xe G7 80EUs 1300 / 2000 MHz | 8 GB | 7252 |
| Lenovo IdeaPad Gaming Chromebook 16 | i5-1235U | Iris Xe G7 80EUs | 8 GB | 8289 |
| Acer TravelMate P4 TMP414-51-59MR | i5-1135G7 | Iris Xe G7 80EUs 1300 / 1200 MHz Dual-Channel | 16 GB | 9325 |
| HP Pavilion x360 14-dy0157ng | i5-1135G7 51 W / 20 W | Iris Xe G7 80EUs 1300 / 2000 MHz | 16 GB | 9925 |
| HP Pavilion x360 15-er0155ng | i5-1135G7 51 W / 20 W | Iris Xe G7 80EUs 1300 MHz | 16 GB | 9969 |
| Microsoft Surface Pro 7 Plus | i5-1135G7 60 W / 30 W | Iris Xe G7 80EUs 1300 MHz | 16 GB | 11404 |
| Modell | CPU | GPU | RAM | Wert |
|---|---|---|---|---|
| Lenovo Yoga Creator 7 15IMH05 82DS000VGE | i7-10750H 80 W / 55 W | GeForce GTX 1650 Mobile 40 W 1350 / 1250 MHz 4 GB | 16 GB | 20519 |
| GPU TDP ? | TDP 40 W |
|---|---|
| 40% | 100% |
| Modell | CPU | GPU | RAM | Wert |
|---|---|---|---|---|
| Acer Aspire 7 A715-42G-R0XB | R5 5500U @4 GHz 46 W / 37 W | GeForce GTX 1650 Mobile 4 GB | 8 GB | 27315 |
| Modell | CPU | GPU | RAM | Wert |
|---|---|---|---|---|
| Acer Aspire 7 A715-42G-R0XB | R5 5500U @4 GHz 46 W / 37 W | GeForce GTX 1650 Mobile 4 GB | 8 GB | 38744 |
| GPU TDP ? | TDP 11 W | TDP 28 W |
|---|---|---|
| 85% | 98% | 100% |
| GPU TDP ? | TDP 11 W | TDP 28 W | TDP 30 W | TDP 35 W | TDP 40 W |
|---|---|---|---|---|---|
| 57% | 53% | 55% | 100% | 90% | 99% |
| GPU TDP ? | TDP 11 W | TDP 28 W |
|---|---|---|
| 86% | 99% | 100% |
| GPU TDP ? | TDP 11 W | TDP 28 W | TDP 30 W | TDP 35 W | TDP 40 W |
|---|---|---|---|---|---|
| 59% | 52% | 52% | 100% | 95% | 100% |
3DM Vant. Perf. total + Intel Iris Xe Graphics G7 80EUs
| Modell | CPU | GPU | RAM | Wert |
|---|---|---|---|---|
| Intel NUC Pro Chassis_i5_1145G7 | i5-1145G7 64 W / 28 W | Iris Xe G7 80EUs | 8 GB | 20679 |
| Intel NUC Pro Chassis_i5_1245U | i5-1245U | Iris Xe G7 80EUs | 16 GB | 21729 |
| Minisforum Venus Series NPB5 | i5-13500H 95 W / 45 W | Iris Xe G7 80EUs 1450 MHz | 16 GB | 26656 |
| Modell | CPU | GPU | RAM | Wert |
|---|---|---|---|---|
| Asus TUF FX705DT-AU068T | R5 3550H | GeForce GTX 1650 Mobile 1560 / 2000 MHz 4 GB | 8 GB | 27719 |
| Acer Nitro 5 | i5-9300H | GeForce GTX 1650 Mobile 1395 / 8000 MHz 4 GB | 32 GB | 34902 |
| Modell | CPU | GPU | RAM | Wert |
|---|---|---|---|---|
| Intel NUC Pro Chassis_i5_1245U | i5-1245U | Iris Xe G7 80EUs | 16 GB | 18551 |
| Intel NUC Pro Chassis_i5_1145G7 | i5-1145G7 64 W / 28 W | Iris Xe G7 80EUs | 8 GB | 18628 |
| Minisforum Venus Series NPB5 | i5-13500H 95 W / 45 W | Iris Xe G7 80EUs 1450 MHz | 16 GB | 22211 |
| Modell | CPU | GPU | RAM | Wert |
|---|---|---|---|---|
| Asus TUF FX705DT-AU068T | R5 3550H | GeForce GTX 1650 Mobile 1560 / 2000 MHz 4 GB | 8 GB | 28940 |
| Acer Nitro 5 | i5-9300H | GeForce GTX 1650 Mobile 1395 / 8000 MHz 4 GB | 32 GB | 38679 |
| Modell | CPU | GPU | RAM | Wert |
|---|---|---|---|---|
| Intel NUC Pro Chassis_i5_1145G7 | i5-1145G7 64 W / 28 W | Iris Xe G7 80EUs | 8 GB | 34227 |
| Intel NUC Pro Chassis_i5_1245U | i5-1245U | Iris Xe G7 80EUs | 16 GB | 37064 |
| Minisforum Venus Series NPB5 | i5-13500H 95 W / 45 W | Iris Xe G7 80EUs 1450 MHz | 16 GB | 45907 |
| Modell | CPU | GPU | RAM | Wert |
|---|---|---|---|---|
| Asus TUF FX705DT-AU068T | R5 3550H | GeForce GTX 1650 Mobile 1560 / 2000 MHz 4 GB | 8 GB | 24001 |
| Modell | CPU | GPU | RAM | Wert | |
|---|---|---|---|---|---|
| 3DMark 06 - Standard 1280x1024 | |||||
| Dell XPS 13 9315, i5-1230U (3DMark 06 - Standard 1280x1024) | i5-1230U 29 W / 14 W | Iris Xe G7 80EUs | 8 GB | 15617 | |
| Acer Spin 3 SP313-51N-56YV (3DMark 06 - Standard 1280x1024) | i5-1135G7 64 W / 28 W | Iris Xe G7 80EUs 1300 / 2000 MHz | 16 GB | 23181 | |
| Dell Latitude 7420 JW6MH (3DMark 06 - Standard 1280x1024) | i5-1145G7 45 W / 14 W | Iris Xe G7 80EUs | 16 GB | 23871 | |
| Intel NUC Pro Chassis_i5_1145G7 (3DMark 06 - Standard 1280x1024) | i5-1145G7 64 W / 28 W | Iris Xe G7 80EUs | 8 GB | 25371 | |
| Intel NUC Pro Chassis_i5_1245U (3DMark 06 - Standard 1280x1024) | i5-1245U | Iris Xe G7 80EUs | 16 GB | 26011 | |
| Huawei MateBook 14 (2024) (3DMark 06 - Standard 1280x1024) | i5-1240P 66 W / 35 W | Iris Xe G7 80EUs 1300 / 1867 MHz | 16 GB | 26411 | |
| Samsung Galaxy Book3 Pro 16 (3DMark 06 - Standard 1280x1024) | i5-1340P 64 W / 40 W | Iris Xe G7 80EUs 1450 MHz | 8 GB | 28300 | |
| Minisforum Venus Series NPB5 (3DMark 06 - Standard 1280x1024) | i5-13500H 95 W / 45 W | Iris Xe G7 80EUs 1450 MHz | 16 GB | 34471 | |
| Modell | CPU | GPU | RAM | Wert | |
|---|---|---|---|---|---|
| 3DMark 06 - Standard 1280x1024 | |||||
| Asus TUF FX705DT-AU068T (3DMark 06 - Standard 1280x1024) | R5 3550H | GeForce GTX 1650 Mobile 1560 / 2000 MHz 4 GB | 8 GB | 23061 | |
| HP Omen 15-dc1020ng (3DMark 06 - Standard 1280x1024) | i5-9300H | GeForce GTX 1650 Mobile 1560 / 2000 MHz 4 GB | 8 GB | 32694 | |
| Acer Nitro 5 (3DMark 06 - Standard 1280x1024) | i5-9300H | GeForce GTX 1650 Mobile 1395 / 8000 MHz 4 GB | 32 GB | 34014 | |
| MSI GF75 Thin 10SCXR (3DMark 06 - Standard 1280x1024) | i5-10300H | GeForce GTX 1650 Mobile 1380 / 1500 MHz 4 GB | 8 GB | 34955 | |
| Nexoc GH5 515IG (3DMark 06 - Standard 1280x1024) | i5-10300H | GeForce GTX 1650 Mobile 1380 / 1500 MHz 4 GB | 16 GB | 36299 | |
| Acer Nitro 5 AN515-45-R05E (3DMark 06 - Standard 1280x1024) | R5 5600H | GeForce GTX 1650 Mobile 1380 / 1500 MHz 4 GB | 8 GB | 40902 | |
| Modell | CPU | GPU | RAM | Wert | |
|---|---|---|---|---|---|
| 3DMark 06 - Standard 1024x768 | |||||
Acer Nitro 5 AN517-41-R3FK  (3DMark 06 - Standard 1024x768) (3DMark 06 - Standard 1024x768) | R7 5800H | GeForce GTX 1650 Mobile 1380 / 1500 MHz 4 GB | 16 GB | 42416 | |
| Modell | CPU | GPU | RAM | Wert |
|---|---|---|---|---|
| Intel NUC Pro Chassis_i5_1145G7 | i5-1145G7 64 W / 28 W | Iris Xe G7 80EUs | 8 GB | 14.6 |
| Intel NUC Pro Chassis_i5_1245U | i5-1245U | Iris Xe G7 80EUs | 16 GB | 14.9 |
| Minisforum Venus Series NPB5 | i5-13500H 95 W / 45 W | Iris Xe G7 80EUs 1450 MHz | 16 GB | 17 |
| Microsoft Surface Pro 7 Plus | i5-1135G7 60 W / 30 W | Iris Xe G7 80EUs 1300 MHz | 16 GB | 17.4 |
| Modell | CPU | GPU | RAM | Wert |
|---|---|---|---|---|
| Asus TUF FX705DT-AU068T | R5 3550H | GeForce GTX 1650 Mobile 1560 / 2000 MHz 4 GB | 8 GB | 40.4 |
| Modell | CPU | GPU | RAM | Wert |
|---|---|---|---|---|
| Microsoft Surface Pro 7 Plus | i5-1135G7 60 W / 30 W | Iris Xe G7 80EUs 1300 MHz | 16 GB | 43.8 |
| Modell | CPU | GPU | RAM | Wert |
|---|---|---|---|---|
| Asus TUF FX705DT-AU068T | R5 3550H | GeForce GTX 1650 Mobile 1560 / 2000 MHz 4 GB | 8 GB | 100.6 |
| Modell | CPU | GPU | RAM | Wert |
|---|---|---|---|---|
| Microsoft Surface Pro 7 Plus | i5-1135G7 60 W / 30 W | Iris Xe G7 80EUs 1300 MHz | 16 GB | 57.3 |
| Modell | CPU | GPU | RAM | Wert |
|---|---|---|---|---|
| Asus TUF FX705DT-AU068T | R5 3550H | GeForce GTX 1650 Mobile 1560 / 2000 MHz 4 GB | 8 GB | 97.6 |
| Modell | CPU | GPU | RAM | Wert |
|---|---|---|---|---|
| Microsoft Surface Pro 7 Plus | i5-1135G7 60 W / 30 W | Iris Xe G7 80EUs 1300 MHz | 16 GB | 63.2 |
| Modell | CPU | GPU | RAM | Wert |
|---|---|---|---|---|
| Asus TUF FX705DT-AU068T | R5 3550H | GeForce GTX 1650 Mobile 1560 / 2000 MHz 4 GB | 8 GB | 120 |
specvp12 sw-03 + Intel Iris Xe Graphics G7 80EUs
| Modell | CPU | GPU | RAM | Wert |
|---|---|---|---|---|
| Minisforum Venus Series NPB5 | i5-13500H 95 W / 45 W | Iris Xe G7 80EUs 1450 MHz | 16 GB | 46.1 |
| Modell | CPU | GPU | RAM | Wert |
|---|---|---|---|---|
| Minisforum Venus Series NPB5 | i5-13500H 95 W / 45 W | Iris Xe G7 80EUs 1450 MHz | 16 GB | 3.81 |
| Modell | CPU | GPU | RAM | Wert |
|---|---|---|---|---|
| Minisforum Venus Series NPB5 | i5-13500H 95 W / 45 W | Iris Xe G7 80EUs 1450 MHz | 16 GB | 20.4 |
| Modell | CPU | GPU | RAM | Wert |
|---|---|---|---|---|
| Minisforum Venus Series NPB5 | i5-13500H 95 W / 45 W | Iris Xe G7 80EUs 1450 MHz | 16 GB | 8.44 |
| Modell | CPU | GPU | RAM | Wert |
|---|---|---|---|---|
| Minisforum Venus Series NPB5 | i5-13500H 95 W / 45 W | Iris Xe G7 80EUs 1450 MHz | 16 GB | 35.9 |
| Modell | CPU | GPU | RAM | Wert |
|---|---|---|---|---|
| Minisforum Venus Series NPB5 | i5-13500H 95 W / 45 W | Iris Xe G7 80EUs 1450 MHz | 16 GB | 0.35 |
| Modell | CPU | GPU | RAM | Wert |
|---|---|---|---|---|
| Minisforum Venus Series NPB5 | i5-13500H 95 W / 45 W | Iris Xe G7 80EUs 1450 MHz | 16 GB | 23.4 |
| Modell | CPU | GPU | RAM | Wert |
|---|---|---|---|---|
| Minisforum Venus Series NPB5 | i5-13500H 95 W / 45 W | Iris Xe G7 80EUs 1450 MHz | 16 GB | 31 |
| Modell | CPU | GPU | RAM | Wert |
|---|---|---|---|---|
| Minisforum Venus Series NPB5 | i5-13500H 95 W / 45 W | Iris Xe G7 80EUs 1450 MHz | 16 GB | 41.5 |
| Modell | CPU | GPU | RAM | Wert |
|---|---|---|---|---|
| Minisforum Venus Series NPB5 | i5-13500H 95 W / 45 W | Iris Xe G7 80EUs 1450 MHz | 16 GB | 56 |
| Modell | CPU | GPU | RAM | Wert |
|---|---|---|---|---|
| Acer Nitro 5 | i5-9300H | GeForce GTX 1650 Mobile 1395 / 8000 MHz 4 GB | 32 GB | 54.5 |
| Modell | CPU | GPU | RAM | Wert |
|---|---|---|---|---|
| Minisforum Venus Series NPB5 | i5-13500H 95 W / 45 W | Iris Xe G7 80EUs 1450 MHz | 16 GB | 6.83 |
| Modell | CPU | GPU | RAM | Wert |
|---|---|---|---|---|
| Acer Nitro 5 | i5-9300H | GeForce GTX 1650 Mobile 1395 / 8000 MHz 4 GB | 32 GB | 11.81 |
| Modell | CPU | GPU | RAM | Wert |
|---|---|---|---|---|
| Minisforum Venus Series NPB5 | i5-13500H 95 W / 45 W | Iris Xe G7 80EUs 1450 MHz | 16 GB | 20.4 |
| Modell | CPU | GPU | RAM | Wert |
|---|---|---|---|---|
| Acer Nitro 5 | i5-9300H | GeForce GTX 1650 Mobile 1395 / 8000 MHz 4 GB | 32 GB | 41.19 |
| Modell | CPU | GPU | RAM | Wert |
|---|---|---|---|---|
| Minisforum Venus Series NPB5 | i5-13500H 95 W / 45 W | Iris Xe G7 80EUs 1450 MHz | 16 GB | 7.92 |
| Modell | CPU | GPU | RAM | Wert |
|---|---|---|---|---|
| Acer Nitro 5 | i5-9300H | GeForce GTX 1650 Mobile 1395 / 8000 MHz 4 GB | 32 GB | 28.08 |
| Modell | CPU | GPU | RAM | Wert |
|---|---|---|---|---|
| Minisforum Venus Series NPB5 | i5-13500H 95 W / 45 W | Iris Xe G7 80EUs 1450 MHz | 16 GB | 46 |
| Modell | CPU | GPU | RAM | Wert |
|---|---|---|---|---|
| Acer Nitro 5 | i5-9300H | GeForce GTX 1650 Mobile 1395 / 8000 MHz 4 GB | 32 GB | 120.4 |
| Modell | CPU | GPU | RAM | Wert |
|---|---|---|---|---|
| Minisforum Venus Series NPB5 | i5-13500H 95 W / 45 W | Iris Xe G7 80EUs 1450 MHz | 16 GB | 2.03 |
| Modell | CPU | GPU | RAM | Wert |
|---|---|---|---|---|
| Minisforum Venus Series NPB5 | i5-13500H 95 W / 45 W | Iris Xe G7 80EUs 1450 MHz | 16 GB | 37.1 |
| Modell | CPU | GPU | RAM | Wert |
|---|---|---|---|---|
| Acer Nitro 5 | i5-9300H | GeForce GTX 1650 Mobile 1395 / 8000 MHz 4 GB | 32 GB | 85.6 |
| Modell | CPU | GPU | RAM | Wert |
|---|---|---|---|---|
| Minisforum Venus Series NPB5 | i5-13500H 95 W / 45 W | Iris Xe G7 80EUs 1450 MHz | 16 GB | 44.8 |
| Modell | CPU | GPU | RAM | Wert |
|---|---|---|---|---|
| Acer Nitro 5 | i5-9300H | GeForce GTX 1650 Mobile 1395 / 8000 MHz 4 GB | 32 GB | 61.2 |
| Modell | CPU | GPU | RAM | Wert |
|---|---|---|---|---|
| Minisforum Venus Series NPB5 | i5-13500H 95 W / 45 W | Iris Xe G7 80EUs 1450 MHz | 16 GB | 41.5 |
| Modell | CPU | GPU | RAM | Wert |
|---|---|---|---|---|
| Acer Nitro 5 | i5-9300H | GeForce GTX 1650 Mobile 1395 / 8000 MHz 4 GB | 32 GB | 103 |
| Modell | CPU | GPU | RAM | Wert |
|---|---|---|---|---|
| Minisforum Venus Series NPB5 | i5-13500H 95 W / 45 W | Iris Xe G7 80EUs 1450 MHz | 16 GB | 7.27 |
| Modell | CPU | GPU | RAM | Wert |
|---|---|---|---|---|
| Minisforum Venus Series NPB5 | i5-13500H 95 W / 45 W | Iris Xe G7 80EUs 1450 MHz | 16 GB | 6.71 |
| Modell | CPU | GPU | RAM | Wert |
|---|---|---|---|---|
| Minisforum Venus Series NPB5 | i5-13500H 95 W / 45 W | Iris Xe G7 80EUs 1450 MHz | 16 GB | 1.37 |
| Modell | CPU | GPU | RAM | Wert |
|---|---|---|---|---|
| Minisforum Venus Series NPB5 | i5-13500H 95 W / 45 W | Iris Xe G7 80EUs 1450 MHz | 16 GB | 23.6 |
| Modell | CPU | GPU | RAM | Wert |
|---|---|---|---|---|
| Minisforum Venus Series NPB5 | i5-13500H 95 W / 45 W | Iris Xe G7 80EUs 1450 MHz | 16 GB | 1.18 |
| Modell | CPU | GPU | RAM | Wert |
|---|---|---|---|---|
| Minisforum Venus Series NPB5 | i5-13500H 95 W / 45 W | Iris Xe G7 80EUs 1450 MHz | 16 GB | 13.6 |
| Modell | CPU | GPU | RAM | Wert |
|---|---|---|---|---|
| Minisforum Venus Series NPB5 | i5-13500H 95 W / 45 W | Iris Xe G7 80EUs 1450 MHz | 16 GB | 7.41 |
| Modell | CPU | GPU | RAM | Wert |
|---|---|---|---|---|
| Minisforum Venus Series NPB5 | i5-13500H 95 W / 45 W | Iris Xe G7 80EUs 1450 MHz | 16 GB | 10.1 |
| Modell | CPU | GPU | RAM | Wert |
|---|---|---|---|---|
| Samsung Galaxy Book3 15, Core i5-1335U | i5-1335U 39 W / 23 W | Iris Xe G7 80EUs 1.250 / 2128 MHz 0 GB | 16 GB | 11807 |
| Intel NUC Pro Chassis_i5_1245U | i5-1245U | Iris Xe G7 80EUs | 16 GB | 13056 |
| Intel NUC Pro Chassis_i5_1145G7 | i5-1145G7 64 W / 28 W | Iris Xe G7 80EUs | 8 GB | 13435 |
| Intel NUC10i5FNK | i5-1135G7 | Iris Xe G7 80EUs | 13678 | |
| Acer Spin 3 SP313-51N-56YV | i5-1135G7 64 W / 28 W | Iris Xe G7 80EUs 1300 / 2000 MHz | 16 GB | 13805 |
| Lenovo Yoga Slim 7i Pro 14IAP G7 | i5-1240P 64 W / 50 W | Iris Xe G7 80EUs 1300 MHz | 16 GB | 15022 |
| Minisforum Venus Series NPB5 | i5-13500H 95 W / 45 W | Iris Xe G7 80EUs 1450 MHz | 16 GB | 18652 |
| Dell XPS 13 9315, i5-1230U | i5-1230U 29 W / 14 W | Iris Xe G7 80EUs | 8 GB | 140763 |
| Modell | CPU | GPU | RAM | Wert |
|---|---|---|---|---|
| Lenovo Ideapad L340-17IRH 81LL001YGE | i5-9300H | GeForce GTX 1650 Mobile 1560 / 2000 MHz 4 GB | 16 GB | 6572 |
| HP Omen 15-dc1020ng | i5-9300H | GeForce GTX 1650 Mobile 1560 / 2000 MHz 4 GB | 8 GB | 6575 |
| Acer Aspire 7 A715-74G-50U5 | i5-9300H | GeForce GTX 1650 Mobile 1560 / 2000 MHz 4 GB | 8 GB | 6818 |
| Acer Nitro 5 AN515-45-R05E | R5 5600H | GeForce GTX 1650 Mobile 1380 / 1500 MHz 4 GB | 8 GB | 6821 |
| Asus TUF FX705DT-AU068T | R5 3550H | GeForce GTX 1650 Mobile 1560 / 2000 MHz 4 GB | 8 GB | 8016 |
| MSI GF75 Thin 10SCXR | i5-10300H | GeForce GTX 1650 Mobile 1380 / 1500 MHz 4 GB | 8 GB | 11095 |
| Acer Nitro 5 AN517-41-R3FK | R7 5800H | GeForce GTX 1650 Mobile 1380 / 1500 MHz 4 GB | 16 GB | 14363 |
| Modell | CPU | GPU | RAM | Wert |
|---|---|---|---|---|
| Samsung Galaxy Book3 Pro 360 16, i5-1340P | i5-1340P 50 W / 34 W | Iris Xe G7 80EUs | 8 GB | 44.63 |
| Intel NUC10i5FNK | i5-1135G7 | Iris Xe G7 80EUs | 55.6 | |
| Lenovo ThinkBook Plus Gen2 Core i5 | i5-1130G7 25 W / 12 W | Iris Xe G7 80EUs | 16 GB | 57.7 |
| Acer Spin 3 SP313-51N-56YV | i5-1135G7 64 W / 28 W | Iris Xe G7 80EUs 1300 / 2000 MHz | 16 GB | 59.6 |
| Dell Latitude 7420 JW6MH | i5-1145G7 45 W / 14 W | Iris Xe G7 80EUs | 16 GB | 60.6 |
| Lenovo Yoga Slim 7i Pro 14IAP G7 | i5-1240P 64 W / 50 W | Iris Xe G7 80EUs 1300 MHz | 16 GB | 68.87 |
| Intel NUC Pro Chassis_i5_1145G7 | i5-1145G7 64 W / 28 W | Iris Xe G7 80EUs | 8 GB | 69.58 |
| Samsung Galaxy Book3 15, Core i5-1335U | i5-1335U 39 W / 23 W | Iris Xe G7 80EUs 1.250 / 2128 MHz 0 GB | 16 GB | 77.06 |
| Intel NUC Pro Chassis_i5_1245U | i5-1245U | Iris Xe G7 80EUs | 16 GB | 79.07 |
| Minisforum Venus Series NPB5 | i5-13500H 95 W / 45 W | Iris Xe G7 80EUs 1450 MHz | 16 GB | 99.01 |
| Modell | CPU | GPU | RAM | Wert |
|---|---|---|---|---|
| MSI GF75 Thin 10SCXR | i5-10300H | GeForce GTX 1650 Mobile 1380 / 1500 MHz 4 GB | 8 GB | 69.6 |
| Dell XPS 15 7590 9980HK GTX 1650 | i9-9980HK | GeForce GTX 1650 Mobile 1395 / 2001 MHz 4 GB | 32 GB | 86 |
| Acer Nitro 5 AN515-45-R05E | R5 5600H | GeForce GTX 1650 Mobile 1380 / 1500 MHz 4 GB | 8 GB | 89.9 |
| Acer Nitro 5 AN517-41-R3FK | R7 5800H | GeForce GTX 1650 Mobile 1380 / 1500 MHz 4 GB | 16 GB | 94 |
Cinebench R15 OpenGL 64 Bit + Intel Iris Xe Graphics G7 80EUs
| GPU TDP ? | TDP 11 W | TDP 28 W |
|---|---|---|
| 86% | 99% | 100% |
| GPU TDP ? | TDP 11 W | TDP 28 W | TDP 30 W | TDP 35 W | TDP 40 W |
|---|---|---|---|---|---|
| 55% | 60% | 60% | 100% | 50% | 91% |
| GPU TDP ? | TDP 11 W | TDP 28 W |
|---|---|---|
| 100% | 100% | 100% |
| GPU TDP ? | TDP 11 W | TDP 28 W | TDP 30 W | TDP 35 W | TDP 40 W |
|---|---|---|---|---|---|
| 99% | 98% | 98% | 100% | 100% | 100% |
| Modell | CPU | GPU | RAM | Wert |
|---|---|---|---|---|
| HP Dragonfly Pro Chromebook | i5-1235U | Iris Xe G7 80EUs | 16 GB | 12 |
| Lenovo ThinkPad L14 G4 21H1003DGE | i5-1335U 45 W / 15 W | Iris Xe G7 80EUs DirectX 12 | 16 GB | 40.2814 |
| Modell | CPU | GPU | RAM | Wert |
|---|---|---|---|---|
| Lenovo ThinkPad L14 G4 21H1003DGE | i5-1335U 45 W / 15 W | Iris Xe G7 80EUs DirectX 12 | 16 GB | 21.7796 |
| HP Dragonfly Pro Chromebook | i5-1235U | Iris Xe G7 80EUs | 16 GB | 31 |
| Acer Spin 3 SP313-51N-56YV | i5-1135G7 64 W / 28 W | Iris Xe G7 80EUs 1300 / 2000 MHz | 16 GB | 38.68 |
| Microsoft Surface Pro 7 Plus | i5-1135G7 60 W / 30 W | Iris Xe G7 80EUs 1300 MHz Vulkan | 16 GB | 47.5 |
| Modell | CPU | GPU | RAM | Wert |
|---|---|---|---|---|
| Asus TUF FX705DT-AU068T | R5 3550H | GeForce GTX 1650 Mobile 1560 / 2000 MHz 4 GB DirectX 12 | 8 GB | 87.1 |
| Modell | CPU | GPU | RAM | Wert |
|---|---|---|---|---|
| Lenovo ThinkPad L14 G4 21H1003DGE | i5-1335U 45 W / 15 W | Iris Xe G7 80EUs DirectX 12 | 16 GB | 58.36 |
| HP Dragonfly Pro Chromebook | i5-1235U | Iris Xe G7 80EUs | 16 GB | 85 |
| Acer Spin 3 SP313-51N-56YV | i5-1135G7 64 W / 28 W | Iris Xe G7 80EUs 1300 / 2000 MHz | 16 GB | 91.4 |
| Microsoft Surface Pro 7 Plus | i5-1135G7 60 W / 30 W | Iris Xe G7 80EUs 1300 MHz Vulkan | 16 GB | 120.1 |
| Modell | CPU | GPU | RAM | Wert |
|---|---|---|---|---|
| Asus TUF FX705DT-AU068T | R5 3550H | GeForce GTX 1650 Mobile 1560 / 2000 MHz 4 GB DirectX 12 | 8 GB | 225.5 |
| Modell | CPU | GPU | RAM | Wert |
|---|---|---|---|---|
| Lenovo ThinkPad L14 G4 21H1003DGE | i5-1335U 45 W / 15 W | Iris Xe G7 80EUs | 16 GB | 57.8 |
| HP Dragonfly Pro Chromebook | i5-1235U | Iris Xe G7 80EUs | 16 GB | 79 |
| Microsoft Surface Pro 7 Plus | i5-1135G7 60 W / 30 W | Iris Xe G7 80EUs 1300 MHz | 16 GB | 91.4 |
| Modell | CPU | GPU | RAM | Wert |
|---|---|---|---|---|
| Asus TUF FX705DT-AU068T | R5 3550H | GeForce GTX 1650 Mobile 1560 / 2000 MHz 4 GB | 8 GB | 170.1 |
| Acer Nitro 5 | i5-9300H | GeForce GTX 1650 Mobile 1395 / 8000 MHz 4 GB | 32 GB | 184.1 |
| Modell | CPU | GPU | RAM | Wert |
|---|---|---|---|---|
| HP Dragonfly Pro Chromebook | i5-1235U | Iris Xe G7 80EUs | 16 GB | 69 |
| Lenovo ThinkPad L14 G4 21H1003DGE | i5-1335U 45 W / 15 W | Iris Xe G7 80EUs | 16 GB | 69.869 |
| Microsoft Surface Pro 7 Plus | i5-1135G7 60 W / 30 W | Iris Xe G7 80EUs 1300 MHz | 16 GB | 108.6 |
| Modell | CPU | GPU | RAM | Wert |
|---|---|---|---|---|
| Asus TUF FX705DT-AU068T | R5 3550H | GeForce GTX 1650 Mobile 1560 / 2000 MHz 4 GB | 8 GB | 272.9 |
| Modell | CPU | GPU | RAM | Wert |
|---|---|---|---|---|
| Lenovo ThinkPad L14 G4 21H1003DGE | i5-1335U 45 W / 15 W | Iris Xe G7 80EUs | 16 GB | 101.533 |
| HP Dragonfly Pro Chromebook | i5-1235U | Iris Xe G7 80EUs | 16 GB | 148 |
| Microsoft Surface Pro 7 Plus | i5-1135G7 60 W / 30 W | Iris Xe G7 80EUs 1300 MHz | 16 GB | 170.4 |
| Modell | CPU | GPU | RAM | Wert |
|---|---|---|---|---|
| Asus TUF FX705DT-AU068T | R5 3550H | GeForce GTX 1650 Mobile 1560 / 2000 MHz 4 GB | 8 GB | 331 |
GFXBench T-Rex HD Offscreen C24Z16 + Intel Iris Xe Graphics G7 80EUs
| Modell | CPU | GPU | RAM | Wert |
|---|---|---|---|---|
| Lenovo ThinkPad L14 G4 21H1003DGE | i5-1335U 45 W / 15 W | Iris Xe G7 80EUs | 16 GB | 219.558 |
| HP Dragonfly Pro Chromebook | i5-1235U | Iris Xe G7 80EUs | 16 GB | 253 |
| Microsoft Surface Pro 7 Plus | i5-1135G7 60 W / 30 W | Iris Xe G7 80EUs 1300 MHz | 16 GB | 256.9 |
| Modell | CPU | GPU | RAM | Wert |
|---|---|---|---|---|
| Asus TUF FX705DT-AU068T | R5 3550H | GeForce GTX 1650 Mobile 1560 / 2000 MHz 4 GB | 8 GB | 775 |
| Modell | CPU | GPU | RAM | Wert |
|---|---|---|---|---|
| Dell Latitude 7230 Rugged Extreme | i5-1240U 30 W / 28 W | Iris Xe G7 80EUs 900 / 2600 MHz bc7 | 16 GB | 3.64 |
| Dell Latitude 3440 | i5-1345U 32 W / 18 W | Iris Xe G7 80EUs 1200 MHz bc7 | 16 GB | 3.64 |
| Lenovo IdeaPad Flex 5 14IRU8 | i5-1335U 51 W / 15 W | Iris Xe G7 80EUs 1250 / 2133 MHz bc7 | 16 GB | 3.64 |
| Durabook R8 Tablet | i5-1230U 15 W / 7 W | Iris Xe G7 80EUs bc7 | 8 GB | 3.64 |
| Dell Latitude 7440 | i5-1345U 46 W / 25 W | Iris Xe G7 80EUs 1250 / 2400 MHz bc7 | 16 GB | 3.64 |
| Minisforum Venus Series NPB5 | i5-13500H 95 W / 45 W | Iris Xe G7 80EUs 1450 MHz bc7 | 16 GB | 3.64 |
| Lenovo ThinkPad E16 G1 Core i5-1335U | i5-1335U 51 W / 28 W | Iris Xe G7 80EUs 1250 / 1600 MHz bc7 | 16 GB | 3.64 |
| Getac S410 G5 | i5-1350P 54 W / 29 W | Iris Xe G7 80EUs 1500 / 2400 MHz bc7 | 32 GB | 3.64 |
| Lenovo IdeaPad Slim 3i 15IRU9 | Core 5 120U 50 W / 20 W | Iris Xe G7 80EUs 1100 / 2600 MHz bc7 | 16 GB | 3.64 |
| Modell | CPU | GPU | RAM | Wert |
|---|---|---|---|---|
| Intel NUC10i5FNK | i5-1135G7 | Iris Xe G7 80EUs | 286 | |
| Microsoft Surface Pro 7 Plus | i5-1135G7 60 W / 30 W | Iris Xe G7 80EUs 1300 MHz | 16 GB | 692 |
| Intel NUC Pro Chassis_i5_1145G7 | i5-1145G7 64 W / 28 W | Iris Xe G7 80EUs | 8 GB | 765 |
| Intel NUC Pro Chassis_i5_1245U | i5-1245U | Iris Xe G7 80EUs | 16 GB | 824 |
| Modell | CPU | GPU | RAM | Wert |
|---|---|---|---|---|
| Asus TUF FX705DT-AU068T | R5 3550H | GeForce GTX 1650 Mobile 1560 / 2000 MHz 4 GB | 8 GB | 1294 |
| Acer Nitro 5 | i5-9300H | GeForce GTX 1650 Mobile 1395 / 8000 MHz 4 GB | 32 GB | 1663 |
| Modell | CPU | GPU | RAM | Wert |
|---|---|---|---|---|
| Intel NUC10i5FNK | i5-1135G7 | Iris Xe G7 80EUs | 1176 | |
| Intel NUC Pro Chassis_i5_1145G7 | i5-1145G7 64 W / 28 W | Iris Xe G7 80EUs | 8 GB | 2049 |
| Intel NUC Pro Chassis_i5_1245U | i5-1245U | Iris Xe G7 80EUs | 16 GB | 2099 |
| Microsoft Surface Pro 7 Plus | i5-1135G7 60 W / 30 W | Iris Xe G7 80EUs 1300 MHz | 16 GB | 2194 |
| Modell | CPU | GPU | RAM | Wert |
|---|---|---|---|---|
| Asus TUF FX705DT-AU068T | R5 3550H | GeForce GTX 1650 Mobile 1560 / 2000 MHz 4 GB | 8 GB | 2474 |
| Acer Nitro 5 | i5-9300H | GeForce GTX 1650 Mobile 1395 / 8000 MHz 4 GB | 32 GB | 3271 |
| Modell | CPU | GPU | RAM | Wert |
|---|---|---|---|---|
| Dell XPS 13 9315, i5-1230U | i5-1230U 29 W / 14 W | Iris Xe G7 80EUs | 8 GB | 2101 |
| Intel NUC10i5FNK | i5-1135G7 | Iris Xe G7 80EUs | 2634 | |
| Intel NUC Pro Chassis_i5_1245U | i5-1245U | Iris Xe G7 80EUs | 16 GB | 2803 |
| Intel NUC Pro Chassis_i5_1145G7 | i5-1145G7 64 W / 28 W | Iris Xe G7 80EUs | 8 GB | 2857 |
| Microsoft Surface Pro 7 Plus | i5-1135G7 60 W / 30 W | Iris Xe G7 80EUs 1300 MHz | 16 GB | 2950 |
| Minisforum Venus Series NPB5 | i5-13500H 95 W / 45 W | Iris Xe G7 80EUs 1450 MHz | 16 GB | 3152 |
| Samsung Galaxy Book3 Pro 360 16, i5-1340P | i5-1340P 50 W / 34 W | Iris Xe G7 80EUs | 8 GB | 3208 |
| Acer Spin 3 SP313-51N-56YV | i5-1135G7 64 W / 28 W | Iris Xe G7 80EUs 1300 / 2000 MHz | 16 GB | 3267 |
| Modell | CPU | GPU | RAM | Wert |
|---|---|---|---|---|
| Acer Nitro 5 | i5-9300H | GeForce GTX 1650 Mobile 1395 / 8000 MHz 4 GB | 32 GB | 6891 |
| Asus TUF FX705DT-AU068T | R5 3550H | GeForce GTX 1650 Mobile 1560 / 2000 MHz 4 GB | 8 GB | 6971 |
| GPU TDP ? | TDP 11 W | TDP 28 W |
|---|---|---|
| 100% | 100% | 100% |
| Modell | CPU | GPU | RAM | Wert |
|---|---|---|---|---|
| Acer Swift X SFX14-41G-R7F3 | R5 5500U 48 W / 37 W | GeForce GTX 1650 Mobile 35 W 1155 / 1250 MHz 4 GB | 16 GB | 52.5 |
| Lenovo IdeaPad 5 Pro 16ACH | R7 5800H 57 W / 35 W | GeForce GTX 1650 Mobile 30 W 1155 / 1250 MHz 4 GB | 16 GB | 56.8 |
| Acer Aspire 7 A715-42G-R0XB | R5 5500U @4 GHz 46 W / 37 W | GeForce GTX 1650 Mobile 4 GB | 8 GB | 69.5 |
| Lenovo Yoga Creator 7 15IMH05 82DS000VGE | i7-10750H 80 W / 55 W | GeForce GTX 1650 Mobile 40 W 1350 / 1250 MHz 4 GB | 16 GB | 91 |
| Acer Nitro 5 AN515-45-R05E | R5 5600H | GeForce GTX 1650 Mobile 1380 / 1500 MHz 4 GB | 8 GB | 94.1 |
| Lenovo IdeaPad Gaming 3i 15IMH05 | i5-10300H | GeForce GTX 1650 Mobile 1515 / 1500 MHz 4 GB | 8 GB | 95 |
| Acer Nitro 5 AN517-41-R3FK | R7 5800H | GeForce GTX 1650 Mobile 1380 / 1500 MHz 4 GB | 16 GB | 100 |
| GPU TDP ? | TDP 11 W | TDP 28 W | TDP 30 W | TDP 35 W | TDP 40 W |
|---|---|---|---|---|---|
| 109% | 109% | 110% | 106% | 106% | 100% |
| GPU TDP ? | TDP 28 W |
|---|---|
| 100% | 100% |
| Modell | CPU | GPU | RAM | Wert |
|---|---|---|---|---|
| Lenovo IdeaPad 5 Pro 16ACH | R7 5800H 57 W / 35 W | GeForce GTX 1650 Mobile 30 W 1155 / 1250 MHz 4 GB | 16 GB | 55.9 |
| Acer Aspire 7 A715-42G-R0XB | R5 5500U @4 GHz 46 W / 37 W | GeForce GTX 1650 Mobile 4 GB | 8 GB | 70.7 |
| Lenovo Yoga Creator 7 15IMH05 82DS000VGE | i7-10750H 80 W / 55 W | GeForce GTX 1650 Mobile 40 W 1350 / 1250 MHz 4 GB | 16 GB | 84.1 |
| Acer Nitro 5 AN515-45-R05E | R5 5600H | GeForce GTX 1650 Mobile 1380 / 1500 MHz 4 GB | 8 GB | 87.4 |
| Lenovo IdeaPad Gaming 3i 15IMH05 | i5-10300H | GeForce GTX 1650 Mobile 1515 / 1500 MHz 4 GB | 8 GB | 93.7 |
| Acer Nitro 5 AN517-41-R3FK | R7 5800H | GeForce GTX 1650 Mobile 1380 / 1500 MHz 4 GB | 16 GB | 94.3 |
| GPU TDP ? | TDP 28 W | TDP 30 W | TDP 40 W |
|---|---|---|---|
| 108% | 109% | 104% | 100% |
| GPU TDP ? | TDP 11 W | TDP 28 W |
|---|---|---|
| 100% | 100% | 102% |
| GPU TDP ? | TDP 11 W | TDP 28 W | TDP 30 W | TDP 35 W | TDP 40 W |
|---|---|---|---|---|---|
| 114% | 116% | 118% | 100% | 110% | 105% |
| GPU TDP ? | TDP 11 W | TDP 28 W |
|---|---|---|
| 73% | 87% | 100% |
| GPU TDP ? | TDP 11 W | TDP 28 W | TDP 30 W | TDP 35 W | TDP 40 W |
|---|---|---|---|---|---|
| 64% | 70% | 80% | 66% | 100% | 90% |
| GPU TDP ? | TDP 28 W |
|---|---|
| 84% | 100% |
| Modell | CPU | GPU | RAM | Wert |
|---|---|---|---|---|
| Lenovo IdeaPad Gaming 3i 15IMH05 | i5-10300H | GeForce GTX 1650 Mobile 1515 / 1500 MHz 4 GB | 8 GB | 0.3991 |
| Acer Nitro 5 AN517-41-R3FK | R7 5800H | GeForce GTX 1650 Mobile 1380 / 1500 MHz 4 GB | 16 GB | 0.4136 |
| Lenovo Yoga Creator 7 15IMH05 82DS000VGE | i7-10750H 80 W / 55 W | GeForce GTX 1650 Mobile 40 W 1350 / 1250 MHz 4 GB | 16 GB | 0.4197 |
| Acer Nitro 5 AN515-45-R05E | R5 5600H | GeForce GTX 1650 Mobile 1380 / 1500 MHz 4 GB | 8 GB | 0.4302 |
| Acer Aspire 7 A715-42G-R0XB | R5 5500U @4 GHz 46 W / 37 W | GeForce GTX 1650 Mobile 4 GB | 8 GB | 0.549 |
| Lenovo IdeaPad 5 Pro 16ACH | R7 5800H 57 W / 35 W | GeForce GTX 1650 Mobile 30 W 1155 / 1250 MHz 4 GB | 16 GB | 0.585 |
| GPU TDP ? | TDP 28 W | TDP 30 W | TDP 40 W |
|---|---|---|---|
| 60% | 70% | 100% | 72% |
| Modell | CPU | GPU | RAM | Wert |
|---|---|---|---|---|
| Lenovo IdeaPad Slim 3i 15IRU9 | Core 5 120U 50 W / 20 W | Iris Xe G7 80EUs 1100 / 2600 MHz | 16 GB | 39.4 |
| Modell | CPU | GPU | RAM | Wert |
|---|---|---|---|---|
| Lenovo IdeaPad Slim 3i 15IRU9 | Core 5 120U 50 W / 20 W | Iris Xe G7 80EUs 1100 / 2600 MHz | 16 GB | 36.2 |
| GPU TDP ? | TDP 11 W | TDP 28 W |
|---|---|---|
| 84% | 100% | 79% |
| GPU TDP ? | TDP 11 W | TDP 28 W | TDP 30 W | TDP 40 W |
|---|---|---|---|---|
| 77% | 86% | 68% | 100% | 85% |
| Modell | CPU | GPU | RAM | Wert |
|---|---|---|---|---|
| Acer Spin 3 SP313-51N-56YV | i5-1135G7 64 W / 28 W | Iris Xe G7 80EUs 1300 / 2000 MHz | 16 GB | 1250 |
| HP Envy 14-eb0252ng | i5-1135G7 64 W / 45 W | Iris Xe G7 80EUs 1300 / 2000 MHz | 8 GB | 1300 |
| Lenovo IdeaPad 5 Pro 14ITL6 | i5-1135G7 64 W / 35 W | Iris Xe G7 80EUs 1300 / 1200 MHz | 16 GB | 1300 |
| Modell | CPU | GPU | RAM | Wert |
|---|---|---|---|---|
| Lenovo IdeaPad Gaming 3i 15IMH05 | i5-10300H | GeForce GTX 1650 Mobile 1515 / 1500 MHz 4 GB | 8 GB | 1570 |
| Dell G5 15 5590-PCNJJ | i5-9300H | GeForce GTX 1650 Mobile 1395 / 8000 MHz 4 GB | 8 GB | 1635 |
| Acer Aspire Nitro 5 AN515-54-53Z2 | i5-9300H | GeForce GTX 1650 Mobile 1395 / 8000 MHz 4 GB | 8 GB | 1650 |
| Nexoc GH5 515IG | i5-10300H | GeForce GTX 1650 Mobile 1380 / 1500 MHz 4 GB | 16 GB | 1650 |
| Lenovo Legion 5 17IMH05 | i5-10300H | GeForce GTX 1650 Mobile 1515 / 1500 MHz 4 GB | 8 GB | 1680 |
| HP Pavilion Gaming 15-ec1206ng | R5 4600H | GeForce GTX 1650 Mobile 1515 / 1500 MHz 4 GB | 8 GB | 1710 |
| SCHENKER XMG Core 14 | i5-1135G7 60 W / 15 W | GeForce GTX 1650 Mobile 1380 / 1500 MHz 4 GB | 16 GB | 1740 |
| Acer Nitro 5 AN517-41-R3FK | R7 5800H | GeForce GTX 1650 Mobile 1380 / 1500 MHz 4 GB | 16 GB | 1763 |
| Acer Nitro 5 AN515-45-R05E | R5 5600H | GeForce GTX 1650 Mobile 1380 / 1500 MHz 4 GB | 8 GB | 1770 |
| Modell | CPU | GPU | RAM | Wert |
|---|---|---|---|---|
| Lenovo ThinkBook 13s-ITL-20V90003GE | i5-1135G7 35 W / 20 W | Iris Xe G7 80EUs 11 W 1300 / 1600 MHz | 8 GB | 896 |
| Acer Aspire 5 A515-56-511A | i5-1135G7 64 W / 28 W | Iris Xe G7 80EUs | 16 GB | 1035 |
| Intel NUC 12 Pro Kit NUC12WSBi5 | i5-1240P 62 W / 40 W | Iris Xe G7 80EUs 1300 / 1600 MHz | 16 GB | 1294.9 |
| Acer Spin 3 SP313-51N-56YV | i5-1135G7 64 W / 28 W | Iris Xe G7 80EUs 1300 / 2000 MHz | 16 GB | 1300 |
| GPU TDP ? | TDP 11 W |
|---|---|
| 100% | 74% |
| Modell | CPU | GPU | RAM | Wert |
|---|---|---|---|---|
| Acer Nitro 5 AN517-41-R3FK | R7 5800H | GeForce GTX 1650 Mobile 1380 / 1500 MHz 4 GB | 16 GB | 713 |
| Lenovo IdeaPad Gaming 3i 15IMH05 | i5-10300H | GeForce GTX 1650 Mobile 1515 / 1500 MHz 4 GB | 8 GB | 1273 |
| Acer Nitro 5 AN515-45-R05E | R5 5600H | GeForce GTX 1650 Mobile 1380 / 1500 MHz 4 GB | 8 GB | 1689 |
| GPU TDP ? | TDP 11 W |
|---|---|
| 100% | 74% |
Average Benchmarks Intel Iris Xe Graphics G7 80EUs → 100% n=45
Average Benchmarks NVIDIA GeForce GTX 1650 Mobile → 200% n=45
* Smaller numbers mean a higher performance
1 This benchmark is not used for the average calculation
Spiele-Benchmarks
Die folgenden Benchmarks basieren auf unseren Spieletests mit Testnotebooks. Die Performance dieser Grafikkarte bei den gelisteten Spielen ist abhängig von der verwendeten CPU, Speicherausstattung, Treiber und auch Betriebssystem. Dadurch müssen die untenstehenden Werte nicht repräsentativ sein. Detaillierte Informationen über das verwendete System sehen Sie nach einem Klick auf den fps-Wert.

Last Epoch
2024Intel Core i5-11300H 3.1GHz
Iris Xe G7 80EUs
min: 7.44 fps, P0.1: 9.1 fps, P1: 16.3 fps, max: 31.1 fps
Intel Core i5-11300H 3.1GHz
Iris Xe G7 80EUs
min: 6.69 fps, P0.1: 7.16 fps, P1: 14.1 fps, max: 51.3 fps
Intel Core i5-11300H 3.1GHz
Iris Xe G7 80EUs
min: 1.186 fps, P0.1: 1.451 fps, P1: 11.3 fps, max: 31.4 fps

Helldivers 2
2024Intel Core i5-11300H 3.1GHz
Iris Xe G7 80EUs
min: 13.4 fps, P0.1: 13.4 fps, P1: 13.6 fps, max: 18.2 fps
Intel Core i5-11300H 3.1GHz
Iris Xe G7 80EUs
min: 1.926 fps, P0.1: 3.39 fps, P1: 9.4 fps, max: 37.8 fps

Enshrouded
2024Intel Core i5-11400H 2.7GHz
GeForce GTX 1650 Mobile
min: 17.2 fps, P0.1: 17.4 fps, P1: 18 fps, max: 44.1 fps
Intel Core i5-11400H 2.7GHz
GeForce GTX 1650 Mobile
min: 16 fps, P0.1: 16.1 fps, P1: 16.7 fps, max: 40.5 fps
Intel Core i5-11400H 2.7GHz
GeForce GTX 1650 Mobile
min: 9.45 fps, P0.1: 9.46 fps, P1: 9.59 fps, max: 28.3 fps

Palworld
2024Intel Core i5-11300H 3.1GHz
Iris Xe G7 80EUs
min: 6.22 fps, P0.1: 7.21 fps, P1: 10.1 fps, max: 57 fps
Intel Core i5-11400H 2.7GHz
GeForce GTX 1650 Mobile
min: 6.87 fps, P0.1: 24.1 fps, P1: 41.6 fps, max: 96.8 fps
Intel Core i5-11300H 3.1GHz
Iris Xe G7 80EUs
min: 3.54 fps, P0.1: 3.83 fps, P1: 7.07 fps, max: 51.9 fps
Intel Core i5-11400H 2.7GHz
GeForce GTX 1650 Mobile
min: 18.4 fps, P0.1: 24 fps, P1: 35.6 fps, max: 100.8 fps
Intel Core i5-11400H 2.7GHz
GeForce GTX 1650 Mobile
min: 14.4 fps, P0.1: 23.7 fps, P1: 27.3 fps, max: 68.3 fps

Intel Core i5-11300H 3.1GHz
Iris Xe G7 80EUs
min: 9.1 fps, P0.1: 10.2 fps, P1: 33.5 fps, max: 93 fps
Intel Core i5-11400H 2.7GHz
GeForce GTX 1650 Mobile
min: 15.6 fps, P0.1: 100.8 fps, P1: 183.1 fps, max: 468 fps
Intel Core i5-11300H 3.1GHz
Iris Xe G7 80EUs
min: 8.8 fps, P0.1: 11.3 fps, P1: 36 fps, max: 108.8 fps
Intel Core i5-11400H 2.7GHz
GeForce GTX 1650 Mobile
min: 14.9 fps, P0.1: 99.1 fps, P1: 149.9 fps, max: 361 fps

Ready or Not
2023Intel Core i5-11300H 3.1GHz
Iris Xe G7 80EUs
min: 3.94 fps, P0.1: 4.65 fps, P1: 15.9 fps, max: 33.5 fps
Intel Core i5-11400H 2.7GHz
GeForce GTX 1650 Mobile
min: 23.2 fps, P0.1: 28.8 fps, P1: 47.1 fps, max: 137.3 fps
Intel Core i5-11300H 3.1GHz
Iris Xe G7 80EUs
min: 6.79 fps, P0.1: 8.47 fps, P1: 12.3 fps, max: 37.6 fps
Intel Core i5-11400H 2.7GHz
GeForce GTX 1650 Mobile
min: 11.6 fps, P0.1: 21.1 fps, P1: 33.4 fps, max: 127.5 fps
Intel Core i5-11300H 3.1GHz
Iris Xe G7 80EUs
min: 8.45 fps, P0.1: 8.61 fps, P1: 10.9 fps, max: 44.5 fps
Intel Core i5-11400H 2.7GHz
GeForce GTX 1650 Mobile
min: 19.2 fps, P0.1: 19.6 fps, P1: 28.3 fps, max: 114.5 fps

The Finals
2023Intel Core i5-11300H 3.1GHz
Iris Xe G7 80EUs
min: 18.8 fps, P0.1: 18.9 fps, P1: 20.1 fps, max: 41.7 fps
Intel Core i5-11400H 2.7GHz
GeForce GTX 1650 Mobile
min: 62.4 fps, P0.1: 64 fps, P1: 70.3 fps, max: 149.6 fps
Intel Core i5-11300H 3.1GHz
Iris Xe G7 80EUs
min: 4.01 fps, P0.1: 4.27 fps, P1: 12.6 fps, max: 54.8 fps
Intel Core i5-11400H 2.7GHz
GeForce GTX 1650 Mobile
min: 39.8 fps, P0.1: 48.2 fps, P1: 51.4 fps, max: 104.5 fps
Intel Core i5-11300H 3.1GHz
Iris Xe G7 80EUs
min: 11.5 fps, P0.1: 11.9 fps, P1: 13.9 fps, max: 24.2 fps
Intel Core i5-11400H 2.7GHz
GeForce GTX 1650 Mobile
min: 38.2 fps, P0.1: 39.3 fps, P1: 44.7 fps, max: 86.5 fps

Intel Core i5-11400H 2.7GHz
GeForce GTX 1650 Mobile
min: 10 fps, max: 28 fps
Intel Core i5-11400H 2.7GHz
GeForce GTX 1650 Mobile
min: 8 fps, max: 26 fps

Intel Core i5-11400H 2.7GHz
GeForce GTX 1650 Mobile
min: 40 fps
Intel Core i5-11400H 2.7GHz
GeForce GTX 1650 Mobile
min: 37 fps
Intel Core i5-11400H 2.7GHz
GeForce GTX 1650 Mobile
min: 26 fps

EA Sports WRC
2023Intel Core i5-11300H 3.1GHz
Iris Xe G7 80EUs
min: 3.81 fps, P0.1: 6.22 fps, P1: 7.08 fps, max: 77.6 fps
Intel Core i5-11400H 2.7GHz
GeForce GTX 1650 Mobile
min: 6.47 fps, P0.1: 8.92 fps, P1: 28.4 fps, max: 155.5 fps
Intel Core i5-11400H 2.7GHz
GeForce GTX 1650 Mobile
min: 4.35 fps, P0.1: 15.1 fps, P1: 34.9 fps, max: 89.5 fps
Intel Core i5-11400H 2.7GHz
GeForce GTX 1650 Mobile
min: 9.41 fps, P0.1: 14.1 fps, P1: 22.1 fps, max: 69.7 fps

Alan Wake 2
2023Intel Core i5-11400H 2.7GHz
GeForce GTX 1650 Mobile
min: 19.1 fps, P0.1: 19.2 fps, P1: 20.3 fps, max: 28.9 fps
Intel Core i5-11400H 2.7GHz
GeForce GTX 1650 Mobile
min: 17 fps, P0.1: 17.1 fps, P1: 18.7 fps, max: 27 fps

Lords of the Fallen
2023Intel Core i5-11400H 2.7GHz
GeForce GTX 1650 Mobile
min: 16.4 fps, P0.1: 17.6 fps, P1: 24.1 fps, max: 74.2 fps
Intel Core i5-11400H 2.7GHz
GeForce GTX 1650 Mobile
min: 19.1 fps, P0.1: 19.7 fps, P1: 21 fps, max: 34.8 fps
Intel Core i5-11400H 2.7GHz
GeForce GTX 1650 Mobile
min: 10.7 fps, P0.1: 11.9 fps, P1: 15.6 fps, max: 37.6 fps

Total War Pharaoh
2023
Intel Core i5-1335U 0.9GHz
Iris Xe G7 80EUs
min: 1 fps, P0.1: 1 fps, P1: 2 fps, max: 71 fps
Intel Core i5-11400H 2.7GHz
GeForce GTX 1650 Mobile
min: 30 fps, max: 63 fps
Intel Core i5-1335U 0.9GHz
Iris Xe G7 80EUs
min: 2 fps, P0.1: 2 fps, P1: 4 fps, max: 67 fps
Intel Core i5-11400H 2.7GHz
GeForce GTX 1650 Mobile
min: 26 fps, max: 83 fps
Intel Core i5-11400H 2.7GHz
GeForce GTX 1650 Mobile
min: 3 fps, max: 80 fps

EA Sports FC 24
2023Intel Core i5-1335U 0.9GHz
Iris Xe G7 80EUs
min: 25.3 fps, P0.1: 26 fps, P1: 28.2 fps, max: 49 fps

Counter-Strike 2
2023Intel Core i5-11300H 3.1GHz
Iris Xe G7 80EUs
min: 21.1 fps, P0.1: 21.4 fps, P1: 22.2 fps, max: 50.8 fps
Intel Core i5-11400H 2.7GHz
GeForce GTX 1650 Mobile
min: 61.6 fps, P0.1: 62.5 fps, P1: 66.7 fps, max: 359 fps
Intel Core i5-11300H 3.1GHz
Iris Xe G7 80EUs
min: 17.6 fps, P0.1: 17.7 fps, P1: 18 fps, max: 34.7 fps
Intel Core i5-11400H 2.7GHz
GeForce GTX 1650 Mobile
min: 57.2 fps, P0.1: 60 fps, P1: 67.9 fps, max: 315 fps
Intel Core i5-11300H 3.1GHz
Iris Xe G7 80EUs
min: 8.22 fps, P0.1: 8.29 fps, P1: 8.76 fps, max: 21.3 fps
Intel Core i5-11400H 2.7GHz
GeForce GTX 1650 Mobile
min: 26.8 fps, P0.1: 27.6 fps, P1: 35.8 fps, max: 307 fps

2.12
Intel Core i5-1335U 0.9GHz
Iris Xe G7 80EUs
min: 9.33 fps, max: 14.2 fps
2.12
Intel Core 5 120U 0.9GHz
Iris Xe G7 80EUs
min: 11.6 fps, max: 18.9 fps
2.01
Intel Core i5-1335U 0.9GHz
Iris Xe G7 80EUs
min: 11.2 fps, max: 21.9 fps
2.02
Intel Core i5-11400H 2.7GHz
GeForce GTX 1650 Mobile
min: 15.4 fps, max: 66.1 fps
2.12
Intel Core i5-1335U 0.9GHz
Iris Xe G7 80EUs
min: 7.82 fps, max: 11 fps
2.12
Intel Core 5 120U 0.9GHz
Iris Xe G7 80EUs
min: 9.66 fps, max: 14.1 fps
2.01
Intel Core i5-1335U 0.9GHz
Iris Xe G7 80EUs
min: 9.44 fps, max: 15.9 fps
2.02
Intel Core i5-11400H 2.7GHz
GeForce GTX 1650 Mobile
min: 22.1 fps, max: 42.9 fps
2.12
Intel Core i5-1335U 0.9GHz
Iris Xe G7 80EUs
min: 6.59 fps, max: 8.96 fps
2.12
Intel Core 5 120U 0.9GHz
Iris Xe G7 80EUs
min: 8.38 fps, max: 12.2 fps
2.01
Intel Core i5-1335U 0.9GHz
Iris Xe G7 80EUs
min: 8.01 fps, max: 13.8 fps
2.02
Intel Core i5-11400H 2.7GHz
GeForce GTX 1650 Mobile
min: 10.7 fps, max: 80.9 fps
2.12
Intel Core i5-1335U 0.9GHz
Iris Xe G7 80EUs
min: 5.77 fps, max: 8.13 fps
2.12
Intel Core 5 120U 0.9GHz
Iris Xe G7 80EUs
min: 7.25 fps, max: 10.8 fps
2.01
Intel Core i5-1335U 0.9GHz
Iris Xe G7 80EUs
min: 7.73 fps, max: 13.3 fps
2.02
Intel Core i5-11400H 2.7GHz
GeForce GTX 1650 Mobile
min: 8.38 fps, max: 41.8 fps
2.01
Intel Core i5-1335U 0.9GHz
Iris Xe G7 80EUs
min: 4.73 fps, max: 7.95 fps

Baldur's Gate 3
2023Intel Core i5-1335U 0.9GHz
Iris Xe G7 80EUs
min: 9.61 fps, P0.1: 9.91 fps, P1: 10.5 fps, max: 14 fps
Intel Core i5-1335U 0.9GHz
Iris Xe G7 80EUs
min: 3.93 fps, P0.1: 4.02 fps, P1: 4.6 fps, max: 114.7 fps
Intel Core i5-11400H 2.7GHz
GeForce GTX 1650 Mobile
min: 28.4 fps, P0.1: 33.7 fps, P1: 40.6 fps, max: 123.5 fps
Intel Core i5-1335U 0.9GHz
Iris Xe G7 80EUs
min: 8.09 fps, P0.1: 8.11 fps, P1: 8.33 fps, max: 10.7 fps
Intel Core i5-1335U 0.9GHz
Iris Xe G7 80EUs
min: 3.37 fps, P0.1: 3.37 fps, P1: 3.9 fps, max: 104.4 fps
Intel Core i5-11400H 2.7GHz
GeForce GTX 1650 Mobile
min: 25.1 fps, P0.1: 29.3 fps, P1: 32.2 fps, max: 57.5 fps
Intel Core i5-1335U 0.9GHz
Iris Xe G7 80EUs
min: 5.21 fps, P0.1: 5.84 fps, P1: 7.26 fps, max: 17 fps
Intel Core i5-1335U 0.9GHz
Iris Xe G7 80EUs
min: 2.7 fps, P0.1: 2.73 fps, P1: 2.89 fps, max: 96.3 fps
Intel Core i5-11400H 2.7GHz
GeForce GTX 1650 Mobile
min: 28 fps, P0.1: 28.2 fps, P1: 29.3 fps, max: 44.3 fps
Intel Core i5-1335U 0.9GHz
Iris Xe G7 80EUs
min: 4.77 fps, P0.1: 4.89 fps, P1: 6.71 fps, max: 14 fps
Intel Core i5-1335U 0.9GHz
Iris Xe G7 80EUs
min: 2.43 fps, P0.1: 2.46 fps, P1: 2.66 fps, max: 105 fps
Intel Core i5-11400H 2.7GHz
GeForce GTX 1650 Mobile
min: 27.1 fps, P0.1: 27.5 fps, P1: 28.4 fps, max: 45.5 fps
Intel Core i5-1335U 0.9GHz
Iris Xe G7 80EUs
min: 1.654 fps, P0.1: 1.656 fps, P1: 1.697 fps, max: 103.5 fps

Lies of P
2023Intel Core i5-1335U 0.9GHz
Iris Xe G7 80EUs
min: 8.38 fps, P0.1: 8.4 fps, P1: 8.63 fps, max: 166.1 fps
Intel Core i5-11400H 2.7GHz
GeForce GTX 1650 Mobile
min: 28.9 fps, P0.1: 30.8 fps, P1: 35.5 fps, max: 187.1 fps
Intel Core i5-1335U 0.9GHz
Iris Xe G7 80EUs
min: 7.35 fps, P0.1: 7.4 fps, P1: 7.49 fps, max: 156.5 fps
Intel Core i5-11400H 2.7GHz
GeForce GTX 1650 Mobile
min: 26.9 fps, P0.1: 28.7 fps, P1: 31.1 fps, max: 167.6 fps
Intel Core i5-1335U 0.9GHz
Iris Xe G7 80EUs
min: 5.73 fps, P0.1: 5.78 fps, P1: 6.02 fps, max: 150.2 fps
Intel Core i5-11400H 2.7GHz
GeForce GTX 1650 Mobile
min: 23.6 fps, P0.1: 24.4 fps, P1: 25 fps, max: 150.8 fps
Intel Core i5-1335U 0.9GHz
Iris Xe G7 80EUs
min: 5.54 fps, P0.1: 5.56 fps, P1: 5.91 fps, max: 113.1 fps
Intel Core i5-11400H 2.7GHz
GeForce GTX 1650 Mobile
min: 19.9 fps, P0.1: 20.7 fps, P1: 22.4 fps, max: 144.7 fps
Intel Core i5-1335U 0.9GHz
Iris Xe G7 80EUs
min: 3.74 fps, P0.1: 3.76 fps, P1: 3.86 fps, max: 102.1 fps

The Crew Motorfest
2023Intel Core i5-11400H 2.7GHz
GeForce GTX 1650 Mobile
min: 38 fps, max: 58 fps
Intel Core i5-11400H 2.7GHz
GeForce GTX 1650 Mobile
min: 36 fps, max: 50 fps
Intel Core i5-11400H 2.7GHz
GeForce GTX 1650 Mobile
min: 28 fps, max: 43 fps

Starfield
2023Intel Core i5-11400H 2.7GHz
GeForce GTX 1650 Mobile
min: 23 fps, P0.1: 23.1 fps, P1: 23.9 fps, max: 44 fps
Intel Core i5-11400H 2.7GHz
GeForce GTX 1650 Mobile
min: 19 fps, P0.1: 19.2 fps, P1: 19.6 fps, max: 35 fps
Intel Core i5-11400H 2.7GHz
GeForce GTX 1650 Mobile
min: 15.2 fps, P0.1: 15.2 fps, P1: 15.4 fps, max: 27.6 fps

Armored Core 6
2023Intel Core i5-1335U 0.9GHz
Iris Xe G7 80EUs
min: 2.61 fps, P0.1: 2.76 fps, P1: 14.4 fps, max: 76.7 fps
Intel Core i5-11400H 2.7GHz
GeForce GTX 1650 Mobile
min: 18.6 fps, P0.1: 42.1 fps, P1: 46.7 fps, max: 104.9 fps
Intel Core i5-1335U 0.9GHz
Iris Xe G7 80EUs
min: 2.85 fps, P0.1: 2.98 fps, P1: 18.1 fps, max: 59.9 fps
Intel Core i5-11400H 2.7GHz
GeForce GTX 1650 Mobile
min: 32.7 fps, P0.1: 39.5 fps, P1: 44.1 fps, max: 73.7 fps
Intel Core i5-1335U 0.9GHz
Iris Xe G7 80EUs
min: 2.61 fps, P0.1: 5.1 fps, P1: 17.5 fps, max: 49.7 fps
Intel Core i5-11400H 2.7GHz
GeForce GTX 1650 Mobile
min: 1.084 fps, P0.1: 1.3 fps, P1: 32.8 fps, max: 69.8 fps
Intel Core i5-1335U 0.9GHz
Iris Xe G7 80EUs
min: 2.21 fps, P0.1: 2.49 fps, P1: 13.6 fps, max: 33.9 fps
Intel Core i5-11400H 2.7GHz
GeForce GTX 1650 Mobile
min: 2.89 fps, P0.1: 5.58 fps, P1: 16.3 fps, max: 57.6 fps
Intel Core i5-1335U 0.9GHz
Iris Xe G7 80EUs
min: 2.44 fps, P0.1: 2.57 fps, P1: 9.99 fps, max: 76 fps

Immortals of Aveum
2023Intel Core i5-11400H 2.7GHz
GeForce GTX 1650 Mobile
min: 2.64 fps, P0.1: 2.72 fps, P1: 11.6 fps, max: 87.2 fps
Intel Core i5-11400H 2.7GHz
GeForce GTX 1650 Mobile
min: 2.82 fps, P0.1: 2.93 fps, P1: 14.8 fps, max: 77.9 fps

Atlas Fallen
2023Intel Core i5-1335U 0.9GHz
Iris Xe G7 80EUs
min: 12.2 fps, P0.1: 12.5 fps, P1: 13.1 fps, max: 62.1 fps
Intel Core i5-11400H 2.7GHz
GeForce GTX 1650 Mobile
min: 42.1 fps, P0.1: 42.7 fps, P1: 44.7 fps, max: 67.1 fps
Intel Core i5-1335U 0.9GHz
Iris Xe G7 80EUs
min: 12 fps, P0.1: 12.1 fps, P1: 12.4 fps, max: 22.2 fps
Intel Core i5-11400H 2.7GHz
GeForce GTX 1650 Mobile
min: 38.7 fps, P0.1: 39.7 fps, P1: 40.8 fps, max: 58.7 fps
Intel Core i5-1335U 0.9GHz
Iris Xe G7 80EUs
min: 9.28 fps, P0.1: 9.43 fps, P1: 9.97 fps, max: 48.5 fps
Intel Core i5-11400H 2.7GHz
GeForce GTX 1650 Mobile
min: 38.2 fps, P0.1: 38.2 fps, P1: 39.5 fps, max: 55.8 fps
Intel Core i5-11400H 2.7GHz
GeForce GTX 1650 Mobile
min: 3.2 fps, P0.1: 4.86 fps, P1: 23.1 fps, max: 38.4 fps
Intel Core i5-1335U 0.9GHz
Iris Xe G7 80EUs
min: 6.77 fps, P0.1: 6.84 fps, P1: 7.54 fps, max: 11.2 fps

Intel Core i5-11300H 3.1GHz
Iris Xe G7 80EUs
min: 8.17 fps, P0.1: 8.17 fps, P1: 9.12 fps, max: 14.7 fps
Intel Core i5-11400H 2.7GHz
GeForce GTX 1650 Mobile
min: 18.5 fps, P0.1: 19.5 fps, P1: 20.3 fps, max: 44.3 fps
Intel Core i5-11400H 2.7GHz
GeForce GTX 1650 Mobile
min: 15 fps, P0.1: 15 fps, P1: 15.3 fps, max: 31.6 fps
Intel Core i5-11400H 2.7GHz
GeForce GTX 1650 Mobile
min: 9.65 fps, P0.1: 9.65 fps, P1: 9.74 fps, max: 25.3 fps

F1 23
20231082038
Intel Core i5-1335U 0.9GHz
Iris Xe G7 80EUs
min: 19 fps, P1: 20 fps, max: 28 fps
1082038
Intel Core i5-1235U 0.9GHz
Iris Xe G7 80EUs
min: 24 fps, P1: 25 fps, max: 33 fps
1022189
Intel Core i5-1335U 0.9GHz
Iris Xe G7 80EUs
min: 21 fps, P1: 18 fps, max: 36 fps
1057599
Intel Core i5-1335U 0.9GHz
Iris Xe G7 80EUs
min: 30 fps, P1: 29 fps, max: 43 fps
1057599
Intel Core i5-1335U 0.9GHz
Iris Xe G7 80EUs
min: 31 fps, P1: 29 fps, max: 43 fps
1012607
Intel Core i5-13500H 1.9GHz
Iris Xe G7 80EUs
min: 36 fps, P1: 35 fps, max: 49 fps
1070925
Intel Core i5-11400H 2.7GHz
GeForce GTX 1650 Mobile
min: 93 fps, P1: 89 fps, max: 128 fps
1082038
Intel Core i5-1335U 0.9GHz
Iris Xe G7 80EUs
min: 18 fps, P1: 18 fps, max: 26 fps
1082038
Intel Core i5-1235U 0.9GHz
Iris Xe G7 80EUs
min: 23 fps, P1: 23 fps, max: 29 fps
1022189
Intel Core i5-1335U 0.9GHz
Iris Xe G7 80EUs
min: 24 fps, P1: 23 fps, max: 32 fps
1057599
Intel Core i5-1335U 0.9GHz
Iris Xe G7 80EUs
min: 27 fps, P1: 27 fps, max: 37 fps
1057599
Intel Core i5-1335U 0.9GHz
Iris Xe G7 80EUs
min: 29 fps, P1: 27 fps, max: 37 fps
1012607
Intel Core i5-13500H 1.9GHz
Iris Xe G7 80EUs
min: 32 fps, P1: 32 fps, max: 43 fps
1070925
Intel Core i5-11400H 2.7GHz
GeForce GTX 1650 Mobile
min: 86 fps, P1: 82 fps, max: 114 fps
1082038
Intel Core i5-1335U 0.9GHz
Iris Xe G7 80EUs
min: 13 fps, P1: 13 fps, max: 18 fps
1082038
Intel Core i5-1235U 0.9GHz
Iris Xe G7 80EUs
min: 15 fps, P1: 15 fps, max: 21 fps
1022189
Intel Core i5-1335U 0.9GHz
Iris Xe G7 80EUs
min: 16 fps, P1: 16 fps, max: 22 fps
1057599
Intel Core i5-1335U 0.9GHz
Iris Xe G7 80EUs
min: 18 fps, P1: 17 fps, max: 25 fps
1057599
Intel Core i5-1335U 0.9GHz
Iris Xe G7 80EUs
min: 18 fps, P1: 17 fps, max: 25 fps
1012607
Intel Core i5-13500H 1.9GHz
Iris Xe G7 80EUs
min: 22 fps, P1: 21 fps, max: 29 fps
1070925
Intel Core i5-11400H 2.7GHz
GeForce GTX 1650 Mobile
min: 44 fps, P1: 55 fps, max: 74 fps

Diablo 4
2023Intel Core i5-1335U 0.9GHz
Iris Xe G7 80EUs
min: 24.7 fps, P0.1: 25 fps, P1: 26.2 fps, max: 45.1 fps
Intel Core i5-11400H 2.7GHz
GeForce GTX 1650 Mobile
min: 48 fps, P0.1: 51.1 fps, P1: 63.9 fps, max: 191.5 fps
Intel Core i5-1335U 0.9GHz
Iris Xe G7 80EUs
min: 18.7 fps, P0.1: 19.1 fps, P1: 20.3 fps, max: 36.4 fps
Intel Core i5-11400H 2.7GHz
GeForce GTX 1650 Mobile
min: 31.1 fps, P0.1: 36.1 fps, P1: 55.7 fps, max: 190 fps
Intel Core i5-1335U 0.9GHz
Iris Xe G7 80EUs
min: 15.9 fps, P0.1: 16.3 fps, P1: 17.9 fps, max: 32.8 fps
Intel Core i5-11400H 2.7GHz
GeForce GTX 1650 Mobile
min: 22.3 fps, P0.1: 27.4 fps, P1: 49.9 fps, max: 206 fps
Intel Core i5-1335U 0.9GHz
Iris Xe G7 80EUs
min: 8.22 fps, P0.1: 9.02 fps, P1: 14.5 fps, max: 87.1 fps
Intel Core i5-11400H 2.7GHz
GeForce GTX 1650 Mobile
min: 12.8 fps, P0.1: 16.5 fps, P1: 33.7 fps, max: 217 fps
Intel Core i5-1335U 0.9GHz
Iris Xe G7 80EUs
min: 5.76 fps, P0.1: 5.97 fps, P1: 9.65 fps, max: 172.1 fps

Intel Core i5-11400H 2.7GHz
GeForce GTX 1650 Mobile
min: 12.5 fps, P0.1: 15 fps, P1: 19.5 fps, max: 106.1 fps
Intel Core i5-11400H 2.7GHz
GeForce GTX 1650 Mobile
min: 11.6 fps, P0.1: 12 fps, P1: 14.6 fps, max: 84 fps
Intel Core i5-11400H 2.7GHz
GeForce GTX 1650 Mobile
min: 11.7 fps, P0.1: 12.2 fps, P1: 13.3 fps, max: 89.1 fps

Dead Island 2
2023Intel Core i5-1335U 0.9GHz
Iris Xe G7 80EUs
min: 8.61 fps, P0.1: 11.8 fps, P1: 17.6 fps, max: 137.8 fps
Intel Core i5-11400H 2.7GHz
GeForce GTX 1650 Mobile
min: 50.9 fps, P0.1: 51.6 fps, P1: 55.4 fps, max: 192.7 fps
Intel Core i5-1335U 0.9GHz
Iris Xe G7 80EUs
min: 8.9 fps, P0.1: 8.92 fps, P1: 14.7 fps, max: 125.2 fps
Intel Core i5-11400H 2.7GHz
GeForce GTX 1650 Mobile
min: 12.9 fps, P0.1: 14.4 fps, P1: 40.3 fps, max: 199.4 fps
Intel Core i5-1335U 0.9GHz
Iris Xe G7 80EUs
min: 9.67 fps, P0.1: 9.87 fps, P1: 11 fps, max: 117.9 fps
Intel Core i5-11400H 2.7GHz
GeForce GTX 1650 Mobile
min: 10.9 fps, P0.1: 15.8 fps, P1: 25.5 fps, max: 184.7 fps
Intel Core i5-1335U 0.9GHz
Iris Xe G7 80EUs
min: 7.12 fps, P0.1: 7.22 fps, P1: 7.5 fps, max: 85.7 fps
Intel Core i5-11400H 2.7GHz
GeForce GTX 1650 Mobile
min: 12.5 fps, P0.1: 14.5 fps, P1: 20.4 fps, max: 134.4 fps
Intel Core i5-1335U 0.9GHz
Iris Xe G7 80EUs
min: 4.47 fps, P0.1: 4.49 fps, P1: 5.25 fps, max: 78.2 fps

The Last of Us
2023Intel Core i5-11400H 2.7GHz
GeForce GTX 1650 Mobile
min: 26.4 fps, P0.1: 27.2 fps, P1: 27.8 fps, max: 61.4 fps
Intel Core i5-11400H 2.7GHz
GeForce GTX 1650 Mobile
min: 18.5 fps, P0.1: 20.4 fps, P1: 21.6 fps, max: 40 fps

Intel Core i5-11300H 3.1GHz
Iris Xe G7 80EUs
min: 5.9 fps, P0.1: 6.68 fps, P1: 10.5 fps, max: 21.9 fps
Intel Core i5-11400H 2.7GHz
GeForce GTX 1650 Mobile
min: 15.1 fps, P0.1: 23 fps, P1: 35.8 fps, max: 82.6 fps
Intel Core i5-11300H 3.1GHz
Iris Xe G7 80EUs
min: 4.11 fps, P0.1: 4.54 fps, P1: 7.85 fps, max: 15.3 fps
Intel Core i5-11400H 2.7GHz
GeForce GTX 1650 Mobile
min: 16.8 fps, P0.1: 20.5 fps, P1: 25.3 fps, max: 51.5 fps
Intel Core i5-11400H 2.7GHz
GeForce GTX 1650 Mobile
min: 6.73 fps, P0.1: 11.4 fps, P1: 22.5 fps, max: 46.7 fps

Company of Heroes 3
2023Intel Core i5-1240P 1.2GHz
Iris Xe G7 80EUs
P0.1: 11.1 fpsP1: 15.6 fps
Intel Core i5-11400H 2.7GHz
GeForce GTX 1650 Mobile
P0.1: 36.5 fpsP1: 44.3 fps
Intel Core i5-1240P 1.2GHz
Iris Xe G7 80EUs
P0.1: 7.8 fpsP1: 13.6 fps
Intel Core i5-11400H 2.7GHz
GeForce GTX 1650 Mobile
P0.1: 33.6 fpsP1: 40.3 fps
Intel Core i5-1240P 1.2GHz
Iris Xe G7 80EUs
P0.1: 7.6 fpsP1: 10.5 fps
Intel Core i5-11400H 2.7GHz
GeForce GTX 1650 Mobile
P0.1: 25.9 fpsP1: 32.1 fps
Intel Core i5-1240P 1.2GHz
Iris Xe G7 80EUs
P0.1: 8.1 fpsP1: 9.5 fps

Sons of the Forest
2023Intel Core i5-1240P 1.2GHz
Iris Xe G7 80EUs
min: 2.3 fps, P0.1: 2.3 fps, P1: 2.68 fps, max: 25.9 fps
Intel Core i5-11400H 2.7GHz
GeForce GTX 1650 Mobile
min: 9.74 fps, P0.1: 27.1 fps, P1: 31.8 fps, max: 92 fps
Intel Core i5-1240P 1.2GHz
Iris Xe G7 80EUs
min: 2.31 fps, P0.1: 2.33 fps, P1: 2.53 fps, max: 14.5 fps
Intel Core i5-11400H 2.7GHz
GeForce GTX 1650 Mobile
min: 5.99 fps, P0.1: 8.88 fps, P1: 16.9 fps, max: 87.4 fps
Intel Core i5-11400H 2.7GHz
GeForce GTX 1650 Mobile
min: 8.21 fps, P0.1: 9.87 fps, P1: 22 fps, max: 53.8 fps

Atomic Heart
2023Intel Core i5-1240P 1.2GHz
Iris Xe G7 80EUs
min: 11.1 fps, P0.1: 14.8 fps, P1: 18.4 fps, max: 66.8 fps
Intel Core i5-11400H 2.7GHz
GeForce GTX 1650 Mobile
min: 46.1 fps, P0.1: 53.9 fps, P1: 59.5 fps, max: 93.3 fps
Intel Core i5-1240P 1.2GHz
Iris Xe G7 80EUs
min: 7.14 fps, P0.1: 7.39 fps, P1: 12.6 fps, max: 51.2 fps
Intel Core i5-11400H 2.7GHz
GeForce GTX 1650 Mobile
min: 38.3 fps, P0.1: 40.1 fps, P1: 43.3 fps, max: 66.7 fps
Intel Core i5-1240P 1.2GHz
Iris Xe G7 80EUs
min: 5.79 fps, P0.1: 6.29 fps, P1: 9.54 fps, max: 39.4 fps
Intel Core i5-11400H 2.7GHz
GeForce GTX 1650 Mobile
min: 21.4 fps, P0.1: 24.7 fps, P1: 26.3 fps, max: 43.8 fps
Intel Core i5-1240P 1.2GHz
Iris Xe G7 80EUs
min: 5.41 fps, P0.1: 5.56 fps, P1: 7.23 fps, max: 29.8 fps

Returnal
2023Intel Core i5-11400H 2.7GHz
GeForce GTX 1650 Mobile
min: 19 fps, max: 63 fps
Intel Core i5-11400H 2.7GHz
GeForce GTX 1650 Mobile
min: 18 fps, max: 84 fps
Intel Core i5-11400H 2.7GHz
GeForce GTX 1650 Mobile
min: 16 fps, max: 75 fps

Hogwarts Legacy
2023Intel Core i5-11300H 3.1GHz
Iris Xe G7 80EUs
min: 7.66 fps, P0.1: 7.81 fps, P1: 9.49 fps, max: 31.1 fps
Intel Core i5-11400H 2.7GHz
GeForce GTX 1650 Mobile
min: 27.3 fps, P0.1: 29.6 fps, P1: 38 fps, max: 77.4 fps
Intel Core i5-11400H 2.7GHz
GeForce GTX 1650 Mobile
min: 7.18 fps, P0.1: 16.9 fps, P1: 27.2 fps, max: 75.5 fps
Intel Core i5-11400H 2.7GHz
GeForce GTX 1650 Mobile
min: 14.6 fps, P0.1: 15.8 fps, P1: 20.3 fps, max: 73.1 fps

Dead Space Remake
2023Intel Core i5-1135G7 2.4GHz
Iris Xe G7 80EUs
Problem during benchmarking occured: Schwere grafische Probleme
min: 5.46 fps, P0.1: 5.48 fps, P1: 5.7 fps, max: 12.1 fps
Intel Core i5-11400H 2.7GHz
GeForce GTX 1650 Mobile
min: 7.3 fps, P0.1: 9.97 fps, P1: 22.4 fps, max: 79.3 fps
Intel Core i5-11400H 2.7GHz
GeForce GTX 1650 Mobile
min: 12.5 fps, P0.1: 14.2 fps, P1: 19.1 fps, max: 65.7 fps
Intel Core i5-11400H 2.7GHz
GeForce GTX 1650 Mobile
min: 11.3 fps, P0.1: 11.8 fps, P1: 15.2 fps, max: 52.6 fps

The Witcher 3 v4.00
2023Intel Core i5-1135G7 2.4GHz
Iris Xe G7 80EUs
min: 3 fps, P0.1: 11 fps, P1: 17 fps, max: 54.3 fps
Intel Core i5-11400H 2.7GHz
GeForce GTX 1650 Mobile
min: 8.99 fps, P0.1: 49.6 fps, P1: 61.5 fps, max: 177.9 fps
Intel Core i5-1135G7 2.4GHz
Iris Xe G7 80EUs
min: 6.34 fps, P0.1: 7.51 fps, P1: 13.4 fps, max: 62.3 fps
Intel Core i5-11400H 2.7GHz
GeForce GTX 1650 Mobile
min: 8.97 fps, P0.1: 38.4 fps, P1: 47.9 fps, max: 154.8 fps
Intel Core i5-1135G7 2.4GHz
Iris Xe G7 80EUs
min: 3.6 fps, P0.1: 6.41 fps, P1: 6.77 fps, max: 29 fps
Intel Core i5-11400H 2.7GHz
GeForce GTX 1650 Mobile
min: 12.5 fps, P0.1: 15.7 fps, P1: 16.8 fps, max: 54.3 fps
Intel Core i5-11400H 2.7GHz
GeForce GTX 1650 Mobile
min: 10.9 fps, P0.1: 17.8 fps, P1: 20 fps, max: 81.8 fps

High On Life
2023Intel Core i5-1135G7 2.4GHz
Iris Xe G7 80EUs
min: 10.5 fps, P0.1: 11.1 fps, P1: 13.5 fps, max: 78.9 fps
Intel Core i5-1240P 1.2GHz
Iris Xe G7 80EUs
min: 11.9 fps, P0.1: 12 fps, P1: 14.5 fps, max: 119.9 fps
Intel Core i5-11400H 2.7GHz
GeForce GTX 1650 Mobile
min: 36.9 fps, P0.1: 43.6 fps, P1: 60.5 fps, max: 225 fps
Intel Core i5-1135G7 2.4GHz
Iris Xe G7 80EUs
min: 6.15 fps, P0.1: 6.3 fps, P1: 7.64 fps, max: 74.8 fps
Intel Core i5-1240P 1.2GHz
Iris Xe G7 80EUs
min: 8.25 fps, P0.1: 8.57 fps, P1: 9.72 fps, max: 114.8 fps
Intel Core i5-1135G7 2.4GHz
Iris Xe G7 80EUs
min: 4.75 fps, P0.1: 4.79 fps, P1: 5.25 fps, max: 88 fps
Intel Core i5-1240P 1.2GHz
Iris Xe G7 80EUs
min: 4.56 fps, P0.1: 4.82 fps, P1: 6.3 fps, max: 113.5 fps
Intel Core i5-11400H 2.7GHz
GeForce GTX 1650 Mobile
min: 20.6 fps, P0.1: 22.7 fps, P1: 28.4 fps, max: 182.2 fps
Intel Core i5-1135G7 2.4GHz
Iris Xe G7 80EUs
min: 2.85 fps, P0.1: 3.13 fps, P1: 4.75 fps, max: 71.9 fps
Intel Core i5-1240P 1.2GHz
Iris Xe G7 80EUs
min: 4.69 fps, P0.1: 5.04 fps, P1: 6.3 fps, max: 97.7 fps


Intel Core i5-1240P 1.2GHz
Iris Xe G7 80EUs
min: 4.07 fps, P0.1: 4.84 fps, P1: 5.51 fps, max: 13.3 fps
Intel Core i5-1135G7 2.4GHz
Iris Xe G7 80EUs
min: 5.5 fps, P0.1: 6.61 fps, P1: 13 fps, max: 29.3 fps
Intel Core i5-11400H 2.7GHz
GeForce GTX 1650 Mobile
min: 30.3 fps, P0.1: 43 fps, P1: 46.2 fps, max: 94.4 fps
Intel Core i5-1240P 1.2GHz
Iris Xe G7 80EUs
min: 3.15 fps, P0.1: 3.24 fps, P1: 3.64 fps, max: 16.4 fps
Intel Core i5-1135G7 2.4GHz
Iris Xe G7 80EUs
min: 6.18 fps, P0.1: 6.78 fps, P1: 9.05 fps, max: 27.7 fps
Intel Core i5-11400H 2.7GHz
GeForce GTX 1650 Mobile
min: 10 fps, P0.1: 39.9 fps, P1: 43.8 fps, max: 89.1 fps
Intel Core i5-1240P 1.2GHz
Iris Xe G7 80EUs
min: 1.328 fps, P0.1: 1.665 fps, P1: 2.99 fps, max: 22.7 fps
Intel Core i5-1135G7 2.4GHz
Iris Xe G7 80EUs
min: 3.58 fps, P0.1: 5.02 fps, P1: 6.69 fps, max: 30.8 fps
Intel Core i5-11400H 2.7GHz
GeForce GTX 1650 Mobile
min: 2.18 fps, P0.1: 6.69 fps, P1: 23 fps, max: 86 fps

Intel Core i5-1240P 1.2GHz
Iris Xe G7 80EUs
min: 2.99 fps, P0.1: 3.02 fps, P1: 3.13 fps, max: 5.69 fps
Intel Core i5-1135G7 2.4GHz
Iris Xe G7 80EUs
Problem during benchmarking occured: Leichte grafische Probleme
min: 7.65 fps, P0.1: 9.24 fps, P1: 13.1 fps, max: 21.9 fps
Intel Core i5-11400H 2.7GHz
GeForce GTX 1650 Mobile
min: 46.4 fps, P0.1: 47 fps, P1: 49.5 fps, max: 76.6 fps
Intel Core i5-1240P 1.2GHz
Iris Xe G7 80EUs
min: 2.73 fps, P0.1: 2.78 fps, P1: 2.97 fps, max: 5.71 fps
Intel Core i5-1135G7 2.4GHz
Iris Xe G7 80EUs
Problem during benchmarking occured: Leichte grafische Probleme
min: 12.9 fps, P0.1: 12.9 fps, P1: 13.4 fps, max: 29.2 fps
Intel Core i5-11400H 2.7GHz
GeForce GTX 1650 Mobile
min: 17 fps, P0.1: 17.1 fps, P1: 31 fps, max: 69.2 fps
Intel Core i5-1240P 1.2GHz
Iris Xe G7 80EUs
min: 2.91 fps, P0.1: 2.93 fps, P1: 3.01 fps, max: 6.12 fps
Intel Core i5-1135G7 2.4GHz
Iris Xe G7 80EUs
Problem during benchmarking occured: Leichte grafische Probleme
min: 11.3 fps, P0.1: 11.4 fps, P1: 12 fps, max: 26.7 fps
Intel Core i5-11400H 2.7GHz
GeForce GTX 1650 Mobile
min: 25.3 fps, P0.1: 25.4 fps, P1: 26.8 fps, max: 57.4 fps

Intel Core i5-1240P 1.2GHz
Iris Xe G7 80EUs
Problem during benchmarking occured: Spiel startete nicht crash
Intel Core i5-1240P 1.2GHz
Iris Xe G7 80EUs
Problem during benchmarking occured: Spiel startete nicht crash
Intel Core i5-1240P 1.2GHz
Iris Xe G7 80EUs
Problem during benchmarking occured: Spiel startete nicht crash

Intel Core i5-1240P 1.2GHz
Iris Xe G7 80EUs
min: 3.34 fps, P0.1: 3.34 fps, P1: 3.38 fps, max: 7.78 fps
Intel Core i5-1135G7 2.4GHz
Iris Xe G7 80EUs
min: 8.72 fps, P0.1: 8.72 fps, P1: 8.78 fps, max: 10.6 fps
Intel Core i5-11400H 2.7GHz
GeForce GTX 1650 Mobile
min: 34.8 fps, P0.1: 34.8 fps, P1: 35.7 fps, max: 44.1 fps
Intel Core i5-1240P 1.2GHz
Iris Xe G7 80EUs
min: 2.06 fps, P0.1: 2.21 fps, P1: 3.42 fps, max: 7.27 fps
Intel Core i5-1135G7 2.4GHz
Iris Xe G7 80EUs
min: 6.78 fps, P0.1: 6.8 fps, P1: 7.38 fps, max: 10.1 fps
Intel Core i5-11400H 2.7GHz
GeForce GTX 1650 Mobile
min: 24.4 fps, P0.1: 25.4 fps, P1: 26.8 fps, max: 31.6 fps
Intel Core i5-1240P 1.2GHz
Iris Xe G7 80EUs
min: 2.17 fps, P0.1: 2.18 fps, P1: 2.36 fps, max: 29.5 fps
Intel Core i5-11400H 2.7GHz
GeForce GTX 1650 Mobile
min: 15.4 fps, P0.1: 15.4 fps, P1: 15.6 fps, max: 19.6 fps

Intel Core i5-1240P 1.2GHz
Iris Xe G7 80EUs
min: 4.85 fps, P0.1: 4.85 fps, P1: 4.95 fps, max: 7.8 fps
Intel Core i5-1135G7 2.4GHz
Iris Xe G7 80EUs
min: 7.54 fps, P0.1: 7.83 fps, P1: 9.12 fps, max: 16.8 fps
Intel Core i5-11400H 2.7GHz
GeForce GTX 1650 Mobile
min: 22.9 fps, P0.1: 25.2 fps, P1: 31.4 fps, max: 86.2 fps
Intel Core i5-1240P 1.2GHz
Iris Xe G7 80EUs
min: 4.37 fps, P0.1: 4.41 fps, P1: 4.62 fps, max: 6.71 fps
Intel Core i5-1135G7 2.4GHz
Iris Xe G7 80EUs
min: 6.49 fps, P0.1: 6.69 fps, P1: 7.12 fps, max: 17.8 fps
Intel Core i5-11400H 2.7GHz
GeForce GTX 1650 Mobile
min: 22.1 fps, P0.1: 22.6 fps, P1: 25.4 fps, max: 43 fps
Intel Core i5-1240P 1.2GHz
Iris Xe G7 80EUs
min: 3.85 fps, P0.1: 3.85 fps, P1: 4.02 fps, max: 5.77 fps
Intel Core i5-1135G7 2.4GHz
Iris Xe G7 80EUs
min: 4.01 fps, P0.1: 4.28 fps, P1: 6.12 fps, max: 32 fps
Intel Core i5-11400H 2.7GHz
GeForce GTX 1650 Mobile
min: 19.3 fps, P0.1: 19.5 fps, P1: 21.5 fps, max: 34.6 fps

FIFA 23
2022
The Quarry
2022Intel Core i5-11400H 2.7GHz
GeForce GTX 1650 Mobile
min: 26.5 fps, P0.1: 31.1 fps, P1: 48 fps, max: 123.8 fps
Intel Core i5-11400H 2.7GHz
GeForce GTX 1650 Mobile
min: 19.3 fps, P0.1: 22.5 fps, P1: 33.3 fps, max: 107 fps
Intel Core i5-11400H 2.7GHz
GeForce GTX 1650 Mobile
min: 11.9 fps, P0.1: 14.5 fps, P1: 27 fps, max: 90.8 fps

F1 22
2022Intel Core i5-1340P 1.4GHz
Iris Xe G7 80EUs
Problem during benchmarking occured: Spiel startete nicht
928484
Intel Core i5-1245U 1.2GHz
Iris Xe G7 80EUs
min: 20 fps, P1: 27 fps, max: 37 fps
959964
Intel Core i5-1335U 0.9GHz
Iris Xe G7 80EUs
min: 27 fps, P1: 27 fps, max: 38 fps
959964
Intel Core i5-1335U 0.9GHz
Iris Xe G7 80EUs
min: 24 fps, P1: 23 fps, max: 42 fps
959964
Intel Core i5-1335U 0.9GHz
Iris Xe G7 80EUs
min: 29 fps, P1: 29 fps, max: 41 fps
959964
Intel Core i5-1335U 0.9GHz
Iris Xe G7 80EUs
min: 32 fps, P1: 29 fps, max: 46 fps
959964
Intel Core 5 120U 0.9GHz
Iris Xe G7 80EUs
min: 33 fps, P1: 32 fps, max: 46 fps
959964
Intel Core i5-1345U 1.2GHz
Iris Xe G7 80EUs
min: 33 fps, P1: 33 fps, max: 46 fps
959964
Intel Core i5-1335U 0.9GHz
Iris Xe G7 80EUs
min: 34 fps, P1: 30 fps, max: 47 fps
959964
Intel Core i5-1335U 0.9GHz
Iris Xe G7 80EUs
min: 34 fps, P1: 33 fps, max: 47 fps
959964
Intel Core i5-13500H 1.9GHz
Iris Xe G7 80EUs
min: 39 fps, P1: 39 fps, max: 53 fps
959964
Intel Core i5-1345U 1.2GHz
Iris Xe G7 80EUs
min: 41 fps, P1: 44 fps, max: 76 fps
928484
Intel Core i5-12500H 1.8GHz
Iris Xe G7 80EUs
min: 49 fps, P1: 50 fps, max: 68 fps
959964
Intel Core i5-11400H 2.7GHz
GeForce GTX 1650 Mobile
min: 94 fps, P1: 84 fps, max: 134 fps
959964
Intel Core i5-1335U 0.9GHz
Iris Xe G7 80EUs
min: 24 fps, P1: 24 fps, max: 33 fps
928484
Intel Core i5-1245U 1.2GHz
Iris Xe G7 80EUs
min: 25 fps, P1: 24 fps, max: 34 fps
959964
Intel Core i5-1335U 0.9GHz
Iris Xe G7 80EUs
min: 22 fps, P1: 22 fps, max: 39 fps
959964
Intel Core i5-1335U 0.9GHz
Iris Xe G7 80EUs
min: 22 fps, P1: 22 fps, max: 40 fps
959964
Intel Core i5-1345U 1.2GHz
Iris Xe G7 80EUs
min: 28 fps, P1: 25 fps, max: 38 fps
959964
Intel Core i5-1335U 0.9GHz
Iris Xe G7 80EUs
min: 29 fps, P1: 26 fps, max: 39 fps
959964
Intel Core 5 120U 0.9GHz
Iris Xe G7 80EUs
min: 30 fps, P1: 29 fps, max: 39 fps
928484
Intel Core i5-12500H 1.8GHz
Iris Xe G7 80EUs
min: 30 fps, P1: 25 fps, max: 39 fps
959964
Intel Core i5-1345U 1.2GHz
Iris Xe G7 80EUs
min: 31 fps, P1: 31 fps, max: 43 fps
959964
Intel Core i5-1335U 0.9GHz
Iris Xe G7 80EUs
min: 31 fps, P1: 28 fps, max: 42 fps
959964
Intel Core i5-1335U 0.9GHz
Iris Xe G7 80EUs
min: 31 fps, P1: 30 fps, max: 43 fps
959964
Intel Core i5-13500H 1.9GHz
Iris Xe G7 80EUs
min: 37 fps, P1: 34 fps, max: 50 fps
959964
Intel Core i5-11400H 2.7GHz
GeForce GTX 1650 Mobile
min: 88 fps, P1: 78 fps, max: 124 fps
959964
Intel Core i5-1335U 0.9GHz
Iris Xe G7 80EUs
min: 18 fps, P1: 17 fps, max: 24 fps
928484
Intel Core i5-1245U 1.2GHz
Iris Xe G7 80EUs
min: 19 fps, P1: 18 fps, max: 25 fps
959964
Intel Core i5-1335U 0.9GHz
Iris Xe G7 80EUs
min: 15 fps, P1: 15 fps, max: 27 fps
959964
Intel Core i5-1335U 0.9GHz
Iris Xe G7 80EUs
min: 20 fps, P1: 18 fps, max: 29 fps
959964
Intel Core i5-1335U 0.9GHz
Iris Xe G7 80EUs
min: 17 fps, P1: 20 fps, max: 28 fps
959964
Intel Core i5-1345U 1.2GHz
Iris Xe G7 80EUs
min: 21 fps, P1: 21 fps, max: 29 fps
959964
Intel Core i5-1335U 0.9GHz
Iris Xe G7 80EUs
min: 21 fps, P1: 21 fps, max: 29 fps
959964
Intel Core 5 120U 0.9GHz
Iris Xe G7 80EUs
min: 22 fps, P1: 21 fps, max: 30 fps
959964
Intel Core i5-1335U 0.9GHz
Iris Xe G7 80EUs
min: 22 fps, P1: 20 fps, max: 29 fps
959964
Intel Core i5-13500H 1.9GHz
Iris Xe G7 80EUs
min: 25 fps, P1: 23 fps, max: 34 fps
959964
Intel Core i5-1345U 1.2GHz
Iris Xe G7 80EUs
min: 24 fps, P1: 22 fps, max: 35 fps
928484
Intel Core i5-12500H 1.8GHz
Iris Xe G7 80EUs
min: 26 fps, P1: 27 fps, max: 36 fps
959964
Intel Core i5-11400H 2.7GHz
GeForce GTX 1650 Mobile
min: 63 fps, P1: 61 fps, max: 85 fps
959964
Intel Core i5-1335U 0.9GHz
Iris Xe G7 80EUs
min: 14 fps, P1: 12 fps, max: 18 fps
959964
Intel Core i5-1335U 0.9GHz
Iris Xe G7 80EUs
min: 13 fps, P1: 13 fps, max: 19 fps
959964
Intel Core i5-1335U 0.9GHz
Iris Xe G7 80EUs
min: 11 fps, P1: 12 fps, max: 19 fps
959964
Intel Core i5-1335U 0.9GHz
Iris Xe G7 80EUs
min: 15 fps, P1: 14 fps, max: 22 fps
959964
Intel Core i5-1345U 1.2GHz
Iris Xe G7 80EUs
min: 16 fps, P1: 16 fps, max: 22 fps
959964
Intel Core 5 120U 0.9GHz
Iris Xe G7 80EUs
min: 16 fps, P1: 15 fps, max: 23 fps
959964
Intel Core i5-1335U 0.9GHz
Iris Xe G7 80EUs
min: 16 fps, P1: 16 fps, max: 23 fps
959964
Intel Core i5-13500H 1.9GHz
Iris Xe G7 80EUs
min: 19 fps, P1: 17 fps, max: 26 fps
959964
Intel Core i5-1345U 1.2GHz
Iris Xe G7 80EUs
min: 19 fps, P1: 18 fps, max: 26 fps
928484
Intel Core i5-12500H 1.8GHz
Iris Xe G7 80EUs
min: 20 fps, P1: 20 fps, max: 27 fps

Vampire Bloodhunt
2022Intel Core i5-11400H 2.7GHz
GeForce GTX 1650 Mobile
min: 25.1 fps, P0.1: 44.7 fps, P1: 80.3 fps, max: 244 fps
Intel Core i5-11400H 2.7GHz
GeForce GTX 1650 Mobile
min: 20.6 fps, P0.1: 36.4 fps, P1: 63.1 fps, max: 199.2 fps
Intel Core i5-11400H 2.7GHz
GeForce GTX 1650 Mobile
min: 40.3 fps, P0.1: 50.3 fps, P1: 59.9 fps, max: 129.4 fps

Ghostwire Tokyo
2022Intel Core i5-1230U 0.7GHz
Iris Xe G7 80EUs
Problem during benchmarking occured: Schwere grafische Probleme out of video memory
Intel Core i5-11400H 2.7GHz
GeForce GTX 1650 Mobile
min: 4.66 fps, P0.1: 35.3 fps, P1: 39.9 fps, max: 166.6 fps
Intel Core i5-1230U 0.7GHz
Iris Xe G7 80EUs
Problem during benchmarking occured: Schwere grafische Probleme out of video memory
Intel Core i5-11400H 2.7GHz
GeForce GTX 1650 Mobile
min: 26.1 fps, P0.1: 27.3 fps, P1: 31.6 fps, max: 155.4 fps
Intel Core i5-11400H 2.7GHz
GeForce GTX 1650 Mobile
min: 7.87 fps, P0.1: 29.2 fps, P1: 31.3 fps, max: 156.1 fps

Intel Core i5-1135G7 2.4GHz
Iris Xe G7 80EUs
Problem during benchmarking occured: Spiel startete nicht crash
Intel Core i5-1135G7 2.4GHz
Iris Xe G7 80EUs
Problem during benchmarking occured: Spiel startete nicht crash

Cyberpunk 2077 1.6
2022Intel Core i5-1235U 0.9GHz
Iris Xe G7 80EUs
min: 4.5 fps, max: 16.2 fps
Intel Core i5-1235U 0.9GHz
Iris Xe G7 80EUs
min: 8.9 fps, max: 19.1 fps
Intel Core i5-1335U 0.9GHz
Iris Xe G7 80EUs
min: 10.5 fps, max: 19.6 fps
Intel Core i5-1235U 0.9GHz
Iris Xe G7 80EUs
min: 9.8 fps, max: 21.1 fps
Intel Core i5-1335U 0.9GHz
Iris Xe G7 80EUs
min: 10.4 fps, max: 21.7 fps
1.63
Intel Core i5-1335U 0.9GHz
Iris Xe G7 80EUs
min: 11.3 fps, max: 21.5 fps
1.63
Intel Core i5-1335U 0.9GHz
Iris Xe G7 80EUs
min: 9.4 fps, max: 16 fps
Intel Core i5-1235U 0.9GHz
Iris Xe G7 80EUs
min: 8.9 fps, max: 17.1 fps
Intel Core i5-1335U 0.9GHz
Iris Xe G7 80EUs
min: 9.6 fps, max: 17.7 fps
Intel Core i5-1235U 0.9GHz
Iris Xe G7 80EUs
min: 6.7 fps, max: 12.1 fps
Intel Core i5-1235U 0.9GHz
Iris Xe G7 80EUs
min: 7.5 fps, max: 13.2 fps
1.63
Intel Core i5-1335U 0.9GHz
Iris Xe G7 80EUs
min: 8.04 fps, max: 14 fps
Intel Core i5-1235U 0.9GHz
Iris Xe G7 80EUs
min: 5.3 fps, max: 10 fps
Intel Core i5-1235U 0.9GHz
Iris Xe G7 80EUs
min: 5.7 fps, max: 10.9 fps
1.63
Intel Core i5-1335U 0.9GHz
Iris Xe G7 80EUs
min: 7.68 fps, max: 13.1 fps
1.63
Intel Core i5-1335U 0.9GHz
Iris Xe G7 80EUs
min: 4.77 fps, max: 7.8 fps

Elex 2
2022Intel Core i5-1135G7 2.4GHz
Iris Xe G7 80EUs
Problem during benchmarking occured: Schwere grafische Probleme
min: 8 fps
Intel Core i7-10750H 2.6GHz
GeForce GTX 1650 Mobile
min: 24.6 fps, P0.1: 25.1 fps, P1: 27.9 fps, max: 118 fps
Intel Core i5-1135G7 2.4GHz
Iris Xe G7 80EUs
Problem during benchmarking occured: Schwere grafische Probleme
min: 7 fps
Intel Core i7-10750H 2.6GHz
GeForce GTX 1650 Mobile
min: 9.59 fps, P0.1: 23 fps, P1: 28.2 fps, max: 80.9 fps
Intel Core i5-1135G7 2.4GHz
Iris Xe G7 80EUs
Problem during benchmarking occured: Schwere grafische Probleme
min: 3 fps
Intel Core i7-10750H 2.6GHz
GeForce GTX 1650 Mobile
min: 24.8 fps, P0.1: 27 fps, P1: 30.4 fps, max: 74.4 fps

GRID Legends
2022800660
Intel Core i5-13500H 1.9GHz
Iris Xe G7 80EUs
min: 26.3 fps, max: 136.2 fps
800660
Intel Core i5-13500H 1.9GHz
Iris Xe G7 80EUs
min: 22.8 fps, max: 82.9 fps
800660
Intel Core i5-13500H 1.9GHz
Iris Xe G7 80EUs
min: 24 fps, max: 134.4 fps
800660
Intel Core i5-13500H 1.9GHz
Iris Xe G7 80EUs
min: 13 fps, max: 130.6 fps

Elden Ring
2022Intel Core i5-1135G7 2.4GHz
Iris Xe G7 80EUs
min: 10.7 fps, P0.1: 11 fps, P1: 17.7 fps, max: 33.3 fps
Intel Core i5-1240P 1.2GHz
Iris Xe G7 80EUs
min: 14.7 fps, P0.1: 14.7 fps, P1: 16.6 fps, max: 58.5 fps
Intel Core i7-10750H 2.6GHz
GeForce GTX 1650 Mobile
min: 26 fps, P0.1: 30 fps, P1: 38.5 fps, max: 77.3 fps
Intel Core i5-1240P 1.2GHz
Iris Xe G7 80EUs
min: 9.75 fps, P0.1: 9.98 fps, P1: 10.7 fps, max: 28.5 fps
Intel Core i5-1135G7 2.4GHz
Iris Xe G7 80EUs
min: 9.01 fps, P0.1: 10.8 fps, P1: 15 fps, max: 32.9 fps
Intel Core i7-10750H 2.6GHz
GeForce GTX 1650 Mobile
min: 19.9 fps, P0.1: 32.5 fps, P1: 37 fps, max: 72.4 fps
Intel Core i5-1240P 1.2GHz
Iris Xe G7 80EUs
min: 7.68 fps, P0.1: 8.16 fps, P1: 9.86 fps, max: 22.7 fps
Intel Core i5-1135G7 2.4GHz
Iris Xe G7 80EUs
min: 9.55 fps, P0.1: 10.7 fps, P1: 13.7 fps, max: 32.3 fps
Intel Core i7-10750H 2.6GHz
GeForce GTX 1650 Mobile
min: 23.6 fps, P0.1: 23.7 fps, P1: 33.8 fps, max: 72 fps
Intel Core i5-1135G7 2.4GHz
Iris Xe G7 80EUs
min: 8.59 fps, P0.1: 9.06 fps, P1: 11.3 fps, max: 25.5 fps
Intel Core i7-10750H 2.6GHz
GeForce GTX 1650 Mobile
min: 21.6 fps, P0.1: 22.3 fps, P1: 30.1 fps, max: 68 fps
Intel Core i7-10750H 2.6GHz
GeForce GTX 1650 Mobile
min: 15.8 fps, P0.1: 17.5 fps, P1: 22.3 fps, max: 56.6 fps

Dying Light 2
2022Intel Core i5-1135G7 2.4GHz
Iris Xe G7 80EUs
min: 4.24 fps, P0.1: 4.25 fps, P1: 4.34 fps, max: 122 fps
Intel Core i7-10750H 2.6GHz
GeForce GTX 1650 Mobile
min: 29.9 fps, P0.1: 30.5 fps, P1: 32.3 fps, max: 44.3 fps
Intel Core i5-1135G7 2.4GHz
Iris Xe G7 80EUs
min: 3.36 fps, P0.1: 3.37 fps, P1: 3.55 fps, max: 117 fps
Intel Core i7-10750H 2.6GHz
GeForce GTX 1650 Mobile
min: 21 fps, P0.1: 22.7 fps, P1: 24.5 fps, max: 33.6 fps

Intel Core i5-1135G7 2.4GHz
Iris Xe G7 80EUs
Problem during benchmarking occured: Spiel startete nicht crash
Intel Core i5-1135G7 2.4GHz
Iris Xe G7 80EUs
min: 16 fps, max: 27 fps
Intel Core i5-1135G7 2.4GHz
Iris Xe G7 80EUs
Problem during benchmarking occured: Spiel startete nicht crash
Intel Core i5-1135G7 2.4GHz
Iris Xe G7 80EUs
min: 14 fps, max: 24 fps
Intel Core i5-1135G7 2.4GHz
Iris Xe G7 80EUs
Problem during benchmarking occured: Spiel startete nicht crash
Intel Core i5-1135G7 2.4GHz
Iris Xe G7 80EUs
min: 12 fps, max: 23 fps

God of War
2022Intel Core i5-1135G7 2.4GHz
Iris Xe G7 80EUs
min: 10.9 fps, P0.1: 11.5 fps, P1: 12.8 fps, max: 30.4 fps
Intel Core i5-1155G7 2.5GHz
Iris Xe G7 80EUs
min: 18 fps, P1: 18.25 fps, max: 23 fps
Intel Core i5-1155G7 2.5GHz
Iris Xe G7 80EUs
min: 19 fps, P1: 19.26 fps, max: 23 fps
Intel Core i7-10750H 2.6GHz
GeForce GTX 1650 Mobile
min: 37.9 fps, P0.1: 40 fps, P1: 46.2 fps, max: 83.9 fps
Intel Core i5-1135G7 2.4GHz
Iris Xe G7 80EUs
min: 9.26 fps, P0.1: 9.47 fps, P1: 10.7 fps, max: 22 fps
Intel Core i5-1155G7 2.5GHz
Iris Xe G7 80EUs
min: 17 fps, P1: 17 fps, max: 19 fps
Intel Core i5-1155G7 2.5GHz
Iris Xe G7 80EUs
min: 17 fps, P1: 17.26 fps, max: 20 fps
Intel Core i7-10750H 2.6GHz
GeForce GTX 1650 Mobile
min: 32.4 fps, P0.1: 36.2 fps, P1: 37.4 fps, max: 56.8 fps
Intel Core i5-1155G7 2.5GHz
Iris Xe G7 80EUs
min: 13 fps, P1: 13 fps, max: 16 fps
Intel Core i5-1155G7 2.5GHz
Iris Xe G7 80EUs
min: 14 fps, P1: 14 fps, max: 17 fps
Intel Core i7-10750H 2.6GHz
GeForce GTX 1650 Mobile
min: 26.8 fps, P0.1: 27.8 fps, P1: 29.1 fps, max: 41.8 fps
Intel Core i5-1155G7 2.5GHz
Iris Xe G7 80EUs
min: 10 fps, P1: 10 fps, max: 13 fps
Intel Core i5-1155G7 2.5GHz
Iris Xe G7 80EUs
min: 11 fps, P1: 11 fps, max: 14 fps

Halo Infinite
2021Intel Core i7-10750H 2.6GHz
GeForce GTX 1650 Mobile
min: 52.2 fps, P0.1: 59.9 fps, P1: 72.4 fps, max: 213 fps
Intel Core i7-10750H 2.6GHz
GeForce GTX 1650 Mobile
min: 37.7 fps, P0.1: 41.3 fps, P1: 44.1 fps, max: 131 fps
Intel Core i7-10750H 2.6GHz
GeForce GTX 1650 Mobile
min: 23.1 fps, P0.1: 23.7 fps, P1: 28.7 fps, max: 88.7 fps

Farming Simulator 22
2021Intel Core i5-1135G7 2.4GHz
Iris Xe G7 80EUs
min: 10.6 fps, P0.1: 15.4 fps, P1: 26.5 fps, max: 147 fps
Intel Core i7-10750H 2.6GHz
GeForce GTX 1650 Mobile
min: 2.81 fps, P0.1: 16.3 fps, P1: 40.5 fps, max: 219 fps
Intel Core i5-1135G7 2.4GHz
Iris Xe G7 80EUs
min: 5.64 fps, P0.1: 5.99 fps, P1: 8.03 fps, max: 109 fps
Intel Core i7-10750H 2.6GHz
GeForce GTX 1650 Mobile
min: 6.48 fps, P0.1: 16.3 fps, P1: 22.9 fps, max: 165 fps
Intel Core i5-1135G7 2.4GHz
Iris Xe G7 80EUs
min: 3.38 fps, P0.1: 4.12 fps, P1: 5.35 fps, max: 93.1 fps
Intel Core i7-10750H 2.6GHz
GeForce GTX 1650 Mobile
min: 14.7 fps, P0.1: 32.2 fps, P1: 57.6 fps, max: 128 fps
Intel Core i7-10750H 2.6GHz
GeForce GTX 1650 Mobile
min: 11.8 fps, P0.1: 35.4 fps, P1: 47.4 fps, max: 119 fps
Intel Core i7-10750H 2.6GHz
GeForce GTX 1650 Mobile
min: 16.2 fps, P0.1: 23.7 fps, P1: 35.7 fps, max: 111 fps

Battlefield 2042
2021Intel Core i5-1135G7 2.4GHz
Iris Xe G7 80EUs
min: 11.9 fps, P0.1: 15.9 fps, P1: 21 fps, max: 48 fps
Intel Core i7-10750H 2.6GHz
GeForce GTX 1650 Mobile
min: 4.38 fps, P0.1: 12.6 fps, P1: 71.3 fps, max: 142 fps
Intel Core i5-1135G7 2.4GHz
Iris Xe G7 80EUs
min: 9.83 fps, P0.1: 10 fps, P1: 11.3 fps, max: 21.1 fps
Intel Core i7-10750H 2.6GHz
GeForce GTX 1650 Mobile
min: 5.99 fps, P0.1: 10.2 fps, P1: 39.7 fps, max: 114 fps
Intel Core i5-1135G7 2.4GHz
Iris Xe G7 80EUs
min: 9.52 fps, P0.1: 9.72 fps, P1: 10.2 fps, max: 18.7 fps
Intel Core i7-10750H 2.6GHz
GeForce GTX 1650 Mobile
min: 7.61 fps, P0.1: 10.3 fps, P1: 34.1 fps, max: 94.2 fps
Intel Core i7-10750H 2.6GHz
GeForce GTX 1650 Mobile
min: 6.35 fps, P0.1: 6.37 fps, P1: 6.75 fps, max: 16.8 fps

Forza Horizon 5
2021
Intel Core i7-10750H 2.6GHz
GeForce GTX 1650 Mobile
min: 40.1 fps, P0.1: 46.7 fps, P1: 50 fps, max: 122 fps
Intel Core i7-10750H 2.6GHz
GeForce GTX 1650 Mobile
min: 22.9 fps, P0.1: 23.5 fps, P1: 24.7 fps, max: 83.3 fps
Intel Core i7-10750H 2.6GHz
GeForce GTX 1650 Mobile
min: 19 fps, P0.1: 23.1 fps, P1: 24.9 fps, max: 53 fps
Intel Core i7-10750H 2.6GHz
GeForce GTX 1650 Mobile
min: 16.8 fps, P0.1: 17.2 fps, P1: 17.5 fps, max: 37.4 fps

Riders Republic
2021Intel Core i5-1135G7 2.4GHz
Iris Xe G7 80EUs
min: 15 fps, max: 33 fps
Intel Core i5-1135G7 2.4GHz
Iris Xe G7 80EUs
min: 20 fps, max: 33 fps
Intel Core i5-1135G7 2.4GHz
Iris Xe G7 80EUs
min: 11 fps, max: 18 fps
Intel Core i5-1135G7 2.4GHz
Iris Xe G7 80EUs
min: 12 fps, max: 19 fps
Intel Core i5-1135G7 2.4GHz
Iris Xe G7 80EUs
min: 9 fps, max: 15 fps
Intel Core i5-1135G7 2.4GHz
Iris Xe G7 80EUs
min: 10 fps, max: 15 fps
Intel Core i5-1135G7 2.4GHz
Iris Xe G7 80EUs
min: 8 fps, max: 13 fps


Back 4 Blood
2021Intel Core i5-1135G7 2.4GHz
Iris Xe G7 80EUs
min: 25 fps, P0.1: 26.1 fps, P1: 27.8 fps, max: 219 fps
Intel Core i5-1135G7 2.4GHz
Iris Xe G7 80EUs
min: 6.24 fps, P0.1: 6.81 fps, P1: 8.97 fps, max: 143 fps
Intel Core i7-10750H 2.6GHz
GeForce GTX 1650 Mobile
min: 31.8 fps, P0.1: 51 fps, P1: 57.2 fps, max: 286 fps
Intel Core i5-1135G7 2.4GHz
Iris Xe G7 80EUs
min: 9.02 fps, P0.1: 9.33 fps, P1: 10.1 fps, max: 110 fps
Intel Core i7-10750H 2.6GHz
GeForce GTX 1650 Mobile
min: 41.8 fps, P0.1: 44.8 fps, P1: 49.4 fps, max: 247 fps
Intel Core i5-1135G7 2.4GHz
Iris Xe G7 80EUs
min: 9 fps, P0.1: 9.02 fps, P1: 9.65 fps, max: 135 fps
Intel Core i7-10750H 2.6GHz
GeForce GTX 1650 Mobile
min: 38.7 fps, P0.1: 40.3 fps, P1: 43.8 fps, max: 240 fps
Intel Core i7-10750H 2.6GHz
GeForce GTX 1650 Mobile
min: 23.9 fps, P0.1: 24.2 fps, P1: 26.2 fps, max: 248 fps

Far Cry 6
2021Intel Core i5-1135G7 2.4GHz
Iris Xe G7 80EUs
Problem during benchmarking occured: Spiel startete nicht
AMD Ryzen 5 5500U @4GHz
GeForce GTX 1650 Mobile
min: 47 fps, max: 87 fps
AMD Ryzen 5 5500U @4GHz
GeForce GTX 1650 Mobile
min: 44 fps, max: 61 fps
AMD Ryzen 5 5500U @4GHz
GeForce GTX 1650 Mobile
min: 38 fps, max: 54 fps
AMD Ryzen 5 5500U @4GHz
GeForce GTX 1650 Mobile
min: 19 fps, max: 47 fps

Alan Wake Remastered
2021Intel Core i5-1135G7 2.4GHz
Iris Xe G7 80EUs
min: 25.7 fps, P0.1: 30.2 fps, P1: 35.4 fps, max: 77.3 fps
Intel Core i5-1135G7 2.4GHz
Iris Xe G7 80EUs
min: 7.58 fps, P0.1: 10 fps, P1: 38.8 fps, max: 112 fps
Intel Core i5-1135G7 2.4GHz
Iris Xe G7 80EUs
min: 7.43 fps, P0.1: 10.6 fps, P1: 17 fps, max: 55.7 fps
Intel Core i5-1135G7 2.4GHz
Iris Xe G7 80EUs
min: 7.42 fps, P0.1: 8.03 fps, P1: 17.9 fps, max: 70.5 fps
Intel Core i7-10750H 2.6GHz
GeForce GTX 1650 Mobile
min: 31.4 fps, P0.1: 41.7 fps, P1: 59.2 fps, max: 129 fps
Intel Core i5-1135G7 2.4GHz
Iris Xe G7 80EUs
min: 6.97 fps, P0.1: 7.02 fps, P1: 12.8 fps, max: 38.1 fps
Intel Core i5-1135G7 2.4GHz
Iris Xe G7 80EUs
min: 7.5 fps, P0.1: 7.51 fps, P1: 13.2 fps, max: 48.3 fps
Intel Core i7-10750H 2.6GHz
GeForce GTX 1650 Mobile
min: 34.3 fps, P0.1: 39.9 fps, P1: 51.5 fps, max: 86.7 fps

FIFA 22
2021Intel Core i7-10750H 2.6GHz
GeForce GTX 1650 Mobile
min: 56 fps, P0.1: 90.3 fps, P1: 103 fps, max: 290 fps
Intel Core i7-10750H 2.6GHz
GeForce GTX 1650 Mobile
min: 77 fps, P0.1: 87.4 fps, P1: 96.4 fps, max: 287 fps
Intel Core i7-10750H 2.6GHz
GeForce GTX 1650 Mobile
min: 23.5 fps, P0.1: 74.7 fps, P1: 83.3 fps, max: 265 fps
Intel Core i7-10750H 2.6GHz
GeForce GTX 1650 Mobile
min: 12.6 fps, P0.1: 66 fps, P1: 73 fps, max: 241 fps

New World
2021Intel Core i5-1135G7 2.4GHz
Iris Xe G7 80EUs
min: 11.2 fps, P0.1: 13.1 fps, P1: 17.7 fps, max: 69.6 fps
Intel Core i5-1135G7 2.4GHz
Iris Xe G7 80EUs
min: 6.64 fps, P0.1: 7.18 fps, P1: 10.2 fps, max: 20.5 fps
Intel Core i7-10750H 2.6GHz
GeForce GTX 1650 Mobile
min: 14.8 fps, P0.1: 20.6 fps, P1: 23.6 fps, max: 110 fps
Intel Core i7-10750H 2.6GHz
GeForce GTX 1650 Mobile
min: 15.6 fps, P0.1: 16.3 fps, P1: 22.2 fps, max: 91.1 fps
Intel Core i7-10750H 2.6GHz
GeForce GTX 1650 Mobile
min: 9.86 fps, P0.1: 12.8 fps, P1: 19.9 fps, max: 67.2 fps
Intel Core i7-10750H 2.6GHz
GeForce GTX 1650 Mobile
min: 5.5 fps, P0.1: 9.59 fps, P1: 12.9 fps, max: 30.8 fps

Deathloop
2021Intel Core i7-10750H 2.6GHz
GeForce GTX 1650 Mobile
min: 17.5 fps, P0.1: 26.3 fps, P1: 39.7 fps, max: 94.7 fps
Intel Core i7-10750H 2.6GHz
GeForce GTX 1650 Mobile
min: 15.1 fps, P0.1: 15.6 fps, P1: 27.3 fps, max: 50.9 fps
Intel Core i7-10750H 2.6GHz
GeForce GTX 1650 Mobile
min: 14.9 fps, P0.1: 19.9 fps, P1: 27.2 fps, max: 85.9 fps
Intel Core i7-10750H 2.6GHz
GeForce GTX 1650 Mobile
min: 12.3 fps, P0.1: 14.9 fps, P1: 17.9 fps, max: 40.6 fps

F1 2021
2021Intel Core i5-1135G7 2.4GHz
Iris Xe G7 80EUs
Problem during benchmarking occured: Spiel startete nicht
874931
Intel Core i7-1250U 0.8GHz
Iris Xe G7 80EUs
min: 12 fps, P1: 7 fps, max: 18 fps
843175
Intel Core i5-1135G7 2.4GHz
Iris Xe G7 80EUs
min: 31 fps, P1: 28 fps, max: 48 fps
831795
Intel Core i5-1135G7 2.4GHz
Iris Xe G7 80EUs
min: 33 fps, P1: 33 fps, max: 50 fps
807588
Intel Core i5-1135G7 2.4GHz
Iris Xe G7 80EUs
min: 37 fps, P1: 35 fps, max: 56 fps
874931
Intel Core i5-1250P 1.2GHz
Iris Xe G7 80EUs
min: 14 fps, P1: 20 fps, max: 58 fps
874931
Intel Core i5-1240P 1.2GHz
Iris Xe G7 80EUs
min: 31 fps, P1: 36 fps, max: 78 fps
850670
Intel Core i5-1130G7 1.8GHz
Iris Xe G7 80EUs
min: 49 fps, P1: 45 fps, max: 83 fps
803111
Intel Core i5-11300H 3.1GHz
Iris Xe G7 80EUs
min: 60 fps, P1: 54 fps, max: 82 fps
843175, Dual-Channel
Intel Core i5-1135G7 2.4GHz
Iris Xe G7 80EUs
min: 59 fps, P1: 52 fps, max: 83 fps
874931
Intel Core i5-1240P 1.2GHz
Iris Xe G7 80EUs
min: 54 fps, P1: 52 fps, max: 85 fps
874931
Intel Core i5-1335U 0.9GHz
Iris Xe G7 80EUs
min: 42 fps, P1: 48 fps, max: 90 fps
874931
Intel Core i5-1235U 0.9GHz
Iris Xe G7 80EUs
min: 60 fps, P1: 53 fps, max: 98 fps
874931, Hoch
Intel Core i5-1240P 1.2GHz
Iris Xe G7 80EUs
min: 56 fps, P1: 54 fps, max: 95 fps
831795, Dual-Channel
Intel Core i5-1135G7 2.4GHz
Iris Xe G7 80EUs
min: 58 fps, P1: 58 fps, max: 88 fps
874931
Intel Core i5-1245U 1.2GHz
Iris Xe G7 80EUs
min: 62 fps, P1: 62 fps, max: 93 fps
874931
Intel Core i5-1145G7 2.6GHz
Iris Xe G7 80EUs
min: 74 fps, P1: 72 fps, max: 118 fps
840701
Intel Core i5-1135G7 2.4GHz
Iris Xe G7 80EUs
Problem during benchmarking occured: Leichte grafische Probleme
min: 76 fps, P1: 67 fps, max: 120 fps
831795
AMD Ryzen 5 5500U @4GHz
GeForce GTX 1650 Mobile
min: 117 fps, P1: 108 fps, max: 157 fps
874931
Intel Core i5-1250P 1.2GHz
Iris Xe G7 80EUs
min: 3 fps, P1: 4 fps, max: 26 fps
850670
Intel Core i5-1130G7 1.8GHz
Iris Xe G7 80EUs
min: 18 fps, P1: 18 fps, max: 34 fps
874931
Intel Core i5-1240P 1.2GHz
Iris Xe G7 80EUs
min: 20 fps, P1: 20 fps, max: 33 fps
874931
Intel Core i5-1240P 1.2GHz
Iris Xe G7 80EUs
min: 22 fps, P1: 21 fps, max: 37 fps
874931, Hoch
Intel Core i5-1240P 1.2GHz
Iris Xe G7 80EUs
min: 25 fps, P1: 24 fps, max: 39 fps
874931
Intel Core i5-1235U 0.9GHz
Iris Xe G7 80EUs
min: 26 fps, P1: 24 fps, max: 46 fps
831795, Dual-Channel
Intel Core i5-1135G7 2.4GHz
Iris Xe G7 80EUs
min: 29 fps, P1: 29 fps, max: 41 fps
843175, Dual-Channel
Intel Core i5-1135G7 2.4GHz
Iris Xe G7 80EUs
min: 29 fps, P1: 28 fps, max: 40 fps
803111
Intel Core i5-11300H 3.1GHz
Iris Xe G7 80EUs
min: 30 fps, P1: 29 fps, max: 40 fps
874931
Intel Core i5-1245U 1.2GHz
Iris Xe G7 80EUs
min: 30 fps, P1: 28 fps, max: 42 fps
874931
Intel Core i5-1335U 0.9GHz
Iris Xe G7 80EUs
min: 32 fps, P1: 32 fps, max: 49 fps
AMD Ryzen 5 5500U 2.1GHz
GeForce GTX 1650 Mobile
min: 80 fps, max: 105 fps
831795
AMD Ryzen 5 5500U @4GHz
GeForce GTX 1650 Mobile
min: 88 fps, P1: 78 fps, max: 115 fps
874931
Intel Core i5-1250P 1.2GHz
Iris Xe G7 80EUs
min: 5 fps, P1: 11 fps, max: 22 fps
874931
Intel Core i5-1240P 1.2GHz
Iris Xe G7 80EUs
min: 21 fps, P1: 20 fps, max: 27 fps
850670
Intel Core i5-1130G7 1.8GHz
Iris Xe G7 80EUs
min: 19 fps, P1: 19 fps, max: 32 fps
874931
Intel Core i5-1240P 1.2GHz
Iris Xe G7 80EUs
min: 19 fps, P1: 19 fps, max: 30 fps
874931
Intel Core i5-1235U 0.9GHz
Iris Xe G7 80EUs
min: 18 fps, P1: 18 fps, max: 33 fps
874931, Hoch
Intel Core i5-1240P 1.2GHz
Iris Xe G7 80EUs
min: 22 fps, P1: 22 fps, max: 32 fps
843175, Dual-Channel
Intel Core i5-1135G7 2.4GHz
Iris Xe G7 80EUs
min: 23 fps, P1: 22 fps, max: 31 fps
803111
Intel Core i5-11300H 3.1GHz
Iris Xe G7 80EUs
min: 24 fps, P1: 23 fps, max: 32 fps
831795, Dual-Channel
Intel Core i5-1135G7 2.4GHz
Iris Xe G7 80EUs
min: 23 fps, P1: 23 fps, max: 32 fps
874931
Intel Core i5-1245U 1.2GHz
Iris Xe G7 80EUs
min: 25 fps, P1: 24 fps, max: 33 fps
874931
Intel Core i5-1335U 0.9GHz
Iris Xe G7 80EUs
min: 21 fps, P1: 24 fps, max: 37 fps
AMD Ryzen 5 5500U 2.1GHz
GeForce GTX 1650 Mobile
min: 66 fps, max: 87 fps
831795
AMD Ryzen 5 5500U @4GHz
GeForce GTX 1650 Mobile
min: 77 fps, P1: 70 fps, max: 99 fps
874931
Intel Core i5-1250P 1.2GHz
Iris Xe G7 80EUs
min: 4 fps, P1: 7 fps, max: 15 fps
850670
Intel Core i5-1130G7 1.8GHz
Iris Xe G7 80EUs
min: 10 fps, P1: 10 fps, max: 19 fps
874931
Intel Core i5-1240P 1.2GHz
Iris Xe G7 80EUs
P1: 11 fps, max: 19 fps
874931
Intel Core i5-1240P 1.2GHz
Iris Xe G7 80EUs
min: 13 fps, P1: 13 fps, max: 22 fps
874931, Hoch
Intel Core i5-1240P 1.2GHz
Iris Xe G7 80EUs
min: 14 fps, P1: 14 fps, max: 21 fps
874931
Intel Core i5-1235U 0.9GHz
Iris Xe G7 80EUs
min: 14 fps, P1: 14 fps, max: 22 fps
874931
Intel Core i5-1245U 1.2GHz
Iris Xe G7 80EUs
min: 15 fps, P1: 15 fps, max: 21 fps
843175, Dual-Channel
Intel Core i5-1135G7 2.4GHz
Iris Xe G7 80EUs
min: 15 fps, P1: 15 fps, max: 21 fps
831795, Dual-Channel
Intel Core i5-1135G7 2.4GHz
Iris Xe G7 80EUs
min: 16 fps, P1: 16 fps, max: 22 fps
874931
Intel Core i5-1335U 0.9GHz
Iris Xe G7 80EUs
min: 19 fps, P1: 18 fps, max: 26 fps
AMD Ryzen 5 5500U 2.1GHz
GeForce GTX 1650 Mobile
min: 49 fps, max: 68 fps
874931
Intel Core i5-1240P 1.2GHz
Iris Xe G7 80EUs
min: 5 fps, P1: 8 fps, max: 15 fps

Intel Core i5-11300H 3.1GHz
Iris Xe G7 80EUs
min: 39.3 fps, P0.1: 40.2 fps, P1: 43.9 fps, max: 82.3 fps
Intel Core i5-11300H 3.1GHz
Iris Xe G7 80EUs
min: 22.6 fps, P0.1: 22.8 fps, P1: 24.2 fps, max: 40.3 fps
Intel Core i7-10750H 2.6GHz
GeForce GTX 1650 Mobile
min: 60.7 fps, P0.1: 81.6 fps, P1: 87.9 fps, max: 136 fps
Intel Core i5-11300H 3.1GHz
Iris Xe G7 80EUs
min: 19.7 fps, P0.1: 19.8 fps, P1: 21.2 fps, max: 31.8 fps
Intel Core i7-10750H 2.6GHz
GeForce GTX 1650 Mobile
min: 73.9 fps, P0.1: 76 fps, P1: 80.4 fps, max: 124 fps
Intel Core i7-10750H 2.6GHz
GeForce GTX 1650 Mobile
min: 56.5 fps, P0.1: 60.4 fps, P1: 65.1 fps, max: 94.8 fps

Days Gone
2021Intel Core i5-1135G7 2.4GHz
Iris Xe G7 80EUs
min: 5.57 fps, P0.1: 6.11 fps, P1: 10.9 fps, max: 59.9 fps
Intel Core i5-1135G7 2.4GHz
Iris Xe G7 80EUs
min: 4.19 fps, P0.1: 6.61 fps, P1: 9.16 fps, max: 67.5 fps
Intel Core i7-10750H 2.6GHz
GeForce GTX 1650 Mobile
min: 30.7 fps, P0.1: 34.5 fps, P1: 45.2 fps, max: 163 fps
Intel Core i5-1135G7 2.4GHz
Iris Xe G7 80EUs
min: 4.61 fps, P0.1: 5.32 fps, P1: 9.98 fps, max: 54.1 fps
Intel Core i7-10750H 2.6GHz
GeForce GTX 1650 Mobile
min: 21.8 fps, P0.1: 33.5 fps, P1: 41.6 fps, max: 114 fps
Intel Core i5-1135G7 2.4GHz
Iris Xe G7 80EUs
min: 2.4 fps, P0.1: 4.18 fps, P1: 8.26 fps, max: 59.9 fps
Intel Core i7-10750H 2.6GHz
GeForce GTX 1650 Mobile
min: 15.1 fps, P0.1: 24.9 fps, P1: 31.6 fps, max: 80.6 fps
Intel Core i7-10750H 2.6GHz
GeForce GTX 1650 Mobile
min: 20 fps, P0.1: 20.3 fps, P1: 23.4 fps, max: 63.8 fps

Intel Core i5-1135G7 2.4GHz
Iris Xe G7 80EUs
min: 18.1 fps, P0.1: 24 fps, P1: 31.8 fps, max: 115 fps
Intel Core i7-10750H 2.6GHz
GeForce GTX 1650 Mobile
min: 20.6 fps, P0.1: 37 fps, P1: 55.3 fps, max: 271 fps
Intel Core i5-1135G7 2.4GHz
Iris Xe G7 80EUs
min: 16.1 fps, P0.1: 19.2 fps, P1: 21.9 fps, max: 90.9 fps
Intel Core i7-10750H 2.6GHz
GeForce GTX 1650 Mobile
min: 22.7 fps, P0.1: 43.5 fps, P1: 51.1 fps, max: 259 fps
Intel Core i7-10750H 2.6GHz
GeForce GTX 1650 Mobile
min: 22.3 fps, P0.1: 27.7 fps, P1: 49.5 fps, max: 225 fps

Intel Core i5-1135G7 2.4GHz
Iris Xe G7 80EUs
min: 6.7 fps, P0.1: 7.13 fps, P1: 11.8 fps, max: 51.8 fps
Intel Core i5-1135G7 2.4GHz
Iris Xe G7 80EUs
min: 2.68 fps, P0.1: 9.47 fps, P1: 16.4 fps, max: 27.2 fps
Intel Core i7-10750H 2.6GHz
GeForce GTX 1650 Mobile
min: 49.3 fps, P0.1: 56.6 fps, P1: 57.8 fps, max: 92.1 fps
Intel Core i5-1135G7 2.4GHz
Iris Xe G7 80EUs
min: 15 fps, P0.1: 15 fps, P1: 15.5 fps, max: 26.2 fps
Intel Core i7-10750H 2.6GHz
GeForce GTX 1650 Mobile
min: 44.1 fps, P0.1: 51 fps, P1: 52.4 fps, max: 86.7 fps
Intel Core i7-10750H 2.6GHz
GeForce GTX 1650 Mobile
min: 16.2 fps, P0.1: 30.1 fps, P1: 44.8 fps, max: 69 fps
Intel Core i7-10750H 2.6GHz
GeForce GTX 1650 Mobile
min: 19.5 fps, P0.1: 20.9 fps, P1: 21.5 fps, max: 33.4 fps

Outriders
2021Intel Core i5-1135G7 2.4GHz
Iris Xe G7 80EUs
min: 2.92 fps, P0.1: 3.49 fps, P1: 21.2 fps, max: 60 fps
Intel Core i5-1135G7 2.4GHz
Iris Xe G7 80EUs
min: 13.2 fps, P0.1: 13.7 fps, P1: 16.1 fps, max: 50.7 fps
Intel Core i7-10750H 2.6GHz
GeForce GTX 1650 Mobile
min: 11.1 fps, P0.1: 14.3 fps, P1: 23.1 fps, max: 152 fps
Intel Core i5-1135G7 2.4GHz
Iris Xe G7 80EUs
min: 12.2 fps, P0.1: 12.4 fps, P1: 13.6 fps, max: 51.6 fps
Intel Core i7-10750H 2.6GHz
GeForce GTX 1650 Mobile
min: 11.9 fps, P0.1: 14.9 fps, P1: 30.3 fps, max: 128 fps
Intel Core i5-1135G7 2.4GHz
Iris Xe G7 80EUs
min: 6.63 fps, P0.1: 7.05 fps, P1: 11.8 fps, max: 46 fps
Intel Core i7-10750H 2.6GHz
GeForce GTX 1650 Mobile
min: 5.11 fps, P0.1: 6.35 fps, P1: 13.9 fps, max: 157 fps
Intel Core i7-10750H 2.6GHz
GeForce GTX 1650 Mobile
min: 8.21 fps, P0.1: 8.68 fps, P1: 13.1 fps, max: 139 fps

Hitman 3
2021
Cyberpunk 2077 1.0
2020Intel Core i5-1135G7 2.4GHz
Iris Xe G7 80EUs
Problem during benchmarking occured: Spiel startete nicht
Intel Core i5-1135G7 2.4GHz
Iris Xe G7 80EUs
min: 10.6 fps, P0.1: 15.2 fps, P1: 18.3 fps, max: 52.8 fps
Intel Core i7-10750H 2.6GHz
GeForce GTX 1650 Mobile
min: 16.7 fps, P0.1: 35.6 fps, P1: 42.1 fps, max: 101 fps
Intel Core i5-1135G7 2.4GHz
Iris Xe G7 80EUs
min: 7.32 fps, P0.1: 7.33 fps, P1: 8.06 fps, max: 18.6 fps
Intel Core i7-10750H 2.6GHz
GeForce GTX 1650 Mobile
min: 12.3 fps, P0.1: 19.2 fps, P1: 24.2 fps, max: 54.4 fps
Intel Core i7-10750H 2.6GHz
GeForce GTX 1650 Mobile
min: 18 fps, P0.1: 25.5 fps, P1: 27.3 fps, max: 77.4 fps
Intel Core i7-10750H 2.6GHz
GeForce GTX 1650 Mobile
min: 15.3 fps, P0.1: 17 fps, P1: 20.3 fps, max: 61.2 fps
Intel Core i7-10750H 2.6GHz
GeForce GTX 1650 Mobile
min: 17.7 fps, P0.1: 21.1 fps, P1: 23 fps, max: 57.6 fps
Intel Core i7-10750H 2.6GHz
GeForce GTX 1650 Mobile
min: 10.4 fps, P0.1: 10.5 fps, P1: 14.7 fps, max: 25.5 fps
Intel Core i7-10750H 2.6GHz
GeForce GTX 1650 Mobile
min: 11.1 fps, P0.1: 11.7 fps, P1: 19.2 fps, max: 56.2 fps
Intel Core i7-10750H 2.6GHz
GeForce GTX 1650 Mobile
min: 10.7 fps, P0.1: 11.6 fps, P1: 12.6 fps, max: 16.9 fps

Intel Core i5-1135G7 2.4GHz
Iris Xe G7 80EUs
min: 18 fps, max: 53 fps
Intel Core i7-10750H 2.6GHz
GeForce GTX 1650 Mobile
min: 36 fps, max: 150 fps
Intel Core i7-10750H 2.6GHz
GeForce GTX 1650 Mobile
min: 30 fps, max: 109 fps
Intel Core i7-10750H 2.6GHz
GeForce GTX 1650 Mobile
min: 13 fps, max: 80 fps
Intel Core i7-10750H 2.6GHz
GeForce GTX 1650 Mobile
min: 20 fps, max: 71 fps

Yakuza Like a Dragon
2020Intel Core i5-1135G7 2.4GHz
Iris Xe G7 80EUs
min: 14.6 fps, P0.1: 15 fps, P1: 17.2 fps, max: 66.6 fps
Intel Core i5-1135G7 2.4GHz
Iris Xe G7 80EUs
min: 5.16 fps, P0.1: 5.21 fps, P1: 9.28 fps, max: 40 fps
Intel Core i7-10750H 2.6GHz
GeForce GTX 1650 Mobile
min: 30.8 fps, P0.1: 31.6 fps, P1: 35.5 fps, max: 88.8 fps
Intel Core i5-1135G7 2.4GHz
Iris Xe G7 80EUs
min: 4.91 fps, P0.1: 4.91 fps, P1: 8.61 fps, max: 34.5 fps
Intel Core i7-10750H 2.6GHz
GeForce GTX 1650 Mobile
min: 32.7 fps, P0.1: 33.2 fps, P1: 34.4 fps, max: 74.3 fps
Intel Core i5-1135G7 2.4GHz
Iris Xe G7 80EUs
min: 4.01 fps, P0.1: 4.12 fps, P1: 7.36 fps, max: 33.6 fps
Intel Core i7-10750H 2.6GHz
GeForce GTX 1650 Mobile
min: 23.2 fps, P0.1: 23.5 fps, P1: 25.1 fps, max: 78.6 fps
Intel Core i7-10750H 2.6GHz
GeForce GTX 1650 Mobile
min: 17.7 fps, P0.1: 17.8 fps, P1: 18.3 fps, max: 40.9 fps

Intel Core i7-9750H 2.6GHz
GeForce GTX 1650 Mobile
min: 48.1 fps, P0.1: 62.8 fps, P1: 80.6 fps, max: 334 fps
Intel Core i7-9750H 2.6GHz
GeForce GTX 1650 Mobile
min: 32.1 fps, P0.1: 33.6 fps, P1: 37.2 fps, max: 80.3 fps
Intel Core i7-9750H 2.6GHz
GeForce GTX 1650 Mobile
min: 27.2 fps, P0.1: 29.1 fps, P1: 30.2 fps, max: 66.1 fps
Intel Core i7-9750H 2.6GHz
GeForce GTX 1650 Mobile
min: 23 fps, P0.1: 23.7 fps, P1: 24.8 fps, max: 48.4 fps
Intel Core i7-9750H 2.6GHz
GeForce GTX 1650 Mobile
min: 16 fps, P0.1: 16.1 fps, P1: 17 fps, max: 29.3 fps

Intel Core i7-10750H 2.6GHz
GeForce GTX 1650 Mobile
min: 9 fps, P0.1: 31 fps, P1: 50 fps, max: 134 fps
Intel Core i7-10750H 2.6GHz
GeForce GTX 1650 Mobile
min: 27 fps, P0.1: 28 fps, P1: 31 fps, max: 93 fps
Intel Core i7-10750H 2.6GHz
GeForce GTX 1650 Mobile
min: 18 fps, P0.1: 18 fps, P1: 20 fps, max: 60 fps
Intel Core i7-10750H 2.6GHz
GeForce GTX 1650 Mobile
min: 7 fps, P0.1: 7 fps, P1: 8 fps, max: 13 fps

Dirt 5
2020Intel Core i5-1135G7 2.4GHz
Iris Xe G7 80EUs
min: 9.6 fps, P0.1: 23.9 fps, P1: 26.7 fps, max: 39.5 fps
Intel Core i5-1135G7 2.4GHz
Iris Xe G7 80EUs
min: 23.8 fps, P0.1: 24.6 fps, P1: 29.8 fps, max: 43.5 fps
Intel Core i7-9750H 2.6GHz
GeForce GTX 1650 Mobile
min: 59.1 fps, P0.1: 62.4 fps, P1: 75.9 fps, max: 122 fps
Intel Core i7-10750H 2.6GHz
GeForce GTX 1650 Mobile
min: 23.3 fps, P0.1: 57.7 fps, P1: 73.6 fps, max: 170.7 fps
Intel Core i5-1135G7 2.4GHz
Iris Xe G7 80EUs
min: 9.2 fps, P0.1: 9.6 fps, P1: 10.5 fps, max: 18.3 fps
Intel Core i5-1135G7 2.4GHz
Iris Xe G7 80EUs
min: 9.3 fps, P0.1: 11.4 fps, P1: 12.5 fps, max: 20 fps
Intel Core i7-9750H 2.6GHz
GeForce GTX 1650 Mobile
min: 24.9 fps, P0.1: 27.6 fps, P1: 36.5 fps, max: 131.4 fps
Intel Core i7-10750H 2.6GHz
GeForce GTX 1650 Mobile
min: 31.8 fps, P0.1: 35.1 fps, P1: 37.9 fps, max: 65.9 fps
Intel Core i5-1135G7 2.4GHz
Iris Xe G7 80EUs
min: 7.4 fps, P0.1: 7.8 fps, P1: 8.2 fps, max: 16.7 fps
Intel Core i5-1135G7 2.4GHz
Iris Xe G7 80EUs
min: 9.8 fps, P0.1: 10.1 fps, P1: 10.5 fps, max: 16.3 fps
Intel Core i7-9750H 2.6GHz
GeForce GTX 1650 Mobile
min: 25.1 fps, P0.1: 27 fps, P1: 30.2 fps, max: 44 fps
Intel Core i7-10750H 2.6GHz
GeForce GTX 1650 Mobile
min: 26.8 fps, P0.1: 28.9 fps, P1: 30.7 fps, max: 48.5 fps
Intel Core i5-1135G7 2.4GHz
Iris Xe G7 80EUs
min: 6.2 fps, P0.1: 6.3 fps, P1: 6.8 fps, max: 10.2 fps
Intel Core i5-1135G7 2.4GHz
Iris Xe G7 80EUs
min: 7.7 fps, P0.1: 8.1 fps, P1: 8.5 fps, max: 13.2 fps
Intel Core i7-9750H 2.6GHz
GeForce GTX 1650 Mobile
min: 12 fps, P0.1: 12.5 fps, P1: 13.1 fps, max: 21.9 fps
Intel Core i7-10750H 2.6GHz
GeForce GTX 1650 Mobile
min: 21.8 fps, P0.1: 23 fps, P1: 24.4 fps, max: 40.8 fps

Watch Dogs Legion
2020Intel Core i5-1135G7 2.4GHz
Iris Xe G7 80EUs
min: 17.05 fps, P1: 20.77 fps, max: 35.7 fps
Intel Core i5-11300H 3.1GHz
Iris Xe G7 80EUs
min: 17.29 fps, P1: 22.57 fps, max: 39.2 fps
Intel Core i7-10750H 2.6GHz
GeForce GTX 1650 Mobile
min: 35.96 fps, P1: 58.9 fps, max: 131.62 fps
Intel Core i7-9750H 2.6GHz
GeForce GTX 1650 Mobile
min: 36.42 fps, P1: 64.22 fps, max: 140.12 fps
Intel Core i5-1135G7 2.4GHz
Iris Xe G7 80EUs
min: 6.91 fps, P1: 11.84 fps, max: 31.68 fps
Intel Core i5-11300H 3.1GHz
Iris Xe G7 80EUs
min: 8.8 fps, P1: 12.66 fps, max: 21.3 fps
Intel Core i7-10750H 2.6GHz
GeForce GTX 1650 Mobile
min: 22.63 fps, P1: 38.09 fps, max: 60.02 fps
Intel Core i7-9750H 2.6GHz
GeForce GTX 1650 Mobile
min: 26.13 fps, P1: 39.24 fps, max: 112.04 fps
Intel Core i5-1135G7 2.4GHz
Iris Xe G7 80EUs
min: 7.57 fps, P1: 10.14 fps, max: 29.07 fps
Intel Core i5-11300H 3.1GHz
Iris Xe G7 80EUs
min: 9.16 fps, P1: 10.75 fps, max: 19.28 fps
Intel Core i7-10750H 2.6GHz
GeForce GTX 1650 Mobile
min: 19.49 fps, P1: 32.74 fps, max: 63.32 fps
Intel Core i7-9750H 2.6GHz
GeForce GTX 1650 Mobile
min: 20.4 fps, P1: 34.72 fps, max: 82.35 fps
Intel Core i7-9750H 2.6GHz
GeForce GTX 1650 Mobile
min: 2.15 fps, P1: 6.93 fps, max: 86.34 fps
Intel Core i7-10750H 2.6GHz
GeForce GTX 1650 Mobile
min: 9 fps, P1: 12.49 fps, max: 56.99 fps

FIFA 21
2020Intel Core i5-11300H 3.1GHz
Iris Xe G7 80EUs
min: 63.9 fps, P0.1: 67.9 fps, P1: 74.3 fps, max: 173 fps
Intel Core i7-9750H 2.6GHz
GeForce GTX 1650 Mobile
min: 14 fps, P1: 152 fps, max: 278 fps
Intel Core i5-11300H 3.1GHz
Iris Xe G7 80EUs
min: 40.3 fps, P0.1: 42.4 fps, P1: 45 fps, max: 118 fps
Intel Core i7-9750H 2.6GHz
GeForce GTX 1650 Mobile
min: 18.3 fps, P1: 109 fps, max: 290 fps
Intel Core i5-11300H 3.1GHz
Iris Xe G7 80EUs
min: 35.1 fps, P0.1: 36.4 fps, P1: 38.8 fps, max: 82 fps
Intel Core i7-9750H 2.6GHz
GeForce GTX 1650 Mobile
min: 92 fps, P1: 107 fps, max: 270 fps
Intel Core i5-11300H 3.1GHz
Iris Xe G7 80EUs
min: 27.3 fps, P0.1: 30.8 fps, P1: 33.5 fps, max: 58.2 fps
Intel Core i7-9750H 2.6GHz
GeForce GTX 1650 Mobile
min: 71.3 fps, P1: 99.9 fps, max: 256 fps
Intel Core i7-9750H 2.6GHz
GeForce GTX 1650 Mobile
min: 15.6 fps, P1: 76.9 fps, max: 231 fps

Star Wars Squadrons
2020Intel Core i5-1135G7 2.4GHz
Iris Xe G7 80EUs
min: 27.9 fps, P0.1: 34.4 fps, P1: 42.3 fps, max: 123 fps
Intel Core i5-1135G7 2.4GHz
Iris Xe G7 80EUs
min: 15.4 fps, P0.1: 28.4 fps, P1: 64 fps, max: 122 fps
Intel Core i5-1135G7 2.4GHz
Iris Xe G7 80EUs
min: 10.1 fps, P0.1: 13.9 fps, P1: 16.6 fps, max: 82.2 fps
Intel Core i5-1135G7 2.4GHz
Iris Xe G7 80EUs
min: 10.4 fps, P0.1: 25.9 fps, P1: 29 fps, max: 86.5 fps
Intel Core i5-1135G7 2.4GHz
Iris Xe G7 80EUs
min: 11.3 fps, P0.1: 11.8 fps, P1: 15.4 fps, max: 86.8 fps
Intel Core i5-1135G7 2.4GHz
Iris Xe G7 80EUs
min: 12.8 fps, P0.1: 19.6 fps, P1: 24.2 fps, max: 63.4 fps
Intel Core i5-1135G7 2.4GHz
Iris Xe G7 80EUs
min: 18.4 fps, P0.1: 19.1 fps, P1: 22.3 fps, max: 39 fps

Intel Core i5-11300H 3.1GHz
Iris Xe G7 80EUs
min: 16.3 fps, P0.1: 17.1 fps, P1: 18.5 fps, max: 53.5 fps
1.5.4.5
Intel Core i7-9750H 2.6GHz
GeForce GTX 1650 Mobile
min: 53.3 fps, P1: 71.5 fps, max: 180 fps
Intel Core i5-11300H 3.1GHz
Iris Xe G7 80EUs
min: 6.51 fps, P0.1: 6.77 fps, P1: 7.15 fps, max: 44.3 fps
1.5.4.5
Intel Core i7-9750H 2.6GHz
GeForce GTX 1650 Mobile
min: 27.2 fps, P1: 36.3 fps, max: 95.8 fps
1.5.4.5
Intel Core i7-9750H 2.6GHz
GeForce GTX 1650 Mobile
min: 17.4 fps, P1: 38.3 fps, max: 120 fps
1.5.4.5
Intel Core i7-9750H 2.6GHz
GeForce GTX 1650 Mobile
min: 22.2 fps, P1: 25.8 fps, max: 37.3 fps

Serious Sam 4
2020Intel Core i5-1135G7 2.4GHz
Iris Xe G7 80EUs
min: 3.42 fps, P0.1: 7.97 fps, P1: 31.3 fps, max: 220 fps
Intel Core i5-10300H 2.5GHz
GeForce GTX 1650 Mobile
min: 7.03 fps, P1: 51.3 fps, max: 206 fps
Intel Core i7-9750H 2.6GHz
GeForce GTX 1650 Mobile
min: 10.4 fps, P1: 75.3 fps, max: 195 fps
Intel Core i5-1135G7 2.4GHz
Iris Xe G7 80EUs
min: 1.665 fps, P0.1: 1.893 fps, P1: 2.92 fps, max: 60.8 fps
Intel Core i5-10300H 2.5GHz
GeForce GTX 1650 Mobile
min: 6.96 fps, P1: 24.5 fps, max: 124 fps
Intel Core i7-9750H 2.6GHz
GeForce GTX 1650 Mobile
min: 9.2 fps, P1: 38.6 fps, max: 118 fps
Intel Core i5-1135G7 2.4GHz
Iris Xe G7 80EUs
min: 1.463 fps, P0.1: 1.612 fps, P1: 4.54 fps, max: 60.9 fps
Intel Core i5-10300H 2.5GHz
GeForce GTX 1650 Mobile
min: 13.3 fps, P1: 22.9 fps, max: 83.3 fps
Intel Core i7-9750H 2.6GHz
GeForce GTX 1650 Mobile
min: 13.7 fps, P1: 24.6 fps, max: 92.9 fps
Intel Core i5-1135G7 2.4GHz
Iris Xe G7 80EUs
min: 0.965 fps, P0.1: 1.048 fps, P1: 1.885 fps, max: 43.1 fps
Intel Core i7-9750H 2.6GHz
GeForce GTX 1650 Mobile
min: 0.824 fps, P1: 6.85 fps, max: 110 fps
Intel Core i5-10300H 2.5GHz
GeForce GTX 1650 Mobile
min: 3.37 fps, P1: 14 fps, max: 63.7 fps

Crysis Remastered
2020Intel Core i5-1135G7 2.4GHz
Iris Xe G7 80EUs
min: 15.9 fps, P0.1: 18.2 fps, P1: 21.8 fps, max: 88.9 fps
Intel Core i5-1135G7 2.4GHz
Iris Xe G7 80EUs
min: 23.5 fps, P0.1: 25.7 fps, P1: 34.6 fps, max: 113 fps
Intel Core i5-1135G7 2.4GHz
Iris Xe G7 80EUs
min: 10.4 fps, P0.1: 11 fps, P1: 13 fps, max: 45.8 fps
Intel Core i5-1135G7 2.4GHz
Iris Xe G7 80EUs
min: 7.18 fps, P0.1: 8.45 fps, P1: 10.3 fps, max: 154 fps
Intel Core i7-10750H 2.6GHz
GeForce GTX 1650 Mobile
min: 13.7 fps, P0.1: 14.3 fps, P1: 15.8 fps, max: 295 fps
Intel Core i5-1135G7 2.4GHz
Iris Xe G7 80EUs
min: 3.93 fps, P0.1: 3.95 fps, P1: 4.18 fps, max: 33.3 fps
Intel Core i5-1135G7 2.4GHz
Iris Xe G7 80EUs
min: 2.28 fps, P0.1: 2.42 fps, P1: 3.43 fps, max: 60.4 fps
Intel Core i7-10750H 2.6GHz
GeForce GTX 1650 Mobile
min: 24.2 fps, P0.1: 26 fps, P1: 28.4 fps, max: 64.6 fps
Intel Core i7-10750H 2.6GHz
GeForce GTX 1650 Mobile
min: 11.4 fps, P0.1: 14.3 fps, P1: 21.1 fps, max: 71.4 fps
Intel Core i7-10750H 2.6GHz
GeForce GTX 1650 Mobile
min: 5.87 fps, P0.1: 7.41 fps, P1: 15.2 fps, max: 23.2 fps

Intel Core i5-1135G7 2.4GHz
Iris Xe G7 80EUs
min: 16.2 fps, P0.1: 17 fps, P1: 17.6 fps, max: 22.9 fps
1.5.4.5
Intel Core i7-9750H 2.6GHz
GeForce GTX 1650 Mobile
min: 5.56 fps, P1: 40.93 fps, max: 69.9 fps
Intel Core i5-1135G7 2.4GHz
Iris Xe G7 80EUs
min: 8.25 fps, P0.1: 8.27 fps, P1: 8.67 fps, max: 10.6 fps
1.5.4.5
Intel Core i7-9750H 2.6GHz
GeForce GTX 1650 Mobile
min: 7.48 fps, P1: 30.503 fps, max: 64.4 fps
Intel Core i5-1135G7 2.4GHz
Iris Xe G7 80EUs
min: 0.4788 fps, P0.1: 0.767 fps, P1: 5.72 fps, max: 8.28 fps
1.5.4.5
Intel Core i7-9750H 2.6GHz
GeForce GTX 1650 Mobile
min: 10.2 fps, P1: 22.43 fps, max: 50.5 fps
1.5.4.5
Intel Core i7-9750H 2.6GHz
GeForce GTX 1650 Mobile
min: 8.51 fps, P1: 12.446 fps, max: 39.5 fps
1.5.4.5
Intel Core i7-9750H 2.6GHz
GeForce GTX 1650 Mobile
min: 2.1 fps, P1: 8.598 fps, max: 41.2 fps

Horizon Zero Dawn
2020
Death Stranding
2020Intel Core i5-1135G7 2.4GHz
Iris Xe G7 80EUs
min: 27.6 fps, P0.1: 29 fps, P1: 32.2 fps, max: 73.8 fps
Intel Core i5-1135G7 2.4GHz
Iris Xe G7 80EUs
min: 15.6 fps, P0.1: 16.4 fps, P1: 18 fps, max: 49.7 fps
Intel Core i5-1135G7 2.4GHz
Iris Xe G7 80EUs
min: 14.7 fps, P0.1: 14.8 fps, P1: 16.3 fps, max: 35.7 fps
Intel Core i5-1135G7 2.4GHz
Iris Xe G7 80EUs
min: 7.19 fps, P0.1: 7.77 fps, P1: 12.1 fps, max: 38.5 fps

F1 2020
2020759689
Intel Core i5-1135G7 2.4GHz
Iris Xe G7 80EUs
min: 32 fps, max: 66 fps
759689
Intel Core i5-1135G7 2.4GHz
Iris Xe G7 80EUs
min: 5 fps, max: 77 fps
Intel Core i5-1135G7 2.4GHz
Iris Xe G7 80EUs
min: 52 fps, max: 70 fps
759689
Intel Core i5-1145G7 2.6GHz
Iris Xe G7 80EUs
min: 58 fps, max: 78 fps
759689
Intel Core i5-1245U 1.2GHz
Iris Xe G7 80EUs
min: 58 fps, max: 78 fps
728712
Intel Core i5-1135G7 2.4GHz
Iris Xe G7 80EUs
min: 65 fps, max: 89 fps
Intel Core i5-10300H 2.5GHz
GeForce GTX 1650 Mobile
min: 117 fps, max: 169 fps
759689
AMD Ryzen 7 5800H 3.2GHz
GeForce GTX 1650 Mobile
min: 158 fps, max: 195 fps
AMD Ryzen 5 4600H 3GHz
GeForce GTX 1650 Mobile
min: 156 fps, max: 200 fps
759689
Intel Core i5-1135G7 2.4GHz
Iris Xe G7 80EUs
min: 1 fps, max: 42 fps
759689
Intel Core i5-1135G7 2.4GHz
Iris Xe G7 80EUs
min: 24 fps, max: 33 fps
759689
Intel Core i5-1245U 1.2GHz
Iris Xe G7 80EUs
min: 26 fps, max: 37 fps
759689
Intel Core i5-1135G7 2.4GHz
Iris Xe G7 80EUs
min: 1 fps, max: 45 fps
759689
Intel Core i5-1135G7 2.4GHz
Iris Xe G7 80EUs
min: 1 fps, max: 45 fps
759689
Intel Core i5-1145G7 2.6GHz
Iris Xe G7 80EUs
min: 34 fps, max: 49 fps
759689
AMD Ryzen 7 5800H 3.2GHz
GeForce GTX 1650 Mobile
min: 74 fps, max: 101 fps
Intel Core i5-10300H 2.5GHz
GeForce GTX 1650 Mobile
min: 89 fps, max: 110 fps
AMD Ryzen 5 4600H 3GHz
GeForce GTX 1650 Mobile
min: 94 fps, max: 116 fps
759689
Intel Core i5-1245U 1.2GHz
Iris Xe G7 80EUs
min: 20 fps, max: 29 fps
728712
Intel Core i5-1135G7 2.4GHz
Iris Xe G7 80EUs
min: 4 fps, max: 32 fps
759689
Intel Core i5-1145G7 2.6GHz
Iris Xe G7 80EUs
min: 26 fps, max: 37 fps
759689
AMD Ryzen 7 5800H 3.2GHz
GeForce GTX 1650 Mobile
min: 59 fps, max: 79 fps
Intel Core i5-10300H 2.5GHz
GeForce GTX 1650 Mobile
min: 70 fps, max: 91 fps
AMD Ryzen 5 4600H 3GHz
GeForce GTX 1650 Mobile
min: 72 fps, max: 94 fps
759689
Intel Core i5-1245U 1.2GHz
Iris Xe G7 80EUs
min: 9 fps, max: 19 fps
728712
Intel Core i5-1135G7 2.4GHz
Iris Xe G7 80EUs
min: 2 fps, max: 23 fps
759689
AMD Ryzen 7 5800H 3.2GHz
GeForce GTX 1650 Mobile
min: 38 fps, max: 58 fps
Intel Core i5-10300H 2.5GHz
GeForce GTX 1650 Mobile
min: 47 fps, max: 66 fps
AMD Ryzen 5 4600H 3GHz
GeForce GTX 1650 Mobile
min: 48 fps, max: 67 fps

Valorant
2020
Gears Tactics
2020
Doom Eternal
2020Intel Core i5-11300H 3.1GHz
Iris Xe G7 80EUs
min: 0.591 fps, P0.1: 0.912 fps, P1: 2.94 fps, max: 47.7 fps
Intel Core i5-11300H 3.1GHz
Iris Xe G7 80EUs
min: 1.337 fps, P0.1: 1.846 fps, P1: 14.6 fps, max: 21.9 fps
Intel Core i5-11300H 3.1GHz
Iris Xe G7 80EUs
min: 2.05 fps, P0.1: 2.09 fps, P1: 13.7 fps, max: 20.1 fps

Hunt Showdown
2020Intel Core i5-1135G7 2.4GHz
Iris Xe G7 80EUs
min: 12.2 fps, P0.1: 17.6 fps, P1: 28 fps, max: 60.1 fps
Intel Core i5-11300H 3.1GHz
Iris Xe G7 80EUs
min: 23.4 fps, P0.1: 25.3 fps, P1: 29.9 fps, max: 59.2 fps
Intel Core i5-1135G7 2.4GHz
Iris Xe G7 80EUs
min: 11.4 fps, P0.1: 12.1 fps, P1: 13.3 fps, max: 21.5 fps
Intel Core i5-11300H 3.1GHz
Iris Xe G7 80EUs
min: 9.58 fps, P0.1: 10 fps, P1: 12 fps, max: 29 fps
Intel Core i5-1135G7 2.4GHz
Iris Xe G7 80EUs
min: 4.15 fps, P0.1: 5.6 fps, P1: 10.8 fps, max: 33.2 fps
Intel Core i5-11300H 3.1GHz
Iris Xe G7 80EUs
min: 5.75 fps, P0.1: 6.64 fps, P1: 10.3 fps, max: 21.8 fps

Escape from Tarkov
2020
Fall Guys
2020Intel Core i5-1135G7 2.4GHz
Iris Xe G7 80EUs
Problem during benchmarking occured: Spiel startete nicht

Intel Core i5-1135G7 2.4GHz
Iris Xe G7 80EUs
min: 37.8 fps, P1: 43.5 fps, max: 62.2 fps
Intel Core i5-1135G7 2.4GHz
Iris Xe G7 80EUs
min: 17.6 fps, P1: 18.2 fps, max: 31.1 fps
Intel Core i5-1135G7 2.4GHz
Iris Xe G7 80EUs
min: 8.99 fps, P1: 9.26 fps, max: 20.3 fps


Need for Speed Heat
2019

GRID 2019
2019

FIFA 20
2019
Borderlands 3
2019
Control
2019Intel Core i5-1135G7 2.4GHz
Iris Xe G7 80EUs
min: 30.8 fps, P0.1: 33.8 fps, P1: 36.5 fps, max: 125 fps
Intel Core i5-1135G7 2.4GHz
Iris Xe G7 80EUs
min: 5.81 fps, P0.1: 5.92 fps, P1: 6.46 fps, max: 59.8 fps
Intel Core i5-1135G7 2.4GHz
Iris Xe G7 80EUs
min: 3.86 fps, P0.1: 3.96 fps, P1: 4.69 fps, max: 77.5 fps

F1 2019
2019
Intel Core i5-1135G7 2.4GHz
Iris Xe G7 80EUs
min: 34 fps, max: 63 fps
Intel Core i5-9300H 2.4GHz
GeForce GTX 1650 Mobile
min: 68 fps, max: 173 fps
AMD Ryzen 5 4600H 3GHz
GeForce GTX 1650 Mobile
min: 136 fps, max: 188 fps
Intel Core i5-9300H 2.4GHz
GeForce GTX 1650 Mobile
min: 105 fps, max: 209 fps
Intel Core i5-1135G7 2.4GHz
Iris Xe G7 80EUs
min: 14 fps, max: 25 fps
Intel Core i5-9300H 2.4GHz
GeForce GTX 1650 Mobile
min: 41 fps, max: 73 fps
AMD Ryzen 5 4600H 3GHz
GeForce GTX 1650 Mobile
min: 55 fps, max: 75 fps
Intel Core i5-9300H 2.4GHz
GeForce GTX 1650 Mobile
min: 57 fps, max: 80 fps
Intel Core i5-9300H 2.4GHz
GeForce GTX 1650 Mobile
min: 29 fps, max: 48 fps
AMD Ryzen 5 4600H 3GHz
GeForce GTX 1650 Mobile
min: 32 fps, max: 46 fps
Intel Core i5-9300H 2.4GHz
GeForce GTX 1650 Mobile
min: 24 fps, max: 49 fps
Intel Core i5-9300H 2.4GHz
GeForce GTX 1650 Mobile
min: 23 fps, max: 32 fps
AMD Ryzen 5 4600H 3GHz
GeForce GTX 1650 Mobile
min: 22 fps, max: 31 fps
Intel Core i5-9300H 2.4GHz
GeForce GTX 1650 Mobile
min: 14 fps, max: 32 fps

Rage 2
2019
Anno 1800
2019
The Division 2
2019
Dirt Rally 2.0
2019
Anthem
2019
Far Cry New Dawn
2019Intel Core i5-1145G7 2.6GHz
Iris Xe G7 80EUs
min: 28 fps, max: 59 fps
Intel Core i5-1245U 1.2GHz
Iris Xe G7 80EUs
min: 34 fps, max: 63 fps
Intel Core i5-13500H 1.9GHz
Iris Xe G7 80EUs
min: 40 fps, max: 75 fps
Intel Core i5-1145G7 2.6GHz
Iris Xe G7 80EUs
min: 21 fps, max: 34 fps
Intel Core i5-1245U 1.2GHz
Iris Xe G7 80EUs
min: 20 fps, max: 33 fps
Intel Core i5-13500H 1.9GHz
Iris Xe G7 80EUs
min: 24 fps, max: 39 fps
Intel Core i5-1145G7 2.6GHz
Iris Xe G7 80EUs
min: 20 fps, max: 32 fps
Intel Core i5-1245U 1.2GHz
Iris Xe G7 80EUs
min: 19 fps, max: 31 fps
Intel Core i5-13500H 1.9GHz
Iris Xe G7 80EUs
min: 22 fps, max: 36 fps
Intel Core i5-13500H 1.9GHz
Iris Xe G7 80EUs
min: 19 fps, max: 34 fps

Metro Exodus
2019Intel Core i5-1245U 1.2GHz
Iris Xe G7 80EUs
min: 18.95 fps, max: 50.31 fps
Intel Core i5-1145G7 2.6GHz
Iris Xe G7 80EUs
min: 20.6 fps, max: 53.56 fps
Intel Core i5-13500H 1.9GHz
Iris Xe G7 80EUs
min: 22.59 fps, max: 61.75 fps
Intel Core i5-1135G7 2.4GHz
Iris Xe G7 80EUs
min: 7.6 fps, max: 21 fps
Intel Core i5-1245U 1.2GHz
Iris Xe G7 80EUs
min: 8.13 fps, max: 21.74 fps
Intel Core i5-1145G7 2.6GHz
Iris Xe G7 80EUs
min: 9.18 fps, max: 24.04 fps
Intel Core i5-13500H 1.9GHz
Iris Xe G7 80EUs
min: 9.55 fps, max: 28.87 fps
Intel Core i5-1135G7 2.4GHz
Iris Xe G7 80EUs
min: 5.4 fps, max: 18.1 fps
Intel Core i5-1245U 1.2GHz
Iris Xe G7 80EUs
min: 5.88 fps, max: 18.12 fps
Intel Core i5-13500H 1.9GHz
Iris Xe G7 80EUs
min: 7.24 fps, max: 21.83 fps
Intel Core i5-1135G7 2.4GHz
Iris Xe G7 80EUs
min: 4.9 fps, max: 13.6 fps
Intel Core i5-13500H 1.9GHz
Iris Xe G7 80EUs
min: 6.07 fps, max: 17.6 fps

Apex Legends
2019Intel Core i5-1135G7 2.4GHz
Iris Xe G7 80EUs
min: 44.2 fps, P0.1: 47.7 fps, P1: 52.7 fps, max: 157 fps
Intel Core i5-1135G7 2.4GHz
Iris Xe G7 80EUs
min: 20.8 fps, P0.1: 22.7 fps, P1: 28.2 fps, max: 57 fps
Intel Core i5-1135G7 2.4GHz
Iris Xe G7 80EUs
min: 19.6 fps, P0.1: 20.4 fps, P1: 22.5 fps, max: 43.9 fps
Intel Core i5-1135G7 2.4GHz
Iris Xe G7 80EUs
min: 16.8 fps, P0.1: 16.9 fps, P1: 19 fps, max: 48 fps

Just Cause 4
2018
Darksiders III
2018
Battlefield V
2018Intel Core i5-1135G7 2.4GHz
Iris Xe G7 80EUs
min: 9.72 fps, P0.1: 11.4 fps, P1: 30.8 fps, max: 91.7 fps
Intel Core i5-1135G7 2.4GHz
Iris Xe G7 80EUs
min: 9.8 fps, P0.1: 10.3 fps, P1: 17.7 fps, max: 62 fps
Intel Core i5-1135G7 2.4GHz
Iris Xe G7 80EUs
min: 11.1 fps, P0.1: 11.5 fps, P1: 17.2 fps, max: 43.5 fps
AMD Ryzen 5 5600H 3.3GHz
GeForce GTX 1650 Mobile
min: 55 fps, max: 61 fps
Intel Core i5-1135G7 2.4GHz
Iris Xe G7 80EUs
min: 10.6 fps, P0.1: 10.7 fps, P1: 17.1 fps, max: 41.9 fps
AMD Ryzen 5 5600H 3.3GHz
GeForce GTX 1650 Mobile
min: 44 fps, max: 62 fps

Farming Simulator 19
2018
Hitman 2
2018


Forza Horizon 4
2018
FIFA 19
2018AMD Ryzen 7 3750H 2.3GHz
GeForce GTX 1650 Mobile
min: 46 fps, P1: 47.2 fps, max: 126 fps
AMD Ryzen 7 3750H 2.3GHz
GeForce GTX 1650 Mobile
min: 47 fps, P1: 47.72 fps, max: 109 fps
AMD Ryzen 7 3750H 2.3GHz
GeForce GTX 1650 Mobile
min: 88 fps, P1: 88.67 fps, max: 102 fps
AMD Ryzen 7 3750H 2.3GHz
GeForce GTX 1650 Mobile
min: 47 fps, P1: 47 fps, max: 101 fps
AMD Ryzen 7 3750H 2.3GHz
GeForce GTX 1650 Mobile
min: 44 fps, P1: 44 fps, max: 83 fps

Intel Core i5-1135G7 2.4GHz
Iris Xe G7 80EUs
min: 8 fps, max: 194 fps
Intel Core i5-10300H 2.5GHz
GeForce GTX 1650 Mobile
min: 57 fps, max: 142 fps
Intel Core i5-1135G7 2.4GHz
Iris Xe G7 80EUs
min: 12 fps, max: 29 fps
Intel Core i5-10300H 2.5GHz
GeForce GTX 1650 Mobile
min: 50 fps, max: 125 fps
Hoechstleistung
Intel Core i7-10750H 2.6GHz
GeForce GTX 1650 Mobile

Strange Brigade
20181.47.22.14 D3D12
Intel Core i7-1250U 0.8GHz
Iris Xe G7 80EUs
min: 5 fps, P1: 5.09 fps, max: 403 fps
1.47.22.14 D3D12
Intel Core i5-1135G7 2.4GHz
Iris Xe G7 80EUs
min: 8.5 fps, P1: 10.4 fps, max: 210 fps
1.47.22.14 D3D12
Intel Core i5-1135G7 2.4GHz
Iris Xe G7 80EUs
min: 8.2 fps, P1: 11.2 fps, max: 211 fps
1.47.22.14 D3D12
Intel Core i5-1135G7 2.4GHz
Iris Xe G7 80EUs
min: 8.1 fps, P1: 10.9 fps, max: 243 fps
1.47.22.14 D3D12
Intel Core i5-1135G7 2.4GHz
Iris Xe G7 80EUs
min: 9 fps, P1: 10.8 fps, max: 215 fps
1.47.22.14 D3D12
Intel Core i5-1135G7 2.4GHz
Iris Xe G7 80EUs
min: 8.3 fps, P1: 10.6 fps, max: 211 fps
1.47.22.14 D3D12
Intel Core i5-1135G7 2.4GHz
Iris Xe G7 80EUs
min: 8.9 fps, P1: 13 fps, max: 272 fps
1.47.22.14 D3D12
Intel Core i5-1135G7 2.4GHz
Iris Xe G7 80EUs
min: 8.7 fps, P1: 11.3 fps, max: 229 fps
1.47.22.14 D3D12
Intel Core i5-1230U 0.7GHz
Iris Xe G7 80EUs
min: 10.8 fps, P1: 14.4 fps, max: 278 fps
1.47.22.14 D3D12
Intel Core i5-1135G7 2.4GHz
Iris Xe G7 80EUs
min: 12.2 fps, P1: 14.5 fps, max: 212 fps
1.47.22.14 D3D12
Intel Core i5-1135G7 2.4GHz
Iris Xe G7 80EUs
min: 10.6 fps, P1: 14.2 fps, max: 253 fps
1.47.22.14 D3D12
Intel Core i5-1135G7 2.4GHz
Iris Xe G7 80EUs
min: 11.3 fps, P1: 14.4 fps, max: 247 fps
1.47.22.14 D3D12
Intel Core i5-1235U 0.9GHz
Iris Xe G7 80EUs
min: 5.3 fps, P1: 14.9 fps, max: 171.9 fps
1.47.22.14 D3D12
Intel Core i5-1135G7 2.4GHz
Iris Xe G7 80EUs
min: 11.7 fps, P1: 16.2 fps, max: 251 fps
1.47.22.14 D3D12
Intel Core i5-1240P 1.2GHz
Iris Xe G7 80EUs
min: 12.9 fps, P1: 16.1 fps, max: 268 fps
1.47.22.14 D3D12
Intel Core i5-1240P 1.2GHz
Iris Xe G7 80EUs
min: 12.1 fps, P1: 18 fps, max: 249 fps
1.47.22.14 D3D12
Intel Core i5-1130G7 1.8GHz
Iris Xe G7 80EUs
min: 5 fps, P1: 20 fps, max: 221 fps
1.47.22.14 D3D12
Intel Core i5-1240U 0.8GHz
Iris Xe G7 80EUs
min: 7.6 fps, P1: 18.1 fps, max: 253 fps
1.47.22.14 D3D12
Intel Core i5-1130G7 1.8GHz
Iris Xe G7 80EUs
min: 13.8 fps, P1: 18.3 fps, max: 293 fps
1.47.22.14 D3D12
Intel Core i5-1135G7 2.4GHz
Iris Xe G7 80EUs
min: 14.4 fps, P1: 19.4 fps, max: 253 fps
1.47.22.14 D3D12
Intel Core i5-1135G7 2.4GHz
Iris Xe G7 80EUs
min: 14.4 fps, P1: 21.1 fps, max: 265 fps
1.47.22.14 D3D12, Dual-Channel
Intel Core i5-1135G7 2.4GHz
Iris Xe G7 80EUs
min: 14.1 fps, P1: 19.4 fps, max: 264 fps
1.47.22.14 D3D12
Intel Core i5-1240P 1.2GHz
Iris Xe G7 80EUs
min: 14.1 fps, P1: 21.4 fps, max: 223 fps
1.47.22.14 D3D12
Intel Core i5-1135G7 2.4GHz
Iris Xe G7 80EUs
min: 14.1 fps, P1: 20.1 fps, max: 251 fps
1.47.22.14 D3D12
Intel Core i5-1135G7 2.4GHz
Iris Xe G7 80EUs
min: 14.7 fps, P1: 19.3 fps, max: 260 fps
1.47.22.14 D3D12
Intel Core i5-1135G7 2.4GHz
Iris Xe G7 80EUs
min: 14.9 fps, P1: 19.4 fps, max: 265 fps
1.47.22.14 D3D12
Intel Core i5-1135G7 2.4GHz
Iris Xe G7 80EUs
min: 13.1 fps, P1: 21 fps, max: 266 fps
1.47.22.14 D3D12
Intel Core i5-1235U 0.9GHz
Iris Xe G7 80EUs
min: 15.6 fps, P1: 25.1 fps, max: 223 fps
1.47.22.14 D3D12
Intel Core i5-1235U 0.9GHz
Iris Xe G7 80EUs
min: 14.2 fps, P1: 19.7 fps, max: 420 fps
1.47.22.14 D3D12
Intel Core i5-1245U 1.2GHz
Iris Xe G7 80EUs
min: 9.6 fps, P1: 21.1 fps, max: 422 fps
1.47.22.14 D3D12, Dual-Channel
Intel Core i5-1135G7 2.4GHz
Iris Xe G7 80EUs
min: 15.9 fps, P1: 21.4 fps, max: 233 fps
1.47.22.14 D3D12
Intel Core i5-1335U 0.9GHz
Iris Xe G7 80EUs
min: 15.4 fps, P1: 24.5 fps, max: 274 fps
1.47.22.14 D3D12
Intel Core i5-1240P 1.2GHz
Iris Xe G7 80EUs
min: 15.5 fps, P1: 23.7 fps, max: 289 fps
1.47.22.14 D3D12
Intel Core i5-1335U 0.9GHz
Iris Xe G7 80EUs
min: 15.7 fps, P1: 23.7 fps, max: 194.6 fps
1.47.22.14 D3D12
Intel Core i5-1145G7 2.6GHz
Iris Xe G7 80EUs
min: 14.6 fps, P1: 21.1 fps, max: 257 fps
1.47.22.14 D3D12
Intel Core i5-1135G7 2.4GHz
Iris Xe G7 80EUs
min: 15.7 fps, P1: 21.3 fps, max: 236 fps
1.47.22.14 D3D12
Intel Core i5-1240P 1.2GHz
Iris Xe G7 80EUs
min: 14.9 fps, P1: 22.7 fps, max: 349 fps
1.47.22.14 D3D12
Intel Core i5-1235U 0.9GHz
Iris Xe G7 80EUs
min: 15.5 fps, P1: 22.1 fps, max: 393 fps
1.47.22.14 D3D12
Intel Core i5-1240P 1.2GHz
Iris Xe G7 80EUs
min: 16.1 fps, P1: 22.7 fps, max: 330 fps
1.47.22.14 D3D12
Intel Core i5-1235U 0.9GHz
Iris Xe G7 80EUs
min: 10.2 fps, P1: 24.3 fps, max: 233 fps
1.47.22.14 D3D12
Intel Core i5-1235U 0.9GHz
Iris Xe G7 80EUs
min: 15.4 fps, P1: 21.3 fps, max: 414 fps
1.47.22.14 D3D12
Intel Core i5-1235U 0.9GHz
Iris Xe G7 80EUs
min: 15.7 fps, P1: 23 fps, max: 433 fps
1.47.22.14 D3D12
Intel Core i5-1335U 0.9GHz
Iris Xe G7 80EUs
min: 16.2 fps, P1: 22.7 fps, max: 285 fps
1.47.22.14 D3D12
Intel Core i5-1345U 1.2GHz
Iris Xe G7 80EUs
min: 15.9 fps, P1: 22.2 fps, max: 358 fps
1.47.22.14 D3D12
Intel Core i5-1240P 1.2GHz
Iris Xe G7 80EUs
min: 16 fps, P1: 24.4 fps, max: 295 fps
1.47.22.14 D3D12
Intel Core i5-1135G7 2.4GHz
Iris Xe G7 80EUs
min: 13.3 fps, P1: 22.4 fps, max: 290 fps
1.47.22.14 D3D12
Intel Core i5-1240P 1.2GHz
Iris Xe G7 80EUs
min: 16.5 fps, P1: 23.1 fps, max: 337 fps
1.47.22.14 D3D12, Hoch
Intel Core i5-1240P 1.2GHz
Iris Xe G7 80EUs
min: 14.9 fps, P1: 23.3 fps, max: 346 fps
1.47.22.14 D3D12
Intel Core i5-12500H 1.8GHz
Iris Xe G7 80EUs
min: 16.4 fps, P1: 22.9 fps, max: 347 fps
1.47.22.14 D3D12
Intel Core i5-1335U 0.9GHz
Iris Xe G7 80EUs
min: 16.6 fps, P1: 22.7 fps, max: 240 fps
1.47.22.14 D3D12
Intel Core i5-1135G7 2.4GHz
Iris Xe G7 80EUs
min: 17.3 fps, P1: 24.2 fps, max: 288 fps
1.47.22.14 D3D12
Intel Core i5-1135G7 2.4GHz
Iris Xe G7 80EUs
min: 16.7 fps, P1: 22.9 fps, max: 297 fps
1.47.22.14 D3D12
Intel Core i5-1340P 1.4GHz
Iris Xe G7 80EUs
min: 9.1 fps, P1: 23.2 fps, max: 305 fps
1.47.22.14 D3D12
Intel Core i5-1335U 0.9GHz
Iris Xe G7 80EUs
min: 17.5 fps, P1: 26.6 fps, max: 286 fps
1.47.22.14 D3D12
Intel Core i5-1135G7 2.4GHz
Iris Xe G7 80EUs
min: 17.1 fps, P1: 23 fps, max: 360 fps
1.47.22.14 D3D12
Intel Core i5-1135G7 2.4GHz
Iris Xe G7 80EUs
min: 17.6 fps, P1: 27.6 fps, max: 393 fps
1.47.22.14 D3D12
Intel Core i5-1155G7 2.5GHz
Iris Xe G7 80EUs
min: 17.8 fps, P1: 24.1 fps, max: 279 fps
1.47.22.14 D3D12
Intel Core i5-1240P 1.2GHz
Iris Xe G7 80EUs
min: 12.7 fps, P1: 25.7 fps, max: 343 fps
1.47.22.14 D3D12
Intel Core i5-1135G7 2.4GHz
Iris Xe G7 80EUs
min: 15.9 fps, P1: 26.3 fps, max: 382 fps
1.47.22.14 D3D12
Intel Core i5-1335U 0.9GHz
Iris Xe G7 80EUs
min: 18.3 fps, P1: 26.9 fps, max: 208 fps
1.47.22.14 D3D12
Intel Core i5-1345U 1.2GHz
Iris Xe G7 80EUs
min: 10.9 fps, P1: 23.7 fps, max: 373 fps
1.47.22.14 D3D12
Intel Core i5-1135G7 2.4GHz
Iris Xe G7 80EUs
min: 18.5 fps, P1: 25.2 fps, max: 282 fps
1.47.22.14 D3D12
Intel Core i5-1345U 1.2GHz
Iris Xe G7 80EUs
min: 17.8 fps, P1: 25.1 fps, max: 356 fps
1.47.22.14 D3D12
Intel Core i5-1135G7 2.4GHz
Iris Xe G7 80EUs
min: 18.3 fps, P1: 29.9 fps, max: 368 fps
1.47.22.14 D3D12
Intel Core i5-1335U 0.9GHz
Iris Xe G7 80EUs
min: 17.7 fps, P1: 27.1 fps, max: 290 fps
1.47.22.14 D3D12
Intel Core i5-11300H 3.1GHz
Iris Xe G7 80EUs
min: 18.4 fps, P1: 27.8 fps, max: 329 fps
1.47.22.14 D3D12
Intel Core i5-1135G7 2.4GHz
Iris Xe G7 80EUs
min: 18.5 fps, P1: 27.2 fps, max: 319 fps
1.47.22.14 D3D12
Intel Core i5-1340P 1.4GHz
Iris Xe G7 80EUs
min: 18.2 fps, P1: 27.6 fps, max: 428 fps
1.47.22.14 D3D12
Intel Core i5-1135G7 2.4GHz
Iris Xe G7 80EUs
min: 18.2 fps, P1: 26.4 fps, max: 281 fps
1.47.22.14 D3D12
Intel Core i5-1135G7 2.4GHz
Iris Xe G7 80EUs
min: 18.4 fps, P1: 29.4 fps, max: 343 fps
1.47.22.14 D3D12
Intel Core i5-1335U 0.9GHz
Iris Xe G7 80EUs
min: 16.6 fps, P1: 25.5 fps, max: 387 fps
1.47.22.14 D3D12
Intel Core 5 120U 0.9GHz
Iris Xe G7 80EUs
min: 19.2 fps, P1: 27.3 fps, max: 374 fps
1.47.22.14 D3D12
Intel Core i5-1145G7 2.6GHz
Iris Xe G7 80EUs
min: 18.6 fps, P1: 27.1 fps, max: 320 fps
1.47.22.14 D3D12
Intel Core i5-1155G7 2.5GHz
Iris Xe G7 80EUs
min: 19.1 fps, P1: 28.1 fps, max: 424 fps
1.47.22.14 D3D12
Intel Core i5-1350P 1.4GHz
Iris Xe G7 80EUs
min: 15.1 fps, P1: 23.6 fps, max: 368 fps
1.47.22.14 D3D12
Intel Core i5-1135G7 2.4GHz
Iris Xe G7 80EUs
min: 17.3 fps, P1: 33.8 fps, max: 339 fps
1.47.22.14 D3D12
Intel Core i5-1135G7 2.4GHz
Iris Xe G7 80EUs
min: 16.1 fps, P1: 28.6 fps, max: 345 fps
1.47.22.14 D3D12
Intel Core i5-13500H 1.9GHz
Iris Xe G7 80EUs
min: 21.2 fps, P1: 36.7 fps, max: 442 fps
1.47.22.14 D3D12
AMD Ryzen 5 5500U 2.1GHz
GeForce GTX 1650 Mobile
min: 86.9 fps, P1: 125 fps, max: 249 fps
1.47.22.14 D3D12
AMD Ryzen 5 5500U @4GHz
GeForce GTX 1650 Mobile
min: 121 fps, P1: 152 fps, max: 255 fps
1.47.22.14 D3D12
AMD Ryzen 5 5500U @4GHz
GeForce GTX 1650 Mobile
min: 121 fps, P1: 152 fps, max: 255 fps
1.47.22.14 D3D12
AMD Ryzen 7 5800H 3.2GHz
GeForce GTX 1650 Mobile
min: 80.5 fps, P1: 143 fps, max: 350 fps
1.47.22.14 D3D12
Intel Core i7-10750H 2.6GHz
GeForce GTX 1650 Mobile
min: 17.1 fps, P1: 164 fps, max: 340 fps
1.47.22.14 D3D12
Intel Core i5-1230U 0.7GHz
Iris Xe G7 80EUs
min: 5 fps, P1: 5 fps, max: 98.8 fps
1.47.22.14 D3D12
Intel Core i7-1250U 0.8GHz
Iris Xe G7 80EUs
min: 5 fps, P1: 5 fps, max: 237 fps
1.47.22.14 D3D12
Intel Core i5-1135G7 2.4GHz
Iris Xe G7 80EUs
min: 5 fps, P1: 5.45 fps, max: 176 fps
1.47.22.14 D3D12
Intel Core i5-1135G7 2.4GHz
Iris Xe G7 80EUs
min: 5 fps, P1: 5.18 fps, max: 189 fps
1.47.22.14 D3D12
Intel Core i5-1135G7 2.4GHz
Iris Xe G7 80EUs
min: 5 fps, P1: 5.89 fps, max: 196.4 fps
1.47.22.14 D3D12
Intel Core i5-1135G7 2.4GHz
Iris Xe G7 80EUs
min: 5 fps, P1: 5.89 fps, max: 180 fps
1.47.22.14 D3D12
Intel Core i5-1135G7 2.4GHz
Iris Xe G7 80EUs
min: 5 fps, P1: 5.88 fps, max: 205 fps
1.47.22.14 D3D12
Intel Core i5-1135G7 2.4GHz
Iris Xe G7 80EUs
min: 5 fps, P1: 5 fps, max: 211 fps
1.47.22.14 D3D12
Intel Core i5-1135G7 2.4GHz
Iris Xe G7 80EUs
min: 5 fps, P1: 5.49 fps, max: 201 fps
1.47.22.14 D3D12
Intel Core i5-1135G7 2.4GHz
Iris Xe G7 80EUs
min: 5 fps, P1: 7.02 fps, max: 243 fps
1.47.22.14 D3D12
Intel Core i5-1135G7 2.4GHz
Iris Xe G7 80EUs
min: 5.5 fps, P1: 7.36 fps, max: 184 fps
1.47.22.14 D3D12
Intel Core i5-1135G7 2.4GHz
Iris Xe G7 80EUs
min: 5.9 fps, P1: 7.09 fps, max: 206 fps
1.47.22.14 D3D12
Intel Core i5-1135G7 2.4GHz
Iris Xe G7 80EUs
min: 5.9 fps, P1: 8.09 fps, max: 201 fps
1.47.22.14 D3D12
Intel Core i5-1130G7 1.8GHz
Iris Xe G7 80EUs
min: 6.3 fps, P1: 8.85 fps, max: 142 fps
1.47.22.14 D3D12
Intel Core i5-1240P 1.2GHz
Iris Xe G7 80EUs
min: 10 fps, P1: 11.8 fps, max: 119.3 fps
1.47.22.14 D3D12
Intel Core i5-1235U 0.9GHz
Iris Xe G7 80EUs
min: 5.4 fps, P1: 8.81 fps, max: 105.1 fps
1.47.22.14 D3D12
Intel Core i5-1240P 1.2GHz
Iris Xe G7 80EUs
min: 9.6 fps, P1: 12.5 fps, max: 131 fps
1.47.22.14 D3D12
Intel Core i5-1240P 1.2GHz
Iris Xe G7 80EUs
min: 9.1 fps, P1: 12.7 fps, max: 132.5 fps
1.47.22.14 D3D12
Intel Core i5-1135G7 2.4GHz
Iris Xe G7 80EUs
min: 6.5 fps, P1: 9.28 fps, max: 221 fps
1.47.22.14 D3D12
Intel Core i5-1135G7 2.4GHz
Iris Xe G7 80EUs
min: 7.6 fps, P1: 9.91 fps, max: 214 fps
1.47.22.14 D3D12
Intel Core i5-1135G7 2.4GHz
Iris Xe G7 80EUs
min: 5.5 fps, P1: 6.32 fps, max: 231 fps
1.47.22.14 D3D12
Intel Core i5-1135G7 2.4GHz
Iris Xe G7 80EUs
min: 8 fps, P1: 10.2 fps, max: 207 fps
1.47.22.14 D3D12
Intel Core i5-1240P 1.2GHz
Iris Xe G7 80EUs
min: 11.5 fps, P1: 14.1 fps, max: 140.2 fps
1.47.22.14 D3D12
Intel Core i5-1135G7 2.4GHz
Iris Xe G7 80EUs
min: 6.4 fps, P1: 10.2 fps, max: 207 fps
1.47.22.14 D3D12, Dual-Channel
Intel Core i5-1135G7 2.4GHz
Iris Xe G7 80EUs
min: 6.3 fps, P1: 9.66 fps, max: 200 fps
1.47.22.14 D3D12
Intel Core i5-1135G7 2.4GHz
Iris Xe G7 80EUs
min: 7.8 fps, P1: 11.1 fps, max: 200 fps
1.47.22.14 D3D12
Intel Core i5-1240P 1.2GHz
Iris Xe G7 80EUs
min: 6.8 fps, P1: 14.8 fps, max: 122.7 fps
1.47.22.14 D3D12
Intel Core i5-1135G7 2.4GHz
Iris Xe G7 80EUs
min: 6.7 fps, P1: 10.3 fps, max: 216 fps
1.47.22.14 D3D12
Intel Core i5-1235U 0.9GHz
Iris Xe G7 80EUs
min: 7 fps, P1: 12.6 fps, max: 227 fps
1.47.22.14 D3D12, Dual-Channel
Intel Core i5-1135G7 2.4GHz
Iris Xe G7 80EUs
min: 8.2 fps, P1: 12 fps, max: 201 fps
1.47.22.14 D3D12
Intel Core i5-1130G7 1.8GHz
Iris Xe G7 80EUs
min: 7.1 fps, P1: 13.5 fps, max: 215 fps
1.47.22.14 D3D12
Intel Core i5-1335U 0.9GHz
Iris Xe G7 80EUs
min: 7.9 fps, P1: 12.3 fps, max: 245 fps
1.47.22.14 D3D12
Intel Core i5-1240U 0.8GHz
Iris Xe G7 80EUs
min: 8.8 fps, P1: 14.7 fps, max: 206 fps
1.47.22.14 D3D12
Intel Core i5-1240P 1.2GHz
Iris Xe G7 80EUs
min: 11.5 fps, P1: 15.8 fps, max: 117.9 fps
1.47.22.14 D3D12
Intel Core i5-1345U 1.2GHz
Iris Xe G7 80EUs
min: 8.1 fps, P1: 12.9 fps, max: 213 fps
1.47.22.14 D3D12
Intel Core i5-1235U 0.9GHz
Iris Xe G7 80EUs
min: 9.1 fps, P1: 11.1 fps, max: 130.1 fps
1.47.22.14 D3D12
Intel Core i5-1135G7 2.4GHz
Iris Xe G7 80EUs
min: 6.5 fps, P1: 8.29 fps, max: 220 fps
1.47.22.14 D3D12
Intel Core i5-1335U 0.9GHz
Iris Xe G7 80EUs
min: 10.3 fps, P1: 15 fps, max: 173.4 fps
1.47.22.14 D3D12
Intel Core i5-1335U 0.9GHz
Iris Xe G7 80EUs
min: 9.9 fps, P1: 14.9 fps, max: 124.9 fps
1.47.22.14 D3D12
Intel Core i5-1245U 1.2GHz
Iris Xe G7 80EUs
min: 9.5 fps, P1: 16 fps, max: 238 fps
1.47.22.14 D3D12
Intel Core i5-1335U 0.9GHz
Iris Xe G7 80EUs
min: 7.6 fps, P1: 12.5 fps, max: 206 fps
1.47.22.14 D3D12
Intel Core i5-1235U 0.9GHz
Iris Xe G7 80EUs
min: 13.7 fps, P1: 17.1 fps, max: 201 fps
1.47.22.14 D3D12
Intel Core i5-1135G7 2.4GHz
Iris Xe G7 80EUs
min: 10.6 fps, P1: 16.5 fps, max: 153 fps
1.47.22.14 D3D12
Intel Core i5-1145G7 2.6GHz
Iris Xe G7 80EUs
min: 9.9 fps, P1: 16.7 fps, max: 166 fps
1.47.22.14 D3D12
Intel Core i5-1240P 1.2GHz
Iris Xe G7 80EUs
min: 10.4 fps, P1: 16.6 fps, max: 161 fps
1.47.22.14 D3D12
Intel Core i5-1235U 0.9GHz
Iris Xe G7 80EUs
min: 10 fps, P1: 16.9 fps, max: 145.7 fps
1.47.22.14 D3D12
Intel Core i5-1135G7 2.4GHz
Iris Xe G7 80EUs
min: 9.7 fps, P1: 16.6 fps, max: 202 fps
1.47.22.14 D3D12
Intel Core i5-1235U 0.9GHz
Iris Xe G7 80EUs
min: 14.2 fps, P1: 17 fps, max: 204 fps
1.47.22.14 D3D12
Intel Core i5-1240P 1.2GHz
Iris Xe G7 80EUs
min: 7.3 fps, P1: 12 fps, max: 200 fps
1.47.22.14 D3D12
Intel Core i5-1135G7 2.4GHz
Iris Xe G7 80EUs
min: 10.6 fps, P1: 17.9 fps, max: 172 fps
1.47.22.14 D3D12, Hoch
Intel Core i5-1240P 1.2GHz
Iris Xe G7 80EUs
min: 11.9 fps, P1: 17.7 fps, max: 176.8 fps
1.47.22.14 D3D12
Intel Core i5-1240P 1.2GHz
Iris Xe G7 80EUs
min: 11.6 fps, P1: 17.4 fps, max: 163.6 fps
1.47.22.14 D3D12
Intel Core i5-1340P 1.4GHz
Iris Xe G7 80EUs
min: 9.2 fps, P1: 15.6 fps, max: 239 fps
1.47.22.14 D3D12
Intel Core i5-1335U 0.9GHz
Iris Xe G7 80EUs
min: 8.1 fps, P1: 17.8 fps, max: 149.7 fps
1.47.22.14 D3D12
Intel Core i5-1135G7 2.4GHz
Iris Xe G7 80EUs
min: 7.8 fps, P1: 8.65 fps, max: 349 fps
1.47.22.14 D3D12
Intel Core i5-1235U 0.9GHz
Iris Xe G7 80EUs
min: 11.1 fps, P1: 18.2 fps, max: 147.1 fps
1.47.22.14 D3D12
Intel Core i5-1345U 1.2GHz
Iris Xe G7 80EUs
min: 7.9 fps, P1: 17.6 fps, max: 155.3 fps
1.47.22.14 D3D12
Intel Core i5-12500H 1.8GHz
Iris Xe G7 80EUs
min: 17.7 fps, P1: 19.3 fps, max: 178.9 fps
1.47.22.14 D3D12
Intel Core i5-1135G7 2.4GHz
Iris Xe G7 80EUs
min: 8.1 fps, P1: 11.5 fps, max: 197.5 fps
1.47.22.14 D3D12
Intel Core i5-1335U 0.9GHz
Iris Xe G7 80EUs
min: 10.8 fps, P1: 18.4 fps, max: 177.8 fps
1.47.22.14 D3D12
Intel Core i5-1345U 1.2GHz
Iris Xe G7 80EUs
min: 11.5 fps, P1: 18.6 fps, max: 210 fps
1.47.22.14 D3D12
Intel Core i5-1340P 1.4GHz
Iris Xe G7 80EUs
min: 12 fps, P1: 19.5 fps, max: 225 fps
1.47.22.14 D3D12
Intel Core i5-1135G7 2.4GHz
Iris Xe G7 80EUs
min: 12.3 fps, P1: 18.8 fps, max: 182 fps
1.47.22.14 D3D12
Intel Core i5-11300H 3.1GHz
Iris Xe G7 80EUs
min: 12.2 fps, P1: 19.7 fps, max: 203 fps
1.47.22.14 D3D12
Intel Core i5-1335U 0.9GHz
Iris Xe G7 80EUs
min: 12 fps, P1: 19.9 fps, max: 190.6 fps
1.47.22.14 D3D12
Intel Core i5-1135G7 2.4GHz
Iris Xe G7 80EUs
min: 11.9 fps, P1: 20.2 fps, max: 165.5 fps
1.47.22.14 D3D12
Intel Core i5-1335U 0.9GHz
Iris Xe G7 80EUs
min: 11.7 fps, P1: 19.7 fps, max: 151.5 fps
1.47.22.14 D3D12
Intel Core i5-1135G7 2.4GHz
Iris Xe G7 80EUs
min: 9.2 fps, P1: 17.4 fps, max: 223 fps
1.47.22.14 D3D12
Intel Core i5-1155G7 2.5GHz
Iris Xe G7 80EUs
min: 10.1 fps, P1: 13.6 fps, max: 238 fps
1.47.22.14 D3D12
Intel Core i5-1135G7 2.4GHz
Iris Xe G7 80EUs
min: 17.6 fps, P1: 21.3 fps, max: 145 fps
1.47.22.14 D3D12
Intel Core 5 120U 0.9GHz
Iris Xe G7 80EUs
min: 12.8 fps, P1: 20.8 fps, max: 141.1 fps
1.47.22.14 D3D12
Intel Core i5-1135G7 2.4GHz
Iris Xe G7 80EUs
min: 12.9 fps, P1: 20.1 fps, max: 165 fps
1.47.22.14 D3D12
Intel Core i5-1155G7 2.5GHz
Iris Xe G7 80EUs
min: 12.9 fps, P1: 20.4 fps, max: 213 fps
1.47.22.14 D3D12
Intel Core i5-1135G7 2.4GHz
Iris Xe G7 80EUs
min: 8 fps, P1: 10.5 fps, max: 317 fps
1.47.22.14 D3D12
Intel Core i5-1145G7 2.6GHz
Iris Xe G7 80EUs
min: 12.6 fps, P1: 20.5 fps, max: 201 fps
1.47.22.14 D3D12
Intel Core i5-1135G7 2.4GHz
Iris Xe G7 80EUs
min: 8.1 fps, P1: 9.59 fps, max: 309 fps
1.47.22.14 D3D12
Intel Core i5-1155G7 2.5GHz
Iris Xe G7 80EUs
min: 14.4 fps, P1: 21.1 fps, max: 189.6 fps
1.47.22.14 D3D12
Intel Core i5-1350P 1.4GHz
Iris Xe G7 80EUs
min: 15.2 fps, P1: 23.6 fps, max: 137.4 fps
1.47.22.14 D3D12
Intel Core i5-13500H 1.9GHz
Iris Xe G7 80EUs
min: 10.8 fps, P1: 22.7 fps, max: 252 fps
Intel Core i5-1335U 0.9GHz
Iris Xe G7 80EUs
min: 5.8 fps, max: 202 fps
1.47.22.14 D3D12
AMD Ryzen 7 5800H 3.2GHz
GeForce GTX 1650 Mobile
min: 60.2 fps, P1: 64.7 fps, max: 94.9 fps
1.47.22.14 D3D12
AMD Ryzen 5 5500U 2.1GHz
GeForce GTX 1650 Mobile
min: 38.3 fps, P1: 64 fps, max: 139 fps
1.47.22.14 D3D12
Intel Core i7-10750H 2.6GHz
GeForce GTX 1650 Mobile
min: 23.6 fps, P1: 62.3 fps, max: 180 fps
1.47.22.14 D3D12
AMD Ryzen 5 5500U @4GHz
GeForce GTX 1650 Mobile
min: 61.3 fps, P1: 79.1 fps, max: 125 fps
1.47.22.14 D3D12
AMD Ryzen 5 5500U @4GHz
GeForce GTX 1650 Mobile
min: 61.3 fps, P1: 79.1 fps, max: 125 fps
1.47.22.14 D3D12
Intel Core i5-1135G7 2.4GHz
Iris Xe G7 80EUs
min: 5 fps, P1: 5 fps, max: 165.5 fps
1.47.22.14 D3D12
Intel Core i5-1135G7 2.4GHz
Iris Xe G7 80EUs
min: 5 fps, P1: 5 fps, max: 158 fps
1.47.22.14 D3D12
Intel Core i5-1135G7 2.4GHz
Iris Xe G7 80EUs
min: 5 fps, P1: 5 fps, max: 170 fps
1.47.22.14 D3D12
Intel Core i5-1135G7 2.4GHz
Iris Xe G7 80EUs
min: 5 fps, P1: 5 fps, max: 191 fps
1.47.22.14 D3D12
Intel Core i5-1135G7 2.4GHz
Iris Xe G7 80EUs
min: 5 fps, P1: 5 fps, max: 187 fps
1.47.22.14 D3D12
Intel Core i5-1135G7 2.4GHz
Iris Xe G7 80EUs
min: 5 fps, P1: 5 fps, max: 199 fps
1.47.22.14 D3D12
Intel Core i5-1135G7 2.4GHz
Iris Xe G7 80EUs
min: 5 fps, P1: 5 fps, max: 148 fps
1.47.22.14 D3D12
Intel Core i5-1135G7 2.4GHz
Iris Xe G7 80EUs
min: 5 fps, P1: 5 fps, max: 245 fps
1.47.22.14 D3D12
Intel Core i5-1130G7 1.8GHz
Iris Xe G7 80EUs
min: 5 fps, P1: 6.12 fps, max: 145 fps
1.47.22.14 D3D12
Intel Core i5-1135G7 2.4GHz
Iris Xe G7 80EUs
min: 5 fps, P1: 5 fps, max: 172 fps
1.47.22.14 D3D12
Intel Core i5-1135G7 2.4GHz
Iris Xe G7 80EUs
min: 5 fps, P1: 5.58 fps, max: 153 fps
1.47.22.14 D3D12
Intel Core i5-1135G7 2.4GHz
Iris Xe G7 80EUs
min: 5 fps, P1: 5.63 fps, max: 175 fps
1.47.22.14 D3D12
Intel Core i5-1240P 1.2GHz
Iris Xe G7 80EUs
min: 6.5 fps, P1: 8.45 fps, max: 141.8 fps
1.47.22.14 D3D12
Intel Core i5-1230U 0.7GHz
Iris Xe G7 80EUs
min: 6.6 fps, P1: 9.19 fps, max: 148.7 fps
1.47.22.14 D3D12
Intel Core i5-1235U 0.9GHz
Iris Xe G7 80EUs
min: 5 fps, P1: 5.9 fps, max: 101.6 fps
Intel Core i5-1335U 0.9GHz
Iris Xe G7 80EUs
min: 5 fps, max: 184 fps
1.47.22.14 D3D12
Intel Core i5-1135G7 2.4GHz
Iris Xe G7 80EUs
min: 5.7 fps, P1: 7.28 fps, max: 214 fps
1.47.22.14 D3D12
Intel Core i5-1135G7 2.4GHz
Iris Xe G7 80EUs
min: 5.7 fps, P1: 7.35 fps, max: 204 fps
1.47.22.14 D3D12
Intel Core i5-1135G7 2.4GHz
Iris Xe G7 80EUs
min: 5.6 fps, P1: 7.51 fps, max: 196.5 fps
1.47.22.14 D3D12
Intel Core i5-1240P 1.2GHz
Iris Xe G7 80EUs
min: 10.1 fps, P1: 11.3 fps, max: 125.1 fps
1.47.22.14 D3D12
Intel Core i5-1135G7 2.4GHz
Iris Xe G7 80EUs
min: 5 fps, P1: 5.29 fps, max: 233 fps
1.47.22.14 D3D12
Intel Core i5-1240P 1.2GHz
Iris Xe G7 80EUs
min: 6.8 fps, P1: 11 fps, max: 131.6 fps
1.47.22.14 D3D12
Intel Core i5-1240P 1.2GHz
Iris Xe G7 80EUs
min: 7.2 fps, P1: 11 fps, max: 154.3 fps
1.47.22.14 D3D12
Intel Core i5-1135G7 2.4GHz
Iris Xe G7 80EUs
min: 5.5 fps, P1: 7.46 fps, max: 214 fps
1.47.22.14 D3D12
Intel Core i5-1135G7 2.4GHz
Iris Xe G7 80EUs
min: 5.9 fps, P1: 7.88 fps, max: 185 fps
1.47.22.14 D3D12, Dual-Channel
Intel Core i5-1135G7 2.4GHz
Iris Xe G7 80EUs
min: 5.7 fps, P1: 7.57 fps, max: 179 fps
1.47.22.14 D3D12
Intel Core i5-1235U 0.9GHz
Iris Xe G7 80EUs
min: 5 fps, P1: 7.98 fps, max: 254 fps
1.47.22.14 D3D12
Intel Core i5-1240U 0.8GHz
Iris Xe G7 80EUs
min: 5 fps, P1: 7.65 fps, max: 232 fps
1.47.22.14 D3D12
Intel Core i5-1130G7 1.8GHz
Iris Xe G7 80EUs
min: 5.7 fps, P1: 7.54 fps, max: 244 fps
1.47.22.14 D3D12, Dual-Channel
Intel Core i5-1135G7 2.4GHz
Iris Xe G7 80EUs
min: 5.5 fps, P1: 8.17 fps, max: 203 fps
1.47.22.14 D3D12
Intel Core i5-1335U 0.9GHz
Iris Xe G7 80EUs
min: 5.4 fps, P1: 7.66 fps, max: 153.8 fps
1.47.22.14 D3D12
Intel Core i5-1240P 1.2GHz
Iris Xe G7 80EUs
min: 9.2 fps, P1: 12.1 fps, max: 141 fps
1.47.22.14 D3D12
Intel Core i5-1135G7 2.4GHz
Iris Xe G7 80EUs
min: 5.5 fps, P1: 8.28 fps, max: 185.3 fps
1.47.22.14 D3D12
Intel Core i5-1335U 0.9GHz
Iris Xe G7 80EUs
min: 5.7 fps, P1: 7.62 fps, max: 258 fps
1.47.22.14 D3D12
Intel Core i5-1235U 0.9GHz
Iris Xe G7 80EUs
min: 5.7 fps, P1: 7.84 fps, max: 142.4 fps
1.47.22.14 D3D12
Intel Core i5-1240P 1.2GHz
Iris Xe G7 80EUs
min: 8.3 fps, P1: 12.4 fps, max: 132 fps
1.47.22.14 D3D12
Intel Core i5-1345U 1.2GHz
Iris Xe G7 80EUs
min: 6.2 fps, P1: 8.42 fps, max: 227 fps
1.47.22.14 D3D12
Intel Core i5-1135G7 2.4GHz
Iris Xe G7 80EUs
min: 5.3 fps, P1: 6.14 fps, max: 239 fps
1.47.22.14 D3D12
Intel Core i5-1245U 1.2GHz
Iris Xe G7 80EUs
min: 5.8 fps, P1: 8.9 fps, max: 317 fps
1.47.22.14 D3D12
Intel Core i5-1335U 0.9GHz
Iris Xe G7 80EUs
min: 6.3 fps, P1: 8.44 fps, max: 276 fps
1.47.22.14 D3D12
Intel Core i5-1235U 0.9GHz
Iris Xe G7 80EUs
min: 8.2 fps, P1: 13.1 fps, max: 153 fps
1.47.22.14 D3D12
Intel Core i5-1235U 0.9GHz
Iris Xe G7 80EUs
min: 7.2 fps, P1: 9.24 fps, max: 182 fps
1.47.22.14 D3D12
Intel Core i5-1235U 0.9GHz
Iris Xe G7 80EUs
min: 6.9 fps, P1: 12.5 fps, max: 217 fps
1.47.22.14 D3D12
Intel Core i5-1240P 1.2GHz
Iris Xe G7 80EUs
min: 8.4 fps, P1: 13.2 fps, max: 134.9 fps
1.47.22.14 D3D12
Intel Core i5-1335U 0.9GHz
Iris Xe G7 80EUs
min: 6.2 fps, P1: 8.6 fps, max: 242 fps
1.47.22.14 D3D12
Intel Core i5-1145G7 2.6GHz
Iris Xe G7 80EUs
min: 7.7 fps, P1: 9.95 fps, max: 143 fps
1.47.22.14 D3D12
Intel Core i5-1135G7 2.4GHz
Iris Xe G7 80EUs
min: 6.2 fps, P1: 9.3 fps, max: 191 fps
1.47.22.14 D3D12
Intel Core i5-1135G7 2.4GHz
Iris Xe G7 80EUs
min: 5.1 fps, P1: 8.82 fps, max: 235 fps
1.47.22.14 D3D12, Hoch
Intel Core i5-1240P 1.2GHz
Iris Xe G7 80EUs
min: 11.6 fps, P1: 14.2 fps, max: 149.3 fps
1.47.22.14 D3D12
Intel Core i5-1135G7 2.4GHz
Iris Xe G7 80EUs
min: 5 fps, P1: 6.81 fps, max: 337 fps
1.47.22.14 D3D12
Intel Core i5-1240P 1.2GHz
Iris Xe G7 80EUs
min: 5.1 fps, P1: 8.77 fps, max: 314 fps
1.47.22.14 D3D12
Intel Core i5-1235U 0.9GHz
Iris Xe G7 80EUs
min: 5 fps, P1: 8.18 fps, max: 135.1 fps
1.47.22.14 D3D12
Intel Core i5-1240P 1.2GHz
Iris Xe G7 80EUs
min: 8.7 fps, P1: 14.1 fps, max: 158.9 fps
1.47.22.14 D3D12
Intel Core i5-1335U 0.9GHz
Iris Xe G7 80EUs
min: 5.8 fps, P1: 8.74 fps, max: 145.9 fps
1.47.22.14 D3D12
Intel Core i5-12500H 1.8GHz
Iris Xe G7 80EUs
min: 9 fps, P1: 14.7 fps, max: 185.6 fps
1.47.22.14 D3D12
Intel Core i5-1335U 0.9GHz
Iris Xe G7 80EUs
min: 7.2 fps, P1: 9.3 fps, max: 146.7 fps
1.47.22.14 D3D12
Intel Core i5-1345U 1.2GHz
Iris Xe G7 80EUs
min: 6.5 fps, P1: 9.4 fps, max: 161.2 fps
1.47.22.14 D3D12
Intel Core i5-1135G7 2.4GHz
Iris Xe G7 80EUs
min: 6.1 fps, P1: 9.74 fps, max: 158 fps
1.47.22.14 D3D12
Intel Core i5-1135G7 2.4GHz
Iris Xe G7 80EUs
min: 6.4 fps, P1: 9.41 fps, max: 198.7 fps
1.47.22.14 D3D12
Intel Core i5-1345U 1.2GHz
Iris Xe G7 80EUs
min: 6.9 fps, P1: 12.5 fps, max: 249 fps
1.47.22.14 D3D12
Intel Core i5-1335U 0.9GHz
Iris Xe G7 80EUs
min: 7.6 fps, P1: 10.7 fps, max: 180.3 fps
1.47.22.14 D3D12
Intel Core i5-1135G7 2.4GHz
Iris Xe G7 80EUs
min: 7.2 fps, P1: 13.6 fps, max: 133 fps
1.47.22.14 D3D12
Intel Core i5-1135G7 2.4GHz
Iris Xe G7 80EUs
min: 7.9 fps, P1: 10.2 fps, max: 159.5 fps
1.47.22.14 D3D12
Intel Core i5-11300H 3.1GHz
Iris Xe G7 80EUs
min: 9.1 fps, P1: 14.1 fps, max: 202 fps
1.47.22.14 D3D12
Intel Core i5-1335U 0.9GHz
Iris Xe G7 80EUs
min: 7.7 fps, P1: 13 fps, max: 142.4 fps
1.47.22.14 D3D12
Intel Core i5-1135G7 2.4GHz
Iris Xe G7 80EUs
min: 9 fps, P1: 11.3 fps, max: 199 fps
1.47.22.14 D3D12
Intel Core i5-1135G7 2.4GHz
Iris Xe G7 80EUs
min: 5.1 fps, P1: 7.1 fps, max: 328 fps
1.47.22.14 D3D12
Intel Core i5-1135G7 2.4GHz
Iris Xe G7 80EUs
min: 8.2 fps, P1: 16.1 fps, max: 143 fps
1.47.22.14 D3D12
Intel Core i5-1135G7 2.4GHz
Iris Xe G7 80EUs
min: 6.2 fps, P1: 11.2 fps, max: 251 fps
1.47.22.14 D3D12
Intel Core i5-1135G7 2.4GHz
Iris Xe G7 80EUs
min: 5.3 fps, P1: 7.35 fps, max: 274 fps
1.47.22.14 D3D12
Intel Core 5 120U 0.9GHz
Iris Xe G7 80EUs
min: 6.4 fps, P1: 14.3 fps, max: 253 fps
1.47.22.14 D3D12
Intel Core i5-1155G7 2.5GHz
Iris Xe G7 80EUs
min: 7.6 fps, P1: 10.4 fps, max: 212 fps
1.47.22.14 D3D12
Intel Core i5-1155G7 2.5GHz
Iris Xe G7 80EUs
min: 10.4 fps, P1: 14.9 fps, max: 201 fps
1.47.22.14 D3D12
Intel Core i5-1155G7 2.5GHz
Iris Xe G7 80EUs
min: 10.1 fps, P1: 13.8 fps, max: 192.2 fps
1.47.22.14 D3D12
Intel Core i5-1350P 1.4GHz
Iris Xe G7 80EUs
min: 5 fps, P1: 12.6 fps, max: 250 fps
1.47.22.14 D3D12
Intel Core i5-13500H 1.9GHz
Iris Xe G7 80EUs
min: 8.2 fps, P1: 17 fps, max: 261 fps
1.47.22.14 D3D12
AMD Ryzen 7 5800H 3.2GHz
GeForce GTX 1650 Mobile
min: 40.7 fps, P1: 47.3 fps, max: 87.1 fps
1.47.22.14 D3D12
AMD Ryzen 5 5500U 2.1GHz
GeForce GTX 1650 Mobile
min: 45.7 fps, P1: 48.2 fps, max: 87.7 fps
1.47.22.14 D3D12
Intel Core i7-10750H 2.6GHz
GeForce GTX 1650 Mobile
min: 44.3 fps, P1: 46.9 fps, max: 97.7 fps
1.47.22.14 D3D12
AMD Ryzen 5 5500U @4GHz
GeForce GTX 1650 Mobile
min: 53.2 fps, P1: 57.8 fps, max: 108 fps
1.47.22.14 D3D12
AMD Ryzen 5 5500U @4GHz
GeForce GTX 1650 Mobile
min: 53.2 fps, P1: 57.8 fps, max: 108 fps
1.47.22.14 D3D12
Intel Core i5-1130G7 1.8GHz
Iris Xe G7 80EUs
min: 5 fps, P1: 5 fps, max: 163 fps
1.47.22.14 D3D12
Intel Core i5-1240P 1.2GHz
Iris Xe G7 80EUs
min: 5 fps, P1: 5.01 fps, max: 145.2 fps
1.47.22.14 D3D12
Intel Core i5-1135G7 2.4GHz
Iris Xe G7 80EUs
min: 5 fps, P1: 5 fps, max: 168 fps
1.47.22.14 D3D12
Intel Core i5-1135G7 2.4GHz
Iris Xe G7 80EUs
min: 5 fps, P1: 5 fps, max: 211 fps
1.47.22.14 D3D12
Intel Core i5-1235U 0.9GHz
Iris Xe G7 80EUs
min: 5 fps, P1: 5 fps, max: 98.9 fps
1.47.22.14 D3D12
Intel Core i5-1135G7 2.4GHz
Iris Xe G7 80EUs
min: 5 fps, P1: 5 fps, max: 231 fps
1.47.22.14 D3D12
Intel Core i5-1135G7 2.4GHz
Iris Xe G7 80EUs
min: 5 fps, P1: 5 fps, max: 264 fps
1.47.22.14 D3D12
Intel Core i5-1135G7 2.4GHz
Iris Xe G7 80EUs
min: 5 fps, P1: 5 fps, max: 192 fps
1.47.22.14 D3D12
Intel Core i5-1335U 0.9GHz
Iris Xe G7 80EUs
min: 5 fps, P1: 5 fps, max: 187.9 fps
1.47.22.14 D3D12, Dual-Channel
Intel Core i5-1135G7 2.4GHz
Iris Xe G7 80EUs
min: 5 fps, P1: 5 fps, max: 201 fps
1.47.22.14 D3D12
Intel Core i5-1135G7 2.4GHz
Iris Xe G7 80EUs
min: 5 fps, P1: 5 fps, max: 203 fps
1.47.22.14 D3D12
Intel Core i5-1235U 0.9GHz
Iris Xe G7 80EUs
min: 5 fps, P1: 5 fps, max: 336 fps
1.47.22.14 D3D12
Intel Core i5-1235U 0.9GHz
Iris Xe G7 80EUs
min: 5 fps, P1: 5 fps, max: 213 fps
1.47.22.14 D3D12, Dual-Channel
Intel Core i5-1135G7 2.4GHz
Iris Xe G7 80EUs
min: 5 fps, P1: 5 fps, max: 219 fps
1.47.22.14 D3D12
Intel Core i5-1240U 0.8GHz
Iris Xe G7 80EUs
min: 5 fps, P1: 5 fps, max: 279 fps
1.47.22.14 D3D12
Intel Core i5-1240P 1.2GHz
Iris Xe G7 80EUs
min: 5.1 fps, P1: 6.22 fps, max: 152 fps
1.47.22.14 D3D12
Intel Core i5-1130G7 1.8GHz
Iris Xe G7 80EUs
min: 5 fps, P1: 5 fps, max: 237 fps
1.47.22.14 D3D12
Intel Core i5-1335U 0.9GHz
Iris Xe G7 80EUs
min: 5 fps, P1: 5 fps, max: 315 fps
1.47.22.14 D3D12
Intel Core i5-1345U 1.2GHz
Iris Xe G7 80EUs
min: 5 fps, P1: 5 fps, max: 272 fps
1.47.22.14 D3D12
Intel Core i5-1245U 1.2GHz
Iris Xe G7 80EUs
min: 5 fps, P1: 5 fps, max: 316 fps
1.47.22.14 D3D12
Intel Core i5-1240P 1.2GHz
Iris Xe G7 80EUs
min: 6 fps, P1: 7.2 fps, max: 181.6 fps
1.47.22.14 D3D12
Intel Core i5-1335U 0.9GHz
Iris Xe G7 80EUs
min: 5 fps, P1: 5 fps, max: 345 fps
1.47.22.14 D3D12
Intel Core i5-1135G7 2.4GHz
Iris Xe G7 80EUs
min: 5 fps, P1: 5 fps, max: 281 fps
1.47.22.14 D3D12
Intel Core i5-1235U 0.9GHz
Iris Xe G7 80EUs
min: 6.2 fps, P1: 6.97 fps, max: 162.5 fps
1.47.22.14 D3D12
Intel Core i5-1235U 0.9GHz
Iris Xe G7 80EUs
min: 5.2 fps, P1: 6.87 fps, max: 149.7 fps
1.47.22.14 D3D12
Intel Core i5-1235U 0.9GHz
Iris Xe G7 80EUs
min: 5.5 fps, P1: 7.13 fps, max: 259 fps
1.47.22.14 D3D12
Intel Core i5-1235U 0.9GHz
Iris Xe G7 80EUs
min: 5 fps, P1: 5 fps, max: 194 fps
1.47.22.14 D3D12
Intel Core i5-1335U 0.9GHz
Iris Xe G7 80EUs
min: 5 fps, P1: 5 fps, max: 318 fps
1.47.22.14 D3D12
Intel Core i5-1135G7 2.4GHz
Iris Xe G7 80EUs
min: 5 fps, P1: 5 fps, max: 288 fps
1.47.22.14 D3D12
Intel Core i5-1145G7 2.6GHz
Iris Xe G7 80EUs
min: 5 fps, P1: 5 fps, max: 191 fps
1.47.22.14 D3D12
Intel Core i5-1135G7 2.4GHz
Iris Xe G7 80EUs
min: 5 fps, P1: 5.2 fps, max: 231 fps
1.47.22.14 D3D12
Intel Core i5-1240P 1.2GHz
Iris Xe G7 80EUs
min: 6.4 fps, P1: 7.32 fps, max: 188.1 fps
1.47.22.14 D3D12, Hoch
Intel Core i5-1240P 1.2GHz
Iris Xe G7 80EUs
min: 6.5 fps, P1: 7.66 fps, max: 199.9 fps
1.47.22.14 D3D12
Intel Core i5-1240P 1.2GHz
Iris Xe G7 80EUs
min: 5 fps, P1: 5.03 fps, max: 297 fps
1.47.22.14 D3D12
Intel Core i5-1335U 0.9GHz
Iris Xe G7 80EUs
min: 5 fps, P1: 5.13 fps, max: 169.6 fps
1.47.22.14 D3D12
Intel Core i5-12500H 1.8GHz
Iris Xe G7 80EUs
min: 5.1 fps, P1: 7.28 fps, max: 266 fps
1.47.22.14 D3D12
Intel Core i5-1335U 0.9GHz
Iris Xe G7 80EUs
min: 5 fps, P1: 5.12 fps, max: 194.8 fps
1.47.22.14 D3D12
Intel Core i5-1345U 1.2GHz
Iris Xe G7 80EUs
min: 5 fps, P1: 5.02 fps, max: 181.9 fps
1.47.22.14 D3D12
Intel Core i5-1335U 0.9GHz
Iris Xe G7 80EUs
min: 5 fps, P1: 6.51 fps, max: 253 fps
1.47.22.14 D3D12
Intel Core i5-1345U 1.2GHz
Iris Xe G7 80EUs
min: 5 fps, P1: 6.24 fps, max: 289 fps
1.47.22.14 D3D12
Intel Core i5-1335U 0.9GHz
Iris Xe G7 80EUs
min: 5 fps, P1: 6.24 fps, max: 272 fps
1.47.22.14 D3D12
Intel Core i5-11300H 3.1GHz
Iris Xe G7 80EUs
min: 5 fps, P1: 6.49 fps, max: 228 fps
1.47.22.14 D3D12
Intel Core i5-1135G7 2.4GHz
Iris Xe G7 80EUs
min: 5 fps, P1: 5.5 fps, max: 355 fps
1.47.22.14 D3D12
Intel Core 5 120U 0.9GHz
Iris Xe G7 80EUs
min: 5 fps, P1: 5.93 fps, max: 261 fps
1.47.22.14 D3D12
Intel Core i5-1135G7 2.4GHz
Iris Xe G7 80EUs
min: 5 fps, P1: 5.65 fps, max: 312 fps
1.47.22.14 D3D12
Intel Core i5-1135G7 2.4GHz
Iris Xe G7 80EUs
min: 5 fps, P1: 7.93 fps, max: 196 fps
1.47.22.14 D3D12
Intel Core i5-1135G7 2.4GHz
Iris Xe G7 80EUs
min: 5 fps, P1: 5.78 fps, max: 305 fps
1.47.22.14 D3D12
Intel Core i5-1155G7 2.5GHz
Iris Xe G7 80EUs
min: 6.1 fps, P1: 6.52 fps, max: 241 fps
1.47.22.14 D3D12
Intel Core i5-1155G7 2.5GHz
Iris Xe G7 80EUs
min: 6.4 fps, P1: 7.66 fps, max: 224 fps
1.47.22.14 D3D12
Intel Core i5-1155G7 2.5GHz
Iris Xe G7 80EUs
min: 6.1 fps, P1: 8.11 fps, max: 248 fps
1.47.22.14 D3D12
Intel Core i5-1155G7 2.5GHz
Iris Xe G7 80EUs
min: 6.1 fps, P1: 8.11 fps, max: 248 fps
1.47.22.14 D3D12
Intel Core i5-1350P 1.4GHz
Iris Xe G7 80EUs
min: 5.1 fps, P1: 7.53 fps, max: 343 fps
1.47.22.14 D3D12
Intel Core i5-13500H 1.9GHz
Iris Xe G7 80EUs
min: 5.2 fps, P1: 9.1 fps, max: 326 fps
1.47.22.14 D3D12
AMD Ryzen 7 5800H 3.2GHz
GeForce GTX 1650 Mobile
min: 37.5 fps, P1: 40.1 fps, max: 65.1 fps
1.47.22.14 D3D12
AMD Ryzen 5 5500U 2.1GHz
GeForce GTX 1650 Mobile
min: 39.4 fps, P1: 41.5 fps, max: 72.8 fps
1.47.22.14 D3D12
Intel Core i7-10750H 2.6GHz
GeForce GTX 1650 Mobile
min: 30.2 fps, P1: 41.8 fps, max: 139 fps
1.47.22.14 D3D12
AMD Ryzen 5 5500U @4GHz
GeForce GTX 1650 Mobile
min: 47.2 fps, P1: 49.7 fps, max: 87 fps
1.47.22.14 D3D12
AMD Ryzen 5 5500U @4GHz
GeForce GTX 1650 Mobile
min: 47.2 fps, P1: 49.7 fps, max: 87 fps
1.47.22.14 D3D12
Intel Core i5-1240P 1.2GHz
Iris Xe G7 80EUs
min: 5 fps, P1: 5.72 fps, max: 217 fps
1.47.22.14 D3D12
Intel Core i5-1335U 0.9GHz
Iris Xe G7 80EUs
min: 5 fps, P1: 5 fps, max: 279 fps

F1 2018
2018
Monster Hunter World
2018
The Crew 2
2018
Far Cry 5
2018Intel Core i5-1135G7 2.4GHz
Iris Xe G7 80EUs
min: 7 fps, max: 30 fps
Intel Core i5-1135G7 2.4GHz
Iris Xe G7 80EUs
min: 23 fps, max: 37 fps
Intel Core i5-1240P 1.2GHz
Iris Xe G7 80EUs
min: 22 fps, max: 34 fps
Intel Core i5-1135G7 2.4GHz
Iris Xe G7 80EUs
min: 29 fps, max: 41 fps
Intel Core i5-1335U 0.9GHz
Iris Xe G7 80EUs
min: 35 fps, max: 46 fps
Intel Core i5-1135G7 2.4GHz
Iris Xe G7 80EUs
min: 36 fps, max: 50 fps
Intel Core i5-1135G7 2.4GHz
Iris Xe G7 80EUs
min: 38 fps, max: 54 fps
Intel Core i5-1145G7 2.6GHz
Iris Xe G7 80EUs
min: 28 fps, max: 60 fps
Intel Core i5-1245U 1.2GHz
Iris Xe G7 80EUs
min: 46 fps, max: 57 fps
Intel Core i5-1135G7 2.4GHz
Iris Xe G7 80EUs
min: 43 fps, max: 66 fps
Intel Core i5-13500H 1.9GHz
Iris Xe G7 80EUs
min: 57 fps, max: 71 fps
AMD Ryzen 5 5500U @4GHz
GeForce GTX 1650 Mobile
min: 8 fps, max: 102 fps
Intel Core i7-10750H 2.6GHz
GeForce GTX 1650 Mobile
min: 92 fps, max: 131 fps
Intel Core i5-1240P 1.2GHz
Iris Xe G7 80EUs
min: 7 fps, max: 16 fps
Intel Core i5-1135G7 2.4GHz
Iris Xe G7 80EUs
min: 16 fps, max: 22 fps
Intel Core i5-1335U 0.9GHz
Iris Xe G7 80EUs
min: 18 fps, max: 23 fps
Intel Core i5-1135G7 2.4GHz
Iris Xe G7 80EUs
min: 20 fps, max: 27 fps
Intel Core i5-1135G7 2.4GHz
Iris Xe G7 80EUs
min: 21 fps, max: 28 fps
Intel Core i5-1135G7 2.4GHz
Iris Xe G7 80EUs
min: 24 fps, max: 31 fps
Intel Core i5-1145G7 2.6GHz
Iris Xe G7 80EUs
min: 24 fps, max: 31 fps
Intel Core i5-1245U 1.2GHz
Iris Xe G7 80EUs
min: 23 fps, max: 32 fps
Intel Core i5-13500H 1.9GHz
Iris Xe G7 80EUs
min: 27 fps, max: 37 fps
Intel Core i7-10750H 2.6GHz
GeForce GTX 1650 Mobile
min: 52 fps, max: 70 fps
AMD Ryzen 5 5500U @4GHz
GeForce GTX 1650 Mobile
min: 47 fps, max: 70 fps
Intel Core i5-1240P 1.2GHz
Iris Xe G7 80EUs
min: 10 fps, max: 15 fps
Intel Core i5-1135G7 2.4GHz
Iris Xe G7 80EUs
min: 15 fps, max: 20 fps
Intel Core i5-1335U 0.9GHz
Iris Xe G7 80EUs
min: 16 fps, max: 22 fps
Intel Core i5-1135G7 2.4GHz
Iris Xe G7 80EUs
min: 19 fps, max: 26 fps
Intel Core i5-1135G7 2.4GHz
Iris Xe G7 80EUs
min: 20 fps, max: 30 fps
Intel Core i5-1135G7 2.4GHz
Iris Xe G7 80EUs
min: 20 fps, max: 29 fps
Intel Core i5-1245U 1.2GHz
Iris Xe G7 80EUs
min: 21 fps, max: 30 fps
Intel Core i5-1145G7 2.6GHz
Iris Xe G7 80EUs
min: 22 fps, max: 31 fps
Intel Core i5-13500H 1.9GHz
Iris Xe G7 80EUs
min: 25 fps, max: 34 fps
AMD Ryzen 5 5500U 2.1GHz
GeForce GTX 1650 Mobile
min: 43 fps, max: 58 fps
Intel Core i7-10750H 2.6GHz
GeForce GTX 1650 Mobile
min: 48 fps, max: 65 fps
AMD Ryzen 5 5500U @4GHz
GeForce GTX 1650 Mobile
min: 48 fps, max: 66 fps
Intel Core i5-1240P 1.2GHz
Iris Xe G7 80EUs
min: 9 fps, max: 14 fps
Intel Core i5-1135G7 2.4GHz
Iris Xe G7 80EUs
min: 14 fps, max: 18 fps
Intel Core i5-1335U 0.9GHz
Iris Xe G7 80EUs
min: 15 fps, max: 20 fps
Intel Core i5-1135G7 2.4GHz
Iris Xe G7 80EUs
min: 17 fps, max: 23 fps
Intel Core i5-1135G7 2.4GHz
Iris Xe G7 80EUs
min: 18 fps, max: 25 fps
Intel Core i5-13500H 1.9GHz
Iris Xe G7 80EUs
min: 24 fps, max: 32 fps
AMD Ryzen 5 5500U 2.1GHz
GeForce GTX 1650 Mobile
min: 42 fps, max: 52 fps
Intel Core i7-10750H 2.6GHz
GeForce GTX 1650 Mobile
min: 45 fps, max: 58 fps
AMD Ryzen 5 5500U @4GHz
GeForce GTX 1650 Mobile
min: 46 fps, max: 63 fps

World of Tanks enCore
2018
X-Plane 11.11
2018Hoechstleistung
Intel Core i5-1135G7 2.4GHz
Iris Xe G7 80EUs
Akkusparmodus
Intel Core i7-10750H 2.6GHz
GeForce GTX 1650 Mobile
Hoechstleistung
Intel Core i7-10750H 2.6GHz
GeForce GTX 1650 Mobile
Hoechstleistung
Intel Core i5-1135G7 2.4GHz
Iris Xe G7 80EUs
Akkusparmodus
Intel Core i7-10750H 2.6GHz
GeForce GTX 1650 Mobile
Hoechstleistung
Intel Core i7-10750H 2.6GHz
GeForce GTX 1650 Mobile
Hoechstleistung
Intel Core i5-1135G7 2.4GHz
Iris Xe G7 80EUs
Akkusparmodus
Intel Core i7-10750H 2.6GHz
GeForce GTX 1650 Mobile
Hoechstleistung
Intel Core i7-10750H 2.6GHz
GeForce GTX 1650 Mobile


1.3, Hoechstleistung
Intel Core i5-1135G7 2.4GHz
Iris Xe G7 80EUs
Intel Core i5-1240P 1.2GHz
Iris Xe G7 80EUs
Problem during benchmarking occured: Spiel startete nicht crash
1.3
Intel Core i5-1135G7 2.4GHz
Iris Xe G7 80EUs
Problem during benchmarking occured: high texture details and antialiasing not available
1.3
Intel Core i5-1135G7 2.4GHz
Iris Xe G7 80EUs
Problem during benchmarking occured: Schwere grafische Probleme


Fortnite
2018


Destiny 2
2017
ELEX
2017


Team Fortress 2
2017Rocket League
2017Prey
2017For Honor
2017
Resident Evil 7
2017
Dishonored 2
2016
Battlefield 1
2016
Civilization VI
2016

Overwatch
2016
Doom
2016


Rainbow Six Siege
2015
World of Warships
2015Dota 2 Reborn
2015Intel Core i7-1250U 0.8GHz
Iris Xe G7 80EUs
min: -20.9 fps, max: -1 fps
Intel Core i5-1240P 1.2GHz
Iris Xe G7 80EUs
min: 33.6 fps, max: -1 fps
Intel Core i5-1135G7 2.4GHz
Iris Xe G7 80EUs
min: 51.1 fps, max: -1 fps
Intel Core i5-1135G7 2.4GHz
Iris Xe G7 80EUs
min: 50.7 fps, max: -1 fps
Intel Core i5-1135G7 2.4GHz
Iris Xe G7 80EUs
min: 53 fps, max: -1 fps
Intel Core i5-1135G7 2.4GHz
Iris Xe G7 80EUs
min: 45.8 fps, max: -1 fps
Intel Core i5-1135G7 2.4GHz
Iris Xe G7 80EUs
min: 48.4 fps, max: -1 fps
Intel Core i5-1135G7 2.4GHz
Iris Xe G7 80EUs
min: 48.4 fps, max: -1 fps
Intel Core i5-1135G7 2.4GHz
Iris Xe G7 80EUs
min: 51.2 fps, max: -1 fps
Intel Core i5-1135G7 2.4GHz
Iris Xe G7 80EUs
min: 48.9 fps, max: -1 fps
Intel Core i5-1135G7 2.4GHz
Iris Xe G7 80EUs
min: 47.1 fps, max: -1 fps
Intel Core i5-1135G7 2.4GHz
Iris Xe G7 80EUs
min: 68.8 fps, max: -1 fps
Intel Core i5-1240P 1.2GHz
Iris Xe G7 80EUs
min: 59.8 fps, max: -1 fps
Intel Core i5-1135G7 2.4GHz
Iris Xe G7 80EUs
min: 54.3 fps, max: -1 fps
Intel Core i5-1135G7 2.4GHz
Iris Xe G7 80EUs
min: 44.4 fps, max: -1 fps
Intel Core i5-1135G7 2.4GHz
Iris Xe G7 80EUs
min: 51.3 fps, max: -1 fps
Intel Core i5-1135G7 2.4GHz
Iris Xe G7 80EUs
min: 50.5 fps, max: -1 fps
Intel Core i5-1135G7 2.4GHz
Iris Xe G7 80EUs
min: 50.6 fps, max: -1 fps
Hoechstleistung
Intel Core i5-1135G7 2.4GHz
Iris Xe G7 80EUs
min: 53.3 fps, max: -1 fps
Intel Core i5-1135G7 2.4GHz
Iris Xe G7 80EUs
min: 51.3 fps, max: -1 fps
Intel Core i5-1135G7 2.4GHz
Iris Xe G7 80EUs
min: 48.6 fps, max: -1 fps
Intel Core i5-1135G7 2.4GHz
Iris Xe G7 80EUs
min: 46.5 fps, max: -1 fps
Intel Core i5-1135G7 2.4GHz
Iris Xe G7 80EUs
min: 44.8 fps, max: -1 fps
Intel Core i5-1135G7 2.4GHz
Iris Xe G7 80EUs
min: 49.7 fps, max: -1 fps
Intel Core i5-1135G7 2.4GHz
Iris Xe G7 80EUs
min: 75.6 fps, max: -1 fps
Intel Core i5-1130G7 1.8GHz
Iris Xe G7 80EUs
min: 50.6 fps, max: -1 fps
Intel Core i5-1135G7 2.4GHz
Iris Xe G7 80EUs
min: 53.6 fps, max: -1 fps
Intel Core i5-1135G7 2.4GHz
Iris Xe G7 80EUs
min: 52.7 fps, max: -1 fps
Intel Core i5-1135G7 2.4GHz
Iris Xe G7 80EUs
min: 46.3 fps, max: -1 fps
Intel Core i5-1135G7 2.4GHz
Iris Xe G7 80EUs
min: 75.5 fps, max: -1 fps
Intel Core i5-1135G7 2.4GHz
Iris Xe G7 80EUs
min: 45.2 fps, max: -1 fps
Intel Core i5-1135G7 2.4GHz
Iris Xe G7 80EUs
min: 46.9 fps, max: -1 fps
Intel Core i5-1135G7 2.4GHz
Iris Xe G7 80EUs
min: 53.7 fps, max: -1 fps
Intel Core i5-1135G7 2.4GHz
Iris Xe G7 80EUs
min: 51.6 fps, max: -1 fps
Intel Core i5-1335U 0.9GHz
Iris Xe G7 80EUs
min: 68.7 fps, max: -1 fps
Intel Core i5-1140G7 1.8GHz
Iris Xe G7 80EUs
min: 77.5 fps, max: -1 fps
Dual-Channel
Intel Core i5-1135G7 2.4GHz
Iris Xe G7 80EUs
min: 74.5 fps, max: -1 fps
Intel Core i5-1235U 0.9GHz
Iris Xe G7 80EUs
min: 71.6 fps, max: -1 fps
Intel Core i5-1335U 0.9GHz
Iris Xe G7 80EUs
min: 70.7 fps, max: -1 fps
Intel Core i5-1250P 1.2GHz
Iris Xe G7 80EUs
min: 73.5 fps, max: -1 fps
Intel Core i5-1335U 0.9GHz
Iris Xe G7 80EUs
min: 73.7 fps, max: -1 fps
Intel Core i5-1235U 0.9GHz
Iris Xe G7 80EUs
min: 67.3 fps, max: -1 fps
Intel Core i5-1235U 0.9GHz
Iris Xe G7 80EUs
min: 8.8 fps, max: -1 fps
Intel Core i5-1345U 1.2GHz
Iris Xe G7 80EUs
min: 77.5 fps, max: -1 fps
Intel Core i5-1240P 1.2GHz
Iris Xe G7 80EUs
min: 69.8 fps, max: -1 fps
Intel Core i5-1240P 1.2GHz
Iris Xe G7 80EUs
min: 82.2 fps, max: -1 fps
Intel Core i5-1335U 0.9GHz
Iris Xe G7 80EUs
min: 81 fps, max: -1 fps
Intel Core i5-1240U 0.8GHz
Iris Xe G7 80EUs
min: 78.4 fps, max: -1 fps
Intel Core i5-1340P 1.4GHz
Iris Xe G7 80EUs
min: 72.8 fps, max: -1 fps
Intel Core i5-1335U 0.9GHz
Iris Xe G7 80EUs
min: 80.4 fps, max: -1 fps
Intel Core i5-1230U 0.7GHz
Iris Xe G7 80EUs
min: 80.9 fps, max: -1 fps
Dual-Channel
Intel Core i5-1135G7 2.4GHz
Iris Xe G7 80EUs
min: 91.6 fps, max: -1 fps
Intel Core i5-1135G7 2.4GHz
Iris Xe G7 80EUs
min: 93.3 fps, max: -1 fps
Intel Core i5-1335U 0.9GHz
Iris Xe G7 80EUs
min: 81.3 fps, max: -1 fps
Intel Core 5 120U 0.9GHz
Iris Xe G7 80EUs
min: 80.8 fps, max: -1 fps
Intel Core i5-1240P 1.2GHz
Iris Xe G7 80EUs
min: 8.2 fps, max: -1 fps
Intel Core i5-1240P 1.2GHz
Iris Xe G7 80EUs
min: 85.6 fps, max: -1 fps
Intel Core i5-1335U 0.9GHz
Iris Xe G7 80EUs
min: 81.8 fps, max: -1 fps
Intel Core i5-1335U 0.9GHz
Iris Xe G7 80EUs
min: 81.2 fps, max: -1 fps
Intel Core i5-1235U 0.9GHz
Iris Xe G7 80EUs
min: 86.7 fps, max: -1 fps
Intel Core i5-1335U 0.9GHz
Iris Xe G7 80EUs
min: 77.5 fps, max: -1 fps
Intel Core i5-1245U 1.2GHz
Iris Xe G7 80EUs
min: 89.3 fps, max: -1 fps
Intel Core i5-1235U 0.9GHz
Iris Xe G7 80EUs
min: 87 fps, max: -1 fps
Intel Core i5-1135G7 2.4GHz
Iris Xe G7 80EUs
min: 97.8 fps, max: -1 fps
Intel Core i5-1235U 0.9GHz
Iris Xe G7 80EUs
min: 89.6 fps, max: -1 fps
Intel Core i5-1155G7 2.5GHz
Iris Xe G7 80EUs
min: 103.7 fps, max: -1 fps
Intel Core i5-11300H 3.1GHz
Iris Xe G7 80EUs
min: 105.9 fps, max: -1 fps
Intel Core i5-1340P 1.4GHz
Iris Xe G7 80EUs
min: 88.6 fps, max: -1 fps
Intel Core i5-1135G7 2.4GHz
Iris Xe G7 80EUs
min: 104.7 fps, max: -1 fps
Intel Core i5-1135G7 2.4GHz
Iris Xe G7 80EUs
min: 102.6 fps, max: -1 fps
Intel Core i5-1145G7 2.6GHz
Iris Xe G7 80EUs
min: 110.4 fps, max: -1 fps
Intel Core i5-1155G7 2.5GHz
Iris Xe G7 80EUs
min: 112.8 fps, max: -1 fps
Intel Core i5-1240P 1.2GHz
Iris Xe G7 80EUs
min: 81.4 fps, max: -1 fps
Intel Core i5-12500H 1.8GHz
Iris Xe G7 80EUs
min: 81.4 fps, max: -1 fps
Intel Core i5-13500H 1.9GHz
Iris Xe G7 80EUs
min: 102.2 fps, max: -1 fps
AMD Ryzen 5 5500U 2.1GHz
GeForce GTX 1650 Mobile
min: 83 fps, max: -1 fps
AMD Ryzen 5 5500U @4GHz
GeForce GTX 1650 Mobile
min: 88.7 fps, max: -1 fps
Intel Core i5-9300H 2.4GHz
GeForce GTX 1650 Mobile
min: 103 fps
Intel Core i7-9750H 2.6GHz
GeForce GTX 1650 Mobile
min: 107.4 fps
AMD Ryzen 7 5800H 3.2GHz
GeForce GTX 1650 Mobile
min: 8.9 fps, max: -1 fps
AMD Ryzen 5 5600H 3.3GHz
GeForce GTX 1650 Mobile
min: 117.2 fps, max: -1 fps
Intel Core i5-10300H 2.5GHz
GeForce GTX 1650 Mobile
min: 116.9 fps, max: -1 fps
Akkusparmodus
Intel Core i7-10750H 2.6GHz
GeForce GTX 1650 Mobile
min: 116.5 fps, max: -1 fps
AMD Ryzen 7 5800H 3.2GHz
GeForce GTX 1650 Mobile
min: 110.9 fps, max: -1 fps
AMD Ryzen 7 5800H 3.2GHz
GeForce GTX 1650 Mobile
min: 127.8 fps, max: -1 fps
Intel Core i7-10750H 2.6GHz
GeForce GTX 1650 Mobile
min: 126.2 fps, max: -1 fps
Hoechstleistung
Intel Core i7-10750H 2.6GHz
GeForce GTX 1650 Mobile
min: 128.3 fps, max: -1 fps
Intel Core i5-1135G7 2.4GHz
Iris Xe G7 80EUs
min: 22.6 fps, max: -1 fps
Intel Core i5-1240P 1.2GHz
Iris Xe G7 80EUs
min: 33.9 fps, max: -1 fps
Intel Core i5-1135G7 2.4GHz
Iris Xe G7 80EUs
min: 30.4 fps, max: -1 fps
Intel Core i5-1135G7 2.4GHz
Iris Xe G7 80EUs
min: 26.3 fps, max: -1 fps
Intel Core i5-1135G7 2.4GHz
Iris Xe G7 80EUs
min: 26.3 fps, max: -1 fps
Intel Core i5-1135G7 2.4GHz
Iris Xe G7 80EUs
min: 34.3 fps, max: -1 fps
Intel Core i5-1135G7 2.4GHz
Iris Xe G7 80EUs
min: 32.2 fps, max: -1 fps
Intel Core i5-1135G7 2.4GHz
Iris Xe G7 80EUs
min: 38 fps, max: -1 fps
Intel Core i5-1135G7 2.4GHz
Iris Xe G7 80EUs
min: 28.9 fps, max: -1 fps
Intel Core i5-1135G7 2.4GHz
Iris Xe G7 80EUs
min: 40.6 fps, max: -1 fps
Intel Core i5-1135G7 2.4GHz
Iris Xe G7 80EUs
min: 35.9 fps, max: -1 fps
Intel Core i5-1135G7 2.4GHz
Iris Xe G7 80EUs
min: 43.7 fps, max: -1 fps
Intel Core i5-1135G7 2.4GHz
Iris Xe G7 80EUs
min: 44.7 fps, max: -1 fps
Intel Core i5-1135G7 2.4GHz
Iris Xe G7 80EUs
min: 38.6 fps, max: -1 fps
Intel Core i5-1240P 1.2GHz
Iris Xe G7 80EUs
min: 38.8 fps, max: -1 fps
Intel Core i5-1135G7 2.4GHz
Iris Xe G7 80EUs
min: 42.7 fps, max: -1 fps
Intel Core i5-1135G7 2.4GHz
Iris Xe G7 80EUs
min: 37.5 fps, max: -1 fps
Intel Core i5-1135G7 2.4GHz
Iris Xe G7 80EUs
min: 40.8 fps, max: -1 fps
Intel Core i5-1135G7 2.4GHz
Iris Xe G7 80EUs
min: 44.1 fps, max: -1 fps
Intel Core i5-1235U 0.9GHz
Iris Xe G7 80EUs
min: 46.9 fps, max: -1 fps
Intel Core i5-1135G7 2.4GHz
Iris Xe G7 80EUs
min: 48.1 fps, max: -1 fps
Intel Core i5-1135G7 2.4GHz
Iris Xe G7 80EUs
min: 36 fps, max: -1 fps
Intel Core i5-1335U 0.9GHz
Iris Xe G7 80EUs
min: 48.1 fps, max: -1 fps
Intel Core i5-1135G7 2.4GHz
Iris Xe G7 80EUs
min: 41.1 fps, max: -1 fps
Intel Core i5-1235U 0.9GHz
Iris Xe G7 80EUs
min: 49.4 fps, max: -1 fps
Intel Core i5-1135G7 2.4GHz
Iris Xe G7 80EUs
min: 50.1 fps, max: -1 fps
Intel Core i5-1135G7 2.4GHz
Iris Xe G7 80EUs
min: 53.2 fps, max: -1 fps
Intel Core i5-1130G7 1.8GHz
Iris Xe G7 80EUs
min: 42.7 fps, max: -1 fps
Intel Core i5-1140G7 1.8GHz
Iris Xe G7 80EUs
min: 50.4 fps, max: -1 fps
Intel Core i5-1250P 1.2GHz
Iris Xe G7 80EUs
min: 48.7 fps, max: -1 fps
Intel Core i5-1335U 0.9GHz
Iris Xe G7 80EUs
min: 52.4 fps, max: -1 fps
Intel Core i5-1240P 1.2GHz
Iris Xe G7 80EUs
min: 49.8 fps, max: -1 fps
Intel Core i5-1240P 1.2GHz
Iris Xe G7 80EUs
min: 54.7 fps, max: -1 fps
Intel Core i5-1135G7 2.4GHz
Iris Xe G7 80EUs
min: 48.8 fps, max: -1 fps
Intel Core i5-1345U 1.2GHz
Iris Xe G7 80EUs
min: 54 fps, max: -1 fps
Hoechstleistung
Intel Core i5-1135G7 2.4GHz
Iris Xe G7 80EUs
min: 53.1 fps, max: -1 fps
Dual-Channel
Intel Core i5-1135G7 2.4GHz
Iris Xe G7 80EUs
min: 59.4 fps, max: -1 fps
Dual-Channel
Intel Core i5-1135G7 2.4GHz
Iris Xe G7 80EUs
min: 60.1 fps, max: -1 fps
Intel Core i5-1135G7 2.4GHz
Iris Xe G7 80EUs
min: 46.5 fps, max: -1 fps
Intel Core i5-1335U 0.9GHz
Iris Xe G7 80EUs
min: 55.1 fps, max: -1 fps
Intel Core i5-1335U 0.9GHz
Iris Xe G7 80EUs
min: 59 fps, max: -1 fps
Intel Core i5-1135G7 2.4GHz
Iris Xe G7 80EUs
min: 53.4 fps, max: -1 fps
Intel Core i5-1135G7 2.4GHz
Iris Xe G7 80EUs
min: 47.6 fps, max: -1 fps
Intel Core i5-1135G7 2.4GHz
Iris Xe G7 80EUs
min: 46.5 fps, max: -1 fps
Intel Core i5-1335U 0.9GHz
Iris Xe G7 80EUs
min: 53.6 fps, max: -1 fps
Intel Core i5-1135G7 2.4GHz
Iris Xe G7 80EUs
min: 55.2 fps, max: -1 fps
Intel Core i5-1135G7 2.4GHz
Iris Xe G7 80EUs
min: 45.2 fps, max: -1 fps
Intel Core i5-1335U 0.9GHz
Iris Xe G7 80EUs
min: 59.4 fps, max: -1 fps
Intel Core i5-1135G7 2.4GHz
Iris Xe G7 80EUs
min: 59.8 fps, max: -1 fps
Intel Core i5-1335U 0.9GHz
Iris Xe G7 80EUs
min: 61.2 fps, max: -1 fps
Intel Core i5-1230U 0.7GHz
Iris Xe G7 80EUs
min: 62.3 fps, max: -1 fps
Intel Core i5-1240U 0.8GHz
Iris Xe G7 80EUs
min: 61.8 fps, max: -1 fps
Intel Core i5-1135G7 2.4GHz
Iris Xe G7 80EUs
min: 52.5 fps, max: -1 fps
Intel Core i5-1240P 1.2GHz
Iris Xe G7 80EUs
min: 62 fps, max: -1 fps
Intel Core i5-1240P 1.2GHz
Iris Xe G7 80EUs
min: 59.9 fps, max: -1 fps
Intel Core i5-1335U 0.9GHz
Iris Xe G7 80EUs
min: 63.1 fps, max: -1 fps
Intel Core i5-1340P 1.4GHz
Iris Xe G7 80EUs
min: 62.3 fps, max: -1 fps
Intel Core i5-1335U 0.9GHz
Iris Xe G7 80EUs
min: 64 fps, max: -1 fps
Intel Core i5-1235U 0.9GHz
Iris Xe G7 80EUs
min: 65 fps, max: -1 fps
Intel Core i5-1235U 0.9GHz
Iris Xe G7 80EUs
min: 70.2 fps, max: -1 fps
Intel Core i5-1235U 0.9GHz
Iris Xe G7 80EUs
min: 69.6 fps, max: -1 fps
Intel Core i5-1135G7 2.4GHz
Iris Xe G7 80EUs
min: 73.6 fps, max: -1 fps
Intel Core i5-1340P 1.4GHz
Iris Xe G7 80EUs
min: 69.1 fps, max: -1 fps
Intel Core i5-1145G7 2.6GHz
Iris Xe G7 80EUs
min: 72.3 fps, max: -1 fps
Intel Core i5-1245U 1.2GHz
Iris Xe G7 80EUs
min: 72.1 fps, max: -1 fps
Intel Core i5-11300H 3.1GHz
Iris Xe G7 80EUs
min: 76.5 fps, max: -1 fps
Intel Core i5-1155G7 2.5GHz
Iris Xe G7 80EUs
min: 86.8 fps, max: -1 fps
Intel Core i5-13500H 1.9GHz
Iris Xe G7 80EUs
min: 78.4 fps, max: -1 fps
Intel Core i5-1135G7 2.4GHz
Iris Xe G7 80EUs
min: 96.8 fps, max: -1 fps
Intel Core i5-1155G7 2.5GHz
Iris Xe G7 80EUs
min: 103 fps, max: -1 fps
Intel Core i5-1240P 1.2GHz
Iris Xe G7 80EUs
min: 103.4 fps, max: -1 fps
Intel Core i5-12500H 1.8GHz
Iris Xe G7 80EUs
min: 103.4 fps, max: -1 fps
AMD Ryzen 5 5500U 2.1GHz
GeForce GTX 1650 Mobile
min: 81.2 fps, max: -1 fps
Intel Core i5-1135G7 2.4GHz
GeForce GTX 1650 Mobile
min: 77.2 fps, max: -1 fps
AMD Ryzen 5 5500U @4GHz
GeForce GTX 1650 Mobile
min: 87.2 fps, max: -1 fps
Intel Core i5-9300H 2.4GHz
GeForce GTX 1650 Mobile
min: 78.9 fps
Intel Core i7-9750H 2.6GHz
GeForce GTX 1650 Mobile
min: 96.4 fps
Akkusparmodus
Intel Core i7-10750H 2.6GHz
GeForce GTX 1650 Mobile
min: 95.9 fps, max: -1 fps
Intel Core i5-10300H 2.5GHz
GeForce GTX 1650 Mobile
min: 106.3 fps, max: -1 fps
AMD Ryzen 7 5800H 3.2GHz
GeForce GTX 1650 Mobile
min: 107.3 fps, max: -1 fps
AMD Ryzen 7 5800H 3.2GHz
GeForce GTX 1650 Mobile
min: 112.5 fps, max: -1 fps
AMD Ryzen 5 5600H 3.3GHz
GeForce GTX 1650 Mobile
min: 112.6 fps, max: -1 fps
AMD Ryzen 7 5800H 3.2GHz
GeForce GTX 1650 Mobile
min: 115 fps, max: -1 fps
Hoechstleistung
Intel Core i7-10750H 2.6GHz
GeForce GTX 1650 Mobile
min: 115.3 fps, max: -1 fps
Intel Core i7-10750H 2.6GHz
GeForce GTX 1650 Mobile
min: 115.8 fps, max: -1 fps
Intel Core i7-1250U 0.8GHz
Iris Xe G7 80EUs
min: -1.6 fps, max: -1 fps
Intel Core i5-1135G7 2.4GHz
Iris Xe G7 80EUs
min: 16.9 fps, max: -1 fps
Intel Core i5-1135G7 2.4GHz
Iris Xe G7 80EUs
min: 21.3 fps, max: -1 fps
Intel Core i5-1135G7 2.4GHz
Iris Xe G7 80EUs
min: 15.8 fps, max: -1 fps
Intel Core i5-1135G7 2.4GHz
Iris Xe G7 80EUs
min: 18.4 fps, max: -1 fps
Intel Core i5-1135G7 2.4GHz
Iris Xe G7 80EUs
min: 23.7 fps, max: -1 fps
Intel Core i5-1135G7 2.4GHz
Iris Xe G7 80EUs
min: 24.5 fps, max: -1 fps
Intel Core i5-1135G7 2.4GHz
Iris Xe G7 80EUs
min: 21.1 fps, max: -1 fps
Intel Core i5-1135G7 2.4GHz
Iris Xe G7 80EUs
min: 21.1 fps, max: -1 fps
Intel Core i5-1135G7 2.4GHz
Iris Xe G7 80EUs
min: 22 fps, max: -1 fps
Intel Core i5-1135G7 2.4GHz
Iris Xe G7 80EUs
min: 18 fps, max: -1 fps
Intel Core i5-1135G7 2.4GHz
Iris Xe G7 80EUs
min: 23.8 fps, max: -1 fps
Intel Core i5-1135G7 2.4GHz
Iris Xe G7 80EUs
min: 20.5 fps, max: -1 fps
Intel Core i5-1135G7 2.4GHz
Iris Xe G7 80EUs
min: 21.9 fps, max: -1 fps
Intel Core i5-1240P 1.2GHz
Iris Xe G7 80EUs
min: 33 fps, max: -1 fps
Intel Core i5-1240P 1.2GHz
Iris Xe G7 80EUs
min: 31.9 fps, max: -1 fps
Intel Core i5-1135G7 2.4GHz
Iris Xe G7 80EUs
min: 26.2 fps, max: -1 fps
Intel Core i5-1135G7 2.4GHz
Iris Xe G7 80EUs
min: 26.2 fps, max: -1 fps
Intel Core i5-1135G7 2.4GHz
Iris Xe G7 80EUs
min: 26.1 fps, max: -1 fps
Intel Core i5-1250P 1.2GHz
Iris Xe G7 80EUs
min: 32.7 fps, max: -1 fps
Intel Core i5-1135G7 2.4GHz
Iris Xe G7 80EUs
min: 26.7 fps, max: -1 fps
Intel Core i5-1235U 0.9GHz
Iris Xe G7 80EUs
min: 32.9 fps, max: -1 fps
Intel Core i5-1230U 0.7GHz
Iris Xe G7 80EUs
min: 35 fps, max: -1 fps
Intel Core i5-1335U 0.9GHz
Iris Xe G7 80EUs
min: 35.1 fps, max: -1 fps
Intel Core i5-1135G7 2.4GHz
Iris Xe G7 80EUs
min: 27.5 fps, max: -1 fps
Hoechstleistung
Intel Core i5-1135G7 2.4GHz
Iris Xe G7 80EUs
min: 22.7 fps, max: -1 fps
Dual-Channel
Intel Core i5-1135G7 2.4GHz
Iris Xe G7 80EUs
min: 35.3 fps, max: -1 fps
Intel Core i5-1130G7 1.8GHz
Iris Xe G7 80EUs
min: 16.5 fps, max: -1 fps
Intel Core i5-1335U 0.9GHz
Iris Xe G7 80EUs
min: 36.1 fps, max: -1 fps
Intel Core i5-1135G7 2.4GHz
Iris Xe G7 80EUs
min: 27.4 fps, max: -1 fps
Intel Core i5-1140G7 1.8GHz
Iris Xe G7 80EUs
min: 36.5 fps, max: -1 fps
Intel Core i5-1135G7 2.4GHz
Iris Xe G7 80EUs
min: 21.5 fps, max: -1 fps
Intel Core i5-1135G7 2.4GHz
Iris Xe G7 80EUs
min: 24.5 fps, max: -1 fps
Intel Core i5-1135G7 2.4GHz
Iris Xe G7 80EUs
min: 35.7 fps, max: -1 fps
Intel Core i5-1135G7 2.4GHz
Iris Xe G7 80EUs
min: 30.7 fps, max: -1 fps
Dual-Channel
Intel Core i5-1135G7 2.4GHz
Iris Xe G7 80EUs
min: 39.3 fps, max: -1 fps
Intel Core i5-1240P 1.2GHz
Iris Xe G7 80EUs
min: 37 fps, max: -1 fps
Intel Core i5-1335U 0.9GHz
Iris Xe G7 80EUs
min: 39.5 fps, max: -1 fps
Intel Core i5-1235U 0.9GHz
Iris Xe G7 80EUs
min: 42.6 fps, max: -1 fps
Intel Core i5-1135G7 2.4GHz
Iris Xe G7 80EUs
min: 29.7 fps, max: -1 fps
Intel Core i5-1235U 0.9GHz
Iris Xe G7 80EUs
min: 36.6 fps, max: -1 fps
Intel Core i5-1135G7 2.4GHz
Iris Xe G7 80EUs
min: 22.1 fps, max: -1 fps
Intel Core i5-1235U 0.9GHz
Iris Xe G7 80EUs
min: 42.1 fps, max: -1 fps
Intel Core i5-1240P 1.2GHz
Iris Xe G7 80EUs
min: 42.8 fps, max: -1 fps
Intel Core i5-1235U 0.9GHz
Iris Xe G7 80EUs
min: 42.7 fps, max: -1 fps
Intel Core i5-1235U 0.9GHz
Iris Xe G7 80EUs
min: 43.5 fps, max: -1 fps
Intel Core i5-1135G7 2.4GHz
Iris Xe G7 80EUs
min: 23.2 fps, max: -1 fps
Intel Core i5-1135G7 2.4GHz
Iris Xe G7 80EUs
min: 33.3 fps, max: -1 fps
Intel Core i5-1335U 0.9GHz
Iris Xe G7 80EUs
min: 42.5 fps, max: -1 fps
Intel Core i5-1335U 0.9GHz
Iris Xe G7 80EUs
min: 45.6 fps, max: -1 fps
Intel Core i5-1135G7 2.4GHz
Iris Xe G7 80EUs
min: 31.3 fps, max: -1 fps
Intel Core i5-1245U 1.2GHz
Iris Xe G7 80EUs
min: 46.3 fps, max: -1 fps
Intel Core i5-1135G7 2.4GHz
Iris Xe G7 80EUs
min: 24.3 fps, max: -1 fps
Intel Core i5-1240U 0.8GHz
Iris Xe G7 80EUs
min: 46.9 fps, max: -1 fps
Intel Core i5-1135G7 2.4GHz
Iris Xe G7 80EUs
min: 15.6 fps, max: -1 fps
Intel Core i5-1345U 1.2GHz
Iris Xe G7 80EUs
min: 44.5 fps, max: -1 fps
Intel Core i5-1335U 0.9GHz
Iris Xe G7 80EUs
min: 43.3 fps, max: -1 fps
Intel Core i5-1335U 0.9GHz
Iris Xe G7 80EUs
min: 44.9 fps, max: -1 fps
Intel Core i5-1145G7 2.6GHz
Iris Xe G7 80EUs
min: 46.5 fps, max: -1 fps
Intel Core i5-1340P 1.4GHz
Iris Xe G7 80EUs
min: 50.1 fps, max: -1 fps
Intel Core i5-11300H 3.1GHz
Iris Xe G7 80EUs
min: 46.9 fps, max: -1 fps
Intel Core 5 120U 0.9GHz
Iris Xe G7 80EUs
min: 49.2 fps, max: -1 fps
Intel Core i5-1135G7 2.4GHz
Iris Xe G7 80EUs
min: 52.8 fps, max: -1 fps
Intel Core i5-1240P 1.2GHz
Iris Xe G7 80EUs
min: 52.7 fps, max: -1 fps
Intel Core i5-1135G7 2.4GHz
Iris Xe G7 80EUs
min: 52.5 fps, max: -1 fps
Intel Core i5-1155G7 2.5GHz
Iris Xe G7 80EUs
min: 53.7 fps, max: -1 fps
Intel Core i5-1335U 0.9GHz
Iris Xe G7 80EUs
min: 53.6 fps, max: -1 fps
Intel Core i5-1335U 0.9GHz
Iris Xe G7 80EUs
min: 57.4 fps, max: -1 fps
Intel Core i5-1155G7 2.5GHz
Iris Xe G7 80EUs
min: 55.1 fps, max: -1 fps
Intel Core i5-13500H 1.9GHz
Iris Xe G7 80EUs
min: 65.7 fps, max: -1 fps
Intel Core i5-1240P 1.2GHz
Iris Xe G7 80EUs
min: 59.6 fps, max: -1 fps
Intel Core i5-12500H 1.8GHz
Iris Xe G7 80EUs
min: 59.6 fps, max: -1 fps
Intel Core i5-9300H 2.4GHz
GeForce GTX 1650 Mobile
min: 70.3 fps
AMD Ryzen 5 5500U @4GHz
GeForce GTX 1650 Mobile
min: 74 fps, max: -1 fps
AMD Ryzen 5 5500U 2.1GHz
GeForce GTX 1650 Mobile
min: 74.4 fps, max: -1 fps
Intel Core i5-1135G7 2.4GHz
GeForce GTX 1650 Mobile
min: 75.9 fps, max: -1 fps
Intel Core i7-9750H 2.6GHz
GeForce GTX 1650 Mobile
min: 76.9 fps
Akkusparmodus
Intel Core i7-10750H 2.6GHz
GeForce GTX 1650 Mobile
min: 89.6 fps, max: -1 fps
AMD Ryzen 5 5600H 3.3GHz
GeForce GTX 1650 Mobile
min: 98.8 fps, max: -1 fps
AMD Ryzen 7 5800H 3.2GHz
GeForce GTX 1650 Mobile
min: 98.1 fps, max: -1 fps
AMD Ryzen 7 5800H 3.2GHz
GeForce GTX 1650 Mobile
min: 99.4 fps, max: -1 fps
Intel Core i5-10300H 2.5GHz
GeForce GTX 1650 Mobile
min: 98.3 fps, max: -1 fps
Intel Core i7-10750H 2.6GHz
GeForce GTX 1650 Mobile
min: 104.1 fps, max: -1 fps
Hoechstleistung
Intel Core i7-10750H 2.6GHz
GeForce GTX 1650 Mobile
min: 105 fps, max: -1 fps
AMD Ryzen 7 5800H 3.2GHz
GeForce GTX 1650 Mobile
min: 108.6 fps, max: -1 fps
Intel Core i5-1135G7 2.4GHz
Iris Xe G7 80EUs
min: 15.7 fps, max: -1 fps
Intel Core i5-1135G7 2.4GHz
Iris Xe G7 80EUs
min: 19.9 fps, max: -1 fps
Intel Core i5-1135G7 2.4GHz
Iris Xe G7 80EUs
min: 17.1 fps, max: -1 fps
Intel Core i5-1135G7 2.4GHz
Iris Xe G7 80EUs
min: 14.9 fps, max: -1 fps
Intel Core i5-1135G7 2.4GHz
Iris Xe G7 80EUs
min: 22.1 fps, max: -1 fps
Intel Core i5-1135G7 2.4GHz
Iris Xe G7 80EUs
min: 22.8 fps, max: -1 fps
Intel Core i5-1135G7 2.4GHz
Iris Xe G7 80EUs
min: 10.6 fps, max: -1 fps
Intel Core i5-1135G7 2.4GHz
Iris Xe G7 80EUs
min: 16.5 fps, max: -1 fps
Intel Core i5-1135G7 2.4GHz
Iris Xe G7 80EUs
min: 19.9 fps, max: -1 fps
Intel Core i5-1135G7 2.4GHz
Iris Xe G7 80EUs
min: 19.9 fps, max: -1 fps
Intel Core i5-1135G7 2.4GHz
Iris Xe G7 80EUs
min: 21.1 fps, max: -1 fps
Intel Core i5-1135G7 2.4GHz
Iris Xe G7 80EUs
min: 22.8 fps, max: -1 fps
Intel Core i5-1135G7 2.4GHz
Iris Xe G7 80EUs
min: 19.4 fps, max: -1 fps
Intel Core i5-1135G7 2.4GHz
Iris Xe G7 80EUs
min: 21.7 fps, max: -1 fps
Intel Core i5-1240P 1.2GHz
Iris Xe G7 80EUs
min: 29.2 fps, max: -1 fps
Intel Core i5-1250P 1.2GHz
Iris Xe G7 80EUs
min: 29 fps, max: -1 fps
Intel Core i5-1135G7 2.4GHz
Iris Xe G7 80EUs
min: 24.8 fps, max: -1 fps
Intel Core i5-1240P 1.2GHz
Iris Xe G7 80EUs
min: 32.3 fps, max: -1 fps
Intel Core i5-1135G7 2.4GHz
Iris Xe G7 80EUs
min: 24.1 fps, max: -1 fps
Intel Core i5-1230U 0.7GHz
Iris Xe G7 80EUs
min: 31.2 fps, max: -1 fps
Intel Core i5-1135G7 2.4GHz
Iris Xe G7 80EUs
min: 24.3 fps, max: -1 fps
Intel Core i5-1235U 0.9GHz
Iris Xe G7 80EUs
min: 30.1 fps, max: -1 fps
Intel Core i5-1335U 0.9GHz
Iris Xe G7 80EUs
min: 32.1 fps, max: -1 fps
Intel Core i5-1130G7 1.8GHz
Iris Xe G7 80EUs
min: 15.1 fps, max: -1 fps
Intel Core i5-1135G7 2.4GHz
Iris Xe G7 80EUs
min: 24.4 fps, max: -1 fps
Hoechstleistung
Intel Core i5-1135G7 2.4GHz
Iris Xe G7 80EUs
min: 20.3 fps, max: -1 fps
Dual-Channel
Intel Core i5-1135G7 2.4GHz
Iris Xe G7 80EUs
min: 32 fps, max: -1 fps
Intel Core i5-1140G7 1.8GHz
Iris Xe G7 80EUs
min: 31.3 fps, max: -1 fps
Intel Core i5-1135G7 2.4GHz
Iris Xe G7 80EUs
min: 16.5 fps, max: -1 fps
Intel Core i5-1135G7 2.4GHz
Iris Xe G7 80EUs
min: 25.5 fps, max: -1 fps
Intel Core i5-1335U 0.9GHz
Iris Xe G7 80EUs
min: 32.9 fps, max: -1 fps
Intel Core i5-1135G7 2.4GHz
Iris Xe G7 80EUs
min: 21.8 fps, max: -1 fps
Intel Core i5-1135G7 2.4GHz
Iris Xe G7 80EUs
min: 34.9 fps, max: -1 fps
Intel Core i5-1135G7 2.4GHz
Iris Xe G7 80EUs
min: 26.9 fps, max: -1 fps
Intel Core i5-1135G7 2.4GHz
Iris Xe G7 80EUs
min: 26 fps, max: -1 fps
Intel Core i5-1240P 1.2GHz
Iris Xe G7 80EUs
min: 32.6 fps, max: -1 fps
Intel Core i5-1135G7 2.4GHz
Iris Xe G7 80EUs
min: 23.4 fps, max: -1 fps
Intel Core i5-1235U 0.9GHz
Iris Xe G7 80EUs
min: 32.3 fps, max: -1 fps
Intel Core i5-1235U 0.9GHz
Iris Xe G7 80EUs
min: 39.3 fps, max: -1 fps
Dual-Channel
Intel Core i5-1135G7 2.4GHz
Iris Xe G7 80EUs
min: 36 fps, max: -1 fps
Intel Core i5-1135G7 2.4GHz
Iris Xe G7 80EUs
min: 20.4 fps, max: -1 fps
Intel Core i5-1235U 0.9GHz
Iris Xe G7 80EUs
min: 39.5 fps, max: -1 fps
Intel Core i5-1235U 0.9GHz
Iris Xe G7 80EUs
min: 38.9 fps, max: -1 fps
Intel Core i5-1135G7 2.4GHz
Iris Xe G7 80EUs
min: 29.1 fps, max: -1 fps
Intel Core i5-1235U 0.9GHz
Iris Xe G7 80EUs
min: 40.1 fps, max: -1 fps
Intel Core i5-1135G7 2.4GHz
Iris Xe G7 80EUs
min: 21.9 fps, max: -1 fps
Intel Core i5-1240P 1.2GHz
Iris Xe G7 80EUs
min: 39.9 fps, max: -1 fps
Intel Core i5-1335U 0.9GHz
Iris Xe G7 80EUs
min: 41.1 fps, max: -1 fps
Intel Core i5-1335U 0.9GHz
Iris Xe G7 80EUs
min: 38.5 fps, max: -1 fps
Intel Core i5-1135G7 2.4GHz
Iris Xe G7 80EUs
min: 22.1 fps, max: -1 fps
Intel Core i5-1245U 1.2GHz
Iris Xe G7 80EUs
min: 42.8 fps, max: -1 fps
Intel Core i5-1240U 0.8GHz
Iris Xe G7 80EUs
min: 42.1 fps, max: -1 fps
Intel Core i5-1345U 1.2GHz
Iris Xe G7 80EUs
min: 39.3 fps, max: -1 fps
Intel Core i5-1335U 0.9GHz
Iris Xe G7 80EUs
min: 38.8 fps, max: -1 fps
Intel Core i5-1135G7 2.4GHz
Iris Xe G7 80EUs
min: 41.1 fps, max: -1 fps
Intel Core i5-1135G7 2.4GHz
Iris Xe G7 80EUs
min: 31.1 fps, max: -1 fps
Intel Core i5-1135G7 2.4GHz
Iris Xe G7 80EUs
min: 41.6 fps, max: -1 fps
Intel Core i5-1135G7 2.4GHz
Iris Xe G7 80EUs
min: 29.5 fps, max: -1 fps
Intel Core i5-1335U 0.9GHz
Iris Xe G7 80EUs
min: 42 fps, max: -1 fps
Intel Core i5-1340P 1.4GHz
Iris Xe G7 80EUs
min: 45.1 fps, max: -1 fps
Intel Core i5-1135G7 2.4GHz
Iris Xe G7 80EUs
min: 45.9 fps, max: -1 fps
Intel Core i5-1135G7 2.4GHz
Iris Xe G7 80EUs
min: 45.3 fps, max: -1 fps
Intel Core 5 120U 0.9GHz
Iris Xe G7 80EUs
min: 44.8 fps, max: -1 fps
Intel Core i5-11300H 3.1GHz
Iris Xe G7 80EUs
min: 46 fps, max: -1 fps
Intel Core i5-1240P 1.2GHz
Iris Xe G7 80EUs
min: 47.7 fps, max: -1 fps
Intel Core i5-1145G7 2.6GHz
Iris Xe G7 80EUs
min: 46.5 fps, max: -1 fps
Intel Core i5-1155G7 2.5GHz
Iris Xe G7 80EUs
min: 47.6 fps, max: -1 fps
Intel Core i5-1335U 0.9GHz
Iris Xe G7 80EUs
min: 49 fps, max: -1 fps
Intel Core i5-1335U 0.9GHz
Iris Xe G7 80EUs
min: 50.9 fps, max: -1 fps
Intel Core i5-1155G7 2.5GHz
Iris Xe G7 80EUs
min: 52.7 fps, max: -1 fps
Intel Core i5-13500H 1.9GHz
Iris Xe G7 80EUs
min: 58.2 fps, max: -1 fps
Intel Core i5-1240P 1.2GHz
Iris Xe G7 80EUs
min: 49.7 fps, max: -1 fps
Intel Core i5-12500H 1.8GHz
Iris Xe G7 80EUs
min: 49.7 fps, max: -1 fps
Intel Core i5-9300H 2.4GHz
GeForce GTX 1650 Mobile
min: 65.1 fps
AMD Ryzen 5 5500U @4GHz
GeForce GTX 1650 Mobile
min: 70.7 fps, max: -1 fps
AMD Ryzen 5 5500U 2.1GHz
GeForce GTX 1650 Mobile
min: 71.5 fps, max: -1 fps
Intel Core i7-9750H 2.6GHz
GeForce GTX 1650 Mobile
min: 73.7 fps
Akkusparmodus
Intel Core i7-10750H 2.6GHz
GeForce GTX 1650 Mobile
min: 83.1 fps, max: -1 fps
AMD Ryzen 5 5600H 3.3GHz
GeForce GTX 1650 Mobile
min: 93.4 fps, max: -1 fps
Intel Core i5-10300H 2.5GHz
GeForce GTX 1650 Mobile
min: 90.7 fps, max: -1 fps
AMD Ryzen 7 5800H 3.2GHz
GeForce GTX 1650 Mobile
min: 95.1 fps, max: -1 fps
AMD Ryzen 7 5800H 3.2GHz
GeForce GTX 1650 Mobile
min: 95 fps, max: -1 fps
Intel Core i7-10750H 2.6GHz
GeForce GTX 1650 Mobile
min: 93.3 fps, max: -1 fps
Hoechstleistung
Intel Core i7-10750H 2.6GHz
GeForce GTX 1650 Mobile
min: 92.9 fps, max: -1 fps
AMD Ryzen 7 5800H 3.2GHz
GeForce GTX 1650 Mobile
min: 102.4 fps, max: -1 fps
Intel Core i5-1340P 1.4GHz
Iris Xe G7 80EUs
min: 15.9 fps, max: -1 fps
Intel Core i5-1135G7 2.4GHz
Iris Xe G7 80EUs
min: 3.1 fps, max: -1 fps
Intel Core i7-9750H 2.6GHz
GeForce GTX 1650 Mobile
min: 32.7 fps
AMD Ryzen 5 5500U 2.1GHz
GeForce GTX 1650 Mobile
min: 42 fps, max: -1 fps
AMD Ryzen 7 5800H 3.2GHz
GeForce GTX 1650 Mobile
min: 52.9 fps, max: -1 fps


The Witcher 3
2015Intel Core i5-1135G7 2.4GHz
Iris Xe G7 80EUs
min: 4.78 fps, P0.1: 5.88 fps, P1: 19.1 fps, max: 85 fps
Intel Core i5-1135G7 2.4GHz
Iris Xe G7 80EUs
min: 5.09 fps, P0.1: 8.84 fps, P1: 20 fps, max: 76.8 fps
Intel Core i5-1135G7 2.4GHz
Iris Xe G7 80EUs
min: 27 fps, max: 43 fps
Intel Core i5-1140G7 1.8GHz
Iris Xe G7 80EUs
min: 31 fps, max: 53 fps
Intel Core i5-1135G7 2.4GHz
Iris Xe G7 80EUs
min: 38 fps, max: 53 fps
Intel Core i5-1240P 1.2GHz
Iris Xe G7 80EUs
min: 22.8 fps, P0.1: 26.6 fps, P1: 31.5 fps, max: 101.6 fps
Intel Core i5-1235U 0.9GHz
Iris Xe G7 80EUs
min: 15 fps, max: 64 fps
Intel Core i5-1335U 0.9GHz
Iris Xe G7 80EUs
min: 48 fps, max: 61 fps
Intel Core i5-1135G7 2.4GHz
Iris Xe G7 80EUs
min: 2.8 fps, P0.1: 12.4 fps, P1: 34.9 fps, max: 120.4 fps
Intel Core i5-1230U 0.7GHz
Iris Xe G7 80EUs
min: 15 fps, max: 66 fps
Intel Core i5-1135G7 2.4GHz
Iris Xe G7 80EUs
min: 51 fps, max: 66 fps
Dual-Channel
Intel Core i5-1135G7 2.4GHz
Iris Xe G7 80EUs
min: 3.21 fps, P0.1: 11.5 fps, P1: 33.3 fps, max: 148 fps
Intel Core i5-1135G7 2.4GHz
Iris Xe G7 80EUs
min: 28.2 fps, P0.1: 28.3 fps, P1: 37.1 fps, max: 122 fps
Intel Core i5-1135G7 2.4GHz
Iris Xe G7 80EUs
min: 3.62 fps, P0.1: 9.3 fps, P1: 25.9 fps, max: 118 fps
Intel Core i5-1135G7 2.4GHz
Iris Xe G7 80EUs
min: 60 fps, max: 71 fps
Dual-Channel
Intel Core i5-1135G7 2.4GHz
Iris Xe G7 80EUs
min: 28.3 fps, P0.1: 35.6 fps, P1: 43 fps, max: 123 fps
Intel Core i5-1240U 0.8GHz
Iris Xe G7 80EUs
min: 61 fps, max: 77 fps
Intel Core i5-1240P 1.2GHz
Iris Xe G7 80EUs
min: 4.99 fps, P0.1: 11.5 fps, P1: 34.4 fps, max: 192.7 fps
Intel Core i5-1135G7 2.4GHz
Iris Xe G7 80EUs
min: 33.2 fps, P0.1: 38.3 fps, P1: 53.4 fps, max: 110 fps
Intel Core i5-1235U 0.9GHz
Iris Xe G7 80EUs
min: 23 fps, max: 83 fps
Intel Core i5-1335U 0.9GHz
Iris Xe G7 80EUs
min: 57 fps, max: 81 fps
Intel Core i5-1250P 1.2GHz
Iris Xe G7 80EUs
min: 61 fps, max: 81 fps
Intel Core i5-1345U 1.2GHz
Iris Xe G7 80EUs
min: 67 fps, P1: 69 fps, max: 88 fps
Intel Core i5-1235U 0.9GHz
Iris Xe G7 80EUs
min: 33.7 fps, P0.1: 38.5 fps, P1: 45.2 fps, max: 170.9 fps
Intel Core i5-1335U 0.9GHz
Iris Xe G7 80EUs
min: 61 fps, max: 83 fps
Intel Core i5-1240P 1.2GHz
Iris Xe G7 80EUs
min: 63 fps, max: 85 fps
Intel Core i5-1335U 0.9GHz
Iris Xe G7 80EUs
min: 64 fps, max: 86 fps
Intel Core i5-1335U 0.9GHz
Iris Xe G7 80EUs
min: 67 fps, max: 86 fps
Intel Core i5-1335U 0.9GHz
Iris Xe G7 80EUs
min: 3.84 fps, P0.1: 10.1 fps, P1: 36.8 fps, max: 246 fps
Intel Core i5-1145G7 2.6GHz
Iris Xe G7 80EUs
min: 4.78 fps, P0.1: 20.4 fps, P1: 42.9 fps, max: 213 fps
Intel Core i5-1245U 1.2GHz
Iris Xe G7 80EUs
min: 31.8 fps, P0.1: 35.9 fps, P1: 47.9 fps, max: 266 fps
Intel Core i5-1135G7 2.4GHz
Iris Xe G7 80EUs
min: 62 fps, max: 93 fps
Intel Core i5-1135G7 2.4GHz
Iris Xe G7 80EUs
min: 75 fps, P1: 76.12 fps, max: 88 fps
Intel Core i5-1155G7 2.5GHz
Iris Xe G7 80EUs
min: 71 fps, P1: 74 fps, max: 102 fps
Intel Core i5-1135G7 2.4GHz
Iris Xe G7 80EUs
min: 2.78 fps, P0.1: 12.7 fps, P1: 35 fps, max: 120.4 fps
AMD Ryzen 7 3750H 2.3GHz
GeForce GTX 1650 Mobile
min: 65 fps, P1: 84 fps, max: 154 fps
AMD Ryzen 5 5500U @4GHz
GeForce GTX 1650 Mobile
min: 3 fps, P0.1: 45 fps, P1: 106.2 fps, max: 315 fps
AMD Ryzen 7 5800H 3.2GHz
GeForce GTX 1650 Mobile
min: 140 fps, max: 191 fps
Intel Core i7-10750H 2.6GHz
GeForce GTX 1650 Mobile
min: 13 fps, P0.1: 50.5 fps, P1: 118 fps, max: 399 fps
Intel Core i5-1135G7 2.4GHz
Iris Xe G7 80EUs
min: 10.7 fps, P0.1: 11.5 fps, P1: 16.3 fps, max: 44.2 fps
Intel Core i5-1135G7 2.4GHz
Iris Xe G7 80EUs
min: 1.787 fps, P0.1: 4.05 fps, P1: 17.2 fps, max: 47.1 fps
Intel Core i5-1135G7 2.4GHz
Iris Xe G7 80EUs
min: 21 fps, max: 26 fps
Intel Core i5-1130G7 1.8GHz
Iris Xe G7 80EUs
min: 20 fps, P1: 22 fps, max: 39 fps
Intel Core i5-1135G7 2.4GHz
Iris Xe G7 80EUs
min: 11 fps, max: 34 fps
Intel Core i5-1140G7 1.8GHz
Iris Xe G7 80EUs
min: 27 fps, max: 37 fps
Intel Core i5-1240P 1.2GHz
Iris Xe G7 80EUs
min: 5.05 fps, P0.1: 14.7 fps, P1: 18.3 fps, max: 91.2 fps
Intel Core i5-1335U 0.9GHz
Iris Xe G7 80EUs
min: 30 fps, max: 38 fps
Intel Core i5-1135G7 2.4GHz
Iris Xe G7 80EUs
min: 31 fps, max: 40 fps
Intel Core i5-1135G7 2.4GHz
Iris Xe G7 80EUs
min: 1.6 fps, P0.1: 5.6 fps, P1: 22.4 fps, max: 88 fps
Intel Core i5-1135G7 2.4GHz
Iris Xe G7 80EUs
min: 30 fps, max: 43 fps
Intel Core i5-1235U 0.9GHz
Iris Xe G7 80EUs
min: 31 fps, max: 44 fps
Intel Core i5-1335U 0.9GHz
Iris Xe G7 80EUs
min: 31 fps, max: 50 fps
Intel Core i5-1230U 0.7GHz
Iris Xe G7 80EUs
min: 36 fps, max: 42 fps
Dual-Channel
Intel Core i5-1135G7 2.4GHz
Iris Xe G7 80EUs
min: 17.2 fps, P0.1: 17.4 fps, P1: 23.2 fps, max: 115 fps
Intel Core i5-1135G7 2.4GHz
Iris Xe G7 80EUs
min: 15.5 fps, P0.1: 16.6 fps, P1: 19.4 fps, max: 110 fps
Intel Core i5-1135G7 2.4GHz
Iris Xe G7 80EUs
min: 30 fps, max: 46 fps
Intel Core i5-1240U 0.8GHz
Iris Xe G7 80EUs
min: 38 fps, max: 45 fps
Intel Core i5-1135G7 2.4GHz
Iris Xe G7 80EUs
min: 2.89 fps, P0.1: 16.6 fps, P1: 30.7 fps, max: 85.8 fps
Intel Core i5-1250P 1.2GHz
Iris Xe G7 80EUs
min: 38 fps, max: 51 fps
Intel Core i5-1240P 1.2GHz
Iris Xe G7 80EUs
min: 2.75 fps, P0.1: 21.1 fps, P1: 25.5 fps, max: 164.5 fps
Intel Core i5-1335U 0.9GHz
Iris Xe G7 80EUs
min: 40 fps, max: 49 fps
Intel Core i5-1135G7 2.4GHz
Iris Xe G7 80EUs
min: 3.46 fps, P0.1: 12.3 fps, P1: 32.1 fps, max: 94.4 fps
Intel Core i5-1235U 0.9GHz
Iris Xe G7 80EUs
min: 42 fps, max: 53 fps
Intel Core i5-1335U 0.9GHz
Iris Xe G7 80EUs
min: 41 fps, max: 54 fps
Intel Core i5-1235U 0.9GHz
Iris Xe G7 80EUs
min: 14.9 fps, P0.1: 22.5 fps, P1: 26.2 fps, max: 132.6 fps
Intel Core i5-1240P 1.2GHz
Iris Xe G7 80EUs
min: 44 fps, max: 54 fps
Intel Core i5-1135G7 2.4GHz
Iris Xe G7 80EUs
min: 44 fps, P1: 45.14 fps, max: 59 fps
Intel Core i5-1335U 0.9GHz
Iris Xe G7 80EUs
min: 42 fps, max: 56 fps
Intel Core i5-1155G7 2.5GHz
Iris Xe G7 80EUs
min: 46 fps, P1: 46.59 fps, max: 60 fps
Intel Core i5-1145G7 2.6GHz
Iris Xe G7 80EUs
min: 3.24 fps, P0.1: 25.2 fps, P1: 29.7 fps, max: 150.2 fps
Intel Core i5-1245U 1.2GHz
Iris Xe G7 80EUs
min: 22.4 fps, P0.1: 24.9 fps, P1: 29.9 fps, max: 188.3 fps
Intel Core i5-1335U 0.9GHz
Iris Xe G7 80EUs
min: 7.14 fps, P0.1: 25.6 fps, P1: 30.6 fps, max: 180.8 fps
Hoch
Intel Core i5-1240P 1.2GHz
Iris Xe G7 80EUs
min: 17.7 fps, P0.1: 25.9 fps, P1: 30.6 fps, max: 131.7 fps
Intel Core i5-1155G7 2.5GHz
Iris Xe G7 80EUs
min: 43 fps, P1: 44.83 fps, max: 62 fps
Intel Core i5-1135G7 2.4GHz
Iris Xe G7 80EUs
min: 52 fps, max: 61 fps
AMD Ryzen 7 3750H 2.3GHz
GeForce GTX 1650 Mobile
min: 61 fps, P1: 69.16 fps, max: 102 fps
Intel Core i7-10750H 2.6GHz
GeForce GTX 1650 Mobile
min: 2.15 fps, P0.1: 48.7 fps, P1: 77.9 fps, max: 248 fps
AMD Ryzen 5 5500U @4GHz
GeForce GTX 1650 Mobile
min: 16.2 fps, P0.1: 55.6 fps, P1: 74.1 fps, max: 200 fps
Intel Core i5-1135G7 2.4GHz
Iris Xe G7 80EUs
min: 5.29 fps, P0.1: 5.52 fps, P1: 7.01 fps, max: 26.1 fps
Intel Core i5-1135G7 2.4GHz
Iris Xe G7 80EUs
min: 5.65 fps, P0.1: 5.75 fps, P1: 6.42 fps, max: 39 fps
Intel Core i5-1135G7 2.4GHz
Iris Xe G7 80EUs
min: 9 fps, max: 14 fps
Intel Core i5-1135G7 2.4GHz
Iris Xe G7 80EUs
min: 11 fps, max: 18 fps
Intel Core i5-1240P 1.2GHz
Iris Xe G7 80EUs
min: 6.06 fps, P0.1: 7.83 fps, P1: 8.73 fps, max: 77 fps
Intel Core i5-1335U 0.9GHz
Iris Xe G7 80EUs
min: 13 fps, max: 19 fps
Intel Core i5-1135G7 2.4GHz
Iris Xe G7 80EUs
min: 13 fps, P1: 14.88 fps, max: 21 fps
Intel Core i5-1135G7 2.4GHz
Iris Xe G7 80EUs
min: 4.8 fps, P0.1: 5.6 fps, P1: 10.6 fps, max: 74.6 fps
Intel Core i5-1135G7 2.4GHz
Iris Xe G7 80EUs
min: 14 fps, max: 22 fps
Intel Core i5-1140G7 1.8GHz
Iris Xe G7 80EUs
min: 15 fps, max: 21 fps
Intel Core i5-1135G7 2.4GHz
Iris Xe G7 80EUs
min: 3.68 fps, P0.1: 3.82 fps, P1: 6.51 fps, max: 95.7 fps
Intel Core i5-1235U 0.9GHz
Iris Xe G7 80EUs
min: 16 fps, max: 24 fps
Intel Core i5-1135G7 2.4GHz
Iris Xe G7 80EUs
min: 18 fps, max: 22 fps
Intel Core i5-1230U 0.7GHz
Iris Xe G7 80EUs
min: 17 fps, max: 23 fps
Intel Core i5-1335U 0.9GHz
Iris Xe G7 80EUs
min: 18 fps, max: 25 fps
Intel Core i5-1335U 0.9GHz
Iris Xe G7 80EUs
min: 19 fps, max: 24 fps
Intel Core i5-1250P 1.2GHz
Iris Xe G7 80EUs
min: 17 fps, max: 26 fps
Intel Core i5-1135G7 2.4GHz
Iris Xe G7 80EUs
min: 9.98 fps, P0.1: 11.8 fps, P1: 18.5 fps, max: 64.6 fps
Intel Core i5-1240U 0.8GHz
Iris Xe G7 80EUs
min: 22 fps, max: 27 fps
Intel Core i5-1240P 1.2GHz
Iris Xe G7 80EUs
min: 21 fps, max: 28 fps
Intel Core i5-1335U 0.9GHz
Iris Xe G7 80EUs
min: 20 fps, max: 29 fps
Intel Core i5-1135G7 2.4GHz
Iris Xe G7 80EUs
min: 19 fps, P1: 21.36 fps, max: 34 fps
Intel Core i5-1240P 1.2GHz
Iris Xe G7 80EUs
min: 12.2 fps, P0.1: 13.1 fps, P1: 16.1 fps, max: 82.7 fps
Intel Core i5-1135G7 2.4GHz
Iris Xe G7 80EUs
min: 13.2 fps, P0.1: 13.3 fps, P1: 13.9 fps, max: 79.2 fps
Intel Core i5-1235U 0.9GHz
Iris Xe G7 80EUs
min: 12.7 fps, P0.1: 13.3 fps, P1: 14.4 fps, max: 129.5 fps
Intel Core i5-1235U 0.9GHz
Iris Xe G7 80EUs
min: 24 fps, max: 29 fps
Intel Core i5-1335U 0.9GHz
Iris Xe G7 80EUs
min: 22 fps, max: 31 fps
Intel Core i5-1145G7 2.6GHz
Iris Xe G7 80EUs
min: 13.7 fps, P0.1: 14.2 fps, P1: 15.9 fps, max: 94.2 fps
Intel Core i5-1245U 1.2GHz
Iris Xe G7 80EUs
min: 12.8 fps, P0.1: 13.7 fps, P1: 15.4 fps, max: 122.2 fps
Intel Core i5-1155G7 2.5GHz
Iris Xe G7 80EUs
min: 24 fps, P1: 24 fps, max: 32 fps
Intel Core i5-1335U 0.9GHz
Iris Xe G7 80EUs
min: 2.43 fps, P0.1: 10.4 fps, P1: 16.1 fps, max: 155.1 fps
Intel Core i5-1155G7 2.5GHz
Iris Xe G7 80EUs
min: 25 fps, P1: 25.64 fps, max: 37 fps
Intel Core i5-1135G7 2.4GHz
Iris Xe G7 80EUs
min: 25 fps, max: 32 fps
AMD Ryzen 5 5500U @4GHz
GeForce GTX 1650 Mobile
min: 6.3 fps, P0.1: 35.4 fps, P1: 45 fps, max: 143.9 fps
AMD Ryzen 7 3750H 2.3GHz
GeForce GTX 1650 Mobile
min: 47 fps, P1: 47.78 fps, max: 63 fps
AMD Ryzen 7 5800H 3.2GHz
GeForce GTX 1650 Mobile
min: 48 fps, max: 63 fps
Intel Core i7-10750H 2.6GHz
GeForce GTX 1650 Mobile
min: 24.4 fps, P0.1: 28.3 fps, P1: 44.3 fps, max: 231 fps
AMD Ryzen 5 5600H 3.3GHz
GeForce GTX 1650 Mobile
min: 52 fps, max: 69 fps
AMD Ryzen 7 5800H 3.2GHz
GeForce GTX 1650 Mobile
min: 60 fps, max: 77 fps
Intel Core i5-1135G7 2.4GHz
Iris Xe G7 80EUs
min: 5 fps, P1: 6 fps, max: 7 fps
Intel Core i5-1135G7 2.4GHz
Iris Xe G7 80EUs
min: 3.35 fps, P0.1: 3.37 fps, P1: 4.51 fps, max: 15.5 fps
Intel Core i5-1135G7 2.4GHz
Iris Xe G7 80EUs
min: 3.75 fps, P0.1: 3.76 fps, P1: 5.25 fps, max: 17.7 fps
Intel Core i5-1135G7 2.4GHz
Iris Xe G7 80EUs
min: 7 fps, P1: 8 fps, max: 9 fps
Intel Core i5-1240P 1.2GHz
Iris Xe G7 80EUs
min: 6 fps, P1: 7 fps, max: 9 fps
Intel Core i5-1135G7 2.4GHz
Iris Xe G7 80EUs
min: 6 fps, P1: 6 fps, max: 11 fps
Intel Core i5-1230U 0.7GHz
Iris Xe G7 80EUs
min: 7 fps, max: 10 fps
Intel Core i5-1335U 0.9GHz
Iris Xe G7 80EUs
min: 7 fps, max: 10 fps
Intel Core i5-1135G7 2.4GHz
Iris Xe G7 80EUs
min: 8 fps, P1: 8 fps, max: 10 fps
Intel Core i7-1250U 0.8GHz
Iris Xe G7 80EUs
min: 8 fps, P1: 9 fps, max: 11 fps
Intel Core i5-1135G7 2.4GHz
Iris Xe G7 80EUs
min: 8 fps, P1: 8 fps, max: 11 fps
Intel Core i5-1135G7 2.4GHz
Iris Xe G7 80EUs
min: 7 fps, P1: 9 fps, max: 13 fps
Intel Core i5-1235U 0.9GHz
Iris Xe G7 80EUs
min: 8 fps, max: 11 fps
Intel Core i5-1140G7 1.8GHz
Iris Xe G7 80EUs
min: 7 fps, max: 12 fps
Intel Core i5-1240P 1.2GHz
Iris Xe G7 80EUs
min: 4.59 fps, P0.1: 4.84 fps, P1: 7.56 fps, max: 17.5 fps
Intel Core i5-1235U 0.9GHz
Iris Xe G7 80EUs
min: 7 fps, P1: 9 fps, max: 11 fps
Intel Core i5-1130G7 1.8GHz
Iris Xe G7 80EUs
min: 8 fps, P1: 9 fps, max: 12 fps
Intel Core i5-1135G7 2.4GHz
Iris Xe G7 80EUs
min: 4.4 fps, P0.1: 4.9 fps, P1: 6.4 fps, max: 31.3 fps
Intel Core i5-1235U 0.9GHz
Iris Xe G7 80EUs
min: 8 fps, P1: 9 fps, max: 12 fps
Intel Core i5-1135G7 2.4GHz
Iris Xe G7 80EUs
min: 8 fps, max: 12 fps
Intel Core i5-1250P 1.2GHz
Iris Xe G7 80EUs
min: 8 fps, max: 13 fps
Intel Core i5-1335U 0.9GHz
Iris Xe G7 80EUs
min: 8 fps, max: 12 fps
Intel Core i5-1135G7 2.4GHz
Iris Xe G7 80EUs
min: 9 fps, P1: 10 fps, max: 12 fps
Intel Core i5-1240U 0.8GHz
Iris Xe G7 80EUs
min: 9 fps, max: 13 fps
Intel Core i5-1240P 1.2GHz
Iris Xe G7 80EUs
min: 9 fps, P1: 9 fps, max: 13 fps
Intel Core i5-1135G7 2.4GHz
Iris Xe G7 80EUs
min: 4.41 fps, P0.1: 4.54 fps, P1: 5.56 fps, max: 80.9 fps
Dual-Channel
Intel Core i5-1135G7 2.4GHz
Iris Xe G7 80EUs
min: 3.3 fps, P0.1: 4.73 fps, P1: 8.21 fps, max: 33.4 fps
Intel Core i5-1335U 0.9GHz
Iris Xe G7 80EUs
min: 9 fps, P1: 10 fps, max: 13 fps
Intel Core i5-1335U 0.9GHz
Iris Xe G7 80EUs
min: 10 fps, max: 13 fps
Intel Core i5-1335U 0.9GHz
Iris Xe G7 80EUs
min: 9 fps, max: 13 fps
Intel Core i5-11300H 3.1GHz
Iris Xe G7 80EUs
min: 11 fps, P1: 11 fps, max: 14 fps
Intel Core i5-1235U 0.9GHz
Iris Xe G7 80EUs
min: 10 fps, max: 14 fps
Intel Core i5-1240P 1.2GHz
Iris Xe G7 80EUs
min: 10 fps, max: 14 fps
Intel Core i5-1135G7 2.4GHz
Iris Xe G7 80EUs
min: 10 fps, P1: 11 fps, max: 14 fps
Intel Core i5-1235U 0.9GHz
Iris Xe G7 80EUs
min: 3.35 fps, P0.1: 5.87 fps, P1: 7.15 fps, max: 72.3 fps
Intel Core i5-1335U 0.9GHz
Iris Xe G7 80EUs
min: 10 fps, max: 14 fps
Intel Core i5-1135G7 2.4GHz
Iris Xe G7 80EUs
min: 9 fps, P1: 10 fps, max: 16 fps
Intel Core i5-1335U 0.9GHz
Iris Xe G7 80EUs
min: 6.5 fps, P0.1: 7.63 fps, P1: 8.62 fps, max: 30.4 fps
Intel Core i5-1240P 1.2GHz
Iris Xe G7 80EUs
min: 12 fps, P1: 12 fps, max: 14 fps
Intel Core i5-1135G7 2.4GHz
Iris Xe G7 80EUs
min: 6.67 fps, P0.1: 7.01 fps, P1: 11 fps, max: 53.1 fps
Intel Core i5-1155G7 2.5GHz
Iris Xe G7 80EUs
min: 11 fps, P1: 12 fps, max: 15 fps
Intel Core i5-1135G7 2.4GHz
Iris Xe G7 80EUs
min: 11 fps, max: 17 fps
Intel Core i5-1155G7 2.5GHz
Iris Xe G7 80EUs
min: 12 fps, P1: 13 fps, max: 14 fps
Intel Core i5-1135G7 2.4GHz
Iris Xe G7 80EUs
min: 6.66 fps, P0.1: 6.67 fps, P1: 6.96 fps, max: 74.1 fps
Intel Core i5-1335U 0.9GHz
Iris Xe G7 80EUs
min: 12 fps, P1: 13 fps, max: 15 fps
Hoch
Intel Core i5-1240P 1.2GHz
Iris Xe G7 80EUs
min: 6.51 fps, P0.1: 6.63 fps, P1: 10.9 fps, max: 29 fps
Intel Core i5-12500H 1.8GHz
Iris Xe G7 80EUs
min: 13 fps, P1: 13 fps, max: 15 fps
Intel Core i7-9750H 2.6GHz
GeForce GTX 1650 Mobile
min: 27 fps, P1: 28 fps, max: 32 fps
AMD Ryzen 7 5800H 3.2GHz
GeForce GTX 1650 Mobile
min: 26 fps, max: 37 fps
AMD Ryzen 7 3750H 2.3GHz
GeForce GTX 1650 Mobile
min: 26 fps, P1: 26.4 fps, max: 38 fps
Intel Core i5-9300H 2.4GHz
GeForce GTX 1650 Mobile
min: 32 fps, P1: 32 fps, max: 37 fps
Intel Core i7-10750H 2.6GHz
GeForce GTX 1650 Mobile
min: 15.4 fps, P0.1: 15.7 fps, P1: 16.3 fps, max: 147 fps
AMD Ryzen 5 5500U @4GHz
GeForce GTX 1650 Mobile
min: 6.8 fps, P0.1: 26.7 fps, P1: 32 fps, max: 81.4 fps
AMD Ryzen 7 5800H 3.2GHz
GeForce GTX 1650 Mobile
min: 33 fps, max: 44 fps
Intel Core i5-1335U 0.9GHz
Iris Xe G7 80EUs
min: 4.94 fps, P0.1: 5.43 fps, P1: 6.08 fps, max: 28.4 fps

GTA V
2015Intel Core i5-1135G7 2.4GHz
Iris Xe G7 80EUs
min: 4.19 fps, P1: 20 fps, max: 128 fps
Intel Core i5-1135G7 2.4GHz
Iris Xe G7 80EUs
min: 7.26 fps, P1: 23.8 fps, max: 74.8 fps
Intel Core i5-1135G7 2.4GHz
Iris Xe G7 80EUs
min: 14.6 fps, P1: 24.4 fps, max: 72.2 fps
Intel Core i5-1135G7 2.4GHz
Iris Xe G7 80EUs
min: 13 fps, P1: 26.3 fps, max: 85.4 fps
Intel Core i5-1235U 0.9GHz
Iris Xe G7 80EUs
min: 6.78 fps, P1: 22.7 fps, max: 96.3 fps
Intel Core i5-1135G7 2.4GHz
Iris Xe G7 80EUs
min: 1.947 fps, P1: 28.6 fps, max: 146 fps
Intel Core i5-1135G7 2.4GHz
Iris Xe G7 80EUs
min: 8.57 fps, P1: 38.5 fps, max: 172 fps
Intel Core i5-1335U 0.9GHz
Iris Xe G7 80EUs
min: 7.59 fps, P1: 34.5 fps, max: 92.3 fps
Intel Core i5-1130G7 1.8GHz
Iris Xe G7 80EUs
min: 9.92 fps, P1: 26.3 fps, max: 158 fps
Intel Core i5-1135G7 2.4GHz
Iris Xe G7 80EUs
min: 14.8 fps, P1: 41.7 fps, max: 129 fps
Intel Core i5-1130G7 1.8GHz
Iris Xe G7 80EUs
min: 13 fps, P1: 33.3 fps, max: 107 fps
Intel Core i5-1135G7 2.4GHz
Iris Xe G7 80EUs
min: 10.2 fps, P1: 47.6 fps, max: 105 fps
Intel Core i5-1230U 0.7GHz
Iris Xe G7 80EUs
min: 8.61 fps, P1: 28.6 fps, max: 117.4 fps
Intel Core i5-1240P 1.2GHz
Iris Xe G7 80EUs
min: 10.6 fps, P1: 35.7 fps, max: 93.3 fps
Intel Core i5-1235U 0.9GHz
Iris Xe G7 80EUs
min: 1.27 fps, P1: 25 fps, max: 129.7 fps
Intel Core i5-1135G7 2.4GHz
Iris Xe G7 80EUs
min: 8.71 fps, P1: 41.7 fps, max: 145 fps
Intel Core i5-1235U 0.9GHz
Iris Xe G7 80EUs
min: 14.9 fps, P1: 38.5 fps, max: 110.4 fps
Intel Core i5-1135G7 2.4GHz
Iris Xe G7 80EUs
min: 20 fps, P1: 40 fps, max: 105.1 fps
Intel Core i5-1135G7 2.4GHz
Iris Xe G7 80EUs
min: 7.45 fps, P1: 30.3 fps, max: 109.4 fps
Intel Core i5-1240P 1.2GHz
Iris Xe G7 80EUs
min: 10.2 fps, P1: 38.5 fps, max: 116.5 fps
Intel Core i5-1135G7 2.4GHz
Iris Xe G7 80EUs
min: 14.1 fps, P1: 45.5 fps, max: 143 fps
Intel Core i5-1240P 1.2GHz
Iris Xe G7 80EUs
min: 10.9 fps, P1: 40 fps, max: 118.4 fps
Intel Core i5-1135G7 2.4GHz
Iris Xe G7 80EUs
min: 10.2 fps, P1: 43.5 fps, max: 190 fps
Intel Core i5-1240P 1.2GHz
Iris Xe G7 80EUs
min: 6.6 fps, P1: 27.8 fps, max: 255 fps
Intel Core i5-1135G7 2.4GHz
Iris Xe G7 80EUs
min: 8.79 fps, P1: 38.5 fps, max: 284 fps
Intel Core i5-1135G7 2.4GHz
Iris Xe G7 80EUs
min: 15 fps, P1: 43.5 fps, max: 233 fps
Intel Core i7-1250U 0.8GHz
Iris Xe G7 80EUs
min: 6.73 fps, P1: 14.9 fps, max: 162.5 fps
Intel Core i5-1235U 0.9GHz
Iris Xe G7 80EUs
min: 10.2 fps, P1: 47.6 fps, max: 124.4 fps
Intel Core i5-1135G7 2.4GHz
Iris Xe G7 80EUs
min: 17.9 fps, P1: 55.6 fps, max: 97.7 fps
Dual-Channel
Intel Core i5-1135G7 2.4GHz
Iris Xe G7 80EUs
min: 7.73 fps, P1: 50 fps, max: 229 fps
Dual-Channel
Intel Core i5-1135G7 2.4GHz
Iris Xe G7 80EUs
min: 22 fps, P1: 52.6 fps, max: 141 fps
Intel Core i5-1135G7 2.4GHz
Iris Xe G7 80EUs
min: 16.3 fps, P1: 52.6 fps, max: 141 fps
Intel Core i5-1135G7 2.4GHz
Iris Xe G7 80EUs
min: 5.16 fps, P1: 41.7 fps, max: 165.4 fps
Intel Core i5-1345U 1.2GHz
Iris Xe G7 80EUs
min: 17.2 fps, P1: 50 fps, max: 138.8 fps
Intel Core i5-1135G7 2.4GHz
Iris Xe G7 80EUs
min: 20 fps, P1: 50 fps, max: 144 fps
Intel Core i5-1345U 1.2GHz
Iris Xe G7 80EUs
min: 14.4 fps, P1: 52.6 fps, max: 138.3 fps
Intel Core i5-1335U 0.9GHz
Iris Xe G7 80EUs
min: 10.6 fps, P1: 52.6 fps, max: 189.8 fps
Intel Core i5-1135G7 2.4GHz
Iris Xe G7 80EUs
min: 13.4 fps, P1: 55.6 fps, max: 171 fps
Intel Core i5-1135G7 2.4GHz
Iris Xe G7 80EUs
min: 14.9 fps, P1: 50 fps, max: 148 fps
Intel Core i5-1335U 0.9GHz
Iris Xe G7 80EUs
min: 7.05 fps, P1: 52.6 fps, max: 196.2 fps
Intel Core i5-1240P 1.2GHz
Iris Xe G7 80EUs
min: 11.4 fps, P1: 47.6 fps, max: 140.1 fps
Intel Core i5-1240P 1.2GHz
Iris Xe G7 80EUs
min: 15.8 fps, P1: 40 fps, max: 147.1 fps
Intel Core i5-1155G7 2.5GHz
Iris Xe G7 80EUs
min: 15.9 fps, P1: 52.6 fps, max: 165.7 fps
Intel Core i5-1340P 1.4GHz
Iris Xe G7 80EUs
min: 0.55 fps, P1: 24.4 fps, max: 230 fps
Hoch
Intel Core i5-1240P 1.2GHz
Iris Xe G7 80EUs
min: 18.1 fps, P1: 58.8 fps, max: 147 fps
Intel Core i5-1145G7 2.6GHz
Iris Xe G7 80EUs
min: 6.11 fps, P1: 50 fps, max: 237 fps
Intel Core i5-1135G7 2.4GHz
Iris Xe G7 80EUs
min: 21.9 fps, P1: 55.6 fps, max: 151 fps
Intel Core i5-1235U 0.9GHz
Iris Xe G7 80EUs
min: 15.5 fps, P1: 55.6 fps, max: 155.5 fps
Intel Core i5-1155G7 2.5GHz
Iris Xe G7 80EUs
min: 13.5 fps, P1: 55.6 fps, max: 173.7 fps
Intel Core i5-1245U 1.2GHz
Iris Xe G7 80EUs
min: 17.8 fps, P1: 62.5 fps, max: 179 fps
Intel Core i5-1135G7 2.4GHz
Iris Xe G7 80EUs
min: 14.8 fps, P1: 55.6 fps, max: 228 fps
Intel Core i5-1135G7 2.4GHz
Iris Xe G7 80EUs
min: 11.7 fps, P1: 52.6 fps, max: 240 fps
Intel Core i5-1345U 1.2GHz
Iris Xe G7 80EUs
min: 12 fps, P1: 50 fps, max: 188.2 fps
Intel Core i5-1335U 0.9GHz
Iris Xe G7 80EUs
min: 17.3 fps, P1: 58.8 fps, max: 174.6 fps
Intel Core i5-1350P 1.4GHz
Iris Xe G7 80EUs
min: 12.6 fps, P1: 62.5 fps, max: 214 fps
Intel Core i5-11300H 3.1GHz
Iris Xe G7 80EUs
min: 14 fps, P1: 62.5 fps, max: 229 fps
Intel Core 5 120U 0.9GHz
Iris Xe G7 80EUs
min: 12.1 fps, P1: 62.5 fps, max: 165.6 fps
Intel Core i5-1240U 0.8GHz
Iris Xe G7 80EUs
min: 23.4 fps, P1: 62.5 fps, max: 182.2 fps
Intel Core i5-1155G7 2.5GHz
Iris Xe G7 80EUs
min: 15 fps, P1: 62.5 fps, max: 179 fps
Intel Core i5-1335U 0.9GHz
Iris Xe G7 80EUs
min: 17.6 fps, P1: 62.5 fps, max: 194.2 fps
Intel Core i5-1335U 0.9GHz
Iris Xe G7 80EUs
min: 24.5 fps, P1: 66.7 fps, max: 177.6 fps
Intel Core i5-1335U 0.9GHz
Iris Xe G7 80EUs
min: 13 fps, P1: 66.7 fps, max: 252 fps
Intel Core i5-1335U 0.9GHz
Iris Xe G7 80EUs
min: 17.8 fps, P1: 71.4 fps, max: 174 fps
Intel Core i5-1235U 0.9GHz
Iris Xe G7 80EUs
min: 6.23 fps, P1: 83.3 fps, max: 175.7 fps
Intel Core i5-1335U 0.9GHz
Iris Xe G7 80EUs
min: 23.8 fps, P1: 62.5 fps, max: 245 fps
Intel Core i5-1335U 0.9GHz
Iris Xe G7 80EUs
min: 11.9 fps, P1: 55.6 fps, max: 209 fps
Intel Core i5-1240P 1.2GHz
Iris Xe G7 80EUs
min: 19.6 fps, P1: 71.4 fps, max: 167.1 fps
Intel Core i5-1235U 0.9GHz
Iris Xe G7 80EUs
min: 24.8 fps, P1: 71.4 fps, max: 197.3 fps
Intel Core i5-12500H 1.8GHz
Iris Xe G7 80EUs
min: 21.3 fps, P1: 66.7 fps, max: 237 fps
Intel Core i5-1340P 1.4GHz
Iris Xe G7 80EUs
min: 1.807 fps, P1: 76.9 fps, max: 295 fps
Intel Core i5-13500H 1.9GHz
Iris Xe G7 80EUs
min: 8.46 fps, P1: 100 fps, max: 307 fps
Intel Core i5-1135G7 2.4GHz
GeForce GTX 1650 Mobile
min: 40.5 fps, P1: 66.7 fps, max: 177 fps
AMD Ryzen 5 5500U @4GHz
GeForce GTX 1650 Mobile
min: 12.6 fps, P1: 71.4 fps, max: 206 fps
AMD Ryzen 7 5800H 3.2GHz
GeForce GTX 1650 Mobile
min: 5.2 fps, P1: 125 fps, max: 270 fps
Intel Core i7-9750H 2.6GHz
GeForce GTX 1650 Mobile
min: 4.08 fps, P1: 143 fps, max: 271 fps
Intel Core i5-1135G7 2.4GHz
Iris Xe G7 80EUs
min: 8.41 fps, P1: 15.9 fps, max: 102 fps
Intel Core i5-1135G7 2.4GHz
Iris Xe G7 80EUs
min: 13.7 fps, P1: 19.2 fps, max: 64.9 fps
Intel Core i5-1135G7 2.4GHz
Iris Xe G7 80EUs
min: 5.01 fps, P1: 17.9 fps, max: 70 fps
Intel Core i5-1135G7 2.4GHz
Iris Xe G7 80EUs
min: 14.3 fps, P1: 21.7 fps, max: 75.8 fps
Intel Core i5-1230U 0.7GHz
Iris Xe G7 80EUs
min: 8.67 fps, P1: 21.3 fps, max: 70.3 fps
Intel Core i5-1130G7 1.8GHz
Iris Xe G7 80EUs
min: 15 fps, P1: 23.3 fps, max: 90.4 fps
Intel Core i5-1135G7 2.4GHz
Iris Xe G7 80EUs
min: 2.69 fps, P1: 23.8 fps, max: 90.9 fps
Intel Core i7-1250U 0.8GHz
Iris Xe G7 80EUs
min: 6 fps, P1: 14.5 fps, max: 150 fps
Intel Core i5-1135G7 2.4GHz
Iris Xe G7 80EUs
min: 10.6 fps, P1: 29.4 fps, max: 236 fps
Intel Core i5-1135G7 2.4GHz
Iris Xe G7 80EUs
min: 11.9 fps, P1: 31.3 fps, max: 74 fps
Intel Core i5-1235U 0.9GHz
Iris Xe G7 80EUs
min: 6.73 fps, P1: 25 fps, max: 85.9 fps
Intel Core i5-1235U 0.9GHz
Iris Xe G7 80EUs
min: 0.983 fps, P1: 25.6 fps, max: 87.8 fps
Intel Core i5-1240P 1.2GHz
Iris Xe G7 80EUs
min: 11.5 fps, P1: 33.3 fps, max: 74.9 fps
Intel Core i5-1335U 0.9GHz
Iris Xe G7 80EUs
min: 17.2 fps, P1: 31.3 fps, max: 93.5 fps
Intel Core i5-1135G7 2.4GHz
Iris Xe G7 80EUs
min: 12.5 fps, P1: 32.3 fps, max: 104 fps
Intel Core i5-1135G7 2.4GHz
Iris Xe G7 80EUs
min: 17.5 fps, P1: 33.3 fps, max: 269 fps
Intel Core i5-1130G7 1.8GHz
Iris Xe G7 80EUs
min: 12.8 fps, P1: 31.3 fps, max: 113 fps
Intel Core i5-1240P 1.2GHz
Iris Xe G7 80EUs
min: 9.55 fps, P1: 37 fps, max: 105 fps
Intel Core i5-1135G7 2.4GHz
Iris Xe G7 80EUs
min: 12.4 fps, P1: 31.3 fps, max: 103.8 fps
Intel Core i5-1135G7 2.4GHz
Iris Xe G7 80EUs
min: 10.9 fps, P1: 43.5 fps, max: 68.4 fps
Intel Core i5-1135G7 2.4GHz
Iris Xe G7 80EUs
min: 10.3 fps, P1: 37 fps, max: 110 fps
Intel Core i5-1135G7 2.4GHz
Iris Xe G7 80EUs
min: 21.1 fps, P1: 31.3 fps, max: 98.8 fps
Intel Core i5-1240P 1.2GHz
Iris Xe G7 80EUs
min: 13 fps, P1: 32.3 fps, max: 114.8 fps
Intel Core i5-1135G7 2.4GHz
Iris Xe G7 80EUs
min: 17.4 fps, P1: 35.7 fps, max: 265 fps
Intel Core i5-1135G7 2.4GHz
Iris Xe G7 80EUs
min: 12.4 fps, P1: 37 fps, max: 97 fps
Intel Core i5-1135G7 2.4GHz
Iris Xe G7 80EUs
min: 14.1 fps, P1: 34.5 fps, max: 107 fps
Intel Core i5-1235U 0.9GHz
Iris Xe G7 80EUs
min: 22.9 fps, P1: 34.5 fps, max: 110.9 fps
Dual-Channel
Intel Core i5-1135G7 2.4GHz
Iris Xe G7 80EUs
min: 20.3 fps, P1: 41.7 fps, max: 105 fps
Dual-Channel
Intel Core i5-1135G7 2.4GHz
Iris Xe G7 80EUs
min: 5.99 fps, P1: 41.7 fps, max: 205 fps
Intel Core i5-1240P 1.2GHz
Iris Xe G7 80EUs
min: 6.74 fps, P1: 32.3 fps, max: 258 fps
Intel Core i5-1235U 0.9GHz
Iris Xe G7 80EUs
min: 16.6 fps, P1: 43.5 fps, max: 113.4 fps
Intel Core i5-1345U 1.2GHz
Iris Xe G7 80EUs
min: 21.2 fps, P1: 43.5 fps, max: 103.6 fps
Intel Core i5-1335U 0.9GHz
Iris Xe G7 80EUs
min: 34.9 fps, P1: 41.7 fps, max: 107.2 fps
Intel Core i5-1335U 0.9GHz
Iris Xe G7 80EUs
min: 20.4 fps, P1: 45.5 fps, max: 109 fps
Intel Core i5-1135G7 2.4GHz
Iris Xe G7 80EUs
min: 7.09 fps, P1: 37 fps, max: 122 fps
Intel Core i5-1135G7 2.4GHz
Iris Xe G7 80EUs
min: 13.1 fps, P1: 34.5 fps, max: 132.2 fps
Intel Core i5-1135G7 2.4GHz
Iris Xe G7 80EUs
min: 11.1 fps, P1: 43.5 fps, max: 202 fps
Intel Core i5-1335U 0.9GHz
Iris Xe G7 80EUs
min: 21.2 fps, P1: 45.5 fps, max: 121.9 fps
Intel Core i5-1345U 1.2GHz
Iris Xe G7 80EUs
min: 19.6 fps, P1: 45.5 fps, max: 118.9 fps
Intel Core i5-1135G7 2.4GHz
Iris Xe G7 80EUs
min: 13.2 fps, P1: 41.7 fps, max: 125.5 fps
Intel Core i5-1240P 1.2GHz
Iris Xe G7 80EUs
min: 12.4 fps, P1: 32.3 fps, max: 123.7 fps
Intel Core i5-1135G7 2.4GHz
Iris Xe G7 80EUs
min: 9.48 fps, P1: 40 fps, max: 142 fps
Intel Core i5-1340P 1.4GHz
Iris Xe G7 80EUs
min: 1.918 fps, P1: 24.4 fps, max: 170.6 fps
Intel Core i5-1135G7 2.4GHz
Iris Xe G7 80EUs
min: 21.5 fps, P1: 50 fps, max: 150 fps
Hoch
Intel Core i5-1240P 1.2GHz
Iris Xe G7 80EUs
min: 15.6 fps, P1: 41.7 fps, max: 126.4 fps
Intel Core i5-1145G7 2.6GHz
Iris Xe G7 80EUs
min: 13.6 fps, P1: 47.6 fps, max: 138.8 fps
Intel Core i5-1235U 0.9GHz
Iris Xe G7 80EUs
min: 19.5 fps, P1: 50 fps, max: 125.7 fps
Intel Core i5-1235U 0.9GHz
Iris Xe G7 80EUs
min: 7.05 fps, P1: 50 fps, max: 177.5 fps
Intel Core i5-1240P 1.2GHz
Iris Xe G7 80EUs
min: 16 fps, P1: 45.5 fps, max: 139.1 fps
Intel Core i5-1135G7 2.4GHz
Iris Xe G7 80EUs
min: 0.4206 fps, P1: 47.6 fps, max: 157 fps
Intel Core i5-1335U 0.9GHz
Iris Xe G7 80EUs
min: 19.7 fps, P1: 47.6 fps, max: 137.5 fps
Intel Core i5-1155G7 2.5GHz
Iris Xe G7 80EUs
min: 18.2 fps, P1: 47.6 fps, max: 153.4 fps
Intel Core i5-1135G7 2.4GHz
Iris Xe G7 80EUs
min: 12.3 fps, P1: 41.7 fps, max: 263 fps
Intel Core i5-1335U 0.9GHz
Iris Xe G7 80EUs
min: 24.1 fps, P1: 50 fps, max: 139.8 fps
Intel Core i5-1155G7 2.5GHz
Iris Xe G7 80EUs
min: 18.2 fps, P1: 52.6 fps, max: 155.7 fps
Intel Core i5-11300H 3.1GHz
Iris Xe G7 80EUs
min: 13.9 fps, P1: 52.6 fps, max: 166 fps
Intel Core i5-1245U 1.2GHz
Iris Xe G7 80EUs
min: 9.45 fps, P1: 55.6 fps, max: 212 fps
Intel Core i5-1155G7 2.5GHz
Iris Xe G7 80EUs
min: 15.7 fps, P1: 55.6 fps, max: 147 fps
Intel Core 5 120U 0.9GHz
Iris Xe G7 80EUs
min: 14.4 fps, P1: 58.8 fps, max: 141 fps
Intel Core i5-1240P 1.2GHz
Iris Xe G7 80EUs
min: 3.15 fps, P1: 55.6 fps, max: 260 fps
Intel Core i5-1345U 1.2GHz
Iris Xe G7 80EUs
min: 7.31 fps, P1: 47.6 fps, max: 224 fps
Intel Core i5-1240U 0.8GHz
Iris Xe G7 80EUs
min: 18.7 fps, P1: 55.6 fps, max: 155.1 fps
Intel Core i5-1335U 0.9GHz
Iris Xe G7 80EUs
min: 21.2 fps, P1: 55.6 fps, max: 158.4 fps
Intel Core i5-1350P 1.4GHz
Iris Xe G7 80EUs
min: 5.63 fps, P1: 58.8 fps, max: 199.2 fps
Intel Core i5-1335U 0.9GHz
Iris Xe G7 80EUs
min: 6.57 fps, P1: 55.6 fps, max: 167.7 fps
Intel Core i5-1235U 0.9GHz
Iris Xe G7 80EUs
min: 6.9 fps, P1: 58.8 fps, max: 169.6 fps
Intel Core i5-1235U 0.9GHz
Iris Xe G7 80EUs
min: 7.72 fps, P1: 66.7 fps, max: 246 fps
Intel Core i5-1335U 0.9GHz
Iris Xe G7 80EUs
min: 19.9 fps, P1: 62.5 fps, max: 152.6 fps
Intel Core i5-1335U 0.9GHz
Iris Xe G7 80EUs
min: 17.2 fps, P1: 50 fps, max: 159.9 fps
Intel Core i5-12500H 1.8GHz
Iris Xe G7 80EUs
min: 19 fps, P1: 58.8 fps, max: 224 fps
Intel Core i5-1340P 1.4GHz
Iris Xe G7 80EUs
min: 11.3 fps, P1: 58.8 fps, max: 198 fps
Intel Core i5-13500H 1.9GHz
Iris Xe G7 80EUs
min: 46.7 fps, P1: 83.3 fps, max: 296 fps
Intel Core i5-1135G7 2.4GHz
GeForce GTX 1650 Mobile
min: 31.9 fps, P1: 43.5 fps, max: 163 fps
AMD Ryzen 7 5800H 3.2GHz
GeForce GTX 1650 Mobile
min: 4.78 fps, P1: 100 fps, max: 275 fps
Intel Core i7-9750H 2.6GHz
GeForce GTX 1650 Mobile
min: 5.25 fps, P1: 125 fps, max: 295 fps
Intel Core i5-1135G7 2.4GHz
Iris Xe G7 80EUs
min: 2.81 fps, P1: 4.1 fps, max: 111 fps
Intel Core i7-1250U 0.8GHz
Iris Xe G7 80EUs
min: 2.65 fps, P1: 2.96 fps, max: 55.7 fps
Intel Core i5-1135G7 2.4GHz
Iris Xe G7 80EUs
min: 2.1 fps, P1: 4.76 fps, max: 38.2 fps
Intel Core i5-1135G7 2.4GHz
Iris Xe G7 80EUs
min: 4.18 fps, P1: 5.21 fps, max: 25.7 fps
Intel Core i5-1135G7 2.4GHz
Iris Xe G7 80EUs
min: 4.29 fps, P1: 5.38 fps, max: 26.3 fps
Intel Core i5-1240P 1.2GHz
Iris Xe G7 80EUs
min: 4.82 fps, P1: 7.19 fps, max: 26 fps
Intel Core i5-1335U 0.9GHz
Iris Xe G7 80EUs
min: 4.36 fps, P1: 7.52 fps, max: 25.8 fps
Intel Core i5-1135G7 2.4GHz
Iris Xe G7 80EUs
min: 4.66 fps, P1: 7.58 fps, max: 89.2 fps
Intel Core i5-1135G7 2.4GHz
Iris Xe G7 80EUs
min: 4.48 fps, P1: 7.25 fps, max: 18.9 fps
Intel Core i5-1235U 0.9GHz
Iris Xe G7 80EUs
min: 0.853 fps, P1: 3.31 fps, max: 87.7 fps
Intel Core i5-1230U 0.7GHz
Iris Xe G7 80EUs
min: 3.09 fps, P1: 5.59 fps, max: 80.4 fps
Intel Core i5-1235U 0.9GHz
Iris Xe G7 80EUs
min: 3.81 fps, P1: 5.78 fps, max: 40.9 fps
Intel Core i5-1135G7 2.4GHz
Iris Xe G7 80EUs
min: 2.63 fps, P1: 7.25 fps, max: 127 fps
Intel Core i5-1130G7 1.8GHz
Iris Xe G7 80EUs
min: 6.12 fps, P1: 9.17 fps, max: 24.3 fps
Intel Core i5-1335U 0.9GHz
Iris Xe G7 80EUs
min: 7.11 fps, P1: 10.3 fps, max: 111.2 fps
Intel Core i5-1135G7 2.4GHz
Iris Xe G7 80EUs
min: 4.7 fps, P1: 10 fps, max: 78.4 fps
Intel Core i5-1345U 1.2GHz
Iris Xe G7 80EUs
min: 9.29 fps, P1: 10.9 fps, max: 93.5 fps
Intel Core i5-1240P 1.2GHz
Iris Xe G7 80EUs
min: 5.29 fps, P1: 9.8 fps, max: 45.5 fps
Intel Core i5-1135G7 2.4GHz
Iris Xe G7 80EUs
min: 0.933 fps, P1: 6.67 fps, max: 89.4 fps
Intel Core i5-1135G7 2.4GHz
Iris Xe G7 80EUs
min: 6.26 fps, P1: 10.8 fps, max: 25.6 fps
Intel Core i5-1135G7 2.4GHz
Iris Xe G7 80EUs
min: 4.94 fps, P1: 11.8 fps, max: 74.7 fps
Intel Core i5-1235U 0.9GHz
Iris Xe G7 80EUs
min: 4.74 fps, P1: 12.5 fps, max: 95.8 fps
Intel Core i5-1240P 1.2GHz
Iris Xe G7 80EUs
min: 1.86 fps, P1: 6.02 fps, max: 136.8 fps
Intel Core i5-1135G7 2.4GHz
Iris Xe G7 80EUs
min: 6.34 fps, P1: 9.01 fps, max: 44.4 fps
Intel Core i5-1335U 0.9GHz
Iris Xe G7 80EUs
min: 8.54 fps, P1: 12.7 fps, max: 41.4 fps
Intel Core i5-1135G7 2.4GHz
Iris Xe G7 80EUs
min: 5.6 fps, P1: 9.9 fps, max: 54.4 fps
Intel Core i5-1240P 1.2GHz
Iris Xe G7 80EUs
min: 2.3 fps, P1: 13.3 fps, max: 135.5 fps
Intel Core i5-1240P 1.2GHz
Iris Xe G7 80EUs
min: 3.83 fps, P1: 10.2 fps, max: 36.1 fps
Intel Core i5-1135G7 2.4GHz
Iris Xe G7 80EUs
min: 4.41 fps, P1: 12.7 fps, max: 26.2 fps
Intel Core i5-1235U 0.9GHz
Iris Xe G7 80EUs
min: 9.35 fps, P1: 13.5 fps, max: 137.4 fps
Dual-Channel
Intel Core i5-1135G7 2.4GHz
Iris Xe G7 80EUs
min: 8.84 fps, P1: 13.5 fps, max: 38.1 fps
Dual-Channel
Intel Core i5-1135G7 2.4GHz
Iris Xe G7 80EUs
min: 8.95 fps, P1: 13 fps, max: 31.2 fps
Intel Core i5-1235U 0.9GHz
Iris Xe G7 80EUs
min: 6.23 fps, P1: 13.7 fps, max: 35.7 fps
Intel Core i5-1240P 1.2GHz
Iris Xe G7 80EUs
min: 5.96 fps, P1: 12.8 fps, max: 40.4 fps
Intel Core i5-1235U 0.9GHz
Iris Xe G7 80EUs
min: 8.22 fps, P1: 13.2 fps, max: 92.9 fps
Intel Core i5-1240U 0.8GHz
Iris Xe G7 80EUs
min: 6.37 fps, P1: 13.7 fps, max: 117.1 fps
Intel Core i5-1335U 0.9GHz
Iris Xe G7 80EUs
min: 6.42 fps, P1: 13.5 fps, max: 142.1 fps
Intel Core i5-1130G7 1.8GHz
Iris Xe G7 80EUs
min: 4.98 fps, P1: 14.5 fps, max: 113 fps
Intel Core i5-1240P 1.2GHz
Iris Xe G7 80EUs
min: 6.61 fps, P1: 13.7 fps, max: 44.3 fps
Intel Core i5-1335U 0.9GHz
Iris Xe G7 80EUs
min: 7.46 fps, P1: 13.9 fps, max: 35.3 fps
Intel Core i5-1235U 0.9GHz
Iris Xe G7 80EUs
min: 7.23 fps, P1: 15.2 fps, max: 43.8 fps
Intel Core i5-1235U 0.9GHz
Iris Xe G7 80EUs
min: 8.58 fps, P1: 15.6 fps, max: 100.9 fps
Intel Core i5-1335U 0.9GHz
Iris Xe G7 80EUs
min: 8.11 fps, P1: 14.7 fps, max: 37.6 fps
Intel Core i5-1345U 1.2GHz
Iris Xe G7 80EUs
min: 7.08 fps, P1: 14.5 fps, max: 127.1 fps
Hoch
Intel Core i5-1240P 1.2GHz
Iris Xe G7 80EUs
min: 8.63 fps, P1: 15.6 fps, max: 53 fps
Intel Core i5-1345U 1.2GHz
Iris Xe G7 80EUs
min: 7.69 fps, P1: 15.4 fps, max: 64.5 fps
Intel Core i5-1335U 0.9GHz
Iris Xe G7 80EUs
min: 9 fps, P1: 15.2 fps, max: 50.7 fps
Intel Core i5-1135G7 2.4GHz
Iris Xe G7 80EUs
min: 8.42 fps, P1: 14.9 fps, max: 119 fps
Intel Core i5-1335U 0.9GHz
Iris Xe G7 80EUs
min: 9.36 fps, P1: 16.1 fps, max: 45.1 fps
Intel Core i5-1335U 0.9GHz
Iris Xe G7 80EUs
min: 7.8 fps, P1: 15.6 fps, max: 57.8 fps
Intel Core i5-1335U 0.9GHz
Iris Xe G7 80EUs
min: 7.39 fps, P1: 15.9 fps, max: 47.8 fps
Intel Core i5-12500H 1.8GHz
Iris Xe G7 80EUs
min: 8.1 fps, P1: 16.4 fps, max: 104.2 fps
Intel Core i5-1245U 1.2GHz
Iris Xe G7 80EUs
min: 11 fps, P1: 16.7 fps, max: 187.7 fps
Intel Core i5-1135G7 2.4GHz
Iris Xe G7 80EUs
min: 5.93 fps, P1: 15.2 fps, max: 63.5 fps
Intel Core 5 120U 0.9GHz
Iris Xe G7 80EUs
min: 8.86 fps, P1: 15.9 fps, max: 162.9 fps
Intel Core i5-1135G7 2.4GHz
Iris Xe G7 80EUs
min: 6.58 fps, P1: 14.1 fps, max: 106 fps
Intel Core i5-1350P 1.4GHz
Iris Xe G7 80EUs
min: 11.5 fps, P1: 17.2 fps, max: 49.4 fps
Intel Core i5-1135G7 2.4GHz
Iris Xe G7 80EUs
min: 3.54 fps, P1: 11.1 fps, max: 61.2 fps
Intel Core i5-1135G7 2.4GHz
Iris Xe G7 80EUs
min: 7.44 fps, P1: 16.9 fps, max: 126 fps
Intel Core i5-1135G7 2.4GHz
Iris Xe G7 80EUs
min: 1.566 fps, P1: 8.55 fps, max: 68.8 fps
Intel Core i5-13500H 1.9GHz
Iris Xe G7 80EUs
min: 14.7 fps, P1: 18.9 fps, max: 185.5 fps
Intel Core i5-11300H 3.1GHz
Iris Xe G7 80EUs
min: 7.11 fps, P1: 18.5 fps, max: 137 fps
Intel Core i5-1340P 1.4GHz
Iris Xe G7 80EUs
min: 4.58 fps, P1: 11.2 fps, max: 275 fps
Intel Core i5-1155G7 2.5GHz
Iris Xe G7 80EUs
min: 9.11 fps, P1: 18.2 fps, max: 141.7 fps
Intel Core i5-1135G7 2.4GHz
Iris Xe G7 80EUs
min: 5.51 fps, P1: 15.4 fps, max: 109 fps
Intel Core i5-1135G7 2.4GHz
Iris Xe G7 80EUs
min: 6.13 fps, P1: 19.6 fps, max: 39.8 fps
Intel Core i5-1135G7 2.4GHz
Iris Xe G7 80EUs
min: 6.56 fps, P1: 20.4 fps, max: 120.4 fps
Intel Core i5-1145G7 2.6GHz
Iris Xe G7 80EUs
min: 2.45 fps, P1: 15.6 fps, max: 196 fps
Intel Core i5-1155G7 2.5GHz
Iris Xe G7 80EUs
min: 7.62 fps, P1: 19.2 fps, max: 38.7 fps
Intel Core i5-1135G7 2.4GHz
Iris Xe G7 80EUs
min: 2.85 fps, P1: 16.7 fps, max: 139 fps
Intel Core i5-1155G7 2.5GHz
Iris Xe G7 80EUs
min: 7.89 fps, P1: 20.8 fps, max: 138 fps
Intel Core i5-1135G7 2.4GHz
GeForce GTX 1650 Mobile
min: 20.3 fps, P1: 40 fps, max: 118 fps
AMD Ryzen 5 5500U @4GHz
GeForce GTX 1650 Mobile
min: 13.8 fps, P1: 55.6 fps, max: 120 fps
AMD Ryzen 7 5800H 3.2GHz
GeForce GTX 1650 Mobile
min: 13.9 fps, P1: 66.7 fps, max: 162 fps
Intel Core i7-9750H 2.6GHz
GeForce GTX 1650 Mobile
min: 32.7 fps, P1: 71.4 fps, max: 264 fps
Intel Core i5-1135G7 2.4GHz
Iris Xe G7 80EUs
min: 0.823 fps, P1: 2.16 fps, max: 8.39 fps
Intel Core i5-1135G7 2.4GHz
Iris Xe G7 80EUs
min: 0.749 fps, P1: 2.38 fps, max: 7.21 fps
Intel Core i5-1135G7 2.4GHz
Iris Xe G7 80EUs
min: 1.737 fps, P1: 2.45 fps, max: 7.87 fps
Intel Core i5-1135G7 2.4GHz
Iris Xe G7 80EUs
min: 1.749 fps, P1: 2.52 fps, max: 8.13 fps
Intel Core i5-1335U 0.9GHz
Iris Xe G7 80EUs
min: 2.08 fps, P1: 2.51 fps, max: 18 fps
Intel Core i5-1135G7 2.4GHz
Iris Xe G7 80EUs
min: 1.61 fps, P1: 3.57 fps, max: 87.3 fps
Intel Core i5-1135G7 2.4GHz
Iris Xe G7 80EUs
min: 2.33 fps, P1: 3.61 fps, max: 13.4 fps
Intel Core i5-1135G7 2.4GHz
Iris Xe G7 80EUs
min: 1.938 fps, P1: 3.16 fps, max: 84.2 fps
Intel Core i5-1235U 0.9GHz
Iris Xe G7 80EUs
min: 0.868 fps, P1: 3.07 fps, max: 69.9 fps
Intel Core i5-1335U 0.9GHz
Iris Xe G7 80EUs
min: 2.92 fps, P1: 3.36 fps, max: 19.2 fps
Intel Core i5-1235U 0.9GHz
Iris Xe G7 80EUs
min: 2.11 fps, P1: 3 fps, max: 16.1 fps
Intel Core i5-1135G7 2.4GHz
Iris Xe G7 80EUs
min: 2.33 fps, P1: 4.67 fps, max: 68.3 fps
Intel Core i5-1135G7 2.4GHz
Iris Xe G7 80EUs
min: 1.273 fps, P1: 3.98 fps, max: 12.6 fps
Intel Core i5-1345U 1.2GHz
Iris Xe G7 80EUs
min: 2.98 fps, P1: 3.75 fps, max: 82.9 fps
Intel Core i5-1230U 0.7GHz
Iris Xe G7 80EUs
min: 1.275 fps, P1: 2.14 fps, max: 36.5 fps
Intel Core i5-1240P 1.2GHz
Iris Xe G7 80EUs
min: 0.771 fps, P1: 3.61 fps, max: 26.8 fps
Intel Core i5-1135G7 2.4GHz
Iris Xe G7 80EUs
min: 2.13 fps, P1: 5.08 fps, max: 85.7 fps
Intel Core i5-1135G7 2.4GHz
Iris Xe G7 80EUs
min: 1.56 fps, P1: 4.29 fps, max: 18.9 fps
Dual-Channel
Intel Core i5-1135G7 2.4GHz
Iris Xe G7 80EUs
min: 3.2 fps, P1: 4.13 fps, max: 16.7 fps
Dual-Channel
Intel Core i5-1135G7 2.4GHz
Iris Xe G7 80EUs
min: 3.4 fps, P1: 4.18 fps, max: 18.2 fps
Intel Core i5-1235U 0.9GHz
Iris Xe G7 80EUs
min: 3.21 fps, P1: 4.05 fps, max: 79.9 fps
Intel Core i5-1335U 0.9GHz
Iris Xe G7 80EUs
min: 3.67 fps, P1: 4.13 fps, max: 30.8 fps
Intel Core i5-1240P 1.2GHz
Iris Xe G7 80EUs
min: 3.57 fps, P1: 4.52 fps, max: 135.5 fps
Intel Core i5-1240P 1.2GHz
Iris Xe G7 80EUs
min: 2.93 fps, P1: 4.15 fps, max: 33.4 fps
Intel Core i5-1235U 0.9GHz
Iris Xe G7 80EUs
min: 3.52 fps, P1: 4.12 fps, max: 31.4 fps
Intel Core i5-1135G7 2.4GHz
Iris Xe G7 80EUs
min: 2.23 fps, P1: 6.1 fps, max: 26.2 fps
Intel Core i5-1240P 1.2GHz
Iris Xe G7 80EUs
min: 1.936 fps, P1: 4.76 fps, max: 21 fps
Intel Core i5-1240U 0.8GHz
Iris Xe G7 80EUs
min: 2.93 fps, P1: 4.93 fps, max: 76.2 fps
Intel Core i5-1135G7 2.4GHz
Iris Xe G7 80EUs
min: 3.68 fps, P1: 5.03 fps, max: 25.9 fps
Intel Core i5-1335U 0.9GHz
Iris Xe G7 80EUs
min: 2.9 fps, P1: 5.24 fps, max: 24.4 fps
Intel Core i5-1235U 0.9GHz
Iris Xe G7 80EUs
min: 3.96 fps, P1: 4.9 fps, max: 67.9 fps
Intel Core i5-1235U 0.9GHz
Iris Xe G7 80EUs
min: 3.64 fps, P1: 4.98 fps, max: 99.5 fps
Hoch
Intel Core i5-1240P 1.2GHz
Iris Xe G7 80EUs
min: 3.82 fps, P1: 5.13 fps, max: 27.8 fps
Intel Core i5-1335U 0.9GHz
Iris Xe G7 80EUs
min: 3.99 fps, P1: 5.59 fps, max: 74.9 fps
Intel Core i5-1345U 1.2GHz
Iris Xe G7 80EUs
min: 3.75 fps, P1: 5.65 fps, max: 25.5 fps
Intel Core i5-1235U 0.9GHz
Iris Xe G7 80EUs
min: 3.82 fps, P1: 5.18 fps, max: 91.6 fps
Intel Core i5-1335U 0.9GHz
Iris Xe G7 80EUs
min: 4.4 fps, P1: 5.32 fps, max: 99.5 fps
Intel Core i5-1345U 1.2GHz
Iris Xe G7 80EUs
min: 4.42 fps, P1: 5.46 fps, max: 36.6 fps
Intel Core i5-1130G7 1.8GHz
Iris Xe G7 80EUs
min: 2.2 fps, P1: 6.49 fps, max: 68.3 fps
Intel Core i5-1335U 0.9GHz
Iris Xe G7 80EUs
min: 3.8 fps, P1: 5.18 fps, max: 30.7 fps
Intel Core i5-1235U 0.9GHz
Iris Xe G7 80EUs
min: 4.07 fps, P1: 5.38 fps, max: 90.6 fps
Intel Core i5-1135G7 2.4GHz
Iris Xe G7 80EUs
min: 0.645 fps, P1: 5.85 fps, max: 29 fps
Intel Core i5-1335U 0.9GHz
Iris Xe G7 80EUs
min: 4.42 fps, P1: 5.41 fps, max: 33.2 fps
Intel Core i5-1335U 0.9GHz
Iris Xe G7 80EUs
min: 4.15 fps, P1: 5.56 fps, max: 32.8 fps
Intel Core i5-1135G7 2.4GHz
Iris Xe G7 80EUs
min: 3.68 fps, P1: 6.76 fps, max: 39.6 fps
Intel Core i5-1245U 1.2GHz
Iris Xe G7 80EUs
min: 4.28 fps, P1: 5.71 fps, max: 31 fps
Intel Core 5 120U 0.9GHz
Iris Xe G7 80EUs
min: 4.54 fps, P1: 5.43 fps, max: 37.7 fps
Intel Core i5-1350P 1.4GHz
Iris Xe G7 80EUs
min: 5.37 fps, P1: 7.81 fps, max: 93 fps
Intel Core i5-12500H 1.8GHz
Iris Xe G7 80EUs
min: 3.86 fps, P1: 5.75 fps, max: 37.3 fps
Intel Core i5-11300H 3.1GHz
Iris Xe G7 80EUs
min: 3.4 fps, P1: 7.58 fps, max: 46.6 fps
Intel Core i5-1135G7 2.4GHz
Iris Xe G7 80EUs
min: 0.943 fps, P1: 4.95 fps, max: 53.1 fps
Intel Core i5-1135G7 2.4GHz
Iris Xe G7 80EUs
min: 2.22 fps, P1: 7.19 fps, max: 84.6 fps
Intel Core i5-1135G7 2.4GHz
Iris Xe G7 80EUs
min: 2.93 fps, P1: 6.99 fps, max: 40.6 fps
Intel Core i5-1155G7 2.5GHz
Iris Xe G7 80EUs
min: 3.87 fps, P1: 7.75 fps, max: 115.5 fps
Intel Core i5-1340P 1.4GHz
Iris Xe G7 80EUs
min: 0.768 fps, P1: 6.33 fps, max: 42.2 fps
Intel Core i5-13500H 1.9GHz
Iris Xe G7 80EUs
min: 4.68 fps, P1: 5.59 fps, max: 44.6 fps
Intel Core i5-1145G7 2.6GHz
Iris Xe G7 80EUs
min: 2.08 fps, P1: 7.58 fps, max: 27.1 fps
Intel Core i5-1135G7 2.4GHz
Iris Xe G7 80EUs
min: 2.19 fps, P1: 7.75 fps, max: 48.6 fps
Intel Core i5-1155G7 2.5GHz
Iris Xe G7 80EUs
min: 4.16 fps, P1: 8.2 fps, max: 114.8 fps
Intel Core i5-1135G7 2.4GHz
Iris Xe G7 80EUs
min: 1.552 fps, P1: 7.63 fps, max: 16 fps
Intel Core i5-1155G7 2.5GHz
Iris Xe G7 80EUs
min: 4.23 fps, P1: 8.26 fps, max: 47.5 fps
Intel Core i5-1135G7 2.4GHz
Iris Xe G7 80EUs
min: 3.49 fps, P1: 9.17 fps, max: 55.5 fps
Intel Core i5-1135G7 2.4GHz
Iris Xe G7 80EUs
min: 0.4288 fps, P1: 7.63 fps, max: 102 fps
Intel Core i5-1135G7 2.4GHz
GeForce GTX 1650 Mobile
min: 3.65 fps, P1: 24.4 fps, max: 70.2 fps
AMD Ryzen 7 5800H 3.2GHz
GeForce GTX 1650 Mobile
min: 6.7 fps, P1: 29.4 fps, max: 67.9 fps
AMD Ryzen 5 5500U @4GHz
GeForce GTX 1650 Mobile
min: 14.4 fps, P1: 27.8 fps, max: 94.7 fps
Intel Core i7-9750H 2.6GHz
GeForce GTX 1650 Mobile
min: 7.76 fps, P1: 34.5 fps, max: 90.3 fps
Intel Core i5-1240P 1.2GHz
Iris Xe G7 80EUs
min: 1.325 fps, P1: 2.75 fps, max: 127.6 fps
Intel Core i5-1335U 0.9GHz
Iris Xe G7 80EUs
min: 2.79 fps, P1: 3.5 fps, max: 102.4 fps
Intel Core i5-1340P 1.4GHz
Iris Xe G7 80EUs
min: 0.804 fps, P1: 4.59 fps, max: 34 fps
Intel Core i5-1145G7 2.6GHz
Iris Xe G7 80EUs
min: 0.825 fps, P1: 5.08 fps, max: 26.5 fps

BioShock Infinite
2013Counter-Strike: GO
2012
Diablo III
2012
StarCraft 2
2010Average Gaming Intel Iris Xe Graphics G7 80EUs → 100%
Average Gaming 30-70 fps → 100%
Average Gaming NVIDIA GeForce GTX 1650 Mobile → 318%
Average Gaming 30-70 fps → 330%
Eine Liste mit weiteren Spielen und allen Grafikkarten finden Sie auf unserer Seite: Welches Spiel ist mit welcher Grafikkarte spielbar?
#0 ran 0s before starting gpusingle class +0s ... 0s
#1 checking url part for id 10395 +0s ... 0s
#2 checking url part for id 9828 +0s ... 0s
#3 redirected to Ajax server, took 1735045997s time from redirect:1 +0s ... 0s
#4 did not recreate cache, as it is less than 5 days old! Created at Sun, 22 Dec 2024 05:19:32 +0100 +0s ... 0s
#5 composed specs +0.02s ... 0.02s
#6 did output specs +0s ... 0.02s
#7 start showIntegratedCPUs +0s ... 0.02s
#8 getting avg benchmarks for device 10395 +0.021s ... 0.041s
#9 got single benchmarks 10395 +0.152s ... 0.193s
#10 getting avg benchmarks for device 9828 +0.004s ... 0.197s
#11 got single benchmarks 9828 +0.052s ... 0.249s
#12 got avg benchmarks for devices +0s ... 0.249s
#13 min, max, avg, median took s +0.09s ... 0.34s
#14 before gaming benchmark output +0s ... 0.34s
#15 Got 4513 rows for game benchmarks. +0.166s ... 0.506s
#16 composed SQL query for gamebenchmarks +0s ... 0.506s
#17 got data and put it in $dataArray +0.02s ... 0.525s
#18 benchmarks composed for output. +0.075s ... 0.601s
#19 calculated avg scores. +0s ... 0.601s
#20 return log +0.006s ... 0.607s