Notebookcheck Logo

Intel Iris Plus Graphics 650 vs Intel HD Graphics P530

Intel Iris Plus Graphics 650

► remove from comparison Intel Iris Plus Graphics 650

Die Intel Iris Plus Graphics 650 (GT3e) ist eine Prozessorgrafikkarte der im Jänner 2017 vorgestellten Kaby-Lake-Modelle. Als Nachfolger der Intel Iris Graphics 550 (Skylake) ist die Iris Plus Graphics 650 dabei in den Modellen der 28-Watt-Klasse zu finden und besitzt einen dedizierten eDRAM-Cache mit 64 MB Kapazität. Technisch dürfte es kaum Unterschiede zur Iris Graphics 550 geben.

Die sogenannte GT3e-Ausbaustufe der Kaby-Lake-GPU verfügt wahrscheinlich weiterhin über 48 Execution Units (EUs), die je nach Modell mit bis zu 1.100 MHz takten. Neben dem eDRAM-Cache kann die Iris 650 auch über das Interface des Prozessors auf den Hauptspeicher zugreifen (2x 64 Bit DDR3L-1600/DDR4-2400).

Von der Iris Plus 640 der 15-Watt-Modelle unterscheidet sich die Iris 650 lediglich durch ihren etwas höheren Maximaltakt sowie die annähernd verdoppelte TDP, die eine bessere Ausnutzung des Turbo-Boost-Spielraumes erlaubt.

Performance

Die exakte Leistung der Iris Plus Graphics 650 hängt vom jeweiligen CPU-Modell ab, da sich die Maximaltaktrate sowie die Größe des L3-Caches leicht unterscheiden können. Zum anderen beeinflusst auch der verwendete Speicher (DDR3/DDR4) die Performance.

Die höchste Leistung erreichen hochtaktende Core-i7-Ableger wie der Core i7-6567U. Je nach Spiel ordnet sich die Iris Plus 650 vermutlich im Bereich einer dedizierten GeForce 930M ein und kann aktuelle Titel (Stand 2015) in niedrigen bis mittleren Einstellungen flüssig darstellen.

Features

Die überarbeitete Videoeinheit dekodiert H.265-/HEVC-Videos vollständig in Hardware. Anders als Skylake kann Kaby Lake nun auch H.265/HEVC im Main10-Profil mit 10 Bit Farbtiefe sowie Googles VP9-Codec in Hardware dekodieren. Die Bildausgabe erfolgt über DP 1.2/eDP 1.3 (max. 3.840 x 2.160 @ 60 Hz), wohingegen HDMI nur in der älteren Version 1.4a angeboten wird. Ein HDMI-2.0-Anschluss kann aber mittels Konverter von DisplayPort ergänzt werden. Maximal lassen sich drei Displays parallel angesteuern.

Leistungsaufnahme

Die Iris Plus Graphics 650 ist in den Prozessoren der 28-Watt-Klasse zu finden und damit für mittelgroße Laptops geeignet.

Intel HD Graphics P530

► remove from comparison Intel HD Graphics P530

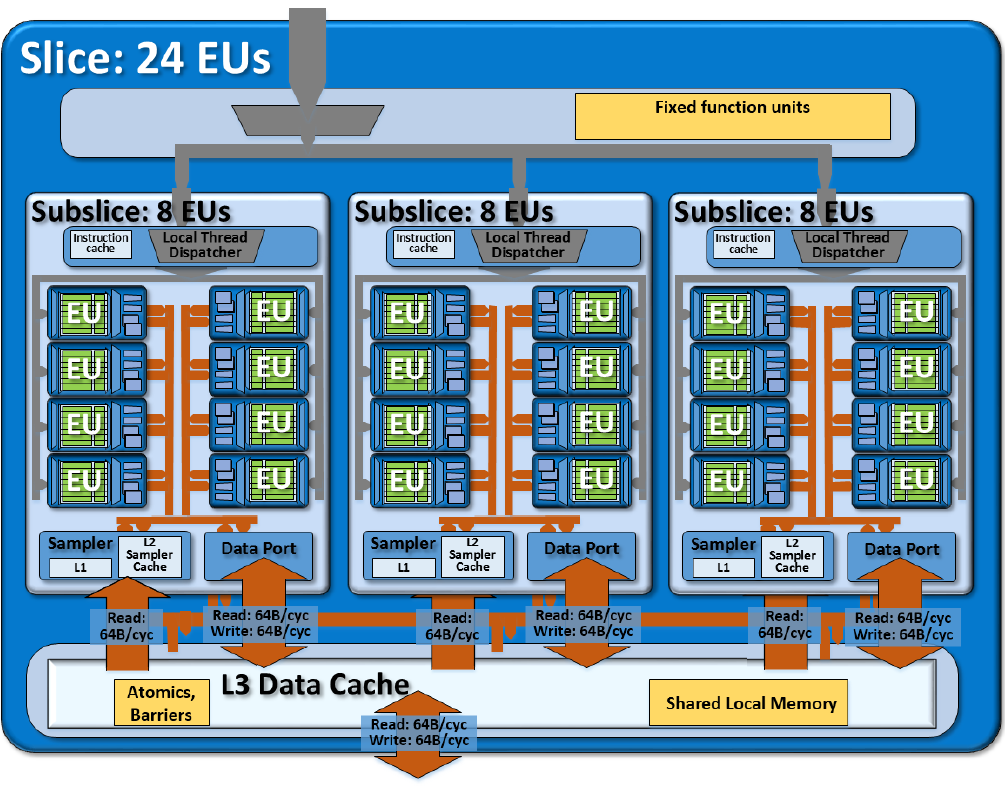
Die Intel HD Graphics P530 (GT2) ist eine integrierte Grafikeinheit, die in Skylake-Prozessoren der Xeon-Baureihe für Workstation-Notebooks verbaut wird. Die mittlere, auch "GT2" genannte Ausbaustufe verfügt über 24 EUs (Execution Units bzw. Ausführungseinheiten) und taktet je nach Modell mit bis zu 1.050 MHz (Turbo). Mangels eigenem Grafikspeicher oder eDRAM-Cache greift die HD Graphics P530 über das Interface des Prozessors auf den System-RAM zu (2x 64 Bit DDR3L-1600/DDR4-2133).

Performance

Die Leistung der HD Graphics P530 dürfte entsprechend der identischen technischen Daten genau auf dem Niveau der HD Graphics 530 liegen. Je nach Spiel kann die GPU damit in etwa mit einer dedizierten GeForce 920M konkurrieren und aktuelle Spiele (Stand 2015) zumeist in niedrigen, selten auch mittleren Einstellungen flüssig darstellen.

Features

Der überarbeitete Videodecoder decodiert nun auch H.265-/HEVC-Videos vollständig in Hardware und arbeitet dadurch deutlich effizienter als bislang. Die Bildausgabe erfolgt über DP 1.2/eDP 1.3 (max. 3.840 x 2.160 @ 60 Hz), wohingegen HDMI nur in der älteren Version 1.4a angeboten wird. Ein HDMI-2.0-Anschluss kann aber mittels Konverter von DisplayPort ergänzt werden. Maximal lassen sich drei Displays parallel angesteuern.

Leistungsaufnahme

Mobile Xeon-Modelle wie der E3-1535M v5 werden von Intel mit einer TDP von 45 Watt spezifiziert, sodass die HD Graphics P530 vor allem in größeren Notebooks ab etwa 15 Zoll zu finden ist.

Intel Iris Plus Graphics 650Intel HD Graphics P530
HD Graphics Serie
Iris Plus Graphics 655 compare 48 @ 0.3 - 1.2 GHz
Iris Plus Graphics 650 48 @ 0.3 - 1.1 GHz64/128 Bit
Iris Plus Graphics 645 compare 48 @ 0.3 - 1.15 GHz
Iris Plus Graphics 640 compare 48 @ 0.3 - 1.05 GHz64/128 Bit
UHD Graphics 630 compare 24 @ 0.3 - 1.15 GHz64/128 Bit
UHD Graphics P630 compare 24 @ 0.3 - 1.2 GHz64/128 Bit
HD Graphics 630 compare 24 @ 0.3 - 1.15 GHz64/128 Bit
HD Graphics P630 compare 24 64/128 Bit
UHD Graphics 620 compare 24 @ 0.3 - 1.15 GHz
HD Graphics 620 compare 24 @ 0.3 - 1.05 GHz64/128 Bit
UHD Graphics 617 compare 24 @ 0.3 - 1.15 GHz64/128 Bit
UHD Graphics 615 compare 24 @ 0.3 - 1 GHz64/128 Bit
HD Graphics 615 compare 24 @ 0.3 - 1.05 GHz64/128 Bit
HD Graphics P530 24 @ 0.35 - 1.05 GHz64/128 Bit
HD Graphics 5600 compare 24 @ 0.3 - 1.05 GHz64/128 Bit
HD Graphics 6000 compare 48 @ 0.3 - 1 GHz64/128 Bit
HD Graphics 4600 compare 20 @ 0.2 - 1.35 GHz64/128 Bit
HD Graphics 5500 compare 24 @ 0.3 - 0.95 GHz64/128 Bit
HD Graphics 5000 compare 40 @ 0.2 - 1.1 GHz64/128 Bit
HD Graphics 4400 compare 20 @ 0.2 - 1.1 GHz64/128 Bit
HD Graphics 5300 compare 24 @ 0.1 - 0.9 GHz64/128 Bit
HD Graphics 4000 compare 16 @ 0.35 - 1.35 GHz64/128 Bit
HD Graphics (Broadwell) compare 12 @ 0.1 - 0.85 GHz64/128 Bit
HD Graphics 4200 compare 20 @ 0.2 - 0.85 GHz64/128 Bit
HD Graphics (Skylake) compare 12 @ 0.3 - 0.8 GHz64/128 Bit
HD Graphics 405 (Braswell) compare 16 @ 0.32 - 0.7 GHz64/128 Bit
HD Graphics (Braswell) compare 16 @ 0.32 - 0.7 GHz64/128 Bit
HD Graphics 400 (Braswell) compare 12 @ 0.32 - 0.64 GHz64/128 Bit
HD Graphics (Haswell) compare 10 @ 0.2 - 1 GHz64/128 Bit
HD Graphics (Cherry Trail) compare 16 @ 0.2 - 0.6 GHz64/128 Bit
HD Graphics 3000 compare 12 @ 0.35 - 1.35 GHz64/128 Bit
HD Graphics 2500 compare 6 @ 0.65 - 1.15 GHz64/128 Bit
HD Graphics (Ivy Bridge) compare 6 @ 0.35 - 1.1 GHz64/128 Bit
HD Graphics 2000 compare 6 @ 0.85 - 1.35 GHz64/128 Bit
HD Graphics (Sandy Bridge) compare 6 @ 0.35 - 1.1 GHz64/128 Bit
HD Graphics (Bay Trail) compare 4 @ 0.31 - 0.9 GHz32/64/128 Bit
CodenameKaby Lake GT3eSkylake GT2
ArchitekturGen. 9.5 Kaby LakeGen. 9 Skylake
Pipelines48 - unified24 - unified
Kerntakt300 - 1100 (Boost) MHz350 - 1050 (Boost) MHz
Speicherbandbreite64/128 Bit64/128 Bit
SpeichertypDDR4DDR3/DDR4
Shared Memoryjaja
APIDirectX 12_1, OpenGL 4.4DirectX 12_1, OpenGL 4.4
Herstellungsprozess14 nm14 nm
FeaturesQuickSyncQuickSync
Erscheinungsdatum03.01.2017 01.09.2015
CPU in Iris Plus Graphics 650GPU Base SpeedGPU Boost / Turbo
Intel Core i7-7567U2 x 3500 MHz, 28 W300 MHz1100 MHz
Intel Core i5-7287U2 x 3300 MHz, 28 W300 MHz1100 MHz
Intel Core i5-7267U2 x 3100 MHz, 28 W300 MHz1050 MHz
Intel Core i3-7167U2 x 2800 MHz, 28 W300 MHz1000 MHz
min. - max.300 MHz1000 - 1100 MHz
CPU in HD Graphics P530GPU Base SpeedGPU Boost / Turbo
Intel Xeon E3-1535M v54 x 2900 MHz, 45 W350 MHz1050 MHz
Intel Xeon E3-1505M v54 x 2800 MHz, 45 W350 MHz1050 MHz
min. - max.300 - 350 MHz1000 - 1100 MHz

Benchmarks

3DMark - 3DMark Time Spy Score
623 Points (2%)
3DMark - 3DMark Time Spy Graphics
555 Points (1%)
3DMark - 3DMark Ice Storm Unlimited Graphics
161538 Points (16%)
3DMark - 3DMark Cloud Gate Score
min: 8403     avg: 9150     median: 9149.5 (10%)     max: 9896 Points
3DMark - 3DMark Cloud Gate Graphics
13153 Points (3%)
3DMark - 3DMark Fire Strike Standard Score
min: 1586     avg: 1655     median: 1655 (3%)     max: 1724 Points
3DMark - 3DMark Fire Strike Standard Graphics
1698 Points (2%)
3DMark 11 - 3DM11 Performance Score
2924 Points (4%)
3DMark 11 - 3DM11 Performance GPU
2762 Points (2%)
3DMark 06 3DMark 06 - Standard 1280x1024 + Intel Iris Plus Graphics 650
3DMark 06
15175 Points (20%)
Cinebench R10 Cinebench R10 Shading (32bit) + Intel Iris Plus Graphics 650
Cinebench R10 - Cinebench R10 Shading (32bit)
8773 Points (6%)
Cinebench R11.5 Cinebench R11.5 OpenGL 64 Bit + Intel Iris Plus Graphics 650
Cinebench R11.5 - Cinebench R11.5 OpenGL 64 Bit
45.2 fps (15%)
Cinebench R15
Cinebench R15 OpenGL 64 Bit + Intel Iris Plus Graphics 650
Cinebench R15 - Cinebench R15 OpenGL 64 Bit
min: 41.21     avg: 59.1     median: 59.1 (3%)     max: 77 fps
Cinebench R15 OpenGL Ref. Match 64 Bit + Intel Iris Plus Graphics 650
Cinebench R15 - Cinebench R15 OpenGL Ref. Match 64 Bit
99.3 % (99%)
LuxMark v2.0 64Bit - LuxMark v2.0 Room GPU
336 Samples/s (2%)
LuxMark v2.0 64Bit - LuxMark v2.0 Sala GPU
813 Samples/s (1%)
ComputeMark v2.1 - ComputeMark v2.1 Result
1730 Points (2%)
Power Consumption - Furmark Stress Test Power Consumption - external Monitor *
51.4 Watt (7%)
Power Consumption - The Witcher 3 Power Consumption - external Monitor *
51.4 Watt (7%)
Emissions Witcher 3 Fan Noise + Intel Iris Plus Graphics 650
Emissions - Witcher 3 Fan Noise
39.1 dB(A) (63%)
Clock Speed - GPU Clock Witcher 3 ultra
998 MHz (39%)
Clock Speed - GPU Clock Speed Furmark
848 MHz (34%)

Average Benchmarks Intel Iris Plus Graphics 650 → 0% n=0

- Bereich der Benchmarkergebnisse für diese Grafikkarte
- Durchschnittliche Benchmarkergebnisse für diese Grafikkarte
* Smaller numbers mean a higher performance
1 This benchmark is not used for the average calculation

Spiele-Benchmarks

Die folgenden Benchmarks basieren auf unseren Spieletests mit Testnotebooks. Die Performance dieser Grafikkarte bei den gelisteten Spielen ist abhängig von der verwendeten CPU, Speicherausstattung, Treiber und auch Betriebssystem. Dadurch müssen die untenstehenden Werte nicht repräsentativ sein. Detaillierte Informationen über das verwendete System sehen Sie nach einem Klick auf den fps-Wert.

Dirt 4

Dirt 4

2017
low 1280x720
100%
Iris Plus Graphics 650:
64  fps
med. 1920x1080
100%
Iris Plus Graphics 650:
21.3  fps
high 1920x1080
100%
Iris Plus Graphics 650:
14.2  fps
low 1280x720
100%
Iris Plus Graphics 650:
113  fps
med. 1920x1080
100%
Iris Plus Graphics 650:
56.8  fps
high 1920x1080
100%
Iris Plus Graphics 650:
38.9  fps
Prey

Prey

2017
low 1280x720
100%
Iris Plus Graphics 650:
51.4  fps
med. 1920x1080
100%
Iris Plus Graphics 650:
20.2  fps
low 1280x720
100%
Iris Plus Graphics 650:
25.8  fps
med. 1920x1080
100%
Iris Plus Graphics 650:
10.5  fps
low 1280x720
100%
Iris Plus Graphics 650:
17.6  fps
For Honor

For Honor

2017
low 1280x720
100%
Iris Plus Graphics 650:
39.7  fps
med. 1920x1080
100%
Iris Plus Graphics 650:
15.2  fps
low 1280x720
100%
Iris Plus Graphics 650:
15  fps
low 1280x720
100%
Iris Plus Graphics 650:
32.4  fps
low 1280x720
100%
Iris Plus Graphics 650:
54.1  fps
med. 1366x768
100%
Iris Plus Graphics 650:
37.9  fps
high 1920x1080
100%
Iris Plus Graphics 650:
36.8  fps
ultra 1920x1080
100%
Iris Plus Graphics 650:
19.9  fps
low 1280x720
100%
Iris Plus Graphics 650:
46.1  fps
med. 1366x768
100%
Iris Plus Graphics 650:
29.5  fps
low 1024x768
100%
Iris Plus Graphics 650:
42.2  fps
med. 1366x768
100%
Iris Plus Graphics 650:
20.2  fps
low 1280x720
100%
Iris Plus Graphics 650:
19.2  fps
med. 1366x768
100%
Iris Plus Graphics 650:
14.6  fps
high 1920x1080
100%
Iris Plus Graphics 650:
8.2  fps
Overwatch

Overwatch

2016
low 1280x720
100%
Iris Plus Graphics 650:
79.2  fps
med. 1366x768
100%
Iris Plus Graphics 650:
57.4  fps
high 1920x1080
100%
Iris Plus Graphics 650:
25.6  fps
ultra 1920x1080
100%
Iris Plus Graphics 650:
21.4  fps
low 1280x720
100%
Iris Plus Graphics 650:
30  fps
low 1280x720
100%
Iris Plus Graphics 650:
32  fps
med. 1920x1080
100%
Iris Plus Graphics 650:
15  fps
low 1024x768
100%
Iris Plus Graphics 650:
25.9  fps
med. 1366x768
100%
Iris Plus Graphics 650:
18.3  fps
low 1024x768
100%
Iris Plus Graphics 650:
54.2  fps
med. 1366x768
100%
Iris Plus Graphics 650:
35.6  fps
high 1920x1080
100%
Iris Plus Graphics 650:
20.8  fps
low 1280x720
100%
Iris Plus Graphics 650:
95  fps
med. 1366x768
100%
Iris Plus Graphics 650:
64  fps
high 1920x1080
100%
Iris Plus Graphics 650:
29.7  fps
ultra 1920x1080
100%
Iris Plus Graphics 650:
25  fps
low 1024x768
100%
Iris Plus Graphics 650:
21.4  fps
GTA V

GTA V

2015
low 1024x768
100%
Iris Plus Graphics 650:
56.5  fps
med. 1366x768
100%
Iris Plus Graphics 650:
49.9  fps
high 1920x1080
100%
Iris Plus Graphics 650:
11.6  fps
ultra 1920x1080
100%
Iris Plus Graphics 650:
5  fps
low 1280x720
100%
Iris Plus Graphics 650:
84  fps
med. 1366x768
100%
Iris Plus Graphics 650:
54.4  fps
high 1366x768
100%
Iris Plus Graphics 650:
46.5  fps
ultra 1920x1080
100%
Iris Plus Graphics 650:
13.3  fps

Average Gaming Intel Iris Plus Graphics 650 → 100%

Average Gaming 30-70 fps → 100%

Intel Iris Plus Graphics 650lowmed.highultraQHD4K
Dirt 46421.314.2
Rocket League11356.838.9
Prey51.420.2
Mass Effect Andromeda25.810.5
Ghost Recon Wildlands17.6
For Honor39.715.2
Dishonored 215
Call of Duty Infinite Warfare32.4
Titanfall 254.137.9
Farming Simulator 1736.819.9
Battlefield 146.129.5
Civilization VI42.220.2
Deus Ex Mankind Divided19.214.68.2
Overwatch79.257.425.621.4
The Division30
Far Cry Primal3215
Rise of the Tomb Raider25.918.3
Rainbow Six Siege54.235.620.8
Dota 2 Reborn956429.725
The Witcher 321.4
GTA V56.549.911.65
BioShock Infinite8454.446.513.3
< 30 fps
< 60 fps
< 120 fps
≥ 120 fps
6
10
5
9
6
1
6
3

5


Eine Liste mit weiteren Spielen und allen Grafikkarten finden Sie auf unserer Seite: Welches Spiel ist mit welcher Grafikkarte spielbar?

Add one or more devices and compare

In the following list you can select (and also search for) devices that should be added to the comparison. You can select more than one device.

restrict list:

show all (including archived), 2024, 2023
v1.28
log 21. 14:30:25

#0 ran 0s before starting gpusingle class +0s ... 0s

#1 checking url part for id 7655 +0s ... 0s

#2 checking url part for id 6452 +0s ... 0s

#3 redirected to Ajax server, took 1726921825s time from redirect:0 +0s ... 0s

#4 did not recreate cache, as it is less than 5 days old! Created at Thu, 19 Sep 2024 05:16:33 +0200 +0s ... 0s

#5 composed specs +0.005s ... 0.005s

#6 did output specs +0s ... 0.005s

#7 start showIntegratedCPUs +0s ... 0.005s

#8 getting avg benchmarks for device 7655 +0.019s ... 0.024s

#9 got single benchmarks 7655 +0.004s ... 0.028s

#10 getting avg benchmarks for device 6452 +0s ... 0.029s

#11 got single benchmarks 6452 +0s ... 0.029s

#12 got avg benchmarks for devices +0s ... 0.029s

#13 min, max, avg, median took s +0.008s ... 0.037s

#14 before gaming benchmark output +0s ... 0.037s

#15 Got 51 rows for game benchmarks. +0.003s ... 0.041s

#16 composed SQL query for gamebenchmarks +0s ... 0.041s

#17 got data and put it in $dataArray +0.001s ... 0.042s

#18 benchmarks composed for output. +0.006s ... 0.048s

#19 calculated avg scores. +0s ... 0.048s

#20 return log +0.002s ... 0.05s

Teilen Sie diesen Artikel, um uns zu unterstützen. Jeder Link hilft!
> Notebook Test, Laptop Test und News > Benchmarks / Technik > Benchmarks / Technik > Grafikkarten Vergleich - Head 2 Head
Autor: Klaus Hinum,  8.09.2017 (Update:  1.07.2023)