

Intel Iris Plus Graphics 650 vs NVIDIA GeForce RTX 3050 A Laptop GPU
Intel Iris Plus Graphics 650
► remove from comparisonDie Intel Iris Plus Graphics 650 (GT3e) ist eine Prozessorgrafikkarte der im Jänner 2017 vorgestellten Kaby-Lake-Modelle. Als Nachfolger der Intel Iris Graphics 550 (Skylake) ist die Iris Plus Graphics 650 dabei in den Modellen der 28-Watt-Klasse zu finden und besitzt einen dedizierten eDRAM-Cache mit 64 MB Kapazität. Technisch dürfte es kaum Unterschiede zur Iris Graphics 550 geben.
Die sogenannte GT3e-Ausbaustufe der Kaby-Lake-GPU verfügt wahrscheinlich weiterhin über 48 Execution Units (EUs), die je nach Modell mit bis zu 1.100 MHz takten. Neben dem eDRAM-Cache kann die Iris 650 auch über das Interface des Prozessors auf den Hauptspeicher zugreifen (2x 64 Bit DDR3L-1600/DDR4-2400).
Von der Iris Plus 640 der 15-Watt-Modelle unterscheidet sich die Iris 650 lediglich durch ihren etwas höheren Maximaltakt sowie die annähernd verdoppelte TDP, die eine bessere Ausnutzung des Turbo-Boost-Spielraumes erlaubt.
Performance
Die exakte Leistung der Iris Plus Graphics 650 hängt vom jeweiligen CPU-Modell ab, da sich die Maximaltaktrate sowie die Größe des L3-Caches leicht unterscheiden können. Zum anderen beeinflusst auch der verwendete Speicher (DDR3/DDR4) die Performance.
Die höchste Leistung erreichen hochtaktende Core-i7-Ableger wie der Core i7-6567U. Je nach Spiel ordnet sich die Iris Plus 650 vermutlich im Bereich einer dedizierten GeForce 930M ein und kann aktuelle Titel (Stand 2015) in niedrigen bis mittleren Einstellungen flüssig darstellen.
Features
Die überarbeitete Videoeinheit dekodiert H.265-/HEVC-Videos vollständig in Hardware. Anders als Skylake kann Kaby Lake nun auch H.265/HEVC im Main10-Profil mit 10 Bit Farbtiefe sowie Googles VP9-Codec in Hardware dekodieren. Die Bildausgabe erfolgt über DP 1.2/eDP 1.3 (max. 3.840 x 2.160 @ 60 Hz), wohingegen HDMI nur in der älteren Version 1.4a angeboten wird. Ein HDMI-2.0-Anschluss kann aber mittels Konverter von DisplayPort ergänzt werden. Maximal lassen sich drei Displays parallel angesteuern.
Leistungsaufnahme
Die Iris Plus Graphics 650 ist in den Prozessoren der 28-Watt-Klasse zu finden und damit für mittelgroße Laptops geeignet.
NVIDIA GeForce RTX 3050 A Laptop GPU
► remove from comparison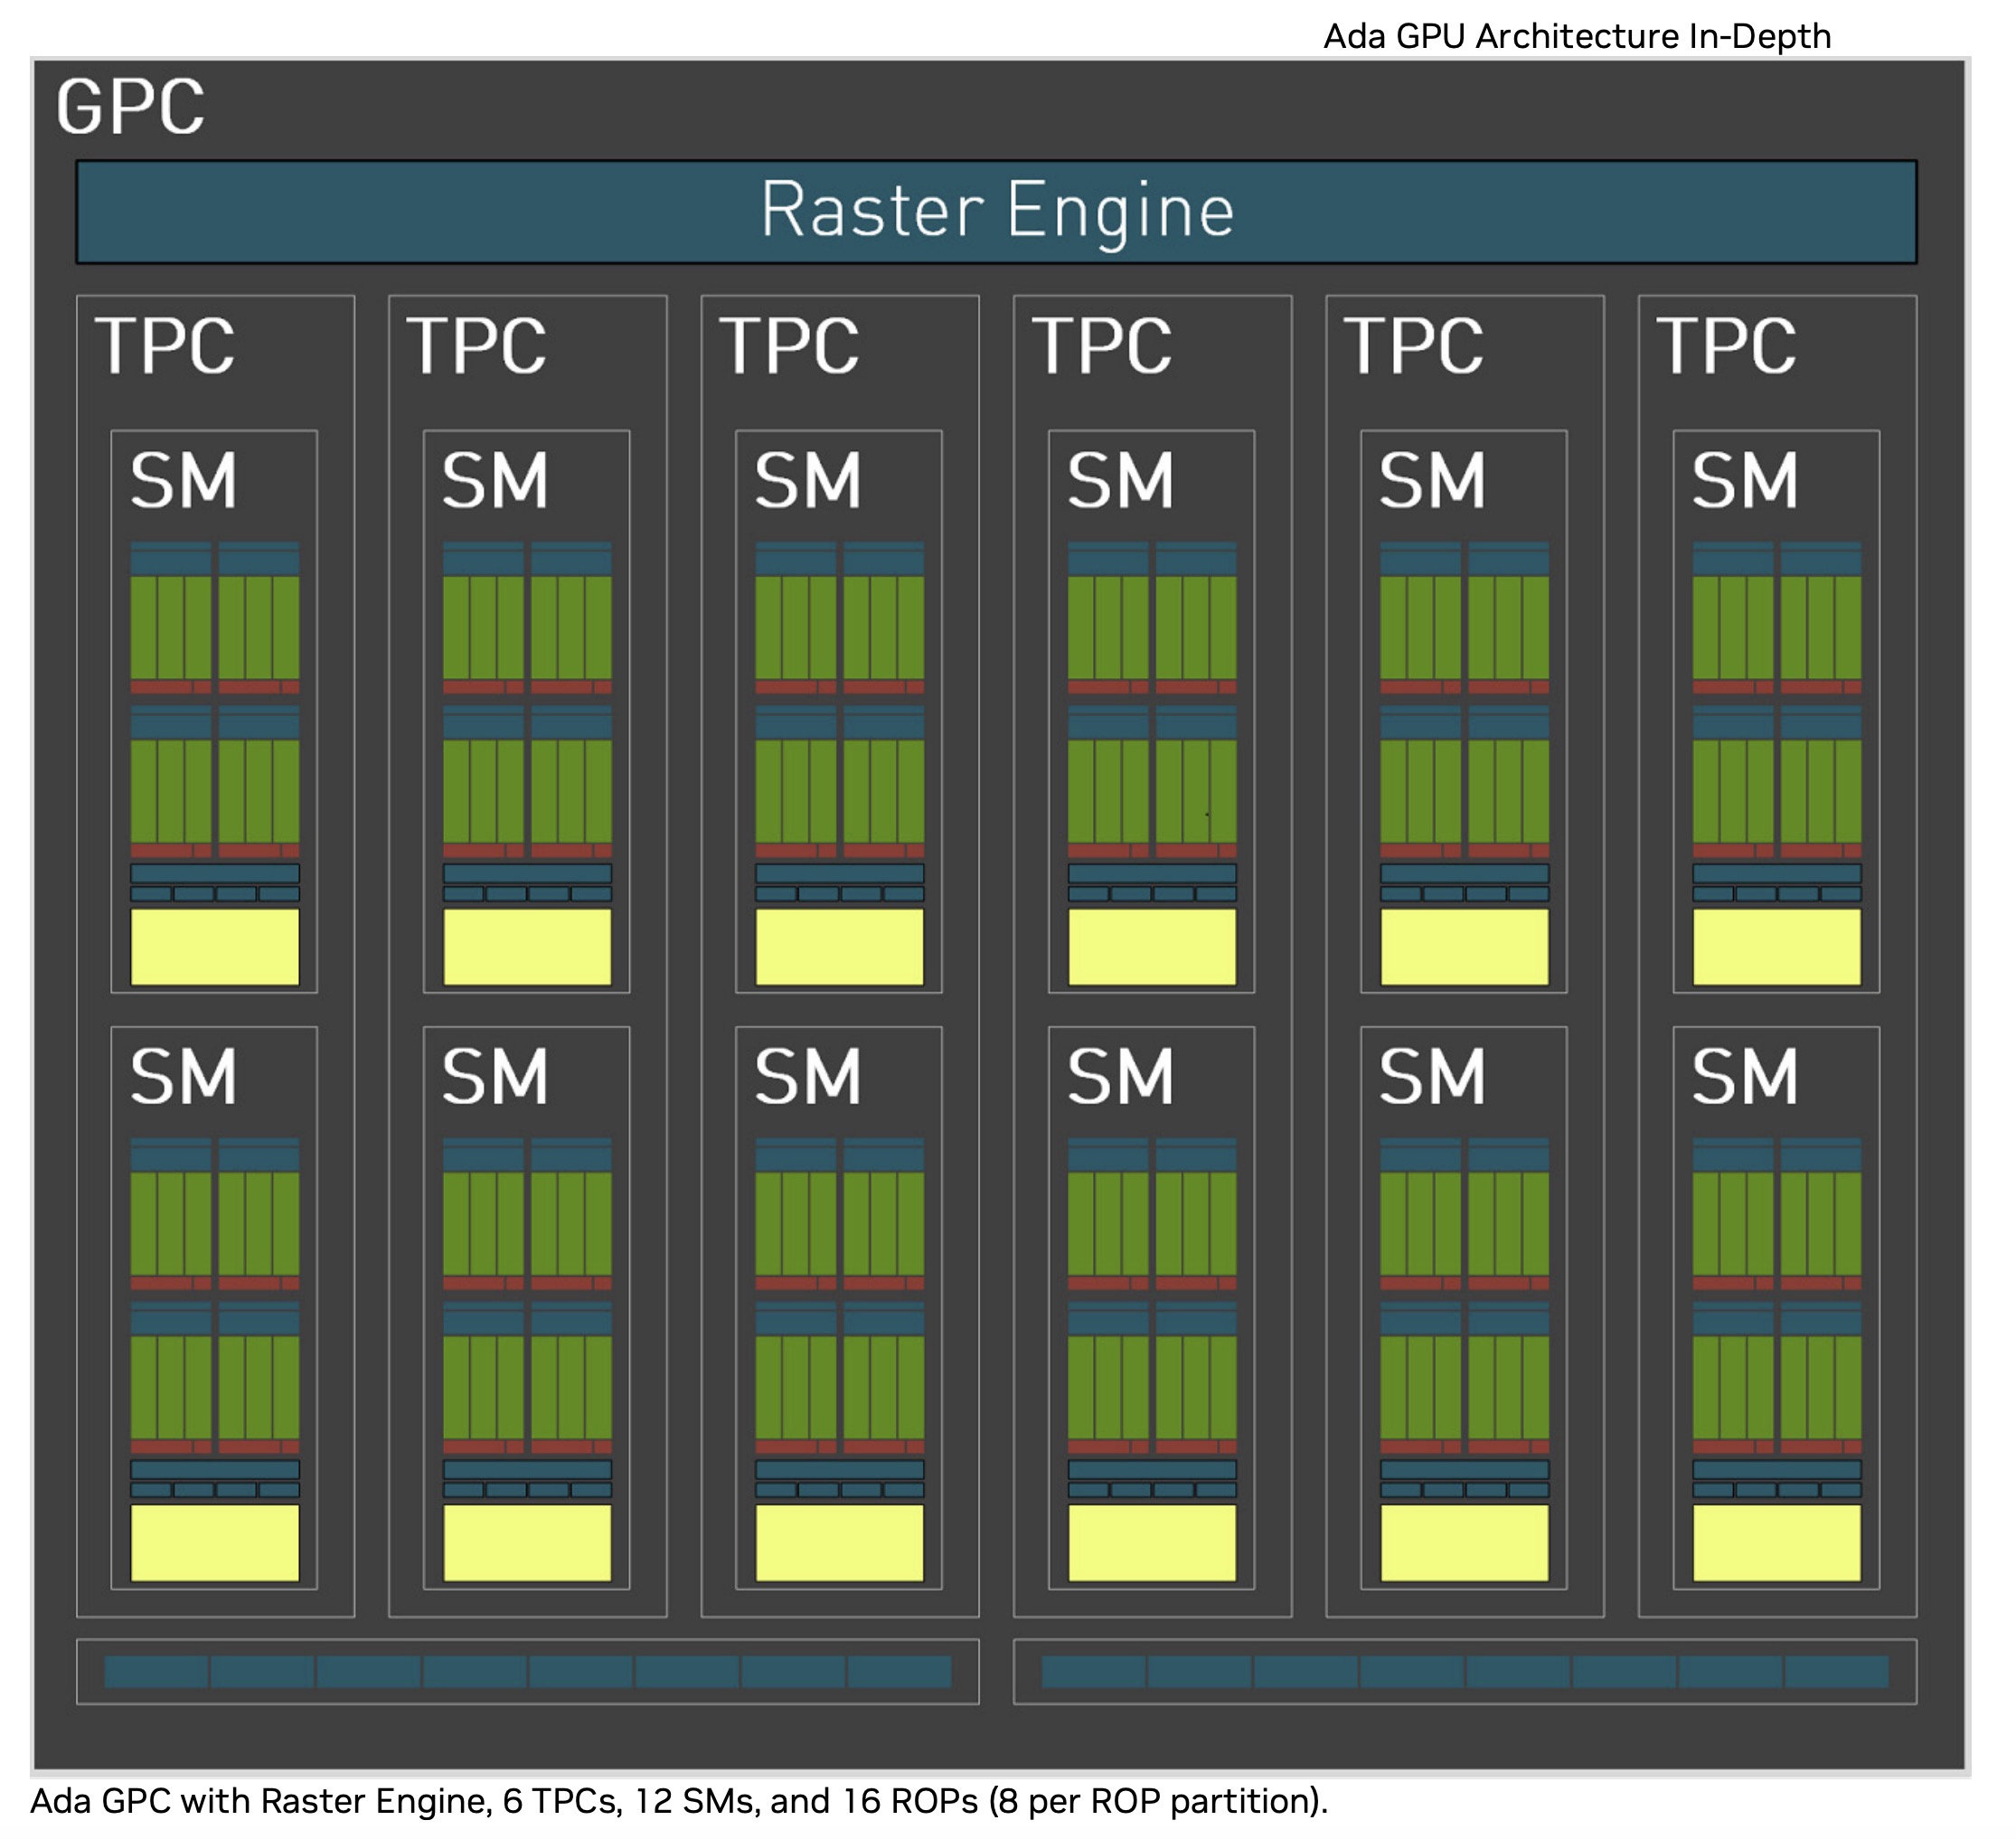
Die Nvidia GeForce RTX 3050 A Laptop GPU (oder Mobile) ist eine neue Variante basierend auf die aktuelle Ada Lovelace Architektur (im Vergleich zu Ampere bei den anderen RTX 3050 Laptop GPUs). Sie nutzt den AD106 Chip der RTX 4060 oder AD107 der RTX 4050, jedoch mit deutlich verringerter Kernanzahl und Speicherbus. Die RTX 3050 A bietet nur 1.792 GPU Kerne (CUDA Cores) und ein 4GB GDDR6 Grafikspeicher der nur mit 64-Bit angebunden ist. Nach aktuellen Informationen ist die 3050 A zum Launch nur für den Indischen Markt gedacht.
Durch die geringe Kernanzahl und den kleinen Speicherbus, sollte die Performance nicht deutlich überhalb der alten RTX 3050 4GB Laptop GPU liegen.
Der AD106 Chip wird bei TSMC im 5nm (4N) Verfahren gefertigt und ist dadurch deutlich effizienter als der alte Ampere Chip der RTX 3050 4GB. Der TGP kann vom Notebookhersteller zwischen 35 und 50 Watt gewählt werden (System Power).
| Intel Iris Plus Graphics 650 | NVIDIA GeForce RTX 3050 A Laptop GPU | ||||||||||||||||||||||||||||||||||||||||||||||||||||||||||||||||||||||||||||||||||||||||||||||||||||||||||
| GeForce RTX 3000 Serie |
|
| |||||||||||||||||||||||||||||||||||||||||||||||||||||||||||||||||||||||||||||||||||||||||||||||||||||||||
| Codename | Kaby Lake GT3e | ||||||||||||||||||||||||||||||||||||||||||||||||||||||||||||||||||||||||||||||||||||||||||||||||||||||||||
| Architektur | Gen. 9.5 Kaby Lake | Ada Lovelace | |||||||||||||||||||||||||||||||||||||||||||||||||||||||||||||||||||||||||||||||||||||||||||||||||||||||||
| Pipelines | 48 - unified | 1792 - unified | |||||||||||||||||||||||||||||||||||||||||||||||||||||||||||||||||||||||||||||||||||||||||||||||||||||||||
| Kerntakt | 300 - 1100 (Boost) MHz | ||||||||||||||||||||||||||||||||||||||||||||||||||||||||||||||||||||||||||||||||||||||||||||||||||||||||||
| Speicherbandbreite | 64/128 Bit | 64 Bit | |||||||||||||||||||||||||||||||||||||||||||||||||||||||||||||||||||||||||||||||||||||||||||||||||||||||||
| Speichertyp | DDR4 | GDDR6 | |||||||||||||||||||||||||||||||||||||||||||||||||||||||||||||||||||||||||||||||||||||||||||||||||||||||||
| Shared Memory | ja | nein | |||||||||||||||||||||||||||||||||||||||||||||||||||||||||||||||||||||||||||||||||||||||||||||||||||||||||
| API | DirectX 12_1, OpenGL 4.4 | DirectX 12_2, Shader 6.7, OpenGL 4.6 | |||||||||||||||||||||||||||||||||||||||||||||||||||||||||||||||||||||||||||||||||||||||||||||||||||||||||
| Herstellungsprozess | 14 nm | 5 nm | |||||||||||||||||||||||||||||||||||||||||||||||||||||||||||||||||||||||||||||||||||||||||||||||||||||||||
| Features | QuickSync | NVIDIA DLSS, NVIDIA Reflex, Resizable BAR, NVIDIA Broadcast, NVIDIA Ansel, NVIDIA ShadowPlay, NVIDIA G-SYNC, Advanced Optimus, Nvidia Max-Q, Dynamic Boost | |||||||||||||||||||||||||||||||||||||||||||||||||||||||||||||||||||||||||||||||||||||||||||||||||||||||||
| Erscheinungsdatum | 03.01.2017 | 26.07.2024 | |||||||||||||||||||||||||||||||||||||||||||||||||||||||||||||||||||||||||||||||||||||||||||||||||||||||||
| Max. Speichergröße | 4 GB | ||||||||||||||||||||||||||||||||||||||||||||||||||||||||||||||||||||||||||||||||||||||||||||||||||||||||||
| Stromverbrauch | 45 Watt (35 - 80 Watt TGP) | ||||||||||||||||||||||||||||||||||||||||||||||||||||||||||||||||||||||||||||||||||||||||||||||||||||||||||
| PCIe | 4.0 | ||||||||||||||||||||||||||||||||||||||||||||||||||||||||||||||||||||||||||||||||||||||||||||||||||||||||||
| Displays | HDMI 2.1, DisplayPort 1.4a | ||||||||||||||||||||||||||||||||||||||||||||||||||||||||||||||||||||||||||||||||||||||||||||||||||||||||||
| Notebookgröße | mittel (15.4" z.B.) | ||||||||||||||||||||||||||||||||||||||||||||||||||||||||||||||||||||||||||||||||||||||||||||||||||||||||||
| Predecessor | GeForce RTX 3050 4GB Laptop GPU |
| |||||||||||||||||||||||||
Benchmarks

Cinebench R15 OpenGL 64 Bit + Intel Iris Plus Graphics 650
Average Benchmarks Intel Iris Plus Graphics 650 → 0% n=0
* Smaller numbers mean a higher performance
1 This benchmark is not used for the average calculation
Spiele-Benchmarks
Die folgenden Benchmarks basieren auf unseren Spieletests mit Testnotebooks. Die Performance dieser Grafikkarte bei den gelisteten Spielen ist abhängig von der verwendeten CPU, Speicherausstattung, Treiber und auch Betriebssystem. Dadurch müssen die untenstehenden Werte nicht repräsentativ sein. Detaillierte Informationen über das verwendete System sehen Sie nach einem Klick auf den fps-Wert.
Dirt 4
2017Rocket League
2017Prey
2017For Honor
2017
Dishonored 2
2016

Titanfall 2
2016Farming Simulator 17
2016
Battlefield 1
2016
Civilization VI
2016
Overwatch
2016
The Division
2016
Far Cry Primal
2016

Rainbow Six Siege
2015Dota 2 Reborn
2015
The Witcher 3
2015
GTA V
2015BioShock Infinite
2013Average Gaming Intel Iris Plus Graphics 650 → 100%
Average Gaming 30-70 fps → 100%
| Intel Iris Plus Graphics 650 | low | med. | high | ultra | QHD | 4K |
|---|---|---|---|---|---|---|
| Dirt 4 | 64 | 21.3 | 14.2 | |||
| Rocket League | 113 | 56.8 | 38.9 | |||
| Prey | 51.4 | 20.2 | ||||
| Mass Effect Andromeda | 25.8 | 10.5 | ||||
| Ghost Recon Wildlands | 17.6 | |||||
| For Honor | 39.7 | 15.2 | ||||
| Dishonored 2 | 15 | |||||
| Call of Duty Infinite Warfare | 32.4 | |||||
| Titanfall 2 | 54.1 | 37.9 | ||||
| Farming Simulator 17 | 36.8 | 19.9 | ||||
| Battlefield 1 | 46.1 | 29.5 | ||||
| Civilization VI | 42.2 | 20.2 | ||||
| Deus Ex Mankind Divided | 19.2 | 14.6 | 8.2 | |||
| Overwatch | 79.2 | 57.4 | 25.6 | 21.4 | ||
| The Division | 30 | |||||
| Far Cry Primal | 32 | 15 | ||||
| Rise of the Tomb Raider | 25.9 | 18.3 | ||||
| Rainbow Six Siege | 54.2 | 35.6 | 20.8 | |||
| Dota 2 Reborn | 95 | 64 | 29.7 | 25 | ||
| The Witcher 3 | 21.4 | |||||
| GTA V | 56.5 | 49.9 | 11.6 | 5 | ||
| BioShock Infinite | 84 | 54.4 | 46.5 | 13.3 | ||
| < 30 fps < 60 fps < 120 fps ≥ 120 fps | 6 10 5 | 9 6 1 | 6 3 | 5 | | |
Eine Liste mit weiteren Spielen und allen Grafikkarten finden Sie auf unserer Seite: Welches Spiel ist mit welcher Grafikkarte spielbar?