Notebookcheck Logo

Intel Iris Plus Graphics 650 vs NVIDIA GeForce GTX 1070 Ti (Desktop) vs Intel Iris Plus Graphics 655

Intel Iris Plus Graphics 650

► remove from comparison Intel Iris Plus Graphics 650

Die Intel Iris Plus Graphics 650 (GT3e) ist eine Prozessorgrafikkarte der im Jänner 2017 vorgestellten Kaby-Lake-Modelle. Als Nachfolger der Intel Iris Graphics 550 (Skylake) ist die Iris Plus Graphics 650 dabei in den Modellen der 28-Watt-Klasse zu finden und besitzt einen dedizierten eDRAM-Cache mit 64 MB Kapazität. Technisch dürfte es kaum Unterschiede zur Iris Graphics 550 geben.

Die sogenannte GT3e-Ausbaustufe der Kaby-Lake-GPU verfügt wahrscheinlich weiterhin über 48 Execution Units (EUs), die je nach Modell mit bis zu 1.100 MHz takten. Neben dem eDRAM-Cache kann die Iris 650 auch über das Interface des Prozessors auf den Hauptspeicher zugreifen (2x 64 Bit DDR3L-1600/DDR4-2400).

Von der Iris Plus 640 der 15-Watt-Modelle unterscheidet sich die Iris 650 lediglich durch ihren etwas höheren Maximaltakt sowie die annähernd verdoppelte TDP, die eine bessere Ausnutzung des Turbo-Boost-Spielraumes erlaubt.

Performance

Die exakte Leistung der Iris Plus Graphics 650 hängt vom jeweiligen CPU-Modell ab, da sich die Maximaltaktrate sowie die Größe des L3-Caches leicht unterscheiden können. Zum anderen beeinflusst auch der verwendete Speicher (DDR3/DDR4) die Performance.

Die höchste Leistung erreichen hochtaktende Core-i7-Ableger wie der Core i7-6567U. Je nach Spiel ordnet sich die Iris Plus 650 vermutlich im Bereich einer dedizierten GeForce 930M ein und kann aktuelle Titel (Stand 2015) in niedrigen bis mittleren Einstellungen flüssig darstellen.

Features

Die überarbeitete Videoeinheit dekodiert H.265-/HEVC-Videos vollständig in Hardware. Anders als Skylake kann Kaby Lake nun auch H.265/HEVC im Main10-Profil mit 10 Bit Farbtiefe sowie Googles VP9-Codec in Hardware dekodieren. Die Bildausgabe erfolgt über DP 1.2/eDP 1.3 (max. 3.840 x 2.160 @ 60 Hz), wohingegen HDMI nur in der älteren Version 1.4a angeboten wird. Ein HDMI-2.0-Anschluss kann aber mittels Konverter von DisplayPort ergänzt werden. Maximal lassen sich drei Displays parallel angesteuern.

Leistungsaufnahme

Die Iris Plus Graphics 650 ist in den Prozessoren der 28-Watt-Klasse zu finden und damit für mittelgroße Laptops geeignet.

NVIDIA GeForce GTX 1070 Ti (Desktop)

► remove from comparison NVIDIA GeForce GTX 1070 Ti (Desktop)

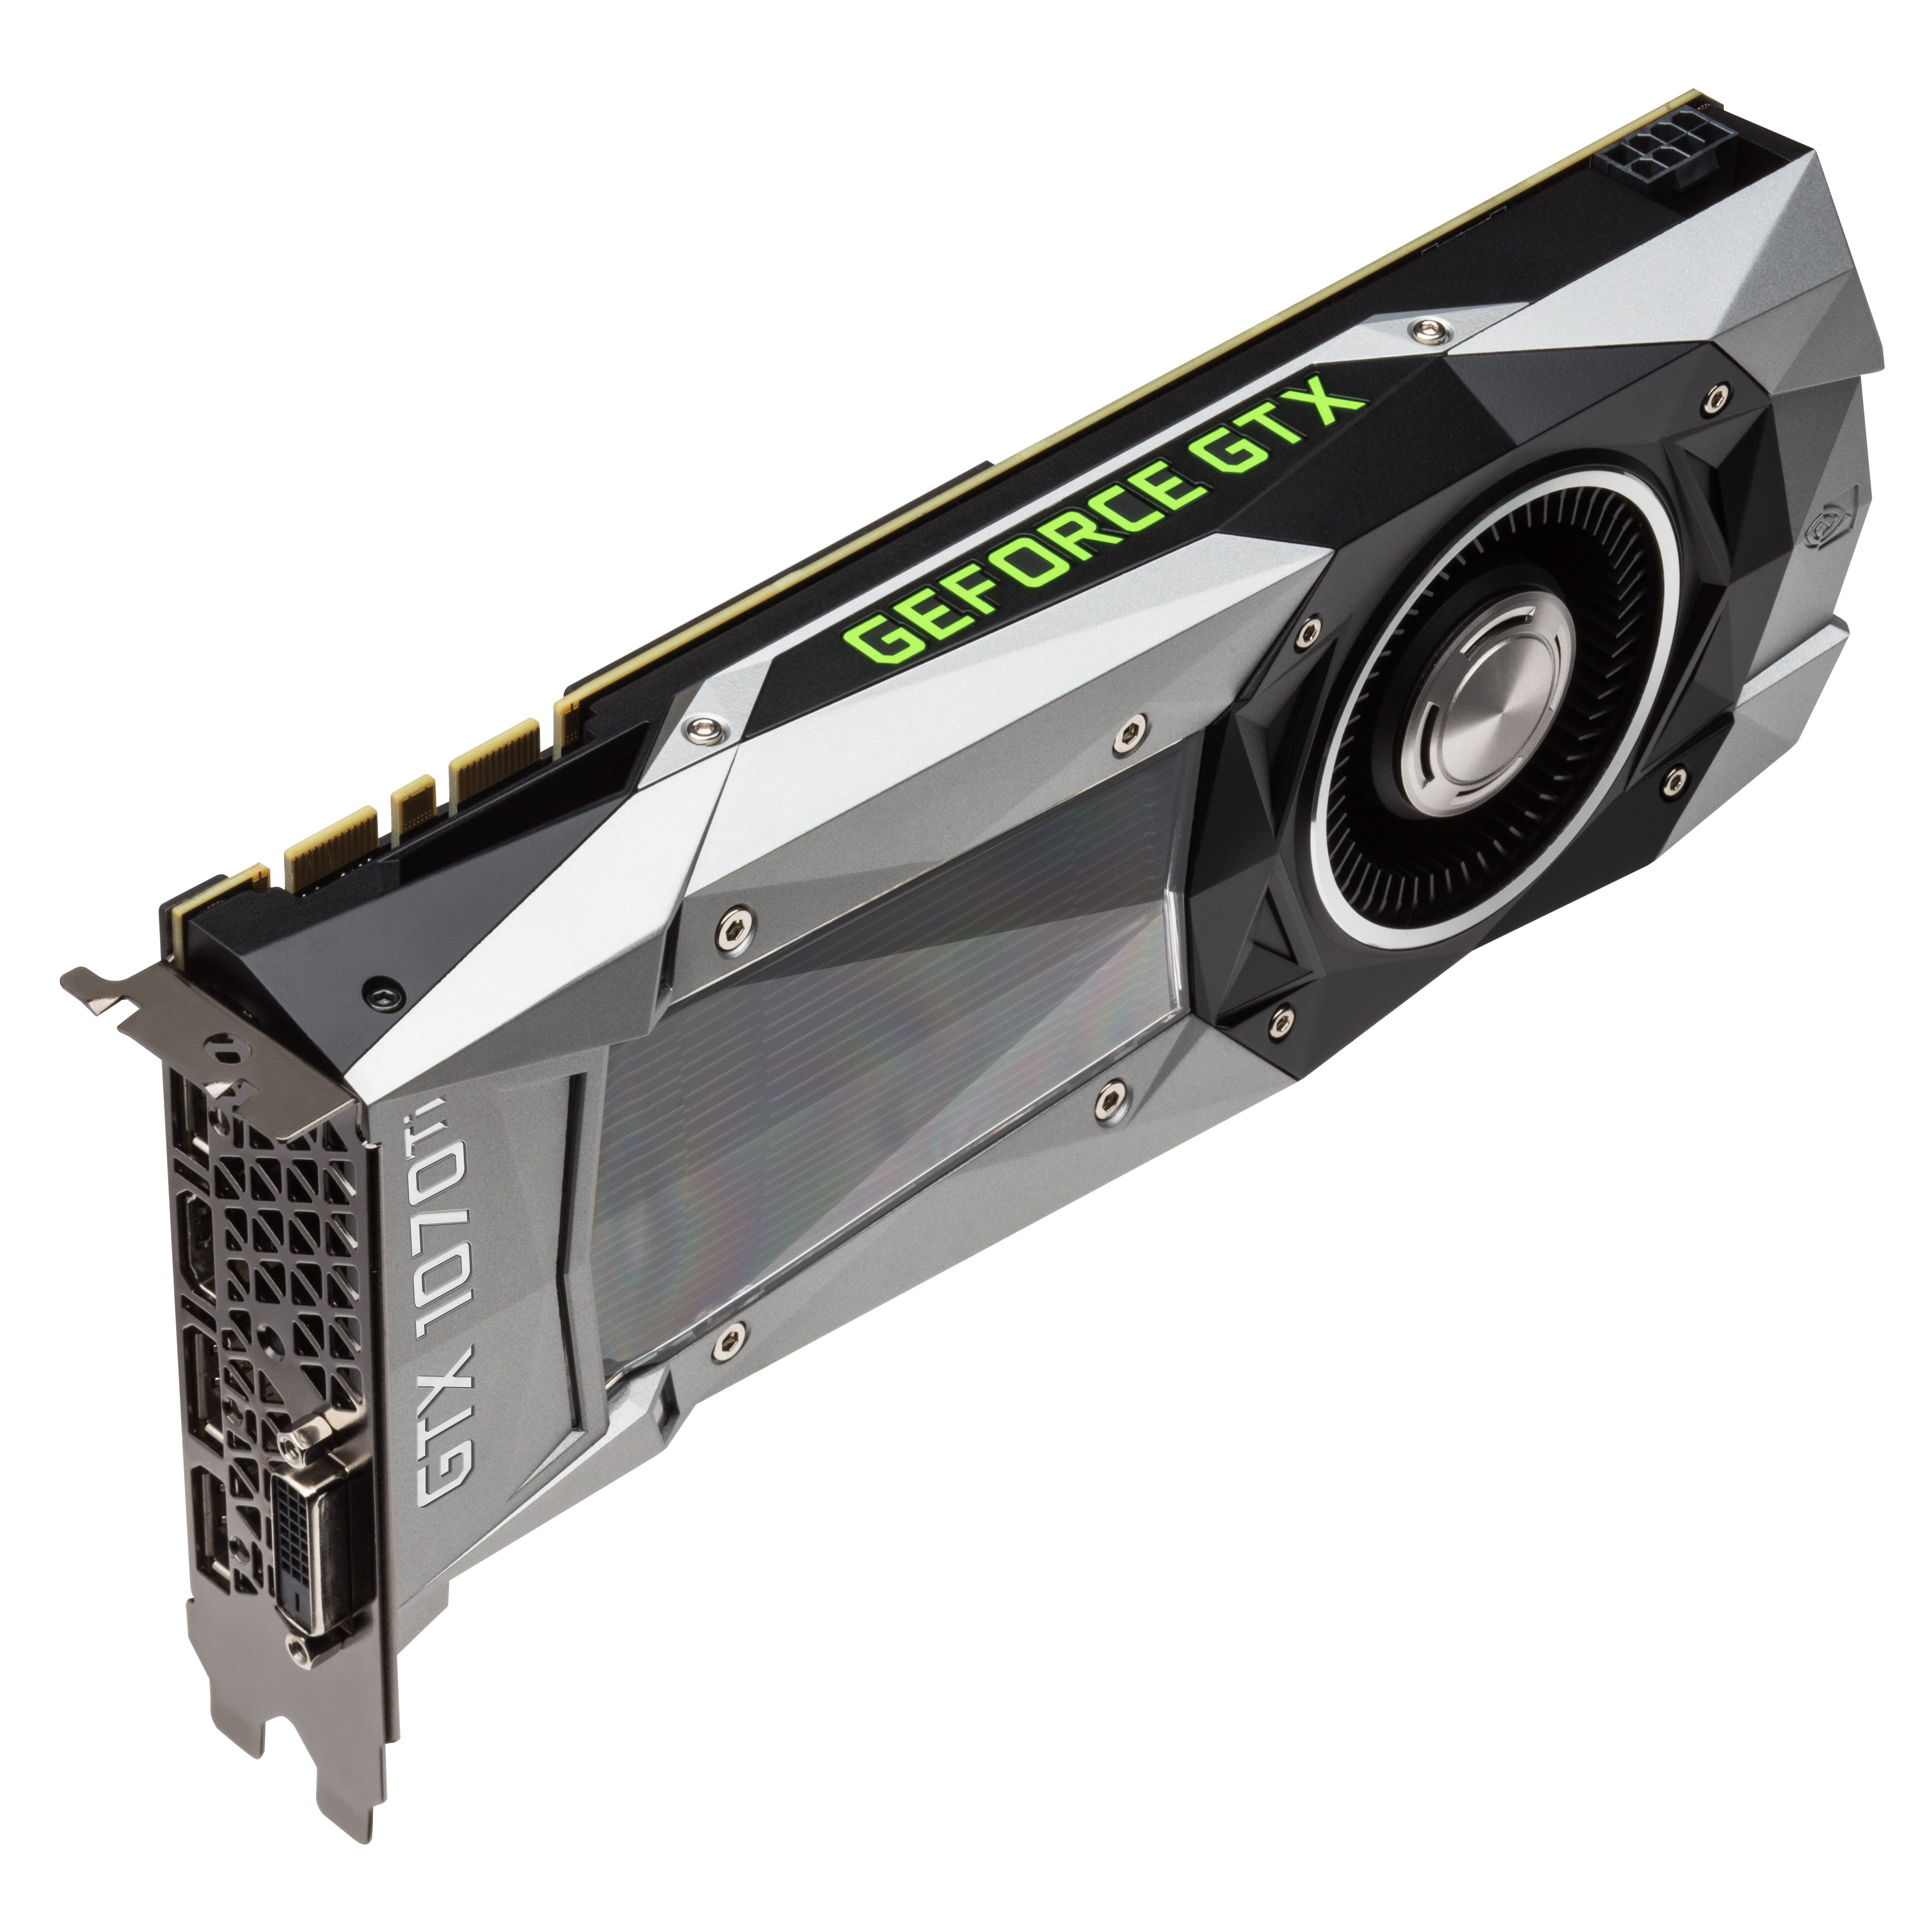
Die Nvidia GeForce GTX 1070 Ti ist eine schnelle Desktop Grafikkarte der Pascal Generation. Sie positioniert sich zwischen GTX 1070 und GTX 1080 und wurde als Konter zur Radeon Vega 56 positioniert. Die Vorstellung war im November 2017. Im Vergleich zur GTX 1070 bietet die GTX 1070 Ti mehr Shader (2.432 versus 1.920) bei gleichem Boost Takt. Der 8 GB große Grafikspeicher ist wie bei der GTX 1070 vom Typ GDDR5 und nicht GDDR5X wie bei der GTX 1080. 

Features

Der GP104-Chip wird in einem 16nm-FinFET-Prozess bei TSMC gefertigt und bietet eine Reihe neuer Features, unter anderem Support für DisplayPort 1.4 (ready), HDMI 2.0b, HDR, Simultaneous Multi-Projection (SMP) sowie verbessertes H.265 Video De- und Encoding (PlayReady 3.0). Eine genaue Auflistung der Verbesserungen und Features der neuen Pascal Desktop-GPUs finden Sie in unserem Pascal-Architektur-Artikel.

Performance

Die GeForce GTX 1070 Ti positioniert sich wenig überraschend zwischen GTX 1070 und GTX 1080. Damit eignet sich die Grafikkarte am besten für 2560x1440 mit maximalen Details für aktuelle Spiele. Anspruchslosere Spiele können auch in 4K flüssig gespielt werden.

Leistungsaufnahme

Die Leistungsaufnahme der GeForce GTX 1070 Ti wird vom Hersteller mit 180 Watt beziffert und liegt damit in einer ähnlichen Größenordnung wie die GTX 1080. In unseren Tests positioniert sich die Karte leicht darunter aber auch deutlich über der GTX 1070 (150 Watt TDP).

Intel Iris Plus Graphics 655

► remove from comparison Intel Iris Plus Graphics 655

Die Intel Iris Plus Graphics 655 (GT3e) ist eine Prozessorgrafikkarte, die im September 2017 vorgestellt wurde. Es handelt sich um den Nachfolger der Iris Plus 650 Graphics und wird in Coffee-Lake-U-CPUs der 28-Watt-Klasse verbaut. Der größte Unterschied zum Vorgänger ist der doppelt so große eDRAM-Cache mit 128 MB. Ansonsten dürfte es aber keine großen Unterschiede geben.

Die sogenannte GT3e-Ausbaustufe der Kaby-Lake-GPU verfügt weiterhin über 48 Execution Units (EUs), die je nach Modell nun mit bis zu 1.200 MHz takten (vorher max. 1.100 MHz). Neben dem eDRAM-Cache kann die Iris 655 auch über das Interface des Prozessors auf den Hauptspeicher zugreifen (2x 64 Bit LPDDR3-2133/DDR4-2400).

Von der Iris Plus 640 der 15-Watt-Modelle unterscheidet sich die Iris 655 lediglich durch ihren etwas höheren Maximaltakt sowie die annähernd verdoppelte TDP, die eine bessere Ausnutzung des Turbo-Boost-Spielraumes erlaubt.

Performance

Die exakte Leistung der Iris Plus Graphics 655 hängt vom jeweiligen CPU-Modell ab, da sich die Maximaltaktrate sowie die Größe des Caches leicht unterscheiden können. Zum anderen beeinflusst auch der verwendete Speicher (DDR3/DDR4) die Performance.

Die höchste Leistung erreichen hochtaktende Core-i7-Ableger wie der Core i7-8559U. Je nach Spiel ordnet sich die Iris Plus 655 vermutlich im Bereich einer dedizierten GeForce 930M oder GeForce 940MX ein und kann aktuelle Titel in niedrigen bis mittleren Einstellungen flüssig darstellen.

Features

Die überarbeitete Videoeinheit dekodiert H.265-/HEVC-Videos vollständig in Hardware. Anders als Skylake kann Kaby Lake nun auch H.265/HEVC im Main10-Profil mit 10 Bit Farbtiefe sowie Googles VP9-Codec in Hardware dekodieren. Die Bildausgabe erfolgt über DP 1.2/eDP 1.3 (max. 3.840 x 2.160 @ 60 Hz), wohingegen HDMI nur in der älteren Version 1.4a angeboten wird. Ein HDMI-2.0-Anschluss kann aber mittels Konverter von DisplayPort ergänzt werden. Maximal lassen sich drei Displays parallel angesteuern.

Leistungsaufnahme

Die Iris Plus Graphics 655 ist in den Prozessoren der 28-Watt-Klasse zu finden und damit für kleine/mittelgroße Laptops geeignet.

Intel Iris Plus Graphics 650NVIDIA GeForce GTX 1070 Ti (Desktop)Intel Iris Plus Graphics 655
Gen. 9.5 Serie
Iris Plus Graphics 655 48 @ 0.3 - 1.2 GHz
Iris Plus Graphics 650 48 @ 0.3 - 1.1 GHz64/128 Bit
Iris Plus Graphics 645 48 @ 0.3 - 1.15 GHz
Iris Plus Graphics 640 48 @ 0.3 - 1.05 GHz64/128 Bit
UHD Graphics 630 24 @ 0.3 - 1.15 GHz64/128 Bit
UHD Graphics P630 24 @ 0.3 - 1.2 GHz64/128 Bit
HD Graphics 630 24 @ 0.3 - 1.15 GHz64/128 Bit
HD Graphics P630 24 64/128 Bit
UHD Graphics 620 24 @ 0.3 - 1.15 GHz
HD Graphics 620 24 @ 0.3 - 1.05 GHz64/128 Bit
UHD Graphics 617 24 @ 0.3 - 1.15 GHz64/128 Bit
UHD Graphics 615 24 @ 0.3 - 1 GHz64/128 Bit
HD Graphics 615 24 @ 0.3 - 1.05 GHz64/128 Bit
GeForce GTX 1080 Ti 3584 @ 1.48 - 1.6 GHz352 Bit @ 11000 MHz
GeForce GTX 1080 SLI (Laptop) 5120 @ 1.56 - 1.73 GHz256 Bit @ 10000 MHz
GeForce GTX 1070 SLI (Desktop) 3840 @ 1.51 - 1.68 GHz256 Bit @ 8000 MHz
GeForce GTX 1070 SLI (Laptop) 4096 @ 1.44 - 1.65 GHz256 Bit @ 8000 MHz
GeForce GTX 1080 (Desktop) 2560 @ 1.61 - 1.73 GHz256 Bit @ 10000 MHz
GeForce GTX 1080 Mobile 2560 @ 1.57 - 1.73 GHz256 Bit @ 10000 MHz
GeForce GTX 1070 Ti (Desktop) 2432 @ 1.61 - 1.68 GHz256 Bit @ 8000 MHz
GeForce GTX 1070 (Desktop) 1920 @ 1.51 - 1.68 GHz256 Bit @ 8000 MHz
GeForce GTX 1080 Max-Q 2560 @ 1.1 - 1.28 GHz256 Bit @ 10000 MHz
GeForce GTX 1070 Mobile 2048 @ 1.44 - 1.65 GHz256 Bit @ 8000 MHz
GeForce GTX 1070 Max-Q 2048 @ 1.1 - 1.27 GHz256 Bit @ 8000 MHz
GeForce GTX 1060 (Desktop) 1280 @ 1.51 - 1.71 GHz192 Bit @ 8000 MHz
GeForce GTX 1060 Mobile 1280 @ 1.4 - 1.67 GHz192 Bit @ 8000 MHz
GeForce GTX 1060 Max-Q 1280 @ 1.06 - 1.34 GHz192 Bit @ 8000 MHz
GeForce GTX 1050 Ti Mobile 768 @ 1.49 - 1.62 GHz128 Bit @ 7000 MHz
GeForce GTX 1050 Ti (Desktop) 768 @ 1.29 - 1.39 GHz128 Bit @ 7008 MHz
GeForce GTX 1050 Ti Max-Q 768 @ 1.15 - 1.29 GHz128 Bit @ 7000 MHz
GeForce GTX 1050 (Desktop) 640 @ 1.35 - 1.46 GHz128 Bit @ 7008 MHz
GeForce GTX 1050 Mobile 640 @ 1.35 - 1.49 GHz128 Bit @ 7000 MHz
GeForce GTX 1050 Max-Q 640 @ 1 - 1.14 GHz128 Bit @ 7000 MHz
GeForce GT 1030 (Desktop) 384 @ 1.23 - 1.67 GHz64 Bit @ 6000 MHz
Iris Plus Graphics 655 48 @ 0.3 - 1.2 GHz
Iris Plus Graphics 650 48 @ 0.3 - 1.1 GHz64/128 Bit
Iris Plus Graphics 645 48 @ 0.3 - 1.15 GHz
Iris Plus Graphics 640 48 @ 0.3 - 1.05 GHz64/128 Bit
UHD Graphics 630 24 @ 0.3 - 1.15 GHz64/128 Bit
UHD Graphics P630 24 @ 0.3 - 1.2 GHz64/128 Bit
HD Graphics 630 24 @ 0.3 - 1.15 GHz64/128 Bit
HD Graphics P630 24 64/128 Bit
UHD Graphics 620 24 @ 0.3 - 1.15 GHz
HD Graphics 620 24 @ 0.3 - 1.05 GHz64/128 Bit
UHD Graphics 617 24 @ 0.3 - 1.15 GHz64/128 Bit
UHD Graphics 615 24 @ 0.3 - 1 GHz64/128 Bit
HD Graphics 615 24 @ 0.3 - 1.05 GHz64/128 Bit
CodenameKaby Lake GT3ePascal GP104Kaby Lake GT3e
ArchitekturGen. 9.5 Kaby LakePascalGen. 9.5 Kaby Lake
Pipelines48 - unified2432 - unified48 - unified
Kerntakt300 - 1100 (Boost) MHz1607 - 1683 (Boost) MHz300 - 1200 (Boost) MHz
Speicherbandbreite64/128 Bit256 Bit
SpeichertypDDR4GDDR5DDR3/DDR4
Shared Memoryjaneinja
APIDirectX 12_1, OpenGL 4.4DirectX 12_1, OpenGL 4.5DirectX 12_1, OpenGL 4.5
Herstellungsprozess14 nm16 nm14 nm
FeaturesQuickSyncMulti-Projection, VR Ready, G-SYNC, Vulkan, Multi MonitorQuickSync
Erscheinungsdatum03.01.2017 02.11.2017 01.09.2017
Speichertakt8000 MHz
Max. Speichergröße8 GB
Stromverbrauch180 Watt
Transistors7.2 Billion
Herstellerseitewww.nvidia.at
CPU in Iris Plus Graphics 650GPU Base SpeedGPU Boost / Turbo
Intel Core i7-7567U2 x 3500 MHz, 28 W300 MHz1100 MHz
Intel Core i5-7287U2 x 3300 MHz, 28 W300 MHz1100 MHz
Intel Core i5-7267U2 x 3100 MHz, 28 W300 MHz1050 MHz
Intel Core i3-7167U2 x 2800 MHz, 28 W300 MHz1000 MHz
min. - max.300 MHz1000 - 1100 MHz
CPU in Iris Plus Graphics 655GPU Base SpeedGPU Boost / Turbo
Intel Core i7-8559U4 x 2700 MHz, 28 W300 MHz1200 MHz
Intel Core i5-8269U4 x 2600 MHz, 28 W300 MHz1100 MHz
Intel Core i5-8279U4 x 2400 MHz, 28 W300 MHz1150 MHz
min. - max.300 MHz1000 - 1200 MHz

Benchmarks

Performance Rating - 3DMark 11 + Fire Strike + Time Spy - Iris Plus Graphics 655
0.9 pt (3%)
3DMark - 3DMark Time Spy Score
623 Points (2%)
6177 Points (18%)
min: 348     avg: 647     median: 684 (2%)     max: 722 Points
3DMark - 3DMark Time Spy Graphics
555 Points (1%)
6531 Points (17%)
min: 301     avg: 570     median: 604.5 (2%)     max: 633 Points
3DMark - 3DMark Ice Storm Unlimited Graphics
161538 Points (16%)
442105 Points (45%)
min: 131607     avg: 139716     median: 137266 (14%)     max: 152727 Points
3DMark - 3DMark Ice Storm Extreme Graphics
min: 57033     avg: 72655     median: 71073 (9%)     max: 89859 Points
3DMark - 3DMark Cloud Gate Score
min: 8403     avg: 9150     median: 9149.5 (10%)     max: 9896 Points
29364 Points (31%)
min: 6769     avg: 10798     median: 11622 (12%)     max: 13037 Points
3DMark - 3DMark Cloud Gate Graphics
13153 Points (3%)
88161 Points (23%)
min: 6498     avg: 13736     median: 14343 (4%)     max: 16698 Points
3DMark - 3DMark Fire Strike Standard Score
min: 1586     avg: 1655     median: 1655 (3%)     max: 1724 Points
15061 Points (27%)
min: 852     avg: 1703     median: 1850 (3%)     max: 2040 Points
3DMark - 3DMark Fire Strike Standard Graphics
1698 Points (2%)
18405 Points (21%)
min: 920     avg: 1836     median: 1983 (2%)     max: 2260 Points
3DMark - 3DMark Ice Storm Graphics
min: 85405     avg: 107151     median: 110302 (13%)     max: 122594 Points
3DMark 11 - 3DM11 Performance Score
2924 Points (4%)
20106 Points (28%)
min: 1548     avg: 2942     median: 3180.5 (4%)     max: 3349 Points
3DMark 11 - 3DM11 Performance GPU
2762 Points (2%)
27503 Points (24%)
min: 1365     avg: 2707     median: 2894 (2%)     max: 3081 Points
3DMark Vantage
3DM Vant. Perf. total + Intel Iris Plus Graphics 655
3DMark Vantage - 3DM Vant. Perf. total
min: 12093     avg: 12287     median: 12287 (4%)     max: 12481 Points
3DM Vant. Perf. GPU no PhysX + Intel Iris Plus Graphics 655
3DMark Vantage - 3DM Vant. Perf. GPU no PhysX
min: 10337     avg: 10514     median: 10513.5 (6%)     max: 10690 Points
3DMark 05 - 3DMark 05 - Standard
22740 Points (25%)
3DMark 06 3DMark 06 - Standard 1280x1024 + Intel Iris Plus Graphics 650
3DMark 06
15175 Points (20%)
3DMark 06 - Standard 1280x1024 + NVIDIA GeForce GTX 1070 Ti (Desktop)
36475 Points (48%)
3DMark 06 - Standard 1280x1024 + Intel Iris Plus Graphics 655
min: 17176     avg: 17885     median: 17885 (23%)     max: 18594 Points
Unigine Valley 1.0 - Unigine Valley 1.0 DX
8.2 fps (3%)
SPECviewperf 12
specvp12 sw-03 + Intel Iris Plus Graphics 655
SPECviewperf 12 - specvp12 sw-03
28.2 fps (7%)
specvp12 snx-02 + Intel Iris Plus Graphics 655
SPECviewperf 12 - specvp12 snx-02
2.1 fps (0%)
specvp12 showcase-01 + Intel Iris Plus Graphics 655
SPECviewperf 12 - specvp12 showcase-01
10.3 fps (2%)
specvp12 mediacal-01 + Intel Iris Plus Graphics 655
SPECviewperf 12 - specvp12 mediacal-01
4.6 fps (1%)
specvp12 maya-04 + Intel Iris Plus Graphics 655
SPECviewperf 12 - specvp12 maya-04
20.4 fps (6%)
specvp12 energy-01 + Intel Iris Plus Graphics 655
SPECviewperf 12 - specvp12 energy-01
0.3 fps (0%)
specvp12 creo-01 + Intel Iris Plus Graphics 655
SPECviewperf 12 - specvp12 creo-01
14.9 fps (6%)
specvp12 catia-04 + Intel Iris Plus Graphics 655
SPECviewperf 12 - specvp12 catia-04
18.8 fps (3%)
specvp12 3dsmax-05 + Intel Iris Plus Graphics 655
SPECviewperf 12 - specvp12 3dsmax-05
18.1 fps (3%)
SPECviewperf 13 specvp13 sw-04 + Intel Iris Plus Graphics 655
SPECviewperf 13 - specvp13 sw-04
34.6 fps (9%)
specvp13 snx-03 + Intel Iris Plus Graphics 655
SPECviewperf 13 - specvp13 snx-03
3.8 fps (0%)
specvp13 showcase-02 + Intel Iris Plus Graphics 655
SPECviewperf 13 - specvp13 showcase-02
10.3 fps (2%)
specvp13 medical-02 + Intel Iris Plus Graphics 655
SPECviewperf 13 - specvp13 medical-02
3.8 fps (1%)
specvp13 maya-05 + Intel Iris Plus Graphics 655
SPECviewperf 13 - specvp13 maya-05
25.9 fps (3%)
specvp13 energy-02 + Intel Iris Plus Graphics 655
SPECviewperf 13 - specvp13 energy-02
1.1 fps (0%)
specvp13 creo-02 + Intel Iris Plus Graphics 655
SPECviewperf 13 - specvp13 creo-02
19.6 fps (3%)
specvp13 catia-05 + Intel Iris Plus Graphics 655
SPECviewperf 13 - specvp13 catia-05
26.4 fps (3%)
specvp13 3dsmax-06 + Intel Iris Plus Graphics 655
SPECviewperf 13 - specvp13 3dsmax-06
18.2 fps (3%)
SPECviewperf 2020 specvp2020 solidworks-05 4k + Intel Iris Plus Graphics 655
SPECviewperf 2020 - specvp2020 solidworks-05 4k
21.2 fps (6%)
specvp2020 snx-04 4k + Intel Iris Plus Graphics 655
SPECviewperf 2020 - specvp2020 snx-04 4k
3.8 fps (0%)
specvp2020 medical-03 4k + Intel Iris Plus Graphics 655
SPECviewperf 2020 - specvp2020 medical-03 4k
1.8 fps (2%)
specvp2020 maya-06 4k + Intel Iris Plus Graphics 655
SPECviewperf 2020 - specvp2020 maya-06 4k
32.7 fps (5%)
specvp2020 energy-03 4k + Intel Iris Plus Graphics 655
SPECviewperf 2020 - specvp2020 energy-03 4k
1.1 fps (0%)
specvp2020 creo-03 4k + Intel Iris Plus Graphics 655
SPECviewperf 2020 - specvp2020 creo-03 4k
12.1 fps (6%)
specvp2020 catia-06 4k + Intel Iris Plus Graphics 655
SPECviewperf 2020 - specvp2020 catia-06 4k
6.3 fps (4%)
specvp2020 3dsmax-07 4k + Intel Iris Plus Graphics 655
SPECviewperf 2020 - specvp2020 3dsmax-07 4k
8.4 fps (3%)
Cinebench R10 Cinebench R10 Shading (32bit) + Intel Iris Plus Graphics 650
Cinebench R10 - Cinebench R10 Shading (32bit)
8773 Points (6%)
Cinebench R10 Shading (32bit) + Intel Iris Plus Graphics 655
min: 7836     avg: 9544     median: 10263 (7%)     max: 10533 Points
Cinebench R11.5 Cinebench R11.5 OpenGL 64 Bit + Intel Iris Plus Graphics 650
Cinebench R11.5 - Cinebench R11.5 OpenGL 64 Bit
45.2 fps (15%)
Cinebench R11.5 OpenGL 64 Bit + Intel Iris Plus Graphics 655
min: 50.25     avg: 51.4     median: 51.6 (17%)     max: 52.2 fps
Cinebench R15
Cinebench R15 OpenGL 64 Bit + Intel Iris Plus Graphics 650
Cinebench R15 - Cinebench R15 OpenGL 64 Bit
min: 41.21     avg: 59.1     median: 59.1 (3%)     max: 77 fps
Cinebench R15 OpenGL 64 Bit + Intel Iris Plus Graphics 655
min: 33.91     avg: 67     median: 74 (4%)     max: 88 fps
Cinebench R15 OpenGL Ref. Match 64 Bit + Intel Iris Plus Graphics 650
Cinebench R15 - Cinebench R15 OpenGL Ref. Match 64 Bit
99.3 % (99%)
Cinebench R15 OpenGL Ref. Match 64 Bit + Intel Iris Plus Graphics 655
min: 97.8     avg: 98.1     median: 97.8 (98%)     max: 99.3 %
GFXBench 3.1 - GFXBench Manhattan ES 3.1 Offscreen
min: 43.1     avg: 2387     median: 2387.1 (50%)     max: 4731 fps
GFXBench 3.0 - GFXBench 3.0 Manhattan Offscreen
199.6 fps (12%)
GFXBench (DX / GLBenchmark) 2.7
GFXBench T-Rex HD Offscreen C24Z16 + Intel Iris Plus Graphics 655
GFXBench (DX / GLBenchmark) 2.7 - GFXBench T-Rex HD Offscreen C24Z16
min: 199.6     avg: 6375     median: 6375.3 (51%)     max: 12551 fps
LuxMark v2.0 64Bit - LuxMark v2.0 Room GPU
336 Samples/s (2%)
2542 Samples/s (11%)
min: 359     avg: 419.5     median: 419.5 (2%)     max: 480 Samples/s
LuxMark v2.0 64Bit - LuxMark v2.0 Sala GPU
813 Samples/s (1%)
5159 Samples/s (9%)
min: 882     avg: 1038     median: 1038 (2%)     max: 1194 Samples/s
ComputeMark v2.1 - ComputeMark v2.1 Result
1730 Points (2%)
15488 Points (17%)
min: 1584     avg: 1713     median: 1712.5 (2%)     max: 1841 Points
Power Consumption - Furmark Stress Test Power Consumption - external Monitor *
51.4 Watt (7%)
291 Watt (41%)
min: 28.9     avg: 37.4     median: 39.2 (6%)     max: 42.4 Watt
Power Consumption - The Witcher 3 Power Consumption - external Monitor *
51.4 Watt (7%)
290 Watt (41%)
min: 35.3     avg: 40.6     median: 39.4 (6%)     max: 47.2 Watt
Power Consumption - Witcher 3 Power Consumption *
min: 39.4     avg: 43.3     median: 43.3 (10%)     max: 47.2 Watt
Power Consumption - Witcher 3 ultra Power Efficiency
0.1 fps per Watt (13%)
Power Consumption - Witcher 3 ultra Power Efficiency - external Monitor
0.2 fps per Watt (21%)
0.2 fps per Watt (13%)
Emissions Witcher 3 Fan Noise + Intel Iris Plus Graphics 650
Emissions - Witcher 3 Fan Noise
39.1 dB(A) (63%)
Witcher 3 Fan Noise + Intel Iris Plus Graphics 655
min: 32.5     avg: 36.2     median: 37.2 (60%)     max: 39 dB(A)
Clock Speed - GPU Clock Witcher 3 ultra
998 MHz (39%)
1810 MHz (71%)
Clock Speed - GPU Clock Speed Furmark
848 MHz (34%)
1677 MHz (66%)

Average Benchmarks Intel Iris Plus Graphics 650 → 100% n=14

Average Benchmarks NVIDIA GeForce GTX 1070 Ti (Desktop) → 701% n=14

Average Benchmarks Intel Iris Plus Graphics 655 → 111% n=14

- Bereich der Benchmarkergebnisse für diese Grafikkarte
- Durchschnittliche Benchmarkergebnisse für diese Grafikkarte
* Smaller numbers mean a higher performance
1 This benchmark is not used for the average calculation

Spiele-Benchmarks

Die folgenden Benchmarks basieren auf unseren Spieletests mit Testnotebooks. Die Performance dieser Grafikkarte bei den gelisteten Spielen ist abhängig von der verwendeten CPU, Speicherausstattung, Treiber und auch Betriebssystem. Dadurch müssen die untenstehenden Werte nicht repräsentativ sein. Detaillierte Informationen über das verwendete System sehen Sie nach einem Klick auf den fps-Wert.

F1 2021

F1 2021

2021
low 1280x720
Iris Plus Graphics 655:
44.6  fps
med. 1920x1080
Iris Plus Graphics 655:
21.6  fps
high 1920x1080
Iris Plus Graphics 655:
16.4  fps
ultra 1920x1080
Iris Plus Graphics 655:
10.2  fps
F1 2020

F1 2020

2020
low 1280x720
Iris Plus Graphics 655:
40.7  fps
med. 1920x1080
Iris Plus Graphics 655:
19.1  fps
high 1920x1080
Iris Plus Graphics 655:
14.5  fps
ultra 1920x1080
Iris Plus Graphics 655:
9.6  fps
low 1280x720
Iris Plus Graphics 655:
54.8  fps
med. 1920x1080
Iris Plus Graphics 655:
17.3  fps
high 1920x1080
Iris Plus Graphics 655:
11.6  fps
low 1280x720
Iris Plus Graphics 655:
0 (!)  fps
low 1280x720
Iris Plus Graphics 655:
29.1  fps
med. 1920x1080
Iris Plus Graphics 655:
16.2  fps
high 1920x1080
Iris Plus Graphics 655:
14.1  fps
ultra 1920x1080
Iris Plus Graphics 655:
6.6  fps
high 1920x1080
Iris Plus Graphics 655:
59.8  fps
4K 3840x2160
Iris Plus Graphics 655:
27.2  fps
low 1280x720
Iris Plus Graphics 655:
15.8  fps
low 1280x720
Iris Plus Graphics 655:
0 (!)  fps
GRID 2019

GRID 2019

2019
low 1280x720
Iris Plus Graphics 655:
36.3 (!)  fps
med. 1920x1080
Iris Plus Graphics 655:
20.9 (!)  fps
low 1280x720
Iris Plus Graphics 655:
0 (!)  fps
FIFA 20

FIFA 20

2019
low 1280x720
Iris Plus Graphics 655:
92  fps
med. 1920x1080
Iris Plus Graphics 655:
55.9  fps
high 1920x1080
Iris Plus Graphics 655:
46.3  fps
ultra 1920x1080
Iris Plus Graphics 655:
34.9  fps
QHD 2560x1440
Iris Plus Graphics 655:
26.5  fps
4K 3840x2160
Iris Plus Graphics 655:
13.6  fps
low 1280x720
Iris Plus Graphics 655:
22.5 23.5 ~ 23 fps
med. 1920x1080
Iris Plus Graphics 655:
10.2 10.4 ~ 10 fps
high 1920x1080
Iris Plus Graphics 655:
6.4 6.7 ~ 7 fps
Control

Control

2019
low 1280x720
GeForce GTX 1070 Ti (Desktop):
200  fps
Iris Plus Graphics 655:
25.4 (!)  fps
med. 1920x1080
GeForce GTX 1070 Ti (Desktop):
78  fps
high 1920x1080
GeForce GTX 1070 Ti (Desktop):
58.5  fps
QHD 2560x1440
GeForce GTX 1070 Ti (Desktop):
37.1  fps
4K 3840x2160
GeForce GTX 1070 Ti (Desktop):
17.9  fps
F1 2019

F1 2019

2019
low 1280x720
GeForce GTX 1070 Ti (Desktop):
244  fps
Iris Plus Graphics 655:
51.2  fps
med. 1920x1080
GeForce GTX 1070 Ti (Desktop):
183  fps
Iris Plus Graphics 655:
21.9  fps
high 1920x1080
GeForce GTX 1070 Ti (Desktop):
164  fps
Iris Plus Graphics 655:
19.3  fps
ultra 1920x1080
GeForce GTX 1070 Ti (Desktop):
120  fps
QHD 2560x1440
GeForce GTX 1070 Ti (Desktop):
94  fps
4K 3840x2160
GeForce GTX 1070 Ti (Desktop):
57  fps
low 1280x720
GeForce GTX 1070 Ti (Desktop):
271  fps
med. 1920x1080
GeForce GTX 1070 Ti (Desktop):
249  fps
high 1920x1080
GeForce GTX 1070 Ti (Desktop):
241  fps
ultra 1920x1080
GeForce GTX 1070 Ti (Desktop):
219  fps
QHD 2560x1440
GeForce GTX 1070 Ti (Desktop):
222  fps
4K 3840x2160
GeForce GTX 1070 Ti (Desktop):
221  fps
low 1280x720
Iris Plus Graphics 655:
56.7  fps
med. 1920x1080
Iris Plus Graphics 655:
18.5  fps
high 1920x1080
GeForce GTX 1070 Ti (Desktop):
86.6  fps
Iris Plus Graphics 655:
10.5  fps
ultra 1920x1080
GeForce GTX 1070 Ti (Desktop):
63.4  fps
QHD 2560x1440
GeForce GTX 1070 Ti (Desktop):
41.2  fps
4K 3840x2160
GeForce GTX 1070 Ti (Desktop):
20.3  fps
Rage 2

Rage 2

2019
low 1280x720
Iris Plus Graphics 655:
24.5  fps
Anno 1800

Anno 1800

2019
low 1280x720
Iris Plus Graphics 655:
30.2  fps
ultra 1920x1080
GeForce GTX 1070 Ti (Desktop):
46  fps
QHD 2560x1440
GeForce GTX 1070 Ti (Desktop):
40.4  fps
4K 3840x2160
GeForce GTX 1070 Ti (Desktop):
24.1  fps
low 1280x720
Iris Plus Graphics 655:
35  fps
low 1280x720
Iris Plus Graphics 655:
64  fps
med. 1920x1080
Iris Plus Graphics 655:
22.8  fps
Anthem

Anthem

2019
low 1280x720
Iris Plus Graphics 655:
16.6  fps
low 1280x720
GeForce GTX 1070 Ti (Desktop):
121  fps
Iris Plus Graphics 655:
21 22 ~ 22 fps
med. 1920x1080
GeForce GTX 1070 Ti (Desktop):
107  fps
Iris Plus Graphics 655:
11 11 ~ 11 fps
high 1920x1080
GeForce GTX 1070 Ti (Desktop):
103  fps
Iris Plus Graphics 655:
10  fps
ultra 1920x1080
GeForce GTX 1070 Ti (Desktop):
93  fps
Iris Plus Graphics 655:
9  fps
QHD 2560x1440
GeForce GTX 1070 Ti (Desktop):
76  fps
4K 3840x2160
GeForce GTX 1070 Ti (Desktop):
42  fps
low 1280x720
GeForce GTX 1070 Ti (Desktop):
147  fps
Iris Plus Graphics 655:
18.3 20.1 ~ 19 fps
med. 1920x1080
GeForce GTX 1070 Ti (Desktop):
83  fps
Iris Plus Graphics 655:
10.1  fps
high 1920x1080
GeForce GTX 1070 Ti (Desktop):
63  fps
Iris Plus Graphics 655:
7.4  fps
ultra 1920x1080
GeForce GTX 1070 Ti (Desktop):
52.3  fps
QHD 2560x1440
GeForce GTX 1070 Ti (Desktop):
40.2  fps
4K 3840x2160
GeForce GTX 1070 Ti (Desktop):
24.6  fps
low 1280x720
GeForce GTX 1070 Ti (Desktop):
144  fps
med. 1920x1080
GeForce GTX 1070 Ti (Desktop):
138  fps
high 1920x1080
GeForce GTX 1070 Ti (Desktop):
123  fps
ultra 1920x1080
GeForce GTX 1070 Ti (Desktop):
121  fps
QHD 2560x1440
GeForce GTX 1070 Ti (Desktop):
81  fps
4K 3840x2160
GeForce GTX 1070 Ti (Desktop):
42.4  fps
ultra 1920x1080
GeForce GTX 1070 Ti (Desktop):
88  fps
QHD 2560x1440
GeForce GTX 1070 Ti (Desktop):
64  fps
4K 3840x2160
GeForce GTX 1070 Ti (Desktop):
35.3  fps
ultra 1920x1080
GeForce GTX 1070 Ti (Desktop):
110  fps
QHD 2560x1440
GeForce GTX 1070 Ti (Desktop):
74  fps
4K 3840x2160
GeForce GTX 1070 Ti (Desktop):
35.4  fps
low 1280x720
Iris Plus Graphics 655:
19.9  fps
ultra 1920x1080
GeForce GTX 1070 Ti (Desktop):
111  fps
QHD 2560x1440
GeForce GTX 1070 Ti (Desktop):
83  fps
4K 3840x2160
GeForce GTX 1070 Ti (Desktop):
47.1  fps
low 1280x720
Iris Plus Graphics 655:
0 (!)  fps
ultra 1920x1080
GeForce GTX 1070 Ti (Desktop):
120  fps
QHD 2560x1440
GeForce GTX 1070 Ti (Desktop):
80  fps
4K 3840x2160
GeForce GTX 1070 Ti (Desktop):
40.1  fps
low 1280x720
Iris Plus Graphics 655:
13 18 ~ 16 fps
ultra 1920x1080
GeForce GTX 1070 Ti (Desktop):
63  fps
QHD 2560x1440
GeForce GTX 1070 Ti (Desktop):
48  fps
4K 3840x2160
GeForce GTX 1070 Ti (Desktop):
27  fps
low 1280x720
Iris Plus Graphics 655:
25  fps
med. 1920x1080
Iris Plus Graphics 655:
0 (!)  fps
ultra 1920x1080
GeForce GTX 1070 Ti (Desktop):
100  fps
QHD 2560x1440
GeForce GTX 1070 Ti (Desktop):
81  fps
4K 3840x2160
GeForce GTX 1070 Ti (Desktop):
55  fps
FIFA 19

FIFA 19

2018
low 1280x720
Iris Plus Graphics 655:
82  fps
med. 1920x1080
Iris Plus Graphics 655:
45.8  fps
high 1920x1080
Iris Plus Graphics 655:
40.3  fps
ultra 1920x1080
GeForce GTX 1070 Ti (Desktop):
267  fps
Iris Plus Graphics 655:
36.7  fps
4K 3840x2160
GeForce GTX 1070 Ti (Desktop):
141  fps
low 1280x720
Iris Plus Graphics 655:
19 20.5 22 23.5 ~ 21 fps
med. 1920x1080
Iris Plus Graphics 655:
11 13 ~ 12 fps
high 1920x1080
Iris Plus Graphics 655:
8 10.1 ~ 9 fps
ultra 1920x1080
GeForce GTX 1070 Ti (Desktop):
84  fps
QHD 2560x1440
GeForce GTX 1070 Ti (Desktop):
51  fps
4K 3840x2160
GeForce GTX 1070 Ti (Desktop):
28  fps
Strange Brigade

Strange Brigade

2018
low 1280x720
Iris Plus Graphics 655:
41.4  fps
med. 1920x1080
Iris Plus Graphics 655:
17.6  fps
high 1920x1080
Iris Plus Graphics 655:
16.9  fps
ultra 1920x1080
Iris Plus Graphics 655:
14.5  fps
F1 2018

F1 2018

2018
low 1280x720
Iris Plus Graphics 655:
45  fps
med. 1920x1080
Iris Plus Graphics 655:
23  fps
high 1920x1080
Iris Plus Graphics 655:
17  fps
ultra 1920x1080
GeForce GTX 1070 Ti (Desktop):
97  fps
Iris Plus Graphics 655:
12 12 ~ 12 fps
QHD 2560x1440
GeForce GTX 1070 Ti (Desktop):
78  fps
4K 3840x2160
GeForce GTX 1070 Ti (Desktop):
49  fps
ultra 1920x1080
GeForce GTX 1070 Ti (Desktop):
78  fps
QHD 2560x1440
GeForce GTX 1070 Ti (Desktop):
48.5  fps
4K 3840x2160
GeForce GTX 1070 Ti (Desktop):
23.8  fps
low 1280x720
Iris Plus Graphics 655:
30.9  fps
Far Cry 5

Far Cry 5

2018
low 1280x720
GeForce GTX 1070 Ti (Desktop):
135  fps
Iris Plus Graphics 655:
20 22 23 ~ 22 fps
med. 1920x1080
GeForce GTX 1070 Ti (Desktop):
114  fps
Iris Plus Graphics 655:
10 11 11 ~ 11 fps
high 1920x1080
GeForce GTX 1070 Ti (Desktop):
108  fps
Iris Plus Graphics 655:
10  fps
ultra 1920x1080
GeForce GTX 1070 Ti (Desktop):
102  fps
Iris Plus Graphics 655:
9  fps
QHD 2560x1440
GeForce GTX 1070 Ti (Desktop):
75  fps
4K 3840x2160
GeForce GTX 1070 Ti (Desktop):
39  fps
World of Tanks enCore

World of Tanks enCore

2018
low 1366x768
Iris Plus Graphics 655:
15.7 250 ~ 133 fps
med. 1920x1080
Iris Plus Graphics 655:
40.3  fps
low 1280x720
GeForce GTX 1070 Ti (Desktop):
101  fps
Iris Plus Graphics 655:
13.8 21.2 22.4 25.3 26.8 32.6 42.8 ~ 26 fps
med. 1920x1080
GeForce GTX 1070 Ti (Desktop):
89  fps
Iris Plus Graphics 655:
9.8 15 15.3 18 18.4 23.3 29.5 ~ 18 fps
high 1920x1080
GeForce GTX 1070 Ti (Desktop):
74.5  fps
Iris Plus Graphics 655:
8.6 12.3 13.4 15.9 16 19.8 25.1 ~ 16 fps
4K 3840x2160
GeForce GTX 1070 Ti (Desktop):
66.7  fps
low 1280x720
GeForce GTX 1070 Ti (Desktop):
154  fps
med. 1920x1080
GeForce GTX 1070 Ti (Desktop):
100  fps
high 1920x1080
GeForce GTX 1070 Ti (Desktop):
82  fps
ultra 1920x1080
GeForce GTX 1070 Ti (Desktop):
59.1  fps
QHD 2560x1440
GeForce GTX 1070 Ti (Desktop):
42.4  fps
4K 3840x2160
GeForce GTX 1070 Ti (Desktop):
22.7  fps
low 1280x720
GeForce GTX 1070 Ti (Desktop):
146  fps
Iris Plus Graphics 655:
9.1 14.7 15.6 16.6 16.9 17 17.3 18.1 ~ 16 fps
med. 1920x1080
GeForce GTX 1070 Ti (Desktop):
87  fps
Iris Plus Graphics 655:
7.9 8.8 9.1 9.7 ~ 9 fps
high 1920x1080
GeForce GTX 1070 Ti (Desktop):
63  fps
Iris Plus Graphics 655:
5.3 6 6.1 6.6 ~ 6 fps
4K 3840x2160
GeForce GTX 1070 Ti (Desktop):
27.7  fps
Fortnite

Fortnite

2018
low 1280x720
Iris Plus Graphics 655:
51.5  fps
med. 1920x1080
Iris Plus Graphics 655:
21.6  fps
ultra 1920x1080
GeForce GTX 1070 Ti (Desktop):
109  fps
QHD 2560x1440
GeForce GTX 1070 Ti (Desktop):
72  fps
4K 3840x2160
GeForce GTX 1070 Ti (Desktop):
36  fps
ultra 1920x1080
GeForce GTX 1070 Ti (Desktop):
117  fps
QHD 2560x1440
GeForce GTX 1070 Ti (Desktop):
77  fps
4K 3840x2160
GeForce GTX 1070 Ti (Desktop):
38  fps
ultra 1920x1080
GeForce GTX 1070 Ti (Desktop):
122  fps
QHD 2560x1440
GeForce GTX 1070 Ti (Desktop):
85  fps
4K 3840x2160
GeForce GTX 1070 Ti (Desktop):
45  fps
low 1280x720
GeForce GTX 1070 Ti (Desktop):
103  fps
Iris Plus Graphics 655:
13  fps
med. 1920x1080
GeForce GTX 1070 Ti (Desktop):
92  fps
high 1920x1080
GeForce GTX 1070 Ti (Desktop):
88  fps
ultra 1920x1080
GeForce GTX 1070 Ti (Desktop):
75  fps
QHD 2560x1440
GeForce GTX 1070 Ti (Desktop):
58  fps
4K 3840x2160
GeForce GTX 1070 Ti (Desktop):
34  fps
low 1280x720
GeForce GTX 1070 Ti (Desktop):
165  fps
Iris Plus Graphics 655:
30  fps
med. 1920x1080
GeForce GTX 1070 Ti (Desktop):
136  fps
Iris Plus Graphics 655:
18  fps
high 1920x1080
GeForce GTX 1070 Ti (Desktop):
109  fps
Iris Plus Graphics 655:
14  fps
ultra 1920x1080
GeForce GTX 1070 Ti (Desktop):
85  fps
Iris Plus Graphics 655:
9  fps
4K 3840x2160
GeForce GTX 1070 Ti (Desktop):
34  fps
ultra 1920x1080
GeForce GTX 1070 Ti (Desktop):
47.1  fps
4K 3840x2160
GeForce GTX 1070 Ti (Desktop):
17.3  fps
F1 2017

F1 2017

2017
ultra 1920x1080
GeForce GTX 1070 Ti (Desktop):
106  fps
4K 3840x2160
GeForce GTX 1070 Ti (Desktop):
52  fps
low 1280x720
Iris Plus Graphics 655:
128  fps
med. 1366x768
Iris Plus Graphics 655:
125  fps
high 1920x1080
Iris Plus Graphics 655:
113  fps
ultra 1920x1080
Iris Plus Graphics 655:
57.8  fps
4K 3820x2160
GeForce GTX 1070 Ti (Desktop):
152  fps
Iris Plus Graphics 655:
34.4  fps
Dirt 4

Dirt 4

2017
low 1280x720
100%
Iris Plus Graphics 650:
64  fps
med. 1920x1080
100%
Iris Plus Graphics 650:
21.3  fps
high 1920x1080
100%
Iris Plus Graphics 650:
14.2  fps
4K 3840x2160
GeForce GTX 1070 Ti (Desktop):
57.9  fps
low 1280x720
100%
Iris Plus Graphics 650:
113  fps
91%
Iris Plus Graphics 655:
78 97 133.3 ~ 103 fps
med. 1920x1080
100%
Iris Plus Graphics 650:
56.8  fps
86%
Iris Plus Graphics 655:
40.6 46 59.1 ~ 49 fps
high 1920x1080
100%
Iris Plus Graphics 650:
38.9  fps
573%
GeForce GTX 1070 Ti (Desktop):
223  fps
93%
Iris Plus Graphics 655:
32.7 36 38.8 ~ 36 fps
4K 3840x2160
GeForce GTX 1070 Ti (Desktop):
92  fps
Prey

Prey

2017
low 1280x720
100%
Iris Plus Graphics 650:
51.4  fps
med. 1920x1080
100%
Iris Plus Graphics 650:
20.2  fps
low 1280x720
100%
Iris Plus Graphics 650:
25.8  fps
med. 1920x1080
100%
Iris Plus Graphics 650:
10.5  fps
low 1280x720
100%
Iris Plus Graphics 650:
17.6  fps
125%
Iris Plus Graphics 655:
20.4 22.7 ~ 22 fps
med. 1920x1080
Iris Plus Graphics 655:
10.2  fps
ultra 1920x1080
GeForce GTX 1070 Ti (Desktop):
54.2  fps
4K 3840x2160
GeForce GTX 1070 Ti (Desktop):
35.8  fps
For Honor

For Honor

2017
low 1280x720
100%
Iris Plus Graphics 650:
39.7  fps
53%
Iris Plus Graphics 655:
0 (!) 41.3 ~ 21 fps
med. 1920x1080
100%
Iris Plus Graphics 650:
15.2  fps
106%
Iris Plus Graphics 655:
16.1  fps
high 1920x1080
GeForce GTX 1070 Ti (Desktop):
156  fps
ultra 1920x1080
GeForce GTX 1070 Ti (Desktop):
122  fps
4K 3840x2160
GeForce GTX 1070 Ti (Desktop):
47.9  fps
low 1280x720
100%
Iris Plus Graphics 650:
15  fps
low 1280x720
100%
Iris Plus Graphics 650:
32.4  fps
4K 3840x2160
GeForce GTX 1070 Ti (Desktop):
67.8  fps
low 1280x720
100%
Iris Plus Graphics 650:
54.1  fps
med. 1366x768
100%
Iris Plus Graphics 650:
37.9  fps
high 1920x1080
100%
Iris Plus Graphics 650:
36.8  fps
ultra 1920x1080
100%
Iris Plus Graphics 650:
19.9  fps
4K 3840x2160
GeForce GTX 1070 Ti (Desktop):
80  fps
low 1280x720
100%
Iris Plus Graphics 650:
46.1  fps
med. 1366x768
100%
Iris Plus Graphics 650:
29.5  fps
low 1024x768
100%
Iris Plus Graphics 650:
42.2  fps
med. 1366x768
100%
Iris Plus Graphics 650:
20.2  fps
ultra 1920x1080
GeForce GTX 1070 Ti (Desktop):
108  fps
4K 3840x2160
GeForce GTX 1070 Ti (Desktop):
91  fps
low 1280x720
100%
Iris Plus Graphics 650:
19.2  fps
149%
Iris Plus Graphics 655:
28.7  fps
med. 1366x768
100%
Iris Plus Graphics 650:
14.6  fps
145%
Iris Plus Graphics 655:
21.1  fps
high 1920x1080
100%
Iris Plus Graphics 650:
8.2  fps
ultra 1920x1080
GeForce GTX 1070 Ti (Desktop):
67.9  fps
4K 3840x2160
GeForce GTX 1070 Ti (Desktop):
31.9  fps
Overwatch

Overwatch

2016
low 1280x720
100%
Iris Plus Graphics 650:
79.2  fps
115%
Iris Plus Graphics 655:
91  fps
med. 1366x768
100%
Iris Plus Graphics 650:
57.4  fps
118%
Iris Plus Graphics 655:
68  fps
high 1920x1080
100%
Iris Plus Graphics 650:
25.6  fps
117%
Iris Plus Graphics 655:
29.9  fps
ultra 1920x1080
100%
Iris Plus Graphics 650:
21.4  fps
850%
GeForce GTX 1070 Ti (Desktop):
182  fps
85%
Iris Plus Graphics 655:
18.2  fps
4K 3840x2160
GeForce GTX 1070 Ti (Desktop):
88.7  fps
low 1280x768
Iris Plus Graphics 655:
19.4  fps
med. 1920x1080
Iris Plus Graphics 655:
11.3  fps
high 1920x1080
Iris Plus Graphics 655:
10.5  fps
low 1280x720
100%
Iris Plus Graphics 650:
30  fps
114%
Iris Plus Graphics 655:
34.2  fps
med. 1366x768
Iris Plus Graphics 655:
21.2  fps
ultra 1920x1080
GeForce GTX 1070 Ti (Desktop):
94.6  fps
4K 3840x2160
GeForce GTX 1070 Ti (Desktop):
45.6  fps
low 1280x720
100%
Iris Plus Graphics 650:
32  fps
med. 1920x1080
100%
Iris Plus Graphics 650:
15  fps
ultra 1920x1080
GeForce GTX 1070 Ti (Desktop):
98  fps
4K 3840x2160
GeForce GTX 1070 Ti (Desktop):
41  fps
low 1024x768
100%
Iris Plus Graphics 650:
25.9  fps
127%
Iris Plus Graphics 655:
25.9 39.2 ~ 33 fps
med. 1366x768
100%
Iris Plus Graphics 650:
18.3  fps
109%
Iris Plus Graphics 655:
17.6 22.3 ~ 20 fps
high 1920x1080
Iris Plus Graphics 655:
10.8  fps
ultra 1920x1080
GeForce GTX 1070 Ti (Desktop):
111  fps
Iris Plus Graphics 655:
8.9  fps
4K 3840x2160
GeForce GTX 1070 Ti (Desktop):
46.5  fps
low 1024x768
100%
Iris Plus Graphics 650:
54.2  fps
140%
Iris Plus Graphics 655:
75.8  fps
med. 1366x768
100%
Iris Plus Graphics 650:
35.6  fps
0%
Iris Plus Graphics 655:
0 (!)  fps
high 1920x1080
100%
Iris Plus Graphics 650:
20.8  fps
ultra 1920x1080
GeForce GTX 1070 Ti (Desktop):
177  fps
4K 3840x2160
GeForce GTX 1070 Ti (Desktop):
77  fps
low 1280x720
100%
Iris Plus Graphics 650:
95  fps
150%
GeForce GTX 1070 Ti (Desktop):
142.7  fps
91%
Iris Plus Graphics 655:
51.4 84 86.8 87.9 92.6 94.4 95 98 ~ 86 fps
med. 1366x768
100%
Iris Plus Graphics 650:
64  fps
210%
GeForce GTX 1070 Ti (Desktop):
134.2  fps
91%
Iris Plus Graphics 655:
34.6 37.1 57 63 64 66 68 77.9 ~ 58 fps
high 1920x1080
100%
Iris Plus Graphics 650:
29.7  fps
426%
GeForce GTX 1070 Ti (Desktop):
126.6  fps
98%
Iris Plus Graphics 655:
15.8 25.3 27.8 31.9 32.4 33.3 34.5 34.7 ~ 29 fps
ultra 1920x1080
100%
Iris Plus Graphics 650:
25  fps
485%
GeForce GTX 1070 Ti (Desktop):
121.2  fps
104%
Iris Plus Graphics 655:
13.4 22.7 24.5 27.7 28.1 28.1 29.9 30.4 ~ 26 fps
4K 3840x2160
GeForce GTX 1070 Ti (Desktop):
105  fps
Iris Plus Graphics 655:
11.6 12.2 ~ 12 fps
low 1024x768
100%
Iris Plus Graphics 650:
21.4  fps
1369%
GeForce GTX 1070 Ti (Desktop):
293  fps
121%
Iris Plus Graphics 655:
23.2 24.7 27.4 27.9 ~ 26 fps
med. 1366x768
Iris Plus Graphics 655:
14.6 17.8 ~ 16 fps
high 1920x1080
Iris Plus Graphics 655:
10.1 10.9 ~ 11 fps
ultra 1920x1080
GeForce GTX 1070 Ti (Desktop):
71.8  fps
Iris Plus Graphics 655:
5.6 5.6 ~ 6 fps
4K 3840x2160
GeForce GTX 1070 Ti (Desktop):
47.1  fps
GTA V

GTA V

2015
low 1024x768
100%
Iris Plus Graphics 650:
56.5  fps
110%
Iris Plus Graphics 655:
57 61 68 ~ 62 fps
med. 1366x768
100%
Iris Plus Graphics 650:
49.9  fps
110%
Iris Plus Graphics 655:
51.2 51.8 62.1 ~ 55 fps
high 1920x1080
100%
Iris Plus Graphics 650:
11.6  fps
129%
Iris Plus Graphics 655:
13.7 14.3 15.8 ~ 15 fps
ultra 1920x1080
100%
Iris Plus Graphics 650:
5  fps
120%
Iris Plus Graphics 655:
5.2 5.5 6.2 ~ 6 fps
QHD 2560x1440
Iris Plus Graphics 655:
4.2  fps
4K 3840x2160
GeForce GTX 1070 Ti (Desktop):
67  fps
low 1280x720
100%
Iris Plus Graphics 650:
84  fps
117%
Iris Plus Graphics 655:
78.4 116.6 ~ 98 fps
med. 1366x768
100%
Iris Plus Graphics 650:
54.4  fps
110%
Iris Plus Graphics 655:
54.3 64.8 ~ 60 fps
high 1366x768
100%
Iris Plus Graphics 650:
46.5  fps
112%
Iris Plus Graphics 655:
49.4 55 ~ 52 fps
ultra 1920x1080
100%
Iris Plus Graphics 650:
13.3  fps
992%
GeForce GTX 1070 Ti (Desktop):
132  fps
120%
Iris Plus Graphics 655:
15.5 17 ~ 16 fps
high 1366x768
Iris Plus Graphics 655:
93.7  fps
ultra 1920x1080
Iris Plus Graphics 655:
49.6  fps
4K 3820x2160
Iris Plus Graphics 655:
12.4  fps

Average Gaming Intel Iris Plus Graphics 650 → 100%

Average Gaming 30-70 fps → 100%

Average Gaming NVIDIA GeForce GTX 1070 Ti (Desktop) → 632%

Average Gaming Intel Iris Plus Graphics 655 → 107%

Average Gaming 30-70 fps → 107%

Intel Iris Plus Graphics 655lowmed.highultraQHD4K
F1 202144.621.616.410.2
F1 202040.719.114.59.64
Gears Tactics54.817.311.6
Doom Eternal
Escape from Tarkov29.116.214.16.59
Hearthstone59.827.2
Red Dead Redemption 215.8
Call of Duty Modern Warfare 2019
GRID 201936.320.9
Ghost Recon Breakpoint
FIFA 209255.946.334.926.513.6
Borderlands 323107
Control25.4
F1 201951.221.919.3
Total War: Three Kingdoms56.718.510.5
Rage 224.5
Anno 180030.2
The Division 235
Dirt Rally 2.06422.8
Anthem16.6
Far Cry New Dawn2211109
Metro Exodus1910.17.41
Battlefield V19.9
Call of Duty Black Ops 4
Assassin´s Creed Odyssey16
Forza Horizon 425
FIFA 198245.840.336.7
Shadow of the Tomb Raider21129
Strange Brigade41.417.616.914.5
F1 201845231712
The Crew 230.9
Far Cry 52211109
World of Tanks enCore13340.3
X-Plane 11.11261816
Final Fantasy XV Benchmark1696
Fortnite51.521.6
Assassin´s Creed Origins13
Middle-earth: Shadow of War3018149
Team Fortress 212812511357.834.4
Rocket League1034936
Ghost Recon Wildlands2210.2
For Honor2116.1
Deus Ex Mankind Divided28.721.1
Overwatch916829.918.2
Ashes of the Singularity19.411.310.5
The Division34.221.2
Rise of the Tomb Raider332010.88.9
Rainbow Six Siege75.8
Dota 2 Reborn8658292612
The Witcher 32616116
GTA V62551564.17
BioShock Infinite98605216
Counter-Strike: GO93.749.612.4
< 30 fps
< 60 fps
< 120 fps
≥ 120 fps
21
15
9
2
26
6
2
1
22
5
2
14
4

2


4
1

NVIDIA GeForce GTX 1070 Ti (Desktop)lowmed.highultraQHD4K
Control2007858.537.117.9
F1 20192441831641209457
League of Legends271249241219222221
Total War: Three Kingdoms86.663.441.220.3
Anno 18004640.424.1
Far Cry New Dawn121107103937642
Metro Exodus147836352.340.224.6
Apex Legends1441381231218142.4
Just Cause 4886435.3
Darksiders III1107435.4
Battlefield V1118347.1
Call of Duty Black Ops 41208040.1
Assassin´s Creed Odyssey634827
Forza Horizon 41008155
FIFA 19267141
Shadow of the Tomb Raider845128
F1 2018977849
Monster Hunter World7848.523.8
Far Cry 51351141081027539
X-Plane 11.111018974.566.7
Kingdom Come: Deliverance1541008259.142.422.7
Final Fantasy XV Benchmark146876327.7
Fortnite1097236
Star Wars Battlefront 21177738
Need for Speed Payback1228545
Assassin´s Creed Origins1039288755834
Middle-earth: Shadow of War1651361098534
Ark Survival Evolved47.117.3
F1 201710652
Team Fortress 2152
Dirt 457.9
Rocket League22392
Ghost Recon Wildlands54.235.8
For Honor15612247.9
Call of Duty Infinite Warfare67.8
Farming Simulator 1780
Civilization VI10891
Deus Ex Mankind Divided67.931.9
Overwatch18288.7
The Division94.645.6
Far Cry Primal9841
Rise of the Tomb Raider11146.5
Rainbow Six Siege17777
Dota 2 Reborn142.7134.2126.6121.2105
The Witcher 329371.847.1
GTA V67
BioShock Infinite132
< 30 fps
< 60 fps
< 120 fps
≥ 120 fps


2
12


8
5

1
9
6

5
22
11

9
13
1
10
24
9
3
Intel Iris Plus Graphics 650lowmed.highultraQHD4K
Dirt 46421.314.2
Rocket League11356.838.9
Prey51.420.2
Mass Effect Andromeda25.810.5
Ghost Recon Wildlands17.6
For Honor39.715.2
Dishonored 215
Call of Duty Infinite Warfare32.4
Titanfall 254.137.9
Farming Simulator 1736.819.9
Battlefield 146.129.5
Civilization VI42.220.2
Deus Ex Mankind Divided19.214.68.2
Overwatch79.257.425.621.4
The Division30
Far Cry Primal3215
Rise of the Tomb Raider25.918.3
Rainbow Six Siege54.235.620.8
Dota 2 Reborn956429.725
The Witcher 321.4
GTA V56.549.911.65
BioShock Infinite8454.446.513.3
< 30 fps
< 60 fps
< 120 fps
≥ 120 fps
6
10
5
9
6
1
6
3

5


Eine Liste mit weiteren Spielen und allen Grafikkarten finden Sie auf unserer Seite: Welches Spiel ist mit welcher Grafikkarte spielbar?

v1.28
log 24. 08:29:03

#0 ran 0s before starting gpusingle class +0s ... 0s

#1 checking url part for id 7655 +0s ... 0s

#2 checking url part for id 8258 +0s ... 0s

#3 checking url part for id 8828 +0s ... 0s

#4 redirected to Ajax server, took 1729751343s time from redirect:0 +0s ... 0s

#5 did not recreate cache, as it is less than 5 days old! Created at Tue, 22 Oct 2024 05:17:00 +0200 +0s ... 0s

#6 composed specs +0.005s ... 0.005s

#7 did output specs +0s ... 0.005s

#8 start showIntegratedCPUs +0s ... 0.005s

#9 getting avg benchmarks for device 7655 +0.001s ... 0.006s

#10 got single benchmarks 7655 +0.001s ... 0.007s

#11 getting avg benchmarks for device 8258 +0s ... 0.007s

#12 got single benchmarks 8258 +0.001s ... 0.008s

#13 getting avg benchmarks for device 8828 +0.002s ... 0.009s

#14 got single benchmarks 8828 +0.003s ... 0.012s

#15 got avg benchmarks for devices +0s ... 0.012s

#16 min, max, avg, median took s +0.027s ... 0.039s

#17 before gaming benchmark output +0s ... 0.039s

#18 Got 449 rows for game benchmarks. +0.019s ... 0.058s

#19 composed SQL query for gamebenchmarks +0s ... 0.058s

#20 got data and put it in $dataArray +0.004s ... 0.062s

#21 benchmarks composed for output. +0.025s ... 0.087s

#22 calculated avg scores. +0s ... 0.087s

#23 return log +0.001s ... 0.088s

Teilen Sie diesen Artikel, um uns zu unterstützen. Jeder Link hilft!
> Notebook Test, Laptop Test und News > Benchmarks / Technik > Benchmarks / Technik > Grafikkarten Vergleich - Head 2 Head
Autor: Klaus Hinum,  8.09.2017 (Update:  1.07.2023)