Notebookcheck Logo

Intel Iris Plus Graphics 640 vs Intel Graphics 4-Cores iGPU (Arc) vs Intel HD Graphics 630

Intel Iris Plus Graphics 640

► remove from comparison Intel Iris Plus Graphics 640

Die Intel Iris Plus Graphics 640 (GT3e) ist eine Prozessorgrafikkarte der im Jänner 2017 vorgestellten Kaby-Lake-Modelle. Als Nachfolger der Iris Graphics 540 (Skylake) ist die Iris Plus Graphics 640 dabei in den ULV-Modellen der 15-Watt-Klasse zu finden und besitzt einen dedizierten eDRAM-Cache mit 64 MB Kapazität. Die sogenannte GT3e-Ausbaustufe der Kaby-Lake-GPU verfügt weiterhin über 48 Execution Units (EUs), die je nach Modell mit bis zu 1.050 MHz takten.

Neben dem eDRAM-Cache kann die Iris 640 auch über das Interface des Prozessors auf den Hauptspeicher zugreifen (2x 64 Bit DDR3L-1600/LPDDR3-1866/DDR4-2133).

Von der Iris Plus 650 der 28-Watt-Modelle unterscheidet sich die Iris 640 lediglich durch ihren etwas geringeren Maximaltakt sowie die geringere TDP, wodurch der Turbo-Boost-Spielraum weniger lang ausgenutzt werden kann.

Performance

Die exakte Leistung der Iris Plus Graphics 640 hängt vom jeweiligen CPU-Modell ab, da sich die Maximaltaktrate leicht unterscheiden kann. Zum anderen beeinflusst auch der verwendete Speicher (DDR3/DDR4) die Performance.

Die höchste Leistung erreichen hochtaktende Core-i7-Ableger wie der Core i7-7660U. Je nach Spiel ordnet sich die Iris 640 wahrscheinlich wie der Vorgänger zwischen einer dedizierten GeForce 920M und GeForce 940M ein und kann aktuelle Spiele meist nur in niedrigen Einstellungen flüssig darstellen.

Features

Die überarbeitete Videoeinheit dekodiert H.265-/HEVC-Videos vollständig in Hardware. Anders als Skylake kann Kaby Lake nun auch H.265/HEVC im Main10-Profil mit 10 Bit Farbtiefe sowie Googles VP9-Codec in Hardware dekodieren. Die Bildausgabe erfolgt über DP 1.2/eDP 1.3 (max. 3.840 x 2.160 @ 60 Hz), wohingegen HDMI nur in der älteren Version 1.4a angeboten wird. Ein HDMI-2.0-Anschluss kann aber mittels Konverter von DisplayPort ergänzt werden. Maximal lassen sich drei Displays parallel angesteuern.

Leistungsaufnahme

Die Iris Graphics 640 ist in ULV-Prozessoren der 15-Watt-Klasse zu finden und damit für schlanke Note- und Ultrabooks geeignet.

Intel Graphics 4-Cores iGPU (Arc)

► remove from comparison Intel Graphics 4-Core

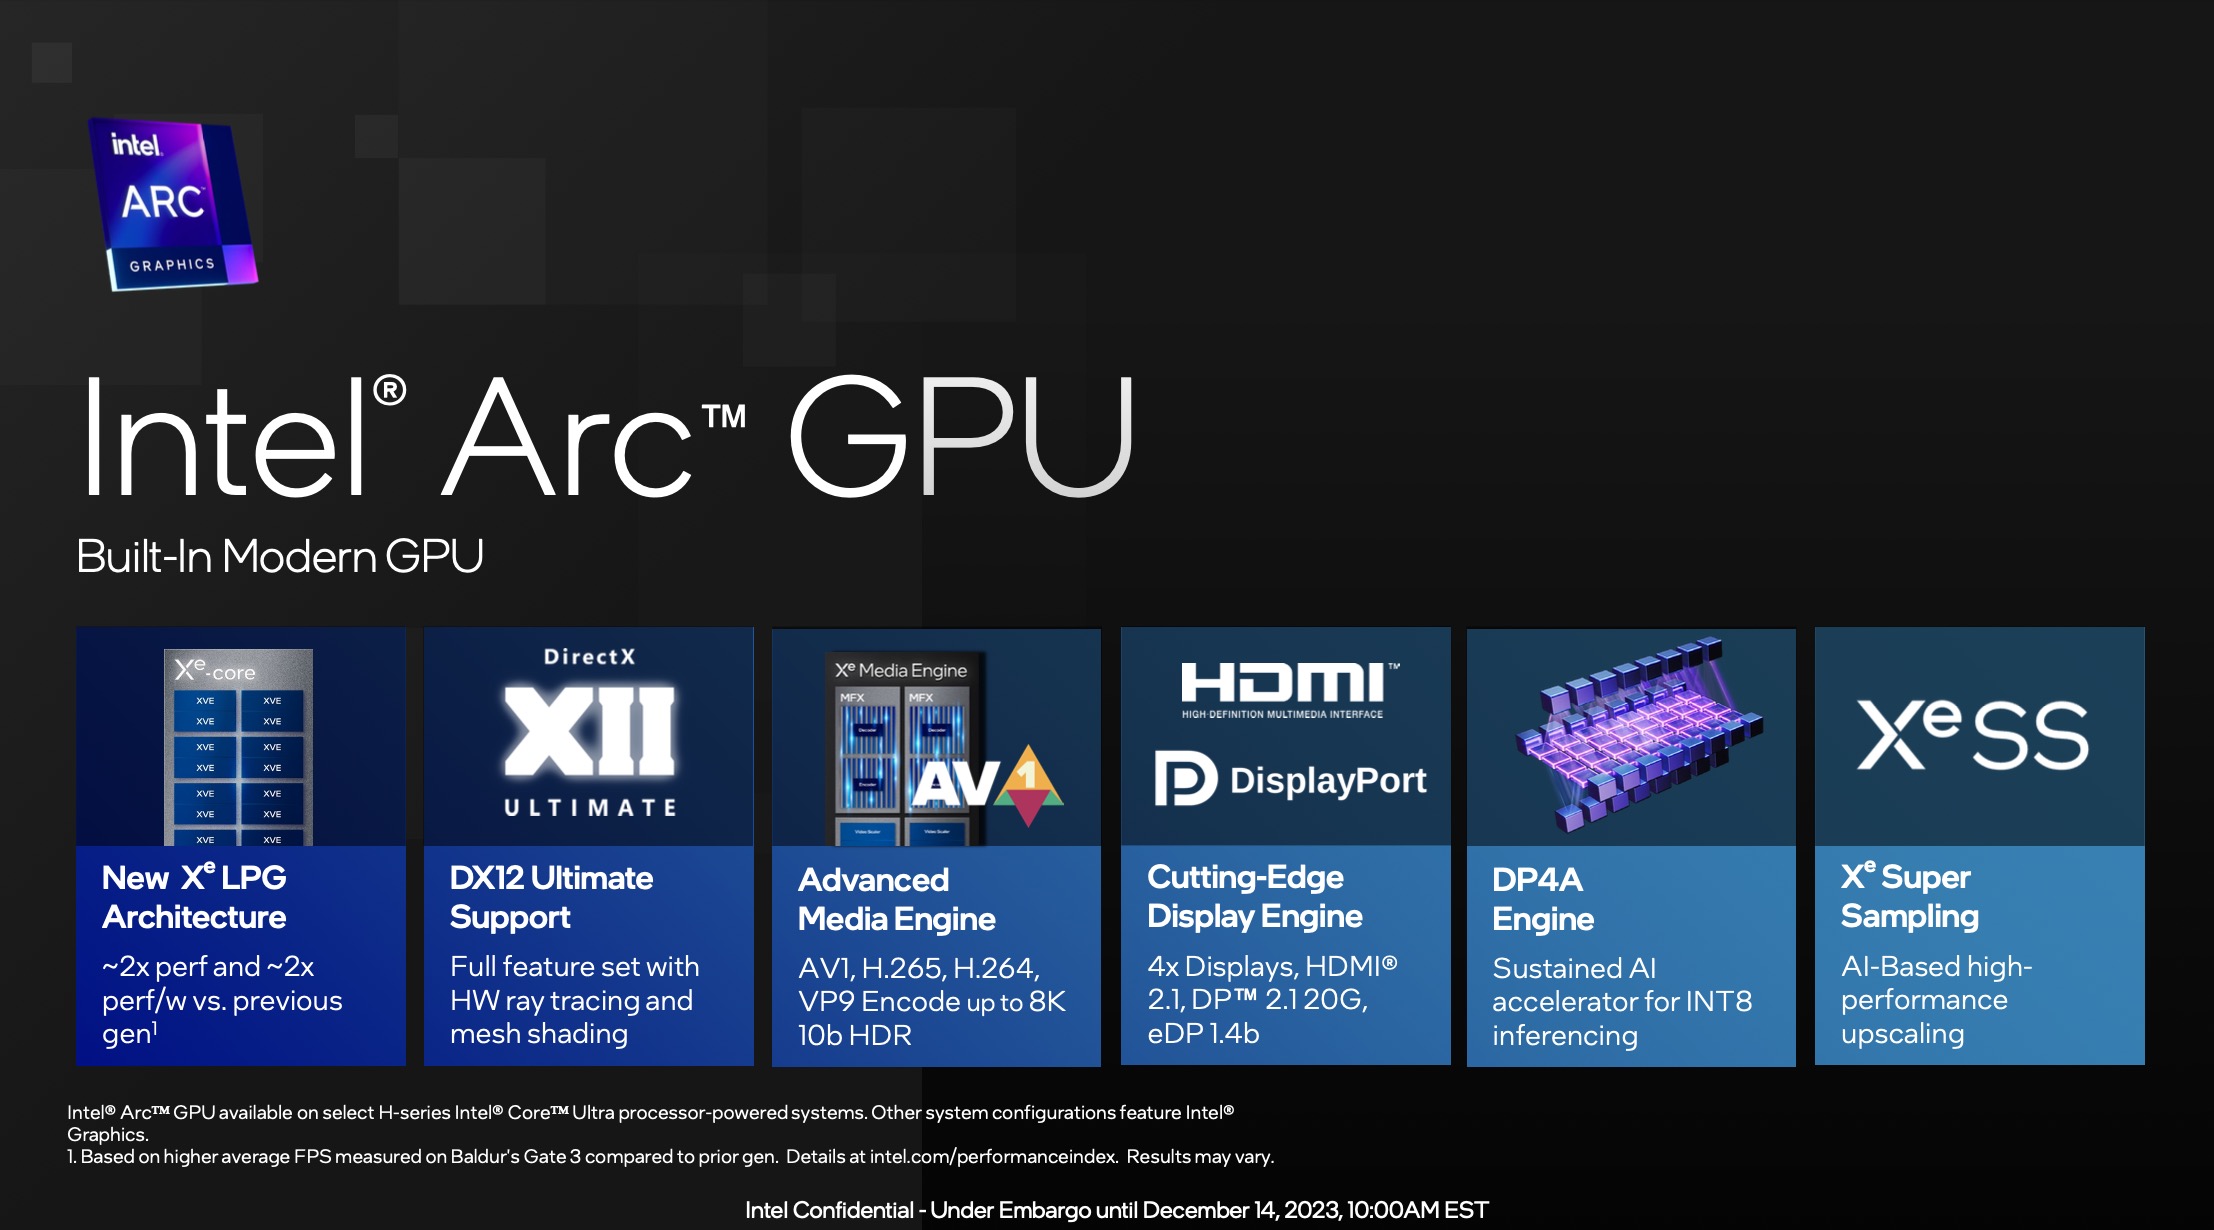
Die Intel Graphics iGPU mit 4 Kernen ist eine integrierte Grafikkarte basierend auf die Xe LPG Architektur (ähnlich zu den dedizierten Arc GPUs, jedoch mit Fokus auf Effizienz). Sie bietet 4 Xe Kerne (64 Xe Vector Engines), 4 Raytracing Einheiten, 4 Sampler und 2 Pixel Backends.

Im Gegensatz zu der stärkeren Variante mit 8 Kernen in den H Meteor Lake CPUs, darf die kleine Variante nicht den Arc Namen nutzen.

Die iGPU unterstützt DirectX 12 Ultimate (wahrscheinlich DX 12_2 wie die Desktop Arc GPUs). Weiters unterstützt die Grafikeinheit XeSS AI Super Sampling.

Die Media Engine ist bei Meteor Lake im SOC Tile und unterstützt bis zu 8k60 10-bit HDR Encode und Deccode von MPEG2, AVC, VP9, HEVC und AV1. Die Display Engine ist ebenfalls im SoC Tile und unterstützt HDMI 2.1 und DisplayPort 2.1 20G mit bis zu 8K60 HDR.

Der GPU Tile des Meteor Lake Chips wird bei TSMC in 5nm (5N Prozess) gefertigt.

Intel HD Graphics 630

► remove from comparison

Die Intel HD Graphics 630 (GT2) ist eine integrierte Grafikeinheit, die in verschiedenen Desktop- und Notebook-Prozessoren der 2016-2017 vorgestellten Kaby-Lake-Generation zu finden ist. Die mittlere, auch "GT2" genannte Ausbaustufe verfügt über 24 EUs (Execution Units bzw. Ausführungseinheiten). Technisch unterscheidet sie sich von der HD Graphics 530 der Skylake Generation nicht, die Taktraten könnten jedoch minimal höher sein und auch der Turbo könnte dank des verbesserten 14nm+ Prozess schneller anspringen.

Performance

Die exakte Leistung der HD Graphics 630 hängt vom jeweiligen CPU-Modell ab, da sich TDP, Maximaltaktrate und Größe des L3-Caches teils stark unterscheiden können. Zum anderen bestimmt auch der verwendete Speicher (DDR3/DDR4) die Performance. Im Durchschnitt sollte die Leistung jedoch nur minimal oberhalb der Intel HD Graphics 530 liegen, wodurch sich anspruchsvolle Spiele aus 2016 wie Watch Dogs 2, Dishonored 2 oder Mafia 3 nicht spielbar sind. Weniger anspruchsvolle Spiele wie Overwatch oder Farming Simulator 17 sind jedoch in niedrigen Details flüssig spielbar. Siehe auch die Seite der Intel HD Graphics 530 für weitere Spielebenchmarks.

Features

Neu bei der Kaby-Lake Generation ist die verbesserte Videoengine, welche nun auch H.265/HEVC im Main10-profil mit 10 Bit Farbtiefe sowie Googles VP9-Codec in Hardware dekodieren kann. Die Chips mit HD Graphics 530 sollten auch bereits HDCP 2.2 unterstützen und somit z.B. Netflix-Videos unter Windows 10 in 4K ausgeben können (im Gegensatz zu den ersten Kaby-Lake Dual-Core Chips mit Intel HD Graphics 620). HDMI 2.0 unterstützt die HD Graphics 630 jedoch weiterhin nur per Wandler (LSPCon) über den DisplayPort.

Leistungsaufnahme

Die HD Graphics 630 ist in Desktop- und Notebook-Prozessoren verschiedener TDP-Klassen zu finden. Die Quad-Core CPUs sind jedoch meistens in größeren und schwereren Notebooks verbaut. Der verbesserte 14nm+ Prozess verspricht jedoch eine etwas geringere Leistungsaufnahme im Vergleich zur Intel HD Graphics 530.

Intel Iris Plus Graphics 640Intel Graphics 4-Cores iGPU (Arc)Intel HD Graphics 630
Gen. 9.5 Serie
Iris Plus Graphics 655 48 @ 0.3 - 1.2 GHz
Iris Plus Graphics 650 48 @ 0.3 - 1.1 GHz64/128 Bit
Iris Plus Graphics 645 48 @ 0.3 - 1.15 GHz
Iris Plus Graphics 640 48 @ 0.3 - 1.05 GHz64/128 Bit
UHD Graphics 630 24 @ 0.3 - 1.15 GHz64/128 Bit
UHD Graphics P630 24 @ 0.3 - 1.2 GHz64/128 Bit
HD Graphics 630 24 @ 0.3 - 1.15 GHz64/128 Bit
HD Graphics P630 24 64/128 Bit
UHD Graphics 620 24 @ 0.3 - 1.15 GHz
HD Graphics 620 24 @ 0.3 - 1.05 GHz64/128 Bit
UHD Graphics 617 24 @ 0.3 - 1.15 GHz64/128 Bit
UHD Graphics 615 24 @ 0.3 - 1 GHz64/128 Bit
HD Graphics 615 24 @ 0.3 - 1.05 GHz64/128 Bit
Arc 8-Core 8 @ 2.3 GHz
Arc 7-Core 7 @ 2.2 GHz
Graphics 4-Core 4 @ 1.95 GHz
Iris Plus Graphics 655 48 @ 0.3 - 1.2 GHz
Iris Plus Graphics 650 48 @ 0.3 - 1.1 GHz64/128 Bit
Iris Plus Graphics 645 48 @ 0.3 - 1.15 GHz
Iris Plus Graphics 640 48 @ 0.3 - 1.05 GHz64/128 Bit
UHD Graphics 630 24 @ 0.3 - 1.15 GHz64/128 Bit
UHD Graphics P630 24 @ 0.3 - 1.2 GHz64/128 Bit
HD Graphics 630 24 @ 0.3 - 1.15 GHz64/128 Bit
HD Graphics P630 24 64/128 Bit
UHD Graphics 620 24 @ 0.3 - 1.15 GHz
HD Graphics 620 24 @ 0.3 - 1.05 GHz64/128 Bit
UHD Graphics 617 24 @ 0.3 - 1.15 GHz64/128 Bit
UHD Graphics 615 24 @ 0.3 - 1 GHz64/128 Bit
HD Graphics 615 24 @ 0.3 - 1.05 GHz64/128 Bit
CodenameKaby Lake GT3eMeteor Lake iGPUKaby-Lake-H-GT2
ArchitekturGen. 9.5 Kaby LakeXe LPGGen. 9.5 Kaby Lake
Pipelines48 - unified4 - unified24 - unified
Kerntakt300 - 1050 (Boost) MHz1950 (Boost) MHz300 - 1150 (Boost) MHz
Speicherbandbreite64/128 Bit64/128 Bit
SpeichertypDDR3/DDR4
Max. Speichergröße64 MB
Shared Memoryjaneinja
APIDirectX 12_1, OpenGL 4.4DirectX 12_2, OpenGL 4.6, Vulkan 1.3DirectX 12_1, OpenGL 4.4
Herstellungsprozess14 nm5 nm14 nm
FeaturesQuickSyncQuickSync
Erscheinungsdatum03.01.2017 14.12.2023 05.08.2015
Raytracing Cores4
CacheL1: 768 KB
DisplaysHDMI 2.1, DisplayPort 2.1 20G
CPU in Iris Plus Graphics 640GPU Base SpeedGPU Boost / Turbo
Intel Core i7-7660U2 x 2500 MHz, 15 W300 MHz1050 MHz
Intel Core i7-7560U2 x 2400 MHz, 15 W300 MHz1050 MHz
Intel Core i5-7360U2 x 2300 MHz, 15 W300 MHz1000 MHz
Intel Core i5-7260U2 x 2200 MHz, 15 W300 MHz950 MHz
min. - max.300 MHz950 - 1050 MHz
CPU in Graphics 4-CoreGPU Base SpeedGPU Boost / Turbo
Intel Core Ultra 7 165U12 x 3800 MHz, 15 W? MHz2000 MHz
Intel Core Ultra 7 155U12 x 3800 MHz, 15 W? MHz1950 MHz
Intel Core Ultra 7 164U12 x 3800 MHz, 9 W? MHz1800 MHz
min. - max.? - 300 MHz950 - 2000 MHz
CPU in HD Graphics 630GPU Base SpeedGPU Boost / Turbo
Intel Core i7-7700K4 x 4200 MHz, 91 W350 MHz1150 MHz
Intel Core i7-77004 x 3600 MHz, 65 W350 MHz1150 MHz
Intel Core i7-7920HQ4 x 3100 MHz, 45 W300 MHz1150 MHz
min. - max.300 - 350 MHz950 - 2000 MHz

Benchmarks

Performance Rating - 3DMark 11 + Fire Strike + Time Spy - Graphics 4-Core
2.4 pt (7%)
Performance Rating - 3DMark 11 + Fire Strike + Time Spy - HD Graphics 630
0.5 pt (1%)
3DMark - 3DMark Time Spy Score
min: 467     avg: 499.8     median: 494.5 (1%)     max: 543 Points
min: 1876     avg: 2079     median: 2070 (6%)     max: 2315 Points
425 Points (1%)
3DMark - 3DMark Time Spy Graphics
min: 413     avg: 442.5     median: 437 (1%)     max: 483 Points
min: 1668     avg: 1860     median: 1839 (5%)     max: 2067 Points
368 Points (1%)
3DMark - 3DMark Ice Storm Unlimited Graphics
min: 142163     avg: 147298     median: 145481 (15%)     max: 154251 Points
295187 Points (30%)
min: 80382     avg: 95125     median: 101178 (10%)     max: 103815 Points
3DMark - 3DMark Ice Storm Extreme Graphics
75102 Points (9%)
min: 53310     avg: 57234     median: 57234 (7%)     max: 61158 Points
3DMark - 3DMark Cloud Gate Score
min: 7558     avg: 8025     median: 8067 (9%)     max: 8711 Points
min: 19423     avg: 21560     median: 21595 (23%)     max: 23325 Points
min: 7160     avg: 8539     median: 9188 (10%)     max: 9449 Points
3DMark - 3DMark Cloud Gate Graphics
min: 10486     avg: 11119     median: 11248 (3%)     max: 11495 Points
min: 23935     avg: 27708     median: 28416.5 (7%)     max: 30198 Points
min: 7943     avg: 9311     median: 9715 (3%)     max: 10163 Points
3DMark - 3DMark Fire Strike Standard Score
min: 1236     avg: 1349     median: 1310 (2%)     max: 1509 Points
min: 3952     avg: 4717     median: 4922 (9%)     max: 5179 Points
min: 346     avg: 892     median: 985 (2%)     max: 1122 Points
3DMark - 3DMark Fire Strike Standard Graphics
min: 1315     avg: 1411     median: 1393.5 (2%)     max: 1541 Points
min: 4284     avg: 5040     median: 5281 (6%)     max: 5498 Points
min: 385     avg: 966     median: 1067 (1%)     max: 1211 Points
3DMark - 3DMark Ice Storm Graphics
89439 Points (10%)
min: 96867     avg: 100772     median: 100772 (12%)     max: 104677 Points
3DMark - 3DMark Wild Life Extreme Unlimited
3681 Points (4%)
3DMark - 3DMark Night Raid
18070 Points (17%)
3DMark - 3DMark Night Raid Graphics Score
21828 Points (8%)
3DMark 11 - 3DM11 Performance Score
min: 2136     avg: 2440     median: 2561 (4%)     max: 2664 Points
min: 6340     avg: 7106     median: 7250.5 (10%)     max: 7589 Points
min: 1782     avg: 1928     median: 1975 (3%)     max: 2034 Points
3DMark 11 - 3DM11 Performance GPU
min: 1980     avg: 2275     median: 2379 (2%)     max: 2493 Points
min: 6007     avg: 6649     median: 6726 (6%)     max: 7107 Points
min: 1574     avg: 1696     median: 1729 (1%)     max: 1783 Points
3DMark Vantage
3DM Vant. Perf. total + Intel HD Graphics 630
3DMark Vantage - 3DM Vant. Perf. total
7685 Points (2%)
3DM Vant. Perf. GPU no PhysX + Intel HD Graphics 630
3DMark Vantage - 3DM Vant. Perf. GPU no PhysX
6208 Points (3%)
3DMark 06 3DMark 06 - Standard 1280x1024 + Intel Iris Plus Graphics 640
3DMark 06
min: 13164     avg: 14118     median: 14117.5 (18%)     max: 15071 Points
3DMark 06 - Standard 1280x1024 + Intel HD Graphics 630
min: 10165     avg: 11775     median: 12419 (16%)     max: 12740 Points
Unigine Valley 1.0 - Unigine Valley 1.0 DX
6.5 fps (2%)
5.3 fps (2%)
Unigine Heaven 3.0 - Unigine Heaven 3.0 DX 11
18.8 fps (6%)
Unigine Heaven 3.0 - Unigine Heaven 3.0 OpenGL
20.7 fps (9%)
Unigine Heaven 2.1 - Heaven 2.1 high
26.6 fps (5%)
SPECviewperf 11
specvp11 snx-01 + Intel HD Graphics 630
SPECviewperf 11 - specvp11 snx-01
2.8 fps (2%)
specvp11 tcvis-02 + Intel HD Graphics 630
SPECviewperf 11 - specvp11 tcvis-02
4.1 fps (2%)
specvp11 sw-02 + Intel HD Graphics 630
SPECviewperf 11 - specvp11 sw-02
21.3 fps (16%)
specvp11 proe-05 + Intel HD Graphics 630
SPECviewperf 11 - specvp11 proe-05
2.9 fps (3%)
specvp11 maya-03 + Intel HD Graphics 630
SPECviewperf 11 - specvp11 maya-03
24.4 fps (18%)
specvp11 lightwave-01 + Intel HD Graphics 630
SPECviewperf 11 - specvp11 lightwave-01
25.6 fps (27%)
specvp11 ensight-04 + Intel HD Graphics 630
SPECviewperf 11 - specvp11 ensight-04
3.7 fps (2%)
Cinebench R10 Cinebench R10 Shading (32bit) + Intel Iris Plus Graphics 640
Cinebench R10 - Cinebench R10 Shading (32bit)
min: 8824     avg: 9678     median: 9703 (7%)     max: 10506 Points
Cinebench R10 Shading (32bit) + Intel HD Graphics 630
min: 10265     avg: 10479     median: 10479 (7%)     max: 10693 Points
Cinebench R11.5 Cinebench R11.5 OpenGL 64 Bit + Intel Iris Plus Graphics 640
Cinebench R11.5 - Cinebench R11.5 OpenGL 64 Bit
46.1 fps (15%)
Cinebench R11.5 OpenGL 64 Bit + Intel HD Graphics 630
min: 45.8     avg: 50.2     median: 49.7 (16%)     max: 55 fps
Cinebench R15
Cinebench R15 OpenGL 64 Bit + Intel Iris Plus Graphics 640
Cinebench R15 - Cinebench R15 OpenGL 64 Bit
min: 41.32     avg: 54     median: 56.2 (3%)     max: 62.3 fps
Cinebench R15 OpenGL 64 Bit + Intel Graphics 4-Cores iGPU (Arc)
min: 92.6     avg: 102.2     median: 103.5 (6%)     max: 112 fps
Cinebench R15 OpenGL 64 Bit + Intel HD Graphics 630
min: 47.2     avg: 52     median: 51.7 (3%)     max: 57.3 fps
Cinebench R15 OpenGL Ref. Match 64 Bit + Intel Iris Plus Graphics 640
Cinebench R15 - Cinebench R15 OpenGL Ref. Match 64 Bit
min: 97.8     avg: 98.2     median: 97.8 (98%)     max: 99.3 %
Cinebench R15 OpenGL Ref. Match 64 Bit + Intel Graphics 4-Cores iGPU (Arc)
Cinebench R15 OpenGL Ref. Match 64 Bit + Intel HD Graphics 630
min: 97.7     avg: 97.8     median: 97.8 (98%)     max: 97.8 %
GFXBench - GFXBench 5.0 4K Aztec Ruins High Tier Offscreen
min: 16.8173     avg: 18.8     median: 18.8 (8%)     max: 20.7 fps
GFXBench - GFXBench 5.0 Aztec Ruins High Tier Offscreen
min: 37.3169     avg: 43.2     median: 43.2 (8%)     max: 49.1 fps
GFXBench - GFXBench 5.0 Aztec Ruins Normal Tier Offscreen
min: 91.8253     avg: 110.7     median: 110.7 (8%)     max: 129.5 fps
GFXBench - GFXBench Car Chase Offscreen
40.7 fps (5%)
min: 75.6254     avg: 82.6     median: 82.6 (9%)     max: 89.5 fps
31.8 fps (4%)
GFXBench 3.1 - GFXBench Manhattan ES 3.1 Offscreen
56.1 fps (1%)
min: 117.479     avg: 139.7     median: 139.7 (3%)     max: 161.9 fps
47.2 fps (1%)
GFXBench 3.0 - GFXBench 3.0 Manhattan Offscreen
31.2 fps (2%)
min: 173.822     avg: 215.2     median: 215.2 (13%)     max: 256.6 fps
47.2 fps (3%)
GFXBench (DX / GLBenchmark) 2.7
GFXBench T-Rex HD Offscreen C24Z16 + Intel Iris Plus Graphics 640
GFXBench (DX / GLBenchmark) 2.7 - GFXBench T-Rex HD Offscreen C24Z16
171 fps (1%)
GFXBench T-Rex HD Offscreen C24Z16 + Intel Graphics 4-Cores iGPU (Arc)
min: 370.774     avg: 418.6     median: 418.6 (3%)     max: 466.5 fps
GFXBench T-Rex HD Offscreen C24Z16 + Intel HD Graphics 630
139.8 fps (1%)
Basemark GPU 1.2 - Basemark GPU 1.2 Vulkan Official Medium Offscreen 1080
min: 104.6     avg: 142.4     median: 104.6 (1%)     max: 315 fps
Basemark GPU 1.2 - Basemark GPU 1.2 Vulkan Official High Offscreen 2160
3.6 fps (1%)
Geekbench 6.2 - Geekbench 6.2 GPU OpenCL
min: 12919     avg: 16272     median: 16496 (5%)     max: 17837 Points
Geekbench 6.2 - Geekbench 6.2 GPU Vulkan
min: 12449     avg: 17647     median: 18118 (5%)     max: 19667 Points
LuxMark v2.0 64Bit - LuxMark v2.0 Room GPU
min: 315     avg: 325     median: 325 (1%)     max: 335 Samples/s
min: 209     avg: 268.5     median: 268.5 (1%)     max: 328 Samples/s
LuxMark v2.0 64Bit - LuxMark v2.0 Sala GPU
min: 748     avg: 779     median: 778.5 (1%)     max: 809 Samples/s
min: 600     avg: 647     median: 647 (1%)     max: 694 Samples/s
ComputeMark v2.1 - ComputeMark v2.1 Result
min: 1575     avg: 1677     median: 1677 (2%)     max: 1779 Points
min: 921     avg: 950     median: 962 (1%)     max: 967 Points
Power Consumption - Furmark Stress Test Power Consumption - external Monitor *
min: 30.8     avg: 33.6     median: 31.5 (4%)     max: 38.5 Watt
min: 25.3     avg: 29.7     median: 29.7 (4%)     max: 38 Watt
Power Consumption - The Witcher 3 Power Consumption - external Monitor *
min: 28     avg: 33.5     median: 33.5 (5%)     max: 38.9 Watt
min: 24.4     avg: 27.7     median: 26.8 (4%)     max: 32.2 Watt
min: 28     avg: 41.6     median: 41.6 (6%)     max: 55.1 Watt
Power Consumption - Witcher 3 Power Consumption *
min: 31.7     avg: 34.9     median: 34.9 (8%)     max: 38.1 Watt
min: 27.4     avg: 32.3     median: 30.7 (7%)     max: 41.5 Watt
Power Consumption - Witcher 3 ultra Power Efficiency
min: 0.4313     avg: 0.5     median: 0.5 (43%)     max: 0.544 fps per Watt
Power Consumption - Witcher 3 ultra Power Efficiency - external Monitor
0.1 fps per Watt (9%)
min: 0.4877     avg: 0.5     median: 0.5 (45%)     max: 0.603 fps per Watt
Power Consumption - Cyberpunk 2077 Power Consumption 150cd *
min: 37     avg: 38.3     median: 37.8 (12%)     max: 40.5 Watt
Power Consumption - Cyberpunk 2077 Power Consumption - external Monitor *
min: 31.8     avg: 37     median: 37.4 (5%)     max: 41.4 Watt
Power Consumption - Cyberpunk 2077 ultra Power Efficiency
0.4 fps per Watt (52%)
Emissions Witcher 3 Fan Noise + Intel Iris Plus Graphics 640
Emissions - Witcher 3 Fan Noise
33.4 dB(A) (53%)
Witcher 3 Fan Noise + Intel Graphics 4-Cores iGPU (Arc)
min: 27.3     avg: 37.3     median: 37 (59%)     max: 44.9 dB(A)
Witcher 3 Fan Noise + Intel HD Graphics 630
33.3 dB(A) (53%)
Clock Speed - GPU Clock Witcher 3 ultra
min: 748     avg: 823     median: 823 (32%)     max: 898 MHz
Clock Speed - GPU Clock Speed Furmark
min: 570     avg: 634     median: 634 (25%)     max: 698 MHz

Average Benchmarks Intel Iris Plus Graphics 640 → 100% n=15

Average Benchmarks Intel Graphics 4-Cores iGPU (Arc) → 304% n=15

Average Benchmarks Intel HD Graphics 630 → 89% n=15

- Bereich der Benchmarkergebnisse für diese Grafikkarte
- Durchschnittliche Benchmarkergebnisse für diese Grafikkarte
* Smaller numbers mean a higher performance
1 This benchmark is not used for the average calculation

Spiele-Benchmarks

Die folgenden Benchmarks basieren auf unseren Spieletests mit Testnotebooks. Die Performance dieser Grafikkarte bei den gelisteten Spielen ist abhängig von der verwendeten CPU, Speicherausstattung, Treiber und auch Betriebssystem. Dadurch müssen die untenstehenden Werte nicht repräsentativ sein. Detaillierte Informationen über das verwendete System sehen Sie nach einem Klick auf den fps-Wert.

F1 24

F1 24

2024
low 1920x1080
Graphics 4-Core:
36.3 39.2 ~ 38 fps
med. 1920x1080
Graphics 4-Core:
31.2 33.8 ~ 33 fps
low 1920x1080
Graphics 4-Core:
17.2 17.6 17.8 18.5 18.9 19.3 19.5 20.2 20.3 20.9 21.6 ~ 19 fps
med. 1920x1080
Graphics 4-Core:
13.8 14.2 15 15.1 15.3 15.9 16.1 16.5 16.7 16.9 17.6 ~ 16 fps
high 1920x1080
Graphics 4-Core:
11.9 11.9 12.4 12.8 12.8 13 13.7 13.7 14.3 14.4 14.9 ~ 13 fps
ultra 1920x1080
Graphics 4-Core:
10.3 10.6 11.1 11.2 11.3 11.7 12 12.2 12.5 12.7 13 ~ 12 fps
low 1920x1080
Graphics 4-Core:
14.7 15 15.4 16.2 16.4 17.7 17.8 18.6 18.8 ~ 17 fps
med. 1920x1080
Graphics 4-Core:
12.3 12.4 12.6 12.8 13.4 14.2 14.5 15.5 ~ 13 fps
high 1920x1080
Graphics 4-Core:
10.6 11 11 12 12.2 13.2 ~ 12 fps
ultra 1920x1080
Graphics 4-Core:
10.5 10.6 11.5 11.9 12.1 ~ 11 fps
F1 23

F1 23

2023
low 1920x1080
Graphics 4-Core:
40.1 43.8 ~ 42 fps
med. 1920x1080
Graphics 4-Core:
37.3 39.8 ~ 39 fps
high 1920x1080
Graphics 4-Core:
23.9 26 ~ 25 fps
ultra 1920x1080
Graphics 4-Core:
7.1  fps
F1 22

F1 22

2022
low 1920x1080
Graphics 4-Core:
39.9 41.7 43.3 43.8 44.4 46.3 46.6 ~ 44 fps
med. 1920x1080
Graphics 4-Core:
34.1 35.9 39.7 40.5 41.9 42 42 ~ 39 fps
high 1920x1080
Graphics 4-Core:
25 29.5 30.8 31 ~ 29 fps
ultra 1920x1080
Graphics 4-Core:
7 7.6 8 ~ 8 fps
low 1920x1080
Graphics 4-Core:
24.1 27.2 27.6 29.9 30.2 30.8 ~ 28 fps
med. 1920x1080
Graphics 4-Core:
21.1 22.9 22.9 24 24.2 ~ 23 fps
high 1920x1080
Graphics 4-Core:
14.1 16.1 16.1 16.3 16.8 ~ 16 fps
ultra 1920x1080
Graphics 4-Core:
11.3 12.3 12.7 13.6 13.8 ~ 13 fps
low 1280x720
HD Graphics 630:
28.9  fps
med. 1920x1080
HD Graphics 630:
10  fps
low 1280x720
HD Graphics 630:
13.3  fps
med. 1920x1080
HD Graphics 630:
5.5  fps
med. 1920x1080
HD Graphics 630:
7.3  fps
low 1280x720
HD Graphics 630:
14.1  fps
med. 1920x1080
HD Graphics 630:
7.1  fps
GRID 2019

GRID 2019

2019
low 1280x720
HD Graphics 630:
31.4  fps
med. 1920x1080
HD Graphics 630:
12.1  fps
low 1280x720
HD Graphics 630:
11  fps
FIFA 20

FIFA 20

2019
low 1280x720
HD Graphics 630:
53.5  fps
med. 1920x1080
HD Graphics 630:
25.4  fps
high 1920x1080
HD Graphics 630:
21.5  fps
low 1280x720
HD Graphics 630:
14.2  fps
med. 1920x1080
HD Graphics 630:
5.6  fps
Control

Control

2019
low 1280x720
HD Graphics 630:
13.5 15.8 ~ 15 fps
med. 1920x1080
HD Graphics 630:
4.4 5 ~ 5 fps
F1 2019

F1 2019

2019
low 1280x720
HD Graphics 630:
35  fps
med. 1920x1080
HD Graphics 630:
13.4  fps
high 1920x1080
HD Graphics 630:
12.2  fps
ultra 1920x1080
HD Graphics 630:
86  fps
QHD 2560x1440
HD Graphics 630:
64  fps
4K 3840x2160
HD Graphics 630:
34.5  fps
low 1280x720
HD Graphics 630:
38.2  fps
med. 1920x1080
HD Graphics 630:
11.2  fps
high 1920x1080
HD Graphics 630:
6.4  fps
Rage 2

Rage 2

2019
low 1280x720
HD Graphics 630:
6.8  fps
Anno 1800

Anno 1800

2019
low 1280x720
HD Graphics 630:
16.2  fps
med. 1920x1080
HD Graphics 630:
5  fps
low 1280x720
HD Graphics 630:
15  fps
med. 1920x1080
HD Graphics 630:
6  fps
low 1280x720
HD Graphics 630:
35  fps
med. 1920x1080
HD Graphics 630:
12.8  fps
high 1920x1080
HD Graphics 630:
10.3  fps
Anthem

Anthem

2019
low 1280x720
HD Graphics 630:
9.2  fps
med. 1920x1080
HD Graphics 630:
4.8  fps
low 1280x720
HD Graphics 630:
12  fps
med. 1920x1080
HD Graphics 630:
5  fps
low 1280x720
HD Graphics 630:
13.9  fps
med. 1920x1080
HD Graphics 630:
6.8  fps
low 1280x720
HD Graphics 630:
22.8 26.2 ~ 25 fps
med. 1920x1080
HD Graphics 630:
8.9 10.1 ~ 10 fps
high 1920x1080
HD Graphics 630:
8.3  fps
low 1280x720
HD Graphics 630:
14.6  fps
med. 1920x1080
HD Graphics 630:
8.4  fps
low 1280x720
HD Graphics 630:
14.9  fps
low 1280x720
HD Graphics 630:
59.2  fps
med. 1920x1080
HD Graphics 630:
21.3  fps
high 1920x1080
HD Graphics 630:
10.7  fps
ultra 1920x1080
HD Graphics 630:
6.8  fps
low 1280x720
HD Graphics 630:
15.3  fps
med. 1920x1080
HD Graphics 630:
6.9  fps
Hitman 2

Hitman 2

2018
low 1280x720
HD Graphics 630:
11.2  fps
med. 1920x1080
HD Graphics 630:
6.9  fps
low 1280x720
HD Graphics 630:
9  fps
med. 1920x1080
HD Graphics 630:
5  fps
FIFA 19

FIFA 19

2018
low 1280x720
HD Graphics 630:
36.2  fps
med. 1920x1080
HD Graphics 630:
20.1  fps
high 1920x1080
HD Graphics 630:
14.6  fps
low 1280x720
HD Graphics 630:
14  fps
med. 1920x1080
HD Graphics 630:
5  fps
Strange Brigade

Strange Brigade

2018
low 1280x720
Graphics 4-Core:
73.7 85.6 111.2 115 118.1 118.4 120.4 121.1 123 ~ 110 fps
med. 1920x1080
Graphics 4-Core:
32.9 41 47 49.1 49.7 50 50 50.8 52.1 ~ 47 fps
high 1920x1080
Graphics 4-Core:
26.6 33.1 34.7 37.7 39.2 39.6 39.8 40 41.9 ~ 37 fps
ultra 1920x1080
Graphics 4-Core:
22.9 25.1 25.9 28.4 29.9 30.2 30.3 32 33.3 ~ 29 fps
F1 2018

F1 2018

2018
low 1280x720
HD Graphics 630:
26  fps
med. 1920x1080
HD Graphics 630:
12  fps
low 1280x720
HD Graphics 630:
13.3  fps
med. 1920x1080
HD Graphics 630:
5.6  fps
low 1280x720
HD Graphics 630:
17.5 22.7 ~ 20 fps
med. 1920x1080
HD Graphics 630:
7.1  fps
Far Cry 5

Far Cry 5

2018
low 1280x720
Graphics 4-Core:
33 38 38 41 45 46 47 48 48 51 ~ 44 fps
HD Graphics 630:
13  fps
med. 1920x1080
Graphics 4-Core:
20 20 23 24 24 25 25 25 28 28 ~ 24 fps
HD Graphics 630:
6  fps
high 1920x1080
Graphics 4-Core:
19 19 21 22 23 23 24 25 25 26 ~ 23 fps
ultra 1920x1080
Graphics 4-Core:
18 18 18 21 21 21 22 22 23 23 ~ 21 fps
World of Tanks enCore

World of Tanks enCore

2018
low 1366x768
HD Graphics 630:
188  fps
med. 1920x1080
HD Graphics 630:
25.5  fps
ultra 1920x1080
HD Graphics 630:
9.6  fps
4K 3840x2160
HD Graphics 630:
2.8  fps
low 1280x720
Graphics 4-Core:
33.8 34.7 35 35.6 35.7 36.2 36.5 36.8 37.6 37.6 37.8 40 ~ 36 fps
HD Graphics 630:
31.3  fps
med. 1920x1080
Graphics 4-Core:
25.9 27.3 28 28.2 28.2 28.3 28.4 28.9 29.7 30.1 30.3 31.4 ~ 29 fps
HD Graphics 630:
19.6  fps
high 1920x1080
Graphics 4-Core:
22.8 23.2 23.3 23.4 23.4 23.6 23.6 24.1 24.8 25.3 25.4 26 ~ 24 fps
HD Graphics 630:
17.5  fps
4K 3840x2160
HD Graphics 630:
7.1  fps
low 1280x720
HD Graphics 630:
15.2  fps
med. 1920x1080
HD Graphics 630:
5.8  fps
low 1280x720
Graphics 4-Core:
35.4 35.7 36.2 36.9 37.4 37.6 38.5 42.3 42.7 48.1 48.2 48.6 ~ 41 fps
HD Graphics 630:
8.3 11.2 ~ 10 fps
med. 1920x1080
Graphics 4-Core:
19.5 19.7 20.8 22 23 23.4 23.6 24.1 24.2 24.3 25.9 26 ~ 23 fps
HD Graphics 630:
4.3  fps
high 1920x1080
Graphics 4-Core:
14.6 14.7 15.7 16.3 16.3 16.7 17.3 17.4 17.5 18.2 18.2 19.1 ~ 17 fps
Fortnite

Fortnite

2018
low 1280x720
HD Graphics 630:
68  fps
med. 1920x1080
HD Graphics 630:
24.2  fps
low 1280x720
HD Graphics 630:
25.8  fps
med. 1920x1080
HD Graphics 630:
9.3  fps
low 1280x720
HD Graphics 630:
19.9  fps
med. 1920x1080
HD Graphics 630:
9.5  fps
low 1280x720
HD Graphics 630:
30.7  fps
med. 1920x1080
HD Graphics 630:
18.4  fps
low 1280x720
HD Graphics 630:
10  fps
med. 1920x1080
HD Graphics 630:
7  fps
Destiny 2

Destiny 2

2017
low 1280x720
HD Graphics 630:
21.2  fps
med. 1920x1080
HD Graphics 630:
11.1  fps
high 1920x1080
HD Graphics 630:
9.9  fps
ELEX

ELEX

2017
low 1280x720
HD Graphics 630:
14  fps
med. 1920x1080
HD Graphics 630:
7  fps
low 1280x720
100%
Iris Plus Graphics 640:
13.8  fps
90%
HD Graphics 630:
12.4  fps
med. 1920x1080
HD Graphics 630:
6.7  fps
high 1920x1080
HD Graphics 630:
6  fps
low 1280x720
100%
Iris Plus Graphics 640:
28  fps
50%
HD Graphics 630:
14  fps
med. 1920x1080
HD Graphics 630:
12  fps
high 1920x1080
HD Graphics 630:
9  fps
FIFA 18

FIFA 18

2017
low 1280x720
100%
Iris Plus Graphics 640:
69.5 (!)  fps
99%
HD Graphics 630:
69  fps
med. 1920x1080
100%
Iris Plus Graphics 640:
38.8 (!)  fps
97%
HD Graphics 630:
37.7  fps
low 1280x720
HD Graphics 630:
15.7  fps
F1 2017

F1 2017

2017
low 1280x720
100%
Iris Plus Graphics 640:
33 38 ~ 36 fps
92%
HD Graphics 630:
32 33 ~ 33 fps
med. 1920x1080
100%
Iris Plus Graphics 640:
15 15 ~ 15 fps
87%
HD Graphics 630:
13  fps
high 1920x1080
HD Graphics 630:
13  fps
low 1280x720
100%
Iris Plus Graphics 640:
22.9  fps
med. 1366x768
100%
Iris Plus Graphics 640:
99  fps
100%
HD Graphics 630:
99  fps
high 1920x1080
100%
Iris Plus Graphics 640:
48  fps
200%
HD Graphics 630:
96  fps
ultra 1920x1080
100%
Iris Plus Graphics 640:
31.8  fps
93%
HD Graphics 630:
29.5 (!)  fps
4K 3820x2160
HD Graphics 630:
8.2  fps
Dirt 4

Dirt 4

2017
low 1280x720
HD Graphics 630:
44.2  fps
med. 1920x1080
100%
Iris Plus Graphics 640:
27.5 (!)  fps
48%
HD Graphics 630:
13.1  fps
low 1280x720
100%
Iris Plus Graphics 640:
69.3 96 101 103 ~ 92 fps
95%
HD Graphics 630:
87.1  fps
med. 1920x1080
100%
Iris Plus Graphics 640:
33.9 35.8 42.6 48.2 ~ 40 fps
85%
HD Graphics 630:
33.8  fps
high 1920x1080
100%
Iris Plus Graphics 640:
24.9 25.3 29.3 33.6 ~ 28 fps
78%
HD Graphics 630:
21.9  fps
4K 3840x2160
HD Graphics 630:
6.4  fps
Prey

Prey

2017
low 1280x720
100%
Iris Plus Graphics 640:
39.9 45.4 ~ 43 fps
73%
HD Graphics 630:
31.6  fps
med. 1920x1080
100%
Iris Plus Graphics 640:
17.9 18.1 ~ 18 fps
70%
HD Graphics 630:
12.6  fps
high 1920x1080
100%
Iris Plus Graphics 640:
14.8  fps
low 1280x720
100%
Iris Plus Graphics 640:
33.8  fps
low 1280x720
100%
Iris Plus Graphics 640:
20.4  fps
89%
HD Graphics 630:
18.1  fps
low 1280x720
100%
Iris Plus Graphics 640:
16 16.6 ~ 16 fps
92%
HD Graphics 630:
14.7  fps
med. 1920x1080
HD Graphics 630:
6.7  fps
For Honor

For Honor

2017
low 1280x720
100%
Iris Plus Graphics 640:
30.8 33.5 ~ 32 fps
83%
HD Graphics 630:
26.7  fps
med. 1920x1080
100%
Iris Plus Graphics 640:
11.8 12.7 ~ 12 fps
86%
HD Graphics 630:
10.3  fps
low 1280x720
HD Graphics 630:
34  fps
med. 1920x1080
HD Graphics 630:
14.9  fps
low 1280x720
HD Graphics 630:
17.3  fps
low 1280x720
HD Graphics 630:
16.3  fps
low 1280x720
HD Graphics 630:
24.1  fps
low 1280x720
100%
Iris Plus Graphics 640:
42.9 45 ~ 44 fps
100%
HD Graphics 630:
44  fps
med. 1366x768
100%
Iris Plus Graphics 640:
31.4  fps
108%
HD Graphics 630:
33.9  fps
high 1920x1080
100%
Iris Plus Graphics 640:
22.9  fps
53%
HD Graphics 630:
12.1  fps
low 1280x720
100%
Iris Plus Graphics 640:
121  fps
88%
HD Graphics 630:
106  fps
med. 1366x768
100%
Iris Plus Graphics 640:
91  fps
71%
HD Graphics 630:
65  fps
high 1920x1080
100%
Iris Plus Graphics 640:
31.6  fps
75%
HD Graphics 630:
23.6  fps
ultra 1920x1080
100%
Iris Plus Graphics 640:
17.8  fps
73%
HD Graphics 630:
13  fps
low 1280x720
100%
Iris Plus Graphics 640:
26.6 29.2 38.6 ~ 31 fps
109%
HD Graphics 630:
33.8  fps
med. 1366x768
100%
Iris Plus Graphics 640:
19.6 24.2 ~ 22 fps
89%
HD Graphics 630:
19.6  fps
high 1920x1080
100%
Iris Plus Graphics 640:
9.2 11.1 ~ 10 fps
low 1024x768
HD Graphics 630:
41.1 42 ~ 42 fps
med. 1366x768
HD Graphics 630:
15.5 16 ~ 16 fps
Mafia 3

Mafia 3

2016
low 1280x720
HD Graphics 630:
0 (!)  fps
FIFA 17

FIFA 17

2016
low 1280x720
HD Graphics 630:
72  fps
med. 1366x768
HD Graphics 630:
56.6  fps
high 1920x1080
HD Graphics 630:
30.1  fps
ultra 1920x1080
HD Graphics 630:
28.5  fps
low 1280x720
100%
Iris Plus Graphics 640:
20.2  fps
89%
HD Graphics 630:
17.9  fps
low 1280x720
HD Graphics 630:
27.4  fps
med. 1366x768
HD Graphics 630:
15.9  fps
Overwatch

Overwatch

2016
low 1280x720
100%
Iris Plus Graphics 640:
53.6 56.1 63.3 67.3 ~ 60 fps
97%
HD Graphics 630:
58.3  fps
med. 1366x768
100%
Iris Plus Graphics 640:
24.1 36.5 41 52.9 ~ 39 fps
103%
HD Graphics 630:
40.2  fps
high 1920x1080
100%
Iris Plus Graphics 640:
15.9 29.9 36.5 ~ 27 fps
65%
HD Graphics 630:
17.5  fps
ultra 1920x1080
100%
Iris Plus Graphics 640:
19.5  fps
Doom

Doom

2016
low 1280x720
HD Graphics 630:
23.9  fps
med. 1366x768
HD Graphics 630:
19.9  fps
low 1280x768
HD Graphics 630:
10 11.9 ~ 11 fps
med. 1920x1080
HD Graphics 630:
6.7  fps
low 1280x720
HD Graphics 630:
16  fps
low 1280x720
100%
Iris Plus Graphics 640:
24.9  fps
98%
HD Graphics 630:
24.4  fps
med. 1366x768
HD Graphics 630:
14.6  fps
low 1280x720
100%
Iris Plus Graphics 640:
28  fps
68%
HD Graphics 630:
19  fps
med. 1920x1080
100%
Iris Plus Graphics 640:
13  fps
XCOM 2

XCOM 2

2016
low 1280x720
HD Graphics 630:
19.2  fps
med. 1920x1080
HD Graphics 630:
7.4  fps
low 1024x768
100%
Iris Plus Graphics 640:
23.5 25.8 ~ 25 fps
94%
HD Graphics 630:
23.6  fps
med. 1366x768
100%
Iris Plus Graphics 640:
16.7 19.4 ~ 18 fps
81%
HD Graphics 630:
14.5  fps
high 1920x1080
100%
Iris Plus Graphics 640:
9.1  fps
low 1024x768
100%
Iris Plus Graphics 640:
45.4 (!) 50.5 59.2 ~ 52 fps
77%
HD Graphics 630:
39.9  fps
med. 1366x768
100%
Iris Plus Graphics 640:
29 30.7 (!) 32.9 ~ 31 fps
80%
HD Graphics 630:
24.8  fps
high 1920x1080
100%
Iris Plus Graphics 640:
16.4 16.6 (!) 18.7 ~ 17 fps
95%
HD Graphics 630:
16.1  fps
ultra 1920x1080
100%
Iris Plus Graphics 640:
14.2  fps
low 1024x768
HD Graphics 630:
24.7  fps
med. 1366x768
HD Graphics 630:
21.7  fps
low 1024x768
100%
Iris Plus Graphics 640:
44.7  fps
77%
HD Graphics 630:
34.3  fps
med. 1366x768
100%
Iris Plus Graphics 640:
26.2  fps
74%
HD Graphics 630:
19.5  fps
high 1920x1080
100%
Iris Plus Graphics 640:
12.9  fps
Fallout 4

Fallout 4

2015
low 1280x720
HD Graphics 630:
21.8  fps
Anno 2205

Anno 2205

2015
low 1024x768
HD Graphics 630:
36.6  fps
med. 1366x768
HD Graphics 630:
21  fps
high 1920x1080
HD Graphics 630:
8.5  fps
low 1366x768
HD Graphics 630:
68.1 92.9 ~ 81 fps
med. 1366x768
HD Graphics 630:
45 58.8 ~ 52 fps
high 1920x1080
HD Graphics 630:
22.2 26.9 ~ 25 fps
low 1024x768
HD Graphics 630:
57  fps
med. 1366x768
HD Graphics 630:
37  fps
high 1920x1080
HD Graphics 630:
14.4  fps
Mad Max

Mad Max

2015
med. 1366x768
HD Graphics 630:
25.2  fps
high 1920x1080
HD Graphics 630:
11.1  fps
low 1280x720
100%
Iris Plus Graphics 640:
68 92 ~ 80 fps
113%
Graphics 4-Core:
74.1 82.6 85 89.9 90.4 91.4 91.8 92.5 92.8 92.9 93.8 101.9 ~ 90 fps
150%
HD Graphics 630:
120  fps
med. 1366x768
100%
Iris Plus Graphics 640:
55 63.7 ~ 59 fps
100%
Graphics 4-Core:
43.7 52.2 52.4 53.9 54.3 57.7 58.9 59.7 60.7 69 72.2 72.7 ~ 59 fps
117%
HD Graphics 630:
69  fps
high 1920x1080
100%
Iris Plus Graphics 640:
27.6 29.5 ~ 29 fps
200%
Graphics 4-Core:
48.4 50.7 51.4 52.8 57.2 60.4 61 61.1 61.6 61.6 61.6 62.2 ~ 58 fps
90%
HD Graphics 630:
26.1  fps
ultra 1920x1080
100%
Iris Plus Graphics 640:
19.8 23 ~ 21 fps
257%
Graphics 4-Core:
45.5 48 48 50 54 54.2 56 56.6 56.9 57.3 57.6 58.3 ~ 54 fps
106%
HD Graphics 630:
22.2  fps
low 1024x768
100%
Iris Plus Graphics 640:
16.4 17.5 21 21.7 ~ 19 fps
453%
Graphics 4-Core:
66.5 79.6 86.8 88.3 91 92.1 92.1 92.9 ~ 86 fps
89%
HD Graphics 630:
17  fps
med. 1366x768
100%
Iris Plus Graphics 640:
13.4  fps
396%
Graphics 4-Core:
41.3 49.6 51.1 52.2 56.2 57 57 57 ~ 53 fps
high 1920x1080
Graphics 4-Core:
21.4 28 28.4 28.5 31 32.4 32.4 33.3 ~ 29 fps
ultra 1920x1080
100%
Iris Plus Graphics 640:
4  fps
400%
Graphics 4-Core:
11.9 14.9 15 15.5 16.3 17.6 17.9 17.9 ~ 16 fps
low 1024x768
HD Graphics 630:
178.9  fps
med. 1366x768
HD Graphics 630:
38.3  fps
high 1920x1080
HD Graphics 630:
16.1  fps
GTA V

GTA V

2015
low 1024x768
100%
Iris Plus Graphics 640:
56.7  fps
213%
Graphics 4-Core:
103.9 109.9 114.3 135.5 139.1 ~ 121 fps
87%
HD Graphics 630:
49.6  fps
med. 1366x768
100%
Iris Plus Graphics 640:
28.9  fps
370%
Graphics 4-Core:
91.1 95.7 109 115.9 123.9 ~ 107 fps
119%
HD Graphics 630:
34.3  fps
high 1920x1080
100%
Iris Plus Graphics 640:
11.8  fps
169%
Graphics 4-Core:
17 17.6 21.4 21.6 21.9 ~ 20 fps
72%
HD Graphics 630:
8.5  fps
ultra 1920x1080
Graphics 4-Core:
6.9 7.6 8.8 8.9 9 ~ 8 fps
low 1024x768
HD Graphics 630:
40.1  fps
med. 1366x768
HD Graphics 630:
25.5  fps
high 1920x1080
HD Graphics 630:
8.7  fps
F1 2014

F1 2014

2014
low 1024x768
HD Graphics 630:
101  fps
med. 1366x768
HD Graphics 630:
70  fps
high 1920x1080
HD Graphics 630:
42  fps
ultra 1920x1080
HD Graphics 630:
23  fps
low 1280x720
HD Graphics 630:
37.7  fps
med. 1344x756
HD Graphics 630:
23.9  fps
high 1920x1080
HD Graphics 630:
12.6  fps
Sims 4

Sims 4

2014
low 1024x768
HD Graphics 630:
186.3  fps
med. 1366x768
HD Graphics 630:
57.1  fps
high 1920x1080
100%
Iris Plus Graphics 640:
28.6  fps
95%
HD Graphics 630:
27.2  fps
ultra 1920x1080
100%
Iris Plus Graphics 640:
20.2 20.8 ~ 21 fps
low 1024x768
100%
Iris Plus Graphics 640:
43.1 60.3 ~ 52 fps
med. 1366x768
100%
Iris Plus Graphics 640:
29.7 42 ~ 36 fps
high 1366x768
100%
Iris Plus Graphics 640:
23.2 30.7 ~ 27 fps
ultra 1920x1080
100%
Iris Plus Graphics 640:
8.2 9.9 ~ 9 fps
low 1024x768
HD Graphics 630:
58  fps
med. 1366x768
HD Graphics 630:
41.1  fps
high 1366x768
HD Graphics 630:
32.2  fps
ultra 1920x1080
HD Graphics 630:
4.5  fps
low 1280x720
100%
Iris Plus Graphics 640:
61 68.2 ~ 65 fps
102%
HD Graphics 630:
52 61.7 73 79 ~ 66 fps
med. 1366x768
100%
Iris Plus Graphics 640:
40.2 45.1 ~ 43 fps
81%
HD Graphics 630:
30.4 35 35 37.9 ~ 35 fps
high 1366x768
100%
Iris Plus Graphics 640:
33.5 38.3 ~ 36 fps
78%
HD Graphics 630:
23 26 30 31.5 ~ 28 fps
ultra 1920x1080
100%
Iris Plus Graphics 640:
10.7 12.5 ~ 12 fps
75%
HD Graphics 630:
8 8.6 9.7 ~ 9 fps
low 1024x768
100%
Iris Plus Graphics 640:
103 132.6 ~ 118 fps
84%
HD Graphics 630:
99  fps
med. 1366x768
100%
Iris Plus Graphics 640:
54.1 68.7 ~ 61 fps
79%
HD Graphics 630:
48  fps
high 1366x768
100%
Iris Plus Graphics 640:
37 47.1 ~ 42 fps
71%
HD Graphics 630:
29.8  fps
ultra 1920x1080
100%
Iris Plus Graphics 640:
17.2 21.6 ~ 19 fps
low 1024x768
HD Graphics 630:
77.3  fps
med. 1366x768
HD Graphics 630:
54.6  fps
high 1366x768
HD Graphics 630:
46.3  fps
ultra 1920x1080
100%
Iris Plus Graphics 640:
35.2  fps
79%
HD Graphics 630:
27.7  fps
low 1280x720
HD Graphics 630:
61.7  fps
med. 1366x768
HD Graphics 630:
32.7  fps
high 1366x768
HD Graphics 630:
20  fps
Mafia 2

Mafia 2

2010
low 800x600
HD Graphics 630:
48.9  fps
med. 1024x768
HD Graphics 630:
38.3  fps
high 1360x768
HD Graphics 630:
33.4  fps
ultra 1920x1080
HD Graphics 630:
20  fps
World of Warcraft

World of Warcraft

2005
low 800x600
HD Graphics 630:
163.6  fps
med. 1024x768
HD Graphics 630:
84.3  fps
high 1280x1024
100%
Iris Plus Graphics 640:
28.5  fps
70%
HD Graphics 630:
19.9  fps

Average Gaming Intel Iris Plus Graphics 640 → 100%

Average Gaming 30-70 fps → 100%

Average Gaming Intel Graphics 4-Cores iGPU (Arc) → 267%

Average Gaming 30-70 fps → 238%

Average Gaming Intel HD Graphics 630 → 88%

Average Gaming 30-70 fps → 93%

Intel Graphics 4-Cores iGPU (Arc)lowmed.highultraQHD4K
F1 243833
Cyberpunk 2077 2.1 Phantom Liberty19161312
Baldur's Gate 317131211
F1 234239257.14
F1 224439298
Tiny Tina's Wonderlands28231613
Strange Brigade110473729
Far Cry 544242321
X-Plane 11.11362924
Final Fantasy XV Benchmark412317
Dota 2 Reborn90595854
The Witcher 386532916
GTA V121107208
< 30 fps
< 60 fps
< 120 fps
≥ 120 fps
3
6
3
1
6
6
1
10
2

9
1


Intel HD Graphics 630lowmed.highultraQHD4K
Gears Tactics28.910
Hunt Showdown13.35.5
Star Wars Jedi Fallen Order7.3
Need for Speed Heat14.17.1
GRID 201931.412.1
Ghost Recon Breakpoint11
FIFA 2053.525.421.5
Borderlands 314.25.6
Control155
F1 20193513.412.2
League of Legends866434.5
Total War: Three Kingdoms38.211.26.4
Rage 26.8
Anno 180016.25
The Division 2156
Dirt Rally 2.03512.810.3
Anthem9.24.8
Far Cry New Dawn125
Metro Exodus13.96.8
Apex Legends25108.3
Just Cause 414.68.4
Battlefield V14.9
Farming Simulator 1959.221.310.76.8
Fallout 7615.36.9
Hitman 211.26.9
Assassin´s Creed Odyssey95
FIFA 1936.220.114.6
Shadow of the Tomb Raider145
F1 20182612
Monster Hunter World13.35.6
The Crew 2207.1
Far Cry 5136
World of Tanks enCore18825.59.62.8
X-Plane 11.1131.319.617.57.1
Kingdom Come: Deliverance15.25.8
Final Fantasy XV Benchmark104.3
Fortnite6824.2
Star Wars Battlefront 225.89.3
Need for Speed Payback19.99.5
Call of Duty WWII30.718.4
Assassin´s Creed Origins107
Destiny 221.211.19.9
ELEX147
The Evil Within 212.46.76
Middle-earth: Shadow of War14129
FIFA 186937.7
Ark Survival Evolved15.7
F1 2017331313
Team Fortress 2999629.58.2
Dirt 444.213.1
Rocket League87.133.821.96.4
Prey31.612.6
Mass Effect Andromeda18.1
Ghost Recon Wildlands14.76.7
For Honor26.710.3
Resident Evil 73414.9
Watch Dogs 217.3
Dishonored 216.3
Call of Duty Infinite Warfare24.1
Titanfall 24433.912.1
Farming Simulator 171066523.613
Battlefield 133.819.6
Civilization VI4216
Mafia 3
FIFA 177256.630.128.5
Deus Ex Mankind Divided17.9
Mirror's Edge Catalyst27.415.9
Overwatch58.340.217.5
Doom23.919.9
Ashes of the Singularity116.7
Hitman 201616
The Division24.414.6
Far Cry Primal19
XCOM 219.27.4
Rise of the Tomb Raider23.614.5
Rainbow Six Siege39.924.816.1
Just Cause 324.721.7
Star Wars Battlefront34.319.5
Fallout 421.8
Anno 220536.6218.5
World of Warships815225
Metal Gear Solid V573714.4
Mad Max25.211.1
Dota 2 Reborn1206926.122.2
The Witcher 317
Dirt Rally178.938.316.1
GTA V49.634.38.5
Dragon Age: Inquisition40.125.58.7
F1 2014101704223
Middle-earth: Shadow of Mordor37.723.912.6
Sims 4186.357.127.2
Total War: Rome II5841.132.24.5
BioShock Infinite6635289
Tomb Raider994829.8
Diablo III77.354.646.327.7
The Elder Scrolls V: Skyrim61.732.720
Mafia 248.938.333.420
World of Warcraft163.684.319.9
< 30 fps
< 60 fps
< 120 fps
≥ 120 fps
51
26
11
5
62
16
5
31
5
1
11

1


1
4
1

Intel Iris Plus Graphics 640lowmed.highultraQHD4K
The Evil Within 213.8
Middle-earth: Shadow of War28
FIFA 1869.538.8
F1 20173615
Playerunknown's Battlegrounds (PUBG)22.9
Team Fortress 2994831.8
Dirt 427.5
Rocket League924028
Prey431814.8
Warhammer 40.000: Dawn of War III33.8
Mass Effect Andromeda20.4
Ghost Recon Wildlands16
For Honor3212
Titanfall 24431.422.9
Farming Simulator 171219131.617.8
Battlefield 1312210
Deus Ex Mankind Divided20.2
Overwatch60392719.5
The Division24.9
Far Cry Primal2813
Rise of the Tomb Raider25189.1
Rainbow Six Siege52311714.2
Star Wars Battlefront44.726.212.9
Dota 2 Reborn80592921
The Witcher 31913.44
GTA V56.728.911.8
Sims 428.621
Battlefield 45236279
BioShock Infinite65433612
Tomb Raider118614219
Diablo III35.2
World of Warcraft28.5
< 30 fps
< 60 fps
< 120 fps
≥ 120 fps
10
10
6
1
10
8
3
13
4

9
2


Eine Liste mit weiteren Spielen und allen Grafikkarten finden Sie auf unserer Seite: Welches Spiel ist mit welcher Grafikkarte spielbar?

v1.28
log 05. 05:56:38

#0 ran 0s before starting gpusingle class +0s ... 0s

#1 checking url part for id 7656 +0s ... 0s

#2 checking url part for id 12259 +0s ... 0s

#3 checking url part for id 7652 +0s ... 0s

#4 redirected to Ajax server, took 1728100597s time from redirect:0 +0s ... 0s

#5 did not recreate cache, as it is less than 5 days old! Created at Fri, 04 Oct 2024 05:16:46 +0200 +0s ... 0s

#6 composed specs +0.049s ... 0.049s

#7 did output specs +0s ... 0.049s

#8 start showIntegratedCPUs +0s ... 0.049s

#9 getting avg benchmarks for device 7656 +0.026s ... 0.075s

#10 got single benchmarks 7656 +0.007s ... 0.082s

#11 getting avg benchmarks for device 12259 +0.004s ... 0.086s

#12 got single benchmarks 12259 +0.017s ... 0.103s

#13 getting avg benchmarks for device 7652 +0.004s ... 0.107s

#14 got single benchmarks 7652 +0.008s ... 0.115s

#15 got avg benchmarks for devices +0s ... 0.115s

#16 min, max, avg, median took s +0.048s ... 0.163s

#17 before gaming benchmark output +0s ... 0.163s

#18 Got 762 rows for game benchmarks. +0.037s ... 0.2s

#19 composed SQL query for gamebenchmarks +0s ... 0.2s

#20 got data and put it in $dataArray +0.005s ... 0.205s

#21 benchmarks composed for output. +0.032s ... 0.238s

#22 calculated avg scores. +0s ... 0.238s

#23 return log +0.001s ... 0.239s

Teilen Sie diesen Artikel, um uns zu unterstützen. Jeder Link hilft!
> Notebook Test, Laptop Test und News > Benchmarks / Technik > Benchmarks / Technik > Grafikkarten Vergleich - Head 2 Head
Autor: Klaus Hinum,  8.09.2017 (Update:  1.07.2023)