Intel Iris Plus Graphics 640 vs NVIDIA GeForce GTX 1050 Ti Max-Q vs NVIDIA GeForce GTX 1070 Ti (Desktop)
Intel Iris Plus Graphics 640 ► remove from comparison
Die Intel Iris Plus Graphics 640 (GT3e) ist eine Prozessorgrafikkarte der im Jänner 2017 vorgestellten Kaby-Lake-Modelle. Als Nachfolger der Iris Graphics 540 (Skylake) ist die Iris Plus Graphics 640 dabei in den ULV-Modellen der 15-Watt-Klasse zu finden und besitzt einen dedizierten eDRAM-Cache mit 64 MB Kapazität. Die sogenannte GT3e-Ausbaustufe der Kaby-Lake-GPU verfügt weiterhin über 48 Execution Units (EUs), die je nach Modell mit bis zu 1.050 MHz takten.
Neben dem eDRAM-Cache kann die Iris 640 auch über das Interface des Prozessors auf den Hauptspeicher zugreifen (2x 64 Bit DDR3L-1600/LPDDR3-1866/DDR4-2133).
Von der Iris Plus 650 der 28-Watt-Modelle unterscheidet sich die Iris 640 lediglich durch ihren etwas geringeren Maximaltakt sowie die geringere TDP, wodurch der Turbo-Boost-Spielraum weniger lang ausgenutzt werden kann.
Performance
Die exakte Leistung der Iris Plus Graphics 640 hängt vom jeweiligen CPU-Modell ab, da sich die Maximaltaktrate leicht unterscheiden kann. Zum anderen beeinflusst auch der verwendete Speicher (DDR3/DDR4) die Performance.
Die höchste Leistung erreichen hochtaktende Core-i7-Ableger wie der Core i7-7660U. Je nach Spiel ordnet sich die Iris 640 wahrscheinlich wie der Vorgänger zwischen einer dedizierten GeForce 920M und GeForce 940M ein und kann aktuelle Spiele meist nur in niedrigen Einstellungen flüssig darstellen.
Features
Die überarbeitete Videoeinheit dekodiert H.265-/HEVC-Videos vollständig in Hardware. Anders als Skylake kann Kaby Lake nun auch H.265/HEVC im Main10-Profil mit 10 Bit Farbtiefe sowie Googles VP9-Codec in Hardware dekodieren. Die Bildausgabe erfolgt über DP 1.2/eDP 1.3 (max. 3.840 x 2.160 @ 60 Hz), wohingegen HDMI nur in der älteren Version 1.4a angeboten wird. Ein HDMI-2.0-Anschluss kann aber mittels Konverter von DisplayPort ergänzt werden. Maximal lassen sich drei Displays parallel angesteuern.
Leistungsaufnahme
Die Iris Graphics 640 ist in ULV-Prozessoren der 15-Watt-Klasse zu finden und damit für schlanke Note- und Ultrabooks geeignet.
NVIDIA GeForce GTX 1050 Ti Max-Q ► remove from comparison
Die Nvidia GeForce GTX 1050 Ti mit Max-Q Design ist eine Mittelklasse-GPU basierend auf der Pascal-Architektur und wurde im Januar 2018 vorgestellt. Anders als die schnelleren Modelle basiert die GTX 1050 Ti auf dem GP107-Chip, der im 14-nm-Verfahren bei Samsung hergestellt wird.
Im Vergleich zur normalen GTX 1050 Ti gibt es noch weitere Unterschiede als den Takt. Der Treiber wurde auf Effizienz (und nicht Leistung) optimiert (nur für die Max-Q Modelle), optimierte Spannungswandler für 1V Betreib, high-end Kühlungsmethoden und eine 40 dB Grenze für die Lüfterlautstärke (mit Taktanpasssungen um dies jederzeit zu gewährleisten) zeichnen die Max-Q Variante aus.
Features
Der GP107-Chip wird in einem 14-nm-FinFET-Prozess bei Samsung gefertigt und bietet eine Reihe neuer Features, unter anderem Support für DisplayPort 1.4 (ready), HDMI 2.0b, HDR, Simultaneous Multi-Projection (SMP) sowie verbessertes H.265 Video De- und Encoding (PlayReady 3.0). Eine genaue Auflistung der Verbesserungen und Features der neuen Pascal Desktop-GPUs finden Sie in unserem Pascal-Architektur-Artikel .
Performance
Die exakte Performance der GeForce GTX 1050 Ti Max-Q kann sich in Abhängigkeit von der Kühlung des jeweiligen Notebooks stark unterscheiden. Im Optimalfall ist die Leistung etwa 10 bis 15 % unterhalb der normalen GTX 1050 Ti angesiedelt. Dadurch eignet sich die Grafikkarte am besten für Full HD (1920 x 1080) bei hoher aber nicht maximaler Detailstufe.
Leistungsaufnahme
Die Leistungsaufnahme der GeForce GTX 1050 Ti Max-Q ist von Nvidia mit 40 - 46 Watt spezifiziert und damit deutlich unterhalb der normalen Notebook GTX 1050 Ti (64 Watt). Selbst die normale GTX 1050 ist mit 53 Watt höher spezifziert. Damit eignet sich die Grafikkarte auch für dünne und leichte 14-Zoll Notebooks.
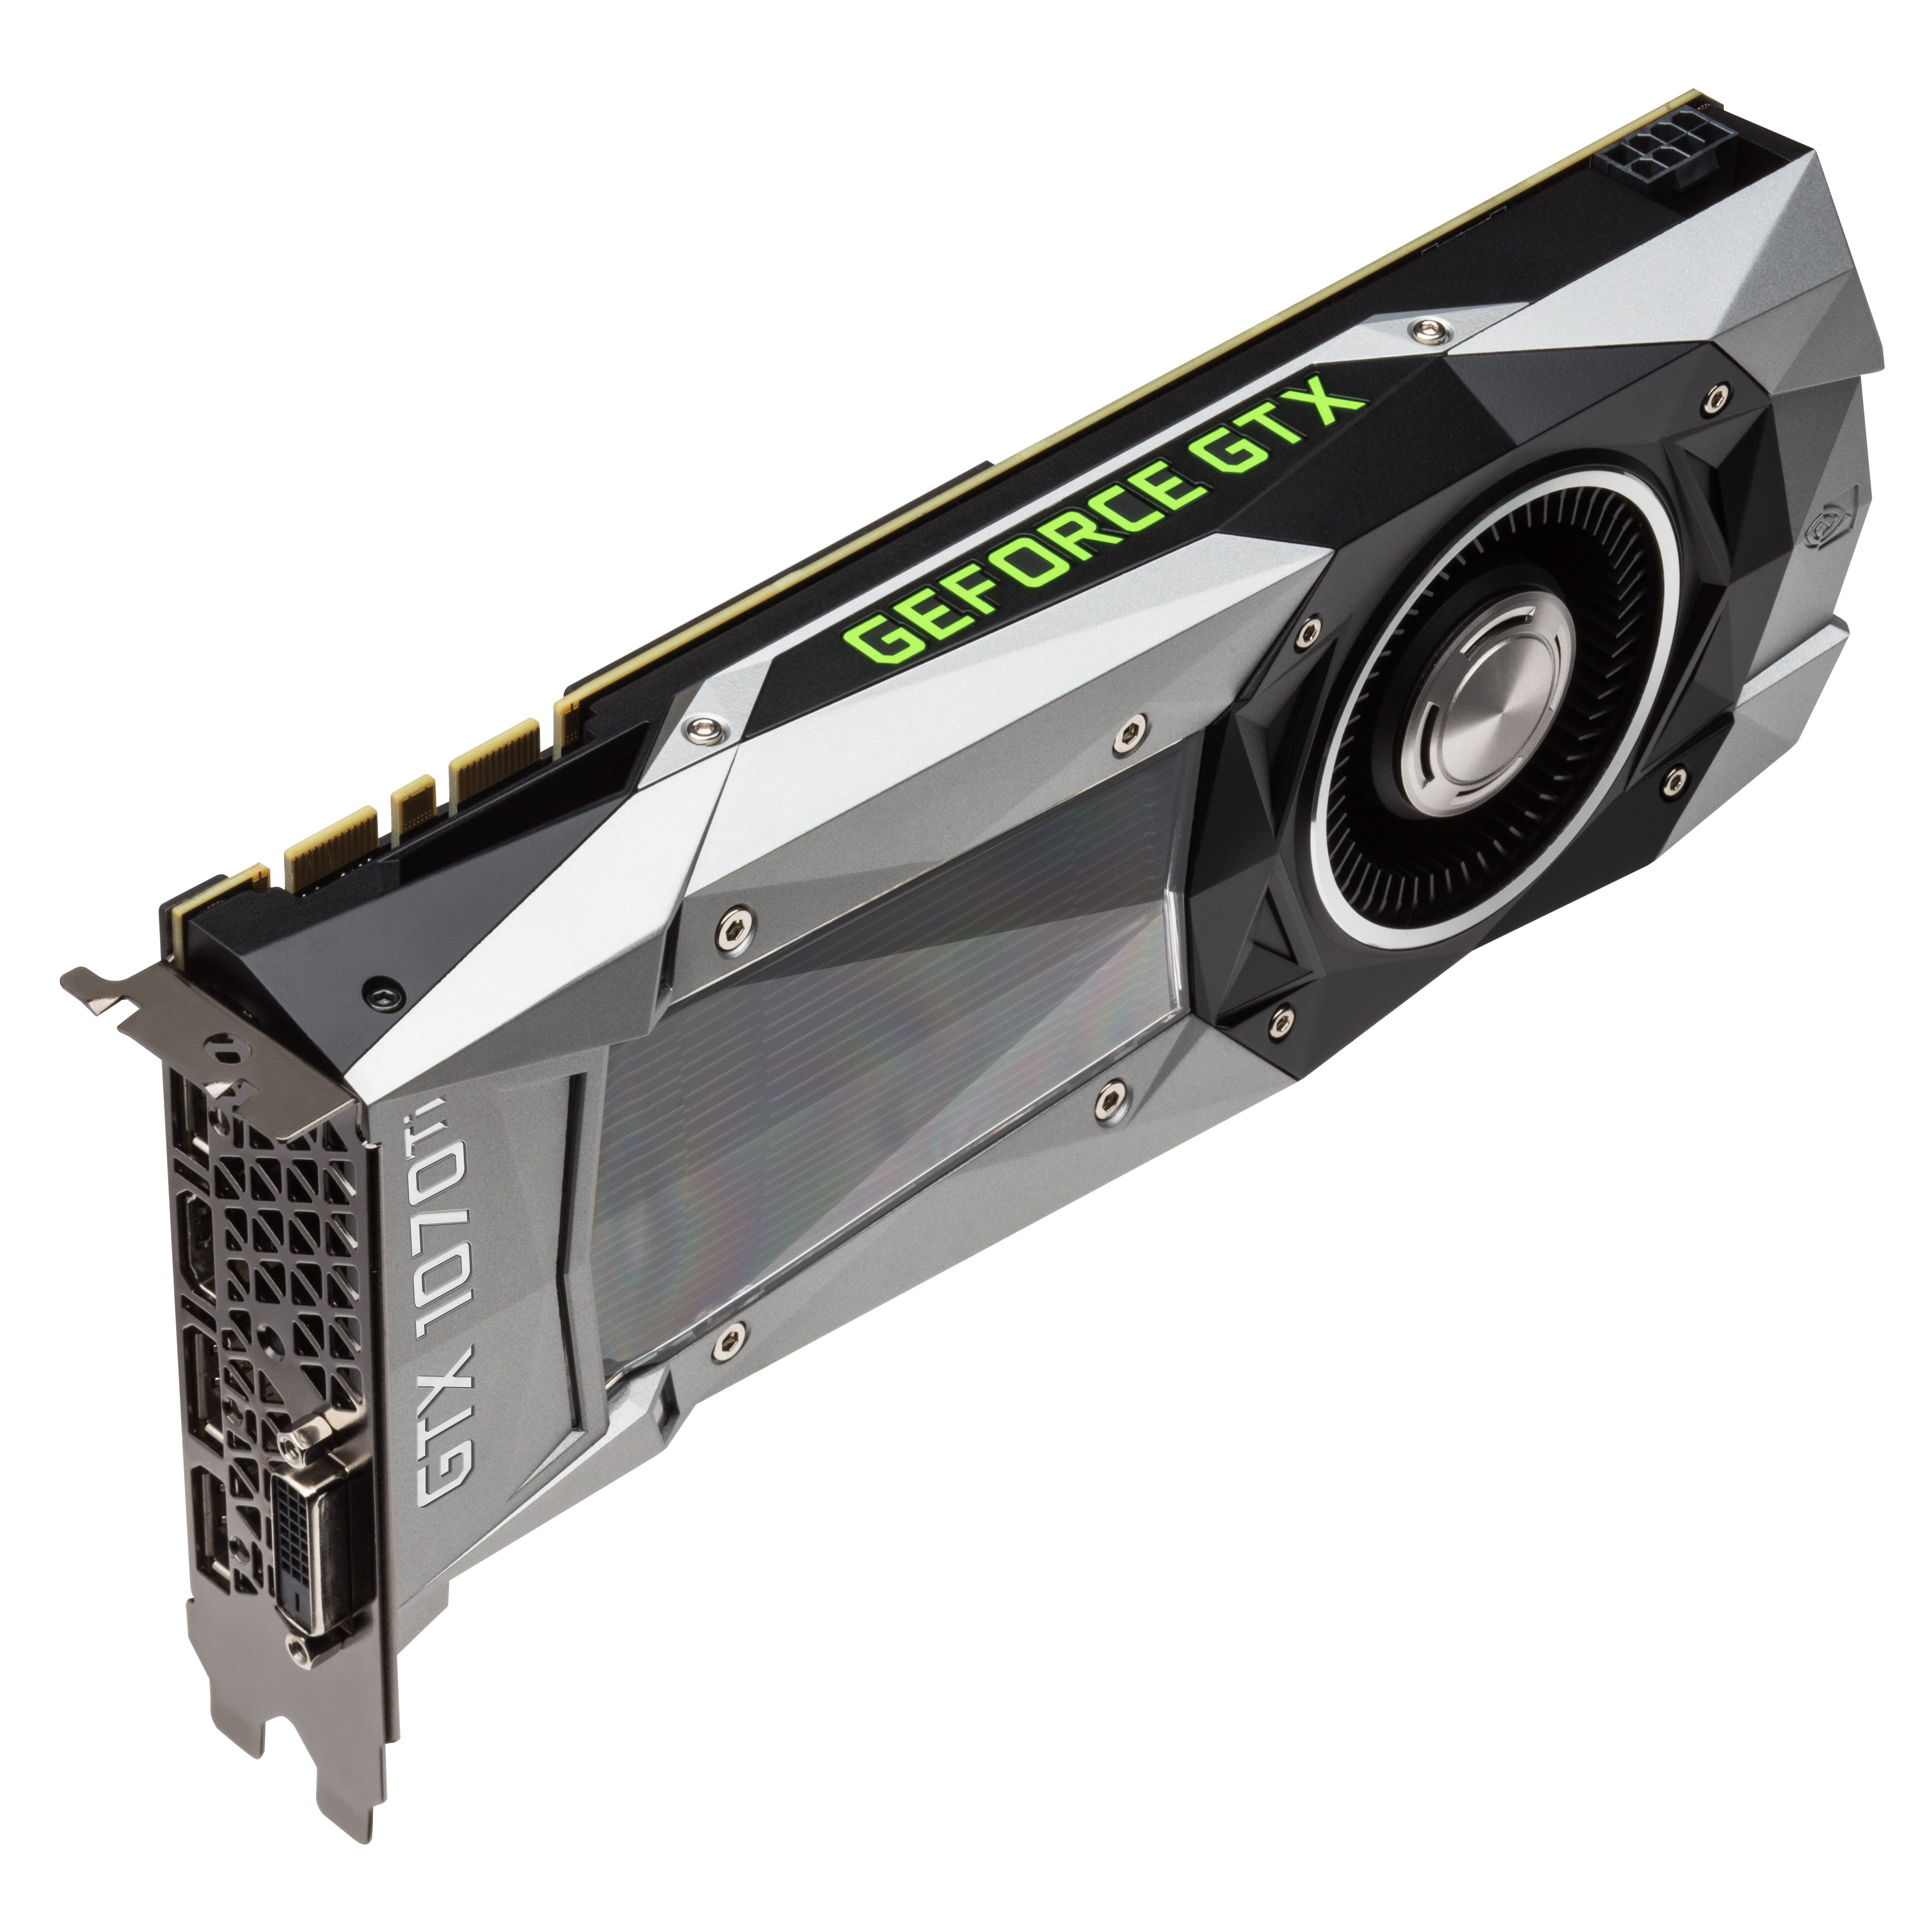
NVIDIA GeForce GTX 1070 Ti (Desktop) ► remove from comparison
Die Nvidia GeForce GTX 1070 Ti ist eine schnelle Desktop Grafikkarte der Pascal Generation. Sie positioniert sich zwischen GTX 1070 und GTX 1080 und wurde als Konter zur Radeon Vega 56 positioniert. Die Vorstellung war im November 2017. Im Vergleich zur GTX 1070 bietet die GTX 1070 Ti mehr Shader (2.432 versus 1.920) bei gleichem Boost Takt. Der 8 GB große Grafikspeicher ist wie bei der GTX 1070 vom Typ GDDR5 und nicht GDDR5X wie bei der GTX 1080.
Features
Der GP104-Chip wird in einem 16nm-FinFET-Prozess bei TSMC gefertigt und bietet eine Reihe neuer Features, unter anderem Support für DisplayPort 1.4 (ready), HDMI 2.0b, HDR, Simultaneous Multi-Projection (SMP) sowie verbessertes H.265 Video De- und Encoding (PlayReady 3.0). Eine genaue Auflistung der Verbesserungen und Features der neuen Pascal Desktop-GPUs finden Sie in unserem Pascal-Architektur-Artikel .
Performance
Die GeForce GTX 1070 Ti positioniert sich wenig überraschend zwischen GTX 1070 und GTX 1080. Damit eignet sich die Grafikkarte am besten für 2560x1440 mit maximalen Details für aktuelle Spiele. Anspruchslosere Spiele können auch in 4K flüssig gespielt werden.
Leistungsaufnahme
Die Leistungsaufnahme der GeForce GTX 1070 Ti wird vom Hersteller mit 180 Watt beziffert und liegt damit in einer ähnlichen Größenordnung wie die GTX 1080. In unseren Tests positioniert sich die Karte leicht darunter aber auch deutlich über der GTX 1070 (150 Watt TDP).
Intel Iris Plus Graphics 640 NVIDIA GeForce GTX 1050 Ti Max-Q NVIDIA GeForce GTX 1070 Ti (Desktop) GeForce GTX 1000 Serie Codename Kaby Lake GT3e N17P-G1 Max-Q Pascal GP104 Architektur Gen. 9.5 Kaby Lake Pascal Pascal Pipelines 48 - unified 768 - unified 2432 - unified Kerntakt 300 - 1050 (Boost) MHz 1151 – 1290 - 1290 – 1417 (Boost) MHz 1607 - 1683 (Boost) MHz Speicherbandbreite 64/128 Bit 128 Bit 256 Bit Speichertyp DDR3/DDR4 GDDR5 GDDR5 Max. Speichergröße 64 MB 4 GB 8 GB Shared Memory ja nein nein API DirectX 12_1, OpenGL 4.4 DirectX 12_1, OpenGL 4.5 DirectX 12_1, OpenGL 4.5 Herstellungsprozess 14 nm 16 nm 16 nm Features QuickSync Multi-Projection, VR Ready, G-SYNC, Vulkan, Multi Monitor Multi-Projection, VR Ready, G-SYNC, Vulkan, Multi Monitor Erscheinungsdatum 03.01.2017 03.01.2018 02.11.2017 Speichertakt 7000 MHz 8000 MHz Stromverbrauch 40 - 46 Watt 180 Watt Notebookgröße mittel (15.4" z.B.) Herstellerseite www.nvidia.com www.nvidia.at Transistors 7.2 Billion
Benchmarks Performance Rating - 3DMark 11 + Fire Strike + Time Spy - GeForce GTX 1050 Ti Max-Q
3.2 pt (10%)
...
NVIDIA GeForce GTX 1050 Ti Max-Q
...
max:
3DMark - 3DMark Time Spy Score
min: 467 avg: 499.8 median: 494.5 (1%) max: 543 Points
min: 2361 avg: 2453 median: 2485 (7%) max: 2513 Points
6177 Points (18%)
3DMark - 3DMark Time Spy Graphics
min: 413 avg: 442.5 median: 437 (1%) max: 483 Points
min: 2196 avg: 2245 median: 2261 (6%) max: 2278 Points
6531 Points (17%)
3DMark - 3DMark Ice Storm Unlimited Graphics
min: 142163 avg: 147298 median: 145481 (15%) max: 154251 Points
324705 Points (33%)
442105 Points (45%)
3DMark - 3DMark Ice Storm Extreme Graphics
39641 Points (5%)
3DMark - 3DMark Cloud Gate Score
min: 7558 avg: 8025 median: 8067 (9%) max: 8711 Points
min: 20755 avg: 24100 median: 24021 (26%) max: 28253 Points
29364 Points (31%)
3DMark - 3DMark Cloud Gate Graphics
min: 10486 avg: 11119 median: 11248 (3%) max: 11495 Points
min: 41871 avg: 46017 median: 46952 (12%) max: 50801 Points
88161 Points (23%)
3DMark - 3DMark Fire Strike Standard Score
min: 1236 avg: 1349 median: 1310 (2%) max: 1509 Points
min: 6175 avg: 6548 median: 6688 (12%) max: 6753 Points
15061 Points (27%)
3DMark - 3DMark Fire Strike Standard Graphics
min: 1315 avg: 1411 median: 1393.5 (2%) max: 1541 Points
min: 6957 avg: 7281 median: 7324 (8%) max: 7428 Points
18405 Points (21%)
3DMark - 3DMark Ice Storm Graphics
min: 41029 avg: 73224 median: 60442 (7%) max: 118202 Points
3DMark 11 - 3DM11 Performance Score
min: 2136 avg: 2440 median: 2561 (4%) max: 2664 Points
min: 8250 avg: 8936 median: 9106 (13%) max: 9414 Points
20106 Points (28%)
3DMark 11 - 3DM11 Performance GPU
min: 1980 avg: 2275 median: 2379 (2%) max: 2493 Points
min: 8317 avg: 8781 median: 8752 (8%) max: 9079 Points
27503 Points (24%)
3DMark Vantage + NVIDIA GeForce GTX 1050 Ti Max-Q 3DMark Vantage - 3DM Vant. Perf. total
min: 24827 avg: 29504 median: 29503.5 (9%) max: 34180 Points
3DM Vant. Perf. GPU no PhysX + NVIDIA GeForce GTX 1050 Ti Max-Q 3DMark Vantage - 3DM Vant. Perf. GPU no PhysX
min: 25707 avg: 29448 median: 29448 (16%) max: 33189 Points
3DMark 06 3DMark 06 - Standard 1280x1024 + Intel Iris Plus Graphics 640
min: 13164 avg: 14118 median: 14117.5 (18%) max: 15071 Points
3DMark 06 - Standard 1280x1024 + NVIDIA GeForce GTX 1050 Ti Max-Q
min: 26796 avg: 28797 median: 28797 (38%) max: 30798 Points
3DMark 06 - Standard 1280x1024 + NVIDIA GeForce GTX 1070 Ti (Desktop)
36475 Points (48%)
3DMark 06 - Standard 1024x768 + NVIDIA GeForce GTX 1050 Ti Max-Q
34786 Points (45%)
Unigine Valley 1.0 - Unigine Valley 1.0 DX
6.5 fps (2%)
40.1 fps (12%)
Unigine Heaven 2.1 - Heaven 2.1 high
86 fps (16%)
Cinebench R10 Cinebench R10 Shading (32bit) + Intel Iris Plus Graphics 640 Cinebench R10 - Cinebench R10 Shading (32bit)
min: 8824 avg: 9678 median: 9703 (7%) max: 10506 Points
Cinebench R10 Shading (32bit) + NVIDIA GeForce GTX 1050 Ti Max-Q
min: 4597 avg: 5340 median: 4972 (4%) max: 6451 Points
Cinebench R11.5 Cinebench R11.5 OpenGL 64 Bit + Intel Iris Plus Graphics 640 Cinebench R11.5 - Cinebench R11.5 OpenGL 64 Bit
46.1 fps (15%)
Cinebench R11.5 OpenGL 64 Bit + NVIDIA GeForce GTX 1050 Ti Max-Q
min: 66.9 avg: 71.7 median: 71.7 (24%) max: 76.5 fps
Cinebench R15 + Intel Iris Plus Graphics 640 Cinebench R15 - Cinebench R15 OpenGL 64 Bit
min: 41.32 avg: 54 median: 56.2 (3%) max: 62.3 fps
Cinebench R15 OpenGL 64 Bit + NVIDIA GeForce GTX 1050 Ti Max-Q
min: 92.1 avg: 105.4 median: 102 (6%) max: 120.7 fps
Cinebench R15 OpenGL Ref. Match 64 Bit + Intel Iris Plus Graphics 640 Cinebench R15 - Cinebench R15 OpenGL Ref. Match 64 Bit
min: 97.8 avg: 98.2 median: 97.8 (98%) max: 99.3 %
Cinebench R15 OpenGL Ref. Match 64 Bit + NVIDIA GeForce GTX 1050 Ti Max-Q
99.6 % (100%)
GFXBench - GFXBench 5.0 Aztec Ruins High Tier Offscreen
49.5 fps (9%)
GFXBench - GFXBench 5.0 Aztec Ruins Normal Tier Offscreen
119.1 fps (9%)
GFXBench - GFXBench Car Chase Offscreen
40.7 fps (5%)
min: 108.8 avg: 124.2 median: 124.2 (14%) max: 139.5 fps
GFXBench 3.1 - GFXBench Manhattan ES 3.1 Offscreen
56.1 fps (1%)
min: 168 avg: 184.9 median: 184.9 (4%) max: 201.7 fps
GFXBench 3.0 - GFXBench 3.0 Manhattan Offscreen
31.2 fps (2%)
min: 229.8 avg: 253.2 median: 253.2 (15%) max: 276.5 fps
GFXBench (DX / GLBenchmark) 2.7 + Intel Iris Plus Graphics 640 GFXBench (DX / GLBenchmark) 2.7 - GFXBench T-Rex HD Offscreen C24Z16
171 fps (1%)
GFXBench T-Rex HD Offscreen C24Z16 + NVIDIA GeForce GTX 1050 Ti Max-Q
min: 501 avg: 531 median: 531 (4%) max: 561 fps
LuxMark v2.0 64Bit - LuxMark v2.0 Room GPU
min: 315 avg: 325 median: 325 (1%) max: 335 Samples/s
min: 1167 avg: 1201 median: 1200.5 (5%) max: 1234 Samples/s
2542 Samples/s (11%)
LuxMark v2.0 64Bit - LuxMark v2.0 Sala GPU
min: 748 avg: 779 median: 778.5 (1%) max: 809 Samples/s
min: 2100 avg: 2222 median: 2221.5 (4%) max: 2343 Samples/s
5159 Samples/s (9%)
ComputeMark v2.1 - ComputeMark v2.1 Result
min: 1575 avg: 1677 median: 1677 (2%) max: 1779 Points
min: 4515 avg: 4879 median: 4879 (5%) max: 5243 Points
15488 Points (17%)
Power Consumption - Furmark Stress Test Power Consumption - external Monitor *
min: 30.8 avg: 33.6 median: 31.5 (4%) max: 38.5 Watt
73.1 Watt (10%)
291 Watt (41%)
Power Consumption - The Witcher 3 Power Consumption - external Monitor *
min: 28 avg: 33.5 median: 33.5 (5%) max: 38.9 Watt
75.8 Watt (11%)
290 Watt (41%)
Power Consumption - Witcher 3 Power Consumption *
min: 31.7 avg: 34.9 median: 34.9 (8%) max: 38.1 Watt
min: 82 avg: 90 median: 85 (19%) max: 103 Watt
Power Consumption - Witcher 3 ultra Power Efficiency
min: 0.2379 avg: 0.3 median: 0.3 (26%) max: 0.3073 fps per Watt
Power Consumption - Witcher 3 ultra Power Efficiency - external Monitor
0.1 fps per Watt (9%)
0.3 fps per Watt (27%)
0.2 fps per Watt (21%)
Emissions Witcher 3 Fan Noise + Intel Iris Plus Graphics 640 Emissions - Witcher 3 Fan Noise
33.4 dB(A) (53%)
Witcher 3 Fan Noise + NVIDIA GeForce GTX 1050 Ti Max-Q
min: 36.4 avg: 40.2 median: 38.4 (61%) max: 47.6 dB(A)
Clock Speed - GPU Clock Witcher 3 ultra
min: 748 avg: 823 median: 823 (32%) max: 898 MHz
1392 MHz (55%)
1810 MHz (71%)
Clock Speed - GPU Clock Speed Furmark
min: 570 avg: 634 median: 634 (25%) max: 698 MHz
1677 MHz (66%)
Average Benchmarks Intel Iris Plus Graphics 640 → 100% n=14 Average Benchmarks NVIDIA GeForce GTX 1050 Ti Max-Q → 360% n=14 Average Benchmarks NVIDIA GeForce GTX 1070 Ti (Desktop) → 818% n=14
- Bereich der Benchmarkergebnisse für diese Grafikkarte
- Durchschnittliche Benchmarkergebnisse für diese Grafikkarte
* Smaller numbers mean a higher performance
1 This benchmark is not used for the average calculation
Spiele-Benchmarks Die folgenden Benchmarks basieren auf unseren Spieletests mit Testnotebooks. Die Performance dieser Grafikkarte bei den gelisteten Spielen ist abhängig von der verwendeten CPU, Speicherausstattung, Treiber und auch Betriebssystem. Dadurch müssen die untenstehenden Werte nicht repräsentativ sein. Detaillierte Informationen über das verwendete System sehen Sie nach einem Klick auf den fps-Wert.
GeForce GTX 1070 Ti (Desktop):
200 [X] i7-7740X Asus X299 Prime Intel Core i7-7740X 4.3GHz
GeForce GTX 1070 Ti (Desktop)
min:
173 fps, max:
219 fps
fps
GeForce GTX 1070 Ti (Desktop):
78 [X] i7-7740X Asus X299 Prime Intel Core i7-7740X 4.3GHz
GeForce GTX 1070 Ti (Desktop)
min:
68 fps, max:
88 fps
fps
GeForce GTX 1070 Ti (Desktop):
58.5 [X] i7-7740X Asus X299 Prime Intel Core i7-7740X 4.3GHz
GeForce GTX 1070 Ti (Desktop)
min:
50 fps, max:
67 fps
fps
GeForce GTX 1070 Ti (Desktop):
37.1 [X] i7-7740X Asus X299 Prime Intel Core i7-7740X 4.3GHz
GeForce GTX 1070 Ti (Desktop)
min:
31 fps, max:
43 fps
fps
GeForce GTX 1070 Ti (Desktop):
17.9 [X] i7-7740X Asus X299 Prime Intel Core i7-7740X 4.3GHz
GeForce GTX 1070 Ti (Desktop)
min:
15 fps, max:
21 fps
fps
GeForce GTX 1070 Ti (Desktop):
244 [X] i7-7740X Asus X299 Prime Intel Core i7-7740X 4.3GHz
GeForce GTX 1070 Ti (Desktop)
min:
195 fps, max:
269 fps
fps
GeForce GTX 1070 Ti (Desktop):
183 [X] i7-7740X Asus X299 Prime Intel Core i7-7740X 4.3GHz
GeForce GTX 1070 Ti (Desktop)
min:
155 fps, max:
196 fps
fps
GeForce GTX 1070 Ti (Desktop):
164 [X] i7-7740X Asus X299 Prime Intel Core i7-7740X 4.3GHz
GeForce GTX 1070 Ti (Desktop)
min:
145 fps, max:
176 fps
fps
GeForce GTX 1070 Ti (Desktop):
120 [X] i7-7740X Asus X299 Prime Intel Core i7-7740X 4.3GHz
GeForce GTX 1070 Ti (Desktop)
min:
112 fps, max:
129 fps
fps
GeForce GTX 1070 Ti (Desktop):
94 [X] i7-7740X Asus X299 Prime Intel Core i7-7740X 4.3GHz
GeForce GTX 1070 Ti (Desktop)
min:
86 fps, max:
98 fps
fps
GeForce GTX 1070 Ti (Desktop):
57 [X] i7-7740X Asus X299 Prime Intel Core i7-7740X 4.3GHz
GeForce GTX 1070 Ti (Desktop)
min:
52 fps, max:
60 fps
fps
GeForce GTX 1070 Ti (Desktop):
271 [X] i7-7740X Asus X299 Prime Intel Core i7-7740X 4.3GHz
GeForce GTX 1070 Ti (Desktop)
min:
209 fps, max:
313 fps
fps
GeForce GTX 1070 Ti (Desktop):
249 [X] i7-7740X Asus X299 Prime Intel Core i7-7740X 4.3GHz
GeForce GTX 1070 Ti (Desktop)
min:
201 fps, max:
284 fps
fps
GeForce GTX 1070 Ti (Desktop):
241 [X] i7-7740X Asus X299 Prime Intel Core i7-7740X 4.3GHz
GeForce GTX 1070 Ti (Desktop)
min:
189 fps, max:
269 fps
fps
GeForce GTX 1070 Ti (Desktop):
219 [X] i7-7740X Asus X299 Prime Intel Core i7-7740X 4.3GHz
GeForce GTX 1070 Ti (Desktop)
min:
159 fps, max:
243 fps
fps
GeForce GTX 1070 Ti (Desktop):
222 [X] i7-7740X Asus X299 Prime Intel Core i7-7740X 4.3GHz
GeForce GTX 1070 Ti (Desktop)
min:
176 fps, max:
250 fps
fps
GeForce GTX 1070 Ti (Desktop):
221 [X] i7-7740X Asus X299 Prime Intel Core i7-7740X 4.3GHz
GeForce GTX 1070 Ti (Desktop)
min:
161 fps, max:
247 fps
fps
GeForce GTX 1070 Ti (Desktop):
86.6 [X] i7-7740X Asus X299 Prime Intel Core i7-7740X 4.3GHz
GeForce GTX 1070 Ti (Desktop)
min:
71 fps, max:
102 fps
fps
GeForce GTX 1070 Ti (Desktop):
63.4 [X] i7-7740X Asus X299 Prime Intel Core i7-7740X 4.3GHz
GeForce GTX 1070 Ti (Desktop)
min:
56 fps, max:
76 fps
fps
GeForce GTX 1070 Ti (Desktop):
41.2 [X] i7-7740X Asus X299 Prime Intel Core i7-7740X 4.3GHz
GeForce GTX 1070 Ti (Desktop)
min:
36 fps, max:
47 fps
fps
GeForce GTX 1070 Ti (Desktop):
20.3 [X] i7-7740X Asus X299 Prime Intel Core i7-7740X 4.3GHz
GeForce GTX 1070 Ti (Desktop)
min:
17 fps, max:
22 fps
fps
GeForce GTX 1070 Ti (Desktop):
46 [X] i7-7740X Asus X299 Prime Intel Core i7-7740X 4.3GHz
GeForce GTX 1070 Ti (Desktop)
min:
39 fps, max:
54 fps
fps
GeForce GTX 1070 Ti (Desktop):
40.4 [X] i7-7740X Asus X299 Prime Intel Core i7-7740X 4.3GHz
GeForce GTX 1070 Ti (Desktop)
min:
34 fps, max:
44 fps
fps
GeForce GTX 1070 Ti (Desktop):
24.1 [X] i7-7740X Asus X299 Prime Intel Core i7-7740X 4.3GHz
GeForce GTX 1070 Ti (Desktop)
min:
22 fps, max:
26 fps
fps
GeForce GTX 1050 Ti Max-Q:
133.2 fps
GeForce GTX 1050 Ti Max-Q:
56.7 fps
GeForce GTX 1050 Ti Max-Q:
44.3 fps
GeForce GTX 1050 Ti Max-Q:
27.2 fps
GeForce GTX 1050 Ti Max-Q:
11.3 fps
GeForce GTX 1050 Ti Max-Q:
67.1 fps
GeForce GTX 1050 Ti Max-Q:
40.5 fps
GeForce GTX 1050 Ti Max-Q:
34 fps
GeForce GTX 1050 Ti Max-Q:
30.4 fps
GeForce GTX 1050 Ti Max-Q:
9 fps
GeForce GTX 1050 Ti Max-Q:
83 89 [X] MSI GF75 8RD-001 Intel Core i7-8750H 2.2GHz
GeForce GTX 1050 Ti Max-Q
min:
61 fps, max:
89 fps
~ 86 fps
GeForce GTX 1070 Ti (Desktop):
121 [X] i7-7740X Asus X299 Prime Intel Core i7-7740X 4.3GHz
GeForce GTX 1070 Ti (Desktop)
min:
93 fps, max:
174 fps
fps
GeForce GTX 1050 Ti Max-Q:
47 50 [X] MSI GF75 8RD-001 Intel Core i7-8750H 2.2GHz
GeForce GTX 1050 Ti Max-Q
min:
40 fps, max:
60 fps
~ 49 fps
GeForce GTX 1070 Ti (Desktop):
107 [X] i7-7740X Asus X299 Prime Intel Core i7-7740X 4.3GHz
GeForce GTX 1070 Ti (Desktop)
min:
83 fps, max:
140 fps
fps
GeForce GTX 1050 Ti Max-Q:
43 46 [X] MSI GF75 8RD-001 Intel Core i7-8750H 2.2GHz
GeForce GTX 1050 Ti Max-Q
min:
38 fps, max:
56 fps
~ 45 fps
GeForce GTX 1070 Ti (Desktop):
103 [X] i7-7740X Asus X299 Prime Intel Core i7-7740X 4.3GHz
GeForce GTX 1070 Ti (Desktop)
min:
84 fps, max:
132 fps
fps
GeForce GTX 1050 Ti Max-Q:
40 43 [X] MSI GF75 8RD-001 Intel Core i7-8750H 2.2GHz
GeForce GTX 1050 Ti Max-Q
min:
33 fps, max:
53 fps
~ 42 fps
GeForce GTX 1070 Ti (Desktop):
93 [X] i7-7740X Asus X299 Prime Intel Core i7-7740X 4.3GHz
GeForce GTX 1070 Ti (Desktop)
min:
72 fps, max:
127 fps
fps
GeForce GTX 1050 Ti Max-Q:
29 [X] MSI GF75 8RD-001 Intel Core i7-8750H 2.2GHz
GeForce GTX 1050 Ti Max-Q
min:
24 fps, max:
37 fps
fps
GeForce GTX 1070 Ti (Desktop):
76 [X] i7-7740X Asus X299 Prime Intel Core i7-7740X 4.3GHz
GeForce GTX 1070 Ti (Desktop)
min:
60 fps, max:
95 fps
fps
GeForce GTX 1050 Ti Max-Q:
14 15 [X] MSI GF75 8RD-001 Intel Core i7-8750H 2.2GHz
GeForce GTX 1050 Ti Max-Q
min:
11 fps, max:
19 fps
~ 15 fps
GeForce GTX 1070 Ti (Desktop):
42 [X] i7-7740X Asus X299 Prime Intel Core i7-7740X 4.3GHz
GeForce GTX 1070 Ti (Desktop)
min:
34 fps, max:
51 fps
fps
GeForce GTX 1050 Ti Max-Q:
55.5 60.4 [X] MSI GF75 8RD-001 Intel Core i7-8750H 2.2GHz
GeForce GTX 1050 Ti Max-Q
min:
31.8 fps, max:
115.6 fps
~ 58 fps
GeForce GTX 1070 Ti (Desktop):
147 [X] i7-7740X Asus X299 Prime Intel Core i7-7740X 4.3GHz
GeForce GTX 1070 Ti (Desktop)
min:
77.86 fps, max:
237.53 fps
fps
GeForce GTX 1050 Ti Max-Q:
31.4 [X] MSI GF75 8RD-001 Intel Core i7-8750H 2.2GHz
GeForce GTX 1050 Ti Max-Q
min:
15.8 fps, max:
53.7 fps
49.8 ~ 41 fps
GeForce GTX 1070 Ti (Desktop):
83 [X] i7-7740X Asus X299 Prime Intel Core i7-7740X 4.3GHz
GeForce GTX 1070 Ti (Desktop)
min:
40.8 fps, max:
146.74 fps
fps
GeForce GTX 1050 Ti Max-Q:
23.5 [X] MSI GF75 8RD-001 Intel Core i7-8750H 2.2GHz
GeForce GTX 1050 Ti Max-Q
min:
12.1 fps, max:
39.8 fps
36.5 ~ 30 fps
GeForce GTX 1070 Ti (Desktop):
63 [X] i7-7740X Asus X299 Prime Intel Core i7-7740X 4.3GHz
GeForce GTX 1070 Ti (Desktop)
min:
32.59 fps, max:
112.4 fps
fps
GeForce GTX 1050 Ti Max-Q:
19.3 [X] MSI GF75 8RD-001 Intel Core i7-8750H 2.2GHz
GeForce GTX 1050 Ti Max-Q
min:
10.4 fps, max:
19.3 fps
28.3 ~ 24 fps
GeForce GTX 1070 Ti (Desktop):
52.3 [X] i7-7740X Asus X299 Prime Intel Core i7-7740X 4.3GHz
GeForce GTX 1070 Ti (Desktop)
min:
28.83 fps, max:
88.2 fps
fps
GeForce GTX 1070 Ti (Desktop):
40.2 [X] i7-7740X Asus X299 Prime Intel Core i7-7740X 4.3GHz
GeForce GTX 1070 Ti (Desktop)
min:
24.15 fps, max:
62.69 fps
fps
GeForce GTX 1050 Ti Max-Q:
4.7 fps
GeForce GTX 1070 Ti (Desktop):
24.6 [X] i7-7740X Asus X299 Prime Intel Core i7-7740X 4.3GHz
GeForce GTX 1070 Ti (Desktop)
min:
16.12 fps, max:
36.5 fps
fps
GeForce GTX 1070 Ti (Desktop):
144 [X] i7-7740X Asus X299 Prime Intel Core i7-7740X 4.3GHz
GeForce GTX 1070 Ti (Desktop)
min:
143 fps, max:
145 fps
fps
GeForce GTX 1070 Ti (Desktop):
138 [X] i7-7740X Asus X299 Prime Intel Core i7-7740X 4.3GHz
GeForce GTX 1070 Ti (Desktop)
min:
128 fps, max:
145 fps
fps
GeForce GTX 1070 Ti (Desktop):
123 [X] i7-7740X Asus X299 Prime Intel Core i7-7740X 4.3GHz
GeForce GTX 1070 Ti (Desktop)
min:
110 fps, max:
145 fps
fps
GeForce GTX 1070 Ti (Desktop):
121 [X] i7-7740X Asus X299 Prime Intel Core i7-7740X 4.3GHz
GeForce GTX 1070 Ti (Desktop)
min:
109 fps, max:
145 fps
fps
GeForce GTX 1070 Ti (Desktop):
81 [X] i7-7740X Asus X299 Prime Intel Core i7-7740X 4.3GHz
GeForce GTX 1070 Ti (Desktop)
min:
63 fps, max:
100 fps
fps
GeForce GTX 1070 Ti (Desktop):
42.4 [X] i7-7740X Asus X299 Prime Intel Core i7-7740X 4.3GHz
GeForce GTX 1070 Ti (Desktop)
min:
37 fps, max:
52 fps
fps
GeForce GTX 1050 Ti Max-Q:
73.2 fps
GeForce GTX 1050 Ti Max-Q:
47.9 fps
GeForce GTX 1050 Ti Max-Q:
36.1 fps
GeForce GTX 1050 Ti Max-Q:
35.3 fps
GeForce GTX 1070 Ti (Desktop):
88 [X] i7-7740X Asus X299 Prime Intel Core i7-7740X 4.3GHz
GeForce GTX 1070 Ti (Desktop)
min:
82 fps, max:
94 fps
fps
GeForce GTX 1070 Ti (Desktop):
64 [X] i7-7740X Asus X299 Prime Intel Core i7-7740X 4.3GHz
GeForce GTX 1070 Ti (Desktop)
min:
58 fps, max:
68 fps
fps
GeForce GTX 1050 Ti Max-Q:
12.9 fps
GeForce GTX 1070 Ti (Desktop):
35.3 [X] i7-7740X Asus X299 Prime Intel Core i7-7740X 4.3GHz
GeForce GTX 1070 Ti (Desktop)
min:
32 fps, max:
38 fps
fps
GeForce GTX 1050 Ti Max-Q:
134.5 fps
GeForce GTX 1050 Ti Max-Q:
87.4 fps
GeForce GTX 1050 Ti Max-Q:
73.7 fps
GeForce GTX 1050 Ti Max-Q:
65 fps
GeForce GTX 1070 Ti (Desktop):
110 [X] i7-7740X Asus X299 Prime Intel Core i7-7740X 4.3GHz
GeForce GTX 1070 Ti (Desktop)
min:
84 fps, max:
125 fps
fps
GeForce GTX 1070 Ti (Desktop):
74 [X] i7-7740X Asus X299 Prime Intel Core i7-7740X 4.3GHz
GeForce GTX 1070 Ti (Desktop)
min:
62 fps, max:
84 fps
fps
GeForce GTX 1050 Ti Max-Q:
13.2 fps
GeForce GTX 1070 Ti (Desktop):
35.4 [X] i7-7740X Asus X299 Prime Intel Core i7-7740X 4.3GHz
GeForce GTX 1070 Ti (Desktop)
min:
27 fps, max:
41 fps
fps
GeForce GTX 1050 Ti Max-Q:
100.1 fps
GeForce GTX 1050 Ti Max-Q:
57.3 fps
GeForce GTX 1050 Ti Max-Q:
47.9 fps
GeForce GTX 1050 Ti Max-Q:
44.8 fps
GeForce GTX 1070 Ti (Desktop):
111 [X] i7-7740X Asus X299 Prime Intel Core i7-7740X 4.3GHz
GeForce GTX 1070 Ti (Desktop)
min:
90 fps, max:
162 fps
fps
GeForce GTX 1070 Ti (Desktop):
83 [X] i7-7740X Asus X299 Prime Intel Core i7-7740X 4.3GHz
GeForce GTX 1070 Ti (Desktop)
min:
67 fps, max:
124 fps
fps
GeForce GTX 1050 Ti Max-Q:
17.3 fps
GeForce GTX 1070 Ti (Desktop):
47.1 [X] i7-7740X Asus X299 Prime Intel Core i7-7740X 4.3GHz
GeForce GTX 1070 Ti (Desktop)
min:
37 fps, max:
72 fps
fps
GeForce GTX 1050 Ti Max-Q:
193.6 fps
GeForce GTX 1050 Ti Max-Q:
128.7 fps
GeForce GTX 1050 Ti Max-Q:
80.5 fps
GeForce GTX 1050 Ti Max-Q:
61 fps
GeForce GTX 1050 Ti Max-Q:
22 fps
GeForce GTX 1050 Ti Max-Q:
64.8 fps
GeForce GTX 1050 Ti Max-Q:
41 fps
GeForce GTX 1050 Ti Max-Q:
37.5 fps
GeForce GTX 1050 Ti Max-Q:
35.9 fps
GeForce GTX 1050 Ti Max-Q:
11.3 fps
GeForce GTX 1050 Ti Max-Q:
118.7 fps
GeForce GTX 1050 Ti Max-Q:
46.3 fps
GeForce GTX 1050 Ti Max-Q:
45 fps
GeForce GTX 1050 Ti Max-Q:
37.5 fps
GeForce GTX 1070 Ti (Desktop):
120 [X] i7-7740X Asus X299 Prime Intel Core i7-7740X 4.3GHz
GeForce GTX 1070 Ti (Desktop)
min:
94 fps, max:
156 fps
fps
GeForce GTX 1070 Ti (Desktop):
80 [X] i7-7740X Asus X299 Prime Intel Core i7-7740X 4.3GHz
GeForce GTX 1070 Ti (Desktop)
min:
61 fps, max:
105 fps
fps
GeForce GTX 1050 Ti Max-Q:
10.1 fps
GeForce GTX 1070 Ti (Desktop):
40.1 [X] i7-7740X Asus X299 Prime Intel Core i7-7740X 4.3GHz
GeForce GTX 1070 Ti (Desktop)
min:
28 fps, max:
53 fps
fps
GeForce GTX 1050 Ti Max-Q:
67 fps
GeForce GTX 1050 Ti Max-Q:
43 fps
GeForce GTX 1050 Ti Max-Q:
34 fps
GeForce GTX 1050 Ti Max-Q:
18 fps
GeForce GTX 1070 Ti (Desktop):
63 [X] i7-7740X Asus X299 Prime Intel Core i7-7740X 4.3GHz
GeForce GTX 1070 Ti (Desktop)
min:
35 fps, max:
124 fps
fps
GeForce GTX 1070 Ti (Desktop):
48 [X] i7-7740X Asus X299 Prime Intel Core i7-7740X 4.3GHz
GeForce GTX 1070 Ti (Desktop)
min:
24 fps, max:
81 fps
fps
GeForce GTX 1050 Ti Max-Q:
7 fps
GeForce GTX 1070 Ti (Desktop):
27 [X] i7-7740X Asus X299 Prime Intel Core i7-7740X 4.3GHz
GeForce GTX 1070 Ti (Desktop)
min:
13 fps, max:
63 fps
fps
GeForce GTX 1050 Ti Max-Q:
122 fps
GeForce GTX 1050 Ti Max-Q:
67 fps
GeForce GTX 1050 Ti Max-Q:
61 fps
GeForce GTX 1050 Ti Max-Q:
47 fps
GeForce GTX 1070 Ti (Desktop):
100 [X] i7-7740X Asus X299 Prime Intel Core i7-7740X 4.3GHz
GeForce GTX 1070 Ti (Desktop)
min:
87 fps, max:
129 fps
fps
GeForce GTX 1070 Ti (Desktop):
81 [X] i7-7740X Asus X299 Prime Intel Core i7-7740X 4.3GHz
GeForce GTX 1070 Ti (Desktop)
min:
73 fps, max:
103 fps
fps
GeForce GTX 1050 Ti Max-Q:
20 fps
GeForce GTX 1070 Ti (Desktop):
55 [X] i7-7740X Asus X299 Prime Intel Core i7-7740X 4.3GHz
GeForce GTX 1070 Ti (Desktop)
min:
49 fps, max:
68 fps
fps
GeForce GTX 1070 Ti (Desktop):
267 [X] i7-7740X Asus X299 Prime Intel Core i7-7740X 4.3GHz
GeForce GTX 1070 Ti (Desktop)
min:
248 fps, max:
287 fps
fps
GeForce GTX 1070 Ti (Desktop):
141 [X] i7-7740X Asus X299 Prime Intel Core i7-7740X 4.3GHz
GeForce GTX 1070 Ti (Desktop)
min:
114 fps, max:
165 fps
fps
GeForce GTX 1050 Ti Max-Q:
97 fps
GeForce GTX 1050 Ti Max-Q:
39 fps
GeForce GTX 1050 Ti Max-Q:
35 fps
GeForce GTX 1050 Ti Max-Q:
29 fps
GeForce GTX 1070 Ti (Desktop):
84 [X] i7-7740X Asus X299 Prime Intel Core i7-7740X 4.3GHz
GeForce GTX 1070 Ti (Desktop)
min:
67 fps, max:
142 fps
fps
GeForce GTX 1070 Ti (Desktop):
51 [X] i7-7740X Asus X299 Prime Intel Core i7-7740X 4.3GHz
GeForce GTX 1070 Ti (Desktop)
min:
46 fps, max:
87 fps
fps
GeForce GTX 1050 Ti Max-Q:
11 fps
GeForce GTX 1070 Ti (Desktop):
28 [X] i7-7740X Asus X299 Prime Intel Core i7-7740X 4.3GHz
GeForce GTX 1070 Ti (Desktop)
min:
24 fps, max:
43 fps
fps
GeForce GTX 1050 Ti Max-Q:
134 fps
GeForce GTX 1050 Ti Max-Q:
80 fps
GeForce GTX 1050 Ti Max-Q:
62 fps
GeForce GTX 1050 Ti Max-Q:
38 fps
GeForce GTX 1070 Ti (Desktop):
97 [X] i7-7740X Asus X299 Prime Intel Core i7-7740X 4.3GHz
GeForce GTX 1070 Ti (Desktop)
min:
85 fps, max:
102 fps
fps
GeForce GTX 1070 Ti (Desktop):
78 [X] i7-7740X Asus X299 Prime Intel Core i7-7740X 4.3GHz
GeForce GTX 1070 Ti (Desktop)
min:
70 fps, max:
82 fps
fps
GeForce GTX 1050 Ti Max-Q:
17 fps
GeForce GTX 1070 Ti (Desktop):
49 [X] i7-7740X Asus X299 Prime Intel Core i7-7740X 4.3GHz
GeForce GTX 1070 Ti (Desktop)
min:
44 fps, max:
51 fps
fps
GeForce GTX 1050 Ti Max-Q:
100.3 fps
GeForce GTX 1050 Ti Max-Q:
39.2 fps
GeForce GTX 1050 Ti Max-Q:
34.9 fps
GeForce GTX 1050 Ti Max-Q:
26.8 fps
GeForce GTX 1070 Ti (Desktop):
78 [X] i7-7740X Asus X299 Prime Intel Core i7-7740X 4.3GHz
GeForce GTX 1070 Ti (Desktop)
min:
64 fps, max:
99 fps
fps
GeForce GTX 1070 Ti (Desktop):
48.5 [X] i7-7740X Asus X299 Prime Intel Core i7-7740X 4.3GHz
GeForce GTX 1070 Ti (Desktop)
min:
41 fps, max:
59 fps
fps
GeForce GTX 1050 Ti Max-Q:
8.3 fps
GeForce GTX 1070 Ti (Desktop):
23.8 [X] i7-7740X Asus X299 Prime Intel Core i7-7740X 4.3GHz
GeForce GTX 1070 Ti (Desktop)
min:
21 fps, max:
28 fps
fps
GeForce GTX 1050 Ti Max-Q:
60 fps
GeForce GTX 1050 Ti Max-Q:
49.1 fps
GeForce GTX 1050 Ti Max-Q:
45.3 fps
GeForce GTX 1050 Ti Max-Q:
42 fps
GeForce GTX 1050 Ti Max-Q:
14 fps
GeForce GTX 1050 Ti Max-Q:
76 91 91 ~ 86 fps
GeForce GTX 1070 Ti (Desktop):
135 [X] i7-7740X Asus X299 Prime Intel Core i7-7740X 4.3GHz
GeForce GTX 1070 Ti (Desktop)
min:
111 fps, max:
171 fps
fps
GeForce GTX 1050 Ti Max-Q:
45 48 48 ~ 47 fps
GeForce GTX 1070 Ti (Desktop):
114 [X] i7-7740X Asus X299 Prime Intel Core i7-7740X 4.3GHz
GeForce GTX 1070 Ti (Desktop)
min:
95 fps, max:
132 fps
fps
GeForce GTX 1050 Ti Max-Q:
41 44 44 ~ 43 fps
GeForce GTX 1070 Ti (Desktop):
108 [X] i7-7740X Asus X299 Prime Intel Core i7-7740X 4.3GHz
GeForce GTX 1070 Ti (Desktop)
min:
95 fps, max:
122 fps
fps
GeForce GTX 1050 Ti Max-Q:
38 38 41 ~ 39 fps
GeForce GTX 1070 Ti (Desktop):
102 [X] i7-7740X Asus X299 Prime Intel Core i7-7740X 4.3GHz
GeForce GTX 1070 Ti (Desktop)
min:
79 fps, max:
116 fps
fps
GeForce GTX 1070 Ti (Desktop):
75 [X] i7-7740X Asus X299 Prime Intel Core i7-7740X 4.3GHz
GeForce GTX 1070 Ti (Desktop)
min:
67 fps, max:
85 fps
fps
GeForce GTX 1050 Ti Max-Q:
13 13 14 ~ 13 fps
GeForce GTX 1070 Ti (Desktop):
39 [X] i7-7740X Asus X299 Prime Intel Core i7-7740X 4.3GHz
GeForce GTX 1070 Ti (Desktop)
min:
34 fps, max:
45 fps
fps
GeForce GTX 1050 Ti Max-Q:
92.7 fps
GeForce GTX 1070 Ti (Desktop):
101 [X] Intel Core i7-4790K 4GHz
GeForce GTX 1070 Ti (Desktop)
fps
GeForce GTX 1050 Ti Max-Q:
80.3 fps
GeForce GTX 1070 Ti (Desktop):
89 [X] Intel Core i7-4790K 4GHz
GeForce GTX 1070 Ti (Desktop)
fps
GeForce GTX 1050 Ti Max-Q:
69.4 fps
GeForce GTX 1070 Ti (Desktop):
74.5 [X] Intel Core i7-4790K 4GHz
GeForce GTX 1070 Ti (Desktop)
fps
GeForce GTX 1050 Ti Max-Q:
39.5 fps
GeForce GTX 1070 Ti (Desktop):
66.7 [X] Intel Core i7-4790K 4GHz
GeForce GTX 1070 Ti (Desktop)
fps
GeForce GTX 1070 Ti (Desktop):
154 [X] Intel Core i7-4790K 4GHz
GeForce GTX 1070 Ti (Desktop)
min:
101 fps, max:
189 fps
fps
GeForce GTX 1070 Ti (Desktop):
100 [X] Intel Core i7-4790K 4GHz
GeForce GTX 1070 Ti (Desktop)
min:
77 fps, max:
115 fps
fps
GeForce GTX 1070 Ti (Desktop):
82 [X] Intel Core i7-4790K 4GHz
GeForce GTX 1070 Ti (Desktop)
min:
58 fps, max:
97 fps
fps
GeForce GTX 1070 Ti (Desktop):
59.1 [X] Intel Core i7-4790K 4GHz
GeForce GTX 1070 Ti (Desktop)
min:
44 fps, max:
74 fps
fps
GeForce GTX 1070 Ti (Desktop):
42.4 [X] Intel Core i7-4790K 4GHz
GeForce GTX 1070 Ti (Desktop)
min:
33 fps, max:
50 fps
fps
GeForce GTX 1070 Ti (Desktop):
22.7 [X] Intel Core i7-4790K 4GHz
GeForce GTX 1070 Ti (Desktop)
min:
18 fps, max:
27 fps
fps
GeForce GTX 1050 Ti Max-Q:
61.5 75.1 ~ 68 fps
GeForce GTX 1070 Ti (Desktop):
146 [X] Intel Core i7-4790K 4GHz
GeForce GTX 1070 Ti (Desktop)
min:
93 fps, max:
194 fps
fps
GeForce GTX 1050 Ti Max-Q:
36.6 37.7 ~ 37 fps
GeForce GTX 1070 Ti (Desktop):
87 [X] Intel Core i7-4790K 4GHz
GeForce GTX 1070 Ti (Desktop)
min:
69 fps, max:
110 fps
fps
GeForce GTX 1050 Ti Max-Q:
23.3 25 ~ 24 fps
GeForce GTX 1070 Ti (Desktop):
63 [X] Intel Core i7-4790K 4GHz
GeForce GTX 1070 Ti (Desktop)
max:
92 fps
fps
GeForce GTX 1050 Ti Max-Q:
9.2 fps
GeForce GTX 1070 Ti (Desktop):
27.7 [X] Intel Core i7-4790K 4GHz
GeForce GTX 1070 Ti (Desktop)
max:
42 fps
fps
GeForce GTX 1070 Ti (Desktop):
109 [X] Intel Core i7-4790K 4GHz
GeForce GTX 1070 Ti (Desktop)
min:
78 fps, max:
132 fps
fps
GeForce GTX 1070 Ti (Desktop):
72 [X] Intel Core i7-4790K 4GHz
GeForce GTX 1070 Ti (Desktop)
min:
61 fps, max:
89 fps
fps
GeForce GTX 1070 Ti (Desktop):
36 [X] Intel Core i7-4790K 4GHz
GeForce GTX 1070 Ti (Desktop)
min:
32 fps, max:
39 fps
fps
GeForce GTX 1050 Ti Max-Q:
92.3 fps
GeForce GTX 1050 Ti Max-Q:
42 fps
GeForce GTX 1050 Ti Max-Q:
34.3 fps
GeForce GTX 1050 Ti Max-Q:
30.4 fps
GeForce GTX 1070 Ti (Desktop):
117 [X] Intel Core i7-4790K 4GHz
GeForce GTX 1070 Ti (Desktop)
min:
106 fps, max:
130 fps
fps
GeForce GTX 1070 Ti (Desktop):
77 [X] Intel Core i7-4790K 4GHz
GeForce GTX 1070 Ti (Desktop)
min:
70 fps, max:
85 fps
fps
GeForce GTX 1070 Ti (Desktop):
38 [X] Intel Core i7-4790K 4GHz
GeForce GTX 1070 Ti (Desktop)
min:
34 fps, max:
44 fps
fps
GeForce GTX 1070 Ti (Desktop):
122 [X] Intel Core i7-4790K 4GHz
GeForce GTX 1070 Ti (Desktop)
min:
86 fps, max:
155 fps
fps
GeForce GTX 1070 Ti (Desktop):
85 [X] Intel Core i7-4790K 4GHz
GeForce GTX 1070 Ti (Desktop)
min:
57 fps, max:
102 fps
fps
GeForce GTX 1070 Ti (Desktop):
45 [X] Intel Core i7-4790K 4GHz
GeForce GTX 1070 Ti (Desktop)
min:
30 fps, max:
52 fps
fps
GeForce GTX 1050 Ti Max-Q:
58 fps
GeForce GTX 1070 Ti (Desktop):
103 [X] Intel Core i7-4790K 4GHz
GeForce GTX 1070 Ti (Desktop)
min:
60 fps, max:
143 fps
fps
GeForce GTX 1050 Ti Max-Q:
41 fps
GeForce GTX 1070 Ti (Desktop):
92 [X] Intel Core i7-4790K 4GHz
GeForce GTX 1070 Ti (Desktop)
min:
55 fps, max:
133 fps
fps
GeForce GTX 1050 Ti Max-Q:
33 fps
GeForce GTX 1070 Ti (Desktop):
88 [X] Intel Core i7-4790K 4GHz
GeForce GTX 1070 Ti (Desktop)
min:
53 fps, max:
126 fps
fps
GeForce GTX 1050 Ti Max-Q:
27 fps
GeForce GTX 1070 Ti (Desktop):
75 [X] Intel Core i7-4790K 4GHz
GeForce GTX 1070 Ti (Desktop)
min:
30 fps, max:
117 fps
fps
GeForce GTX 1070 Ti (Desktop):
58 [X] Intel Core i7-4790K 4GHz
GeForce GTX 1070 Ti (Desktop)
min:
33 fps, max:
104 fps
fps
GeForce GTX 1050 Ti Max-Q:
13 fps
GeForce GTX 1070 Ti (Desktop):
34 [X] Intel Core i7-4790K 4GHz
GeForce GTX 1070 Ti (Desktop)
min:
24 fps, max:
51 fps
fps
GeForce GTX 1050 Ti Max-Q:
119.5 fps
GeForce GTX 1050 Ti Max-Q:
69.4 fps
GeForce GTX 1050 Ti Max-Q:
64.3 fps
GeForce GTX 1050 Ti Max-Q:
57.9 fps
GeForce GTX 1050 Ti Max-Q:
18.9 fps
100%
Iris Plus Graphics 640:
13.8 fps
100%
Iris Plus Graphics 640:
28 fps
375%
GeForce GTX 1050 Ti Max-Q:
105 fps
589%
GeForce GTX 1070 Ti (Desktop):
165 [X] Intel Core i7-4790K 4GHz
GeForce GTX 1070 Ti (Desktop)
min:
76 fps, max:
225 fps
fps
GeForce GTX 1050 Ti Max-Q:
55 fps
GeForce GTX 1070 Ti (Desktop):
136 [X] Intel Core i7-4790K 4GHz
GeForce GTX 1070 Ti (Desktop)
min:
66 fps, max:
190 fps
fps
GeForce GTX 1050 Ti Max-Q:
41 fps
GeForce GTX 1070 Ti (Desktop):
109 [X] Intel Core i7-4790K 4GHz
GeForce GTX 1070 Ti (Desktop)
min:
49 fps, max:
169 fps
fps
GeForce GTX 1050 Ti Max-Q:
31 fps
GeForce GTX 1070 Ti (Desktop):
85 [X] Intel Core i7-4790K 4GHz
GeForce GTX 1070 Ti (Desktop)
min:
43 fps, max:
169 fps
fps
GeForce GTX 1050 Ti Max-Q:
13 fps
GeForce GTX 1070 Ti (Desktop):
34 [X] Intel Core i7-4790K 4GHz
GeForce GTX 1070 Ti (Desktop)
min:
21 fps, max:
50 fps
fps
100%
Iris Plus Graphics 640:
69.5 (!) [X] Microsoft Surface Laptop i7 Intel Core i7-7660U 2.5GHz
Iris Plus Graphics 640
min:
59 fps, max:
78 fps
fps
100%
Iris Plus Graphics 640:
38.8 (!) [X] Microsoft Surface Laptop i7 Intel Core i7-7660U 2.5GHz
Iris Plus Graphics 640
min:
34 fps, max:
43 fps
fps
GeForce GTX 1070 Ti (Desktop):
47.1 [X] Intel Core i7-4790K 4GHz
GeForce GTX 1070 Ti (Desktop)
min:
44 fps, max:
51 fps
fps
GeForce GTX 1070 Ti (Desktop):
17.3 [X] Intel Core i7-4790K 4GHz
GeForce GTX 1070 Ti (Desktop)
min:
16 fps, max:
18 fps
fps
100%
Iris Plus Graphics 640:
33 38 ~ 36 fps
100%
Iris Plus Graphics 640:
15 15 ~ 15 fps
GeForce GTX 1070 Ti (Desktop):
106 [X] Intel Core i7-4790K 4GHz
GeForce GTX 1070 Ti (Desktop)
min:
95 fps, max:
113 fps
fps
GeForce GTX 1070 Ti (Desktop):
52 [X] Intel Core i7-4790K 4GHz
GeForce GTX 1070 Ti (Desktop)
min:
47 fps, max:
55 fps
fps
100%
Iris Plus Graphics 640:
22.9 fps
GeForce GTX 1050 Ti Max-Q:
129.8 fps
100%
Iris Plus Graphics 640:
99 fps
125%
GeForce GTX 1050 Ti Max-Q:
123.6 fps
100%
Iris Plus Graphics 640:
48 fps
241%
GeForce GTX 1050 Ti Max-Q:
115.7 fps
100%
Iris Plus Graphics 640:
31.8 fps
354%
GeForce GTX 1050 Ti Max-Q:
112.6 fps
GeForce GTX 1050 Ti Max-Q:
65.2 fps
GeForce GTX 1070 Ti (Desktop):
152 [X] Intel Core i7-4790K 4GHz
GeForce GTX 1070 Ti (Desktop)
min:
130 fps
fps
100%
Iris Plus Graphics 640:
27.5 (!) [X] Microsoft Surface Pro (2017) i7 Intel Core i7-7660U 2.5GHz
Iris Plus Graphics 640
min:
22 fps, max:
31 fps
fps
GeForce GTX 1070 Ti (Desktop):
57.9 [X] Intel Core i7-4790K 4GHz
GeForce GTX 1070 Ti (Desktop)
min:
51 fps, max:
69 fps
fps
271%
GeForce GTX 1050 Ti Max-Q:
249.1 fps
423%
GeForce GTX 1050 Ti Max-Q:
169.1 fps
402%
GeForce GTX 1050 Ti Max-Q:
112.5 fps
796%
GeForce GTX 1070 Ti (Desktop):
223 [X] Intel Core i7-4790K 4GHz
GeForce GTX 1070 Ti (Desktop)
min:
176 fps, max:
252 fps
fps
GeForce GTX 1050 Ti Max-Q:
42.3 fps
GeForce GTX 1070 Ti (Desktop):
92 [X] Intel Core i7-4790K 4GHz
GeForce GTX 1070 Ti (Desktop)
min:
76 fps, max:
133 fps
fps
100%
Iris Plus Graphics 640:
39.9 45.4 ~ 43 fps
331%
GeForce GTX 1050 Ti Max-Q:
142.4 fps
100%
Iris Plus Graphics 640:
17.9 18.1 ~ 18 fps
476%
GeForce GTX 1050 Ti Max-Q:
85.6 fps
100%
Iris Plus Graphics 640:
14.8 fps
461%
GeForce GTX 1050 Ti Max-Q:
68.3 fps
GeForce GTX 1050 Ti Max-Q:
58.9 fps
GeForce GTX 1050 Ti Max-Q:
21.7 fps
100%
Iris Plus Graphics 640:
33.8 fps
100%
Iris Plus Graphics 640:
20.4 fps
100%
Iris Plus Graphics 640:
16 16.6 ~ 16 fps
519%
GeForce GTX 1050 Ti Max-Q:
68.6 96.7 ~ 83 fps
GeForce GTX 1070 Ti (Desktop):
54.2 [X] Intel Core i7-4790K 4GHz
GeForce GTX 1070 Ti (Desktop)
min:
47 fps, max:
62 fps
fps
GeForce GTX 1050 Ti Max-Q:
13.9 14.5 ~ 14 fps
GeForce GTX 1070 Ti (Desktop):
35.8 [X] Intel Core i7-4790K 4GHz
GeForce GTX 1070 Ti (Desktop)
min:
27 fps, max:
40 fps
fps
100%
Iris Plus Graphics 640:
30.8 33.5 ~ 32 fps
456%
GeForce GTX 1050 Ti Max-Q:
113.6 179.3 ~ 146 fps
100%
Iris Plus Graphics 640:
11.8 12.7 ~ 12 fps
550%
GeForce GTX 1050 Ti Max-Q:
63.8 68.2 ~ 66 fps
GeForce GTX 1050 Ti Max-Q:
64.9 65.5 ~ 65 fps
GeForce GTX 1070 Ti (Desktop):
156 [X] Intel Core i7-4790K 4GHz
GeForce GTX 1070 Ti (Desktop)
min:
92 fps, max:
189 fps
fps
GeForce GTX 1050 Ti Max-Q:
49.5 50.4 ~ 50 fps
GeForce GTX 1070 Ti (Desktop):
122 [X] Intel Core i7-4790K 4GHz
GeForce GTX 1070 Ti (Desktop)
min:
75 fps, max:
163 fps
fps
GeForce GTX 1050 Ti Max-Q:
19.2 19.2 ~ 19 fps
GeForce GTX 1070 Ti (Desktop):
47.9 [X] Intel Core i7-4790K 4GHz
GeForce GTX 1070 Ti (Desktop)
min:
39 fps, max:
60 fps
fps
GeForce GTX 1070 Ti (Desktop):
67.8 [X] Intel Core i7-4790K 4GHz
GeForce GTX 1070 Ti (Desktop)
min:
51 fps, max:
97 fps
fps
100%
Iris Plus Graphics 640:
42.9 45 ~ 44 fps
100%
Iris Plus Graphics 640:
31.4 fps
100%
Iris Plus Graphics 640:
22.9 fps
100%
Iris Plus Graphics 640:
121 fps
100%
Iris Plus Graphics 640:
91 fps
100%
Iris Plus Graphics 640:
31.6 fps
434%
GeForce GTX 1050 Ti Max-Q:
137.3 fps
100%
Iris Plus Graphics 640:
17.8 fps
588%
GeForce GTX 1050 Ti Max-Q:
104.6 fps
GeForce GTX 1070 Ti (Desktop):
80 [X] Intel Core i7-4790K 4GHz
GeForce GTX 1070 Ti (Desktop)
min:
79 fps, max:
81 fps
fps
394%
GeForce GTX 1050 Ti Max-Q:
89.5 154.8 ~ 122 fps
100%
Iris Plus Graphics 640:
19.6 24.2 ~ 22 fps
468%
GeForce GTX 1050 Ti Max-Q:
85.2 120 ~ 103 fps
100%
Iris Plus Graphics 640:
9.2 11.1 ~ 10 fps
550%
GeForce GTX 1050 Ti Max-Q:
51.7 58.1 ~ 55 fps
GeForce GTX 1050 Ti Max-Q:
49.8 53.1 ~ 51 fps
GeForce GTX 1050 Ti Max-Q:
20.7 21.1 ~ 21 fps
GeForce GTX 1050 Ti Max-Q:
112.5 fps
GeForce GTX 1050 Ti Max-Q:
85.8 fps
GeForce GTX 1050 Ti Max-Q:
51 fps
GeForce GTX 1050 Ti Max-Q:
43 fps
GeForce GTX 1070 Ti (Desktop):
108 [X] Intel Core i7-4790K 4GHz
GeForce GTX 1070 Ti (Desktop)
min:
86 fps, max:
184 fps
fps
GeForce GTX 1070 Ti (Desktop):
91 [X] Intel Core i7-4790K 4GHz
GeForce GTX 1070 Ti (Desktop)
min:
70 fps, max:
133 fps
fps
100%
Iris Plus Graphics 640:
20.2 fps
GeForce GTX 1070 Ti (Desktop):
67.9 [X] DX11
Intel Core i7-4790K 4GHz
GeForce GTX 1070 Ti (Desktop)
min:
53 fps, max:
87 fps
fps
GeForce GTX 1070 Ti (Desktop):
31.9 [X] DX11
Intel Core i7-4790K 4GHz
GeForce GTX 1070 Ti (Desktop)
min:
27 fps, max:
38 fps
fps
476%
GeForce GTX 1050 Ti Max-Q:
285.4 fps
600%
GeForce GTX 1050 Ti Max-Q:
233.9 fps
436%
GeForce GTX 1050 Ti Max-Q:
117.7 fps
100%
Iris Plus Graphics 640:
19.5 fps
362%
GeForce GTX 1050 Ti Max-Q:
70.5 fps
933%
GeForce GTX 1070 Ti (Desktop):
182 [X] Intel Core i7-4790K 4GHz
GeForce GTX 1070 Ti (Desktop)
min:
149 fps, max:
213 fps
fps
GeForce GTX 1050 Ti Max-Q:
37 fps
GeForce GTX 1070 Ti (Desktop):
88.7 [X] Intel Core i7-4790K 4GHz
GeForce GTX 1070 Ti (Desktop)
min:
77 fps, max:
103 fps
fps
GeForce GTX 1050 Ti Max-Q:
63 fps
GeForce GTX 1050 Ti Max-Q:
41.3 fps
GeForce GTX 1050 Ti Max-Q:
35.8 fps
GeForce GTX 1050 Ti Max-Q:
15.7 fps
100%
Iris Plus Graphics 640:
24.9 fps
506%
GeForce GTX 1050 Ti Max-Q:
114.2 137.2 ~ 126 fps
GeForce GTX 1050 Ti Max-Q:
83.4 89.5 ~ 86 fps
GeForce GTX 1050 Ti Max-Q:
41.9 42.5 ~ 42 fps
GeForce GTX 1050 Ti Max-Q:
32.2 34.8 ~ 34 fps
GeForce GTX 1070 Ti (Desktop):
94.6 [X] Intel Core i7-4790K 4GHz
GeForce GTX 1070 Ti (Desktop)
min:
53 fps, max:
133 fps
fps
GeForce GTX 1050 Ti Max-Q:
14.6 15.7 ~ 15 fps
GeForce GTX 1070 Ti (Desktop):
45.6 [X] Intel Core i7-4790K 4GHz
GeForce GTX 1070 Ti (Desktop)
min:
21 fps, max:
59 fps
fps
100%
Iris Plus Graphics 640:
28 fps
100%
Iris Plus Graphics 640:
13 fps
GeForce GTX 1070 Ti (Desktop):
98 [X] Intel Core i7-4790K 4GHz
GeForce GTX 1070 Ti (Desktop)
min:
80 fps, max:
113 fps
fps
GeForce GTX 1070 Ti (Desktop):
41 [X] Intel Core i7-4790K 4GHz
GeForce GTX 1070 Ti (Desktop)
min:
39 fps, max:
45 fps
fps
100%
Iris Plus Graphics 640:
23.5 25.8 ~ 25 fps
100%
Iris Plus Graphics 640:
16.7 19.4 ~ 18 fps
100%
Iris Plus Graphics 640:
9.1 fps
GeForce GTX 1070 Ti (Desktop):
111 [X] DX11
Intel Core i7-4790K 4GHz
GeForce GTX 1070 Ti (Desktop)
min:
101 fps, max:
119 fps
fps
GeForce GTX 1050 Ti Max-Q:
16.8 17.1 ~ 17 fps
GeForce GTX 1070 Ti (Desktop):
46.5 [X] DX11
Intel Core i7-4790K 4GHz
GeForce GTX 1070 Ti (Desktop)
min:
41 fps, max:
52 fps
fps
481%
GeForce GTX 1050 Ti Max-Q:
236.6 263.6 ~ 250 fps
510%
GeForce GTX 1050 Ti Max-Q:
154.6 162.2 ~ 158 fps
535%
GeForce GTX 1050 Ti Max-Q:
90.2 92.7 ~ 91 fps
100%
Iris Plus Graphics 640:
14.2 fps
458%
GeForce GTX 1050 Ti Max-Q:
62.5 67.5 ~ 65 fps
1246%
GeForce GTX 1070 Ti (Desktop):
177 [X] Intel Core i7-4790K 4GHz
GeForce GTX 1070 Ti (Desktop)
min:
106 fps, max:
305 fps
fps
GeForce GTX 1050 Ti Max-Q:
27.7 29.3 ~ 29 fps
GeForce GTX 1070 Ti (Desktop):
77 [X] Intel Core i7-4790K 4GHz
GeForce GTX 1070 Ti (Desktop)
min:
54 fps, max:
113 fps
fps
100%
Iris Plus Graphics 640:
44.7 fps
100%
Iris Plus Graphics 640:
26.2 fps
100%
Iris Plus Graphics 640:
12.9 fps
GeForce GTX 1050 Ti Max-Q:
168.6 fps
GeForce GTX 1050 Ti Max-Q:
143.9 fps
GeForce GTX 1050 Ti Max-Q:
112.7 fps
GeForce GTX 1050 Ti Max-Q:
101 fps
GeForce GTX 1050 Ti Max-Q:
34.4 fps
100%
Iris Plus Graphics 640:
68 92 ~ 80 fps
140%
GeForce GTX 1050 Ti Max-Q:
111.9 fps
178%
GeForce GTX 1070 Ti (Desktop):
142.7 [X] Intel Core i7-4790K 4GHz
GeForce GTX 1070 Ti (Desktop)
min:
125.8 fps
fps
100%
Iris Plus Graphics 640:
55 63.7 ~ 59 fps
177%
GeForce GTX 1050 Ti Max-Q:
104.2 fps
227%
GeForce GTX 1070 Ti (Desktop):
134.2 [X] Intel Core i7-4790K 4GHz
GeForce GTX 1070 Ti (Desktop)
min:
115.5 fps
fps
100%
Iris Plus Graphics 640:
27.6 29.5 ~ 29 fps
338%
GeForce GTX 1050 Ti Max-Q:
98.1 fps
437%
GeForce GTX 1070 Ti (Desktop):
126.6 [X] Intel Core i7-4790K 4GHz
GeForce GTX 1070 Ti (Desktop)
min:
111.1 fps
fps
100%
Iris Plus Graphics 640:
19.8 23 ~ 21 fps
445%
GeForce GTX 1050 Ti Max-Q:
93.5 fps
577%
GeForce GTX 1070 Ti (Desktop):
121.2 [X] Intel Core i7-4790K 4GHz
GeForce GTX 1070 Ti (Desktop)
min:
105.8 fps
fps
GeForce GTX 1050 Ti Max-Q:
46 fps
GeForce GTX 1070 Ti (Desktop):
105 [X] Intel Core i7-4790K 4GHz
GeForce GTX 1070 Ti (Desktop)
min:
95 fps
fps
1542%
GeForce GTX 1070 Ti (Desktop):
293 [X] Intel Core i7-4790K 4GHz
GeForce GTX 1070 Ti (Desktop)
min:
269 fps, max:
321 fps
fps
100%
Iris Plus Graphics 640:
13.4 fps
100%
Iris Plus Graphics 640:
4 fps
1795%
GeForce GTX 1070 Ti (Desktop):
71.8 [X] Intel Core i7-4790K 4GHz
GeForce GTX 1070 Ti (Desktop)
min:
61 fps, max:
80 fps
fps
GeForce GTX 1070 Ti (Desktop):
47.1 [X] Intel Core i7-4790K 4GHz
GeForce GTX 1070 Ti (Desktop)
min:
42 fps, max:
51 fps
fps
100%
Iris Plus Graphics 640:
56.7 fps
265%
GeForce GTX 1050 Ti Max-Q:
150.4 fps
100%
Iris Plus Graphics 640:
28.9 fps
496%
GeForce GTX 1050 Ti Max-Q:
143.3 fps
100%
Iris Plus Graphics 640:
11.8 fps
669%
GeForce GTX 1050 Ti Max-Q:
78.9 fps
GeForce GTX 1050 Ti Max-Q:
34.5 fps
GeForce GTX 1050 Ti Max-Q:
35.5 fps
GeForce GTX 1070 Ti (Desktop):
67 [X] i7-7740X Asus X299 Prime Intel Core i7-7740X 4.3GHz
GeForce GTX 1070 Ti (Desktop)
min:
11.7 fps, P1:
27 fps, max:
202 fps
fps
100%
Iris Plus Graphics 640:
28.6 fps
100%
Iris Plus Graphics 640:
20.2 20.8 ~ 21 fps
100%
Iris Plus Graphics 640:
43.1 60.3 ~ 52 fps
100%
Iris Plus Graphics 640:
29.7 42 ~ 36 fps
100%
Iris Plus Graphics 640:
23.2 30.7 ~ 27 fps
100%
Iris Plus Graphics 640:
8.2 9.9 ~ 9 fps
100%
Iris Plus Graphics 640:
61 68.2 ~ 65 fps
100%
Iris Plus Graphics 640:
40.2 45.1 ~ 43 fps
100%
Iris Plus Graphics 640:
33.5 38.3 ~ 36 fps
100%
Iris Plus Graphics 640:
10.7 12.5 ~ 12 fps
1100%
GeForce GTX 1070 Ti (Desktop):
132 [X] Intel Core i7-4790K 4GHz
GeForce GTX 1070 Ti (Desktop)
min:
58 fps, max:
235 fps
fps
100%
Iris Plus Graphics 640:
103 132.6 ~ 118 fps
100%
Iris Plus Graphics 640:
54.1 68.7 ~ 61 fps
100%
Iris Plus Graphics 640:
37 47.1 ~ 42 fps
100%
Iris Plus Graphics 640:
17.2 21.6 ~ 19 fps
GeForce GTX 1050 Ti Max-Q:
228.2 fps
GeForce GTX 1050 Ti Max-Q:
202.6 fps
GeForce GTX 1050 Ti Max-Q:
202.1 fps
100%
Iris Plus Graphics 640:
35.2 fps
483%
GeForce GTX 1050 Ti Max-Q:
170.1 fps
GeForce GTX 1050 Ti Max-Q:
433.4 fps
GeForce GTX 1050 Ti Max-Q:
200.4 fps
GeForce GTX 1050 Ti Max-Q:
186.7 fps
GeForce GTX 1050 Ti Max-Q:
126.7 fps
100%
Iris Plus Graphics 640:
28.5 fps
Average Gaming Intel Iris Plus Graphics 640 → 100% Average Gaming 30-70 fps → 100%
Average Gaming NVIDIA GeForce GTX 1050 Ti Max-Q → 450% Average Gaming 30-70 fps → 503%
Average Gaming NVIDIA GeForce GTX 1070 Ti (Desktop) → 857%  Deutsch
 English
 Español
 Français
 Italiano
 Nederlands
 Polski
 Português
 Русский
 Türkçe
 Svenska
 Chinese
 Magyar