Intel Iris Graphics 540 vs Intel HD Graphics (Cherry Trail)
Intel Iris Graphics 540 ► remove from comparison
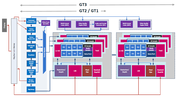
Die Intel Iris Graphics 540 (GT3e) ist eine Prozessorgrafikkarte der im Sommer 2015 vorgestellten Skylake-Generation. Als Nachfolger der HD Graphics 6000 (Broadwell) ist die Iris Graphics 540 dabei in den ULV-Modellen der 15-Watt-Klasse zu finden und besitzt erstmals einen dedizierten eDRAM-Cache mit 64 MB Kapazität. Die sogenannte GT3e-Ausbaustufe der Skylake-GPU verfügt weiterhin über 48 Execution Units (EUs), die je nach Modell mit bis zu 1.050 MHz takten.
Neben dem eDRAM-Cache kann die Iris 540 auch über das Interface des Prozessors auf den Hauptspeicher zugreifen (2x 64 Bit DDR3L-1600/LPDDR3-1866/DDR4-2133).
Performance
Die exakte Leistung der Iris Graphics 540 hängt vom jeweiligen CPU-Modell ab, da sich die Maximaltaktrate leicht unterscheiden kann. Zum anderen beeinflusst auch der verwendete Speicher (DDR3/DDR4) die Performance.
Die höchste Leistung erreichen hochtaktende Core-i7-Ableger wie der Core i7-6650U . Je nach Spiel ordnet sich die Iris 540 zwischen einer dedizierten GeForce 920M und GeForce 940M ein und kann aktuelle Spiele (Stand 2015) zumindest in niedrigen, selten auch mittleren Einstellungen flüssig darstellen.
Features
Der überarbeitete Videodecoder decodiert nun auch H.265-/HEVC-Videos vollständig in Hardware und arbeitet dadurch deutlich effizienter als bislang. Die Bildausgabe erfolgt über DP 1.2/eDP 1.3 (max. 3.840 x 2.160 @ 60 Hz), wohingegen HDMI nur in der älteren Version 1.4a angeboten wird. Ein HDMI-2.0-Anschluss kann aber mittels Konverter von DisplayPort ergänzt werden. Maximal lassen sich drei Displays parallel angesteuern.
Leistungsaufnahme
Die Iris Graphics 540 ist in ULV-Prozessoren der 15-Watt-Klasse zu finden und damit für schlanke Note- und Ultrabooks geeignet.
Intel HD Graphics (Cherry Trail) ► remove from comparison
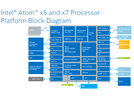
Die Intel HD Graphics (Cherry Trail) ist eine in den Tablet-SoCs der Cherry-Trail-Serie (z.B. Atom x7-Z8700 ) integrierte Grafikeinheit. Sie basiert auf der gleichen Architektur wie die GPU verschiedener Broadwell-Prozessoren (z.B. HD Graphics 5300 ), bietet allerdings deutlich weniger Shadereinheiten und geringere Taktraten. Die genauen Spezifikationen hängen vom jeweiligen SoC ab:
Die schnellste Variante mit 16 EUs und maximal 600 MHz schlägt die ältere HD Graphics (Bay Trail) um Faktor zwei, womit sich die GPU etwas oberhalb einer Qualcomm Adreno 330 oder PowerVR G6430 , jedoch deutlich unter einer Adreno 420 oder GX6450 einordnet. Auch Nvidias Tegra-SoCs K1 und X1 rechnen weitaus schneller.
Unter Windows werden sich Anwender deshalb weiter auf sehr alte und anspruchslose Spiele beschränken müssen, wohingegen moderne Android-Games auch in hohen Auflösungen zumeist flüssig dargestellt werden sollten. Der x7-Z8700 war z.B. nur knapp in der Lage Team Fortress 2 in minimalen Details und 1280x720 flüssig wiederzugeben (11 - 69 fps).
Videos kann die GPU auch in 4K/H.265 flüssig wiedergeben (je nach Bitrate und Farbtiefe).
Die Intel HD Graphics Grafikkarte in den Cherry Trail SoCs unterstützt nach unseren Tests mit dem MS Surface 3 mit Atom x7-Z8700 nur DisplayPort 1.1 und damit lediglich 30 Hz bei 4K (3.840 x 2.160).
Intel Iris Graphics 540 Intel HD Graphics (Cherry Trail) HD Graphics Serie Codename Skylake GT3e Cherry Trail Architektur Gen. 9 Skylake Gen. 8 Pipelines 48 - unified 16 - unified Kerntakt 300 - 1050 (Boost) MHz 200 - 600 (Boost) MHz Speicherbandbreite eDRAM + 64/128 Bit 64/128 Bit Speichertyp eDRAM Max. Speichergröße 64 MB Shared Memory ja ja API DirectX 12_1, OpenGL 4.4 DirectX 12 (FL 11_1), Shader 5.0, OpenGL 4.3 Herstellungsprozess 14 nm 14 nm Features QuickSync Erscheinungsdatum 01.09.2015 02.03.2015
Benchmarks Performance Rating - 3DMark 11 + Fire Strike + Time Spy - Iris Graphics 540
0.6 pt (2%)
...
...
max:
Performance Rating - 3DMark 11 + Fire Strike + Time Spy - HD Graphics (Cherry Trail)
0.1 pt (0%)
Intel HD Graphics (Cherry Trail)
...
max:
3DMark - 3DMark Ice Storm Unlimited Graphics
min: 116490 avg: 126223 median: 126078 (13%) max: 136248 Points
min: 18563 avg: 20873 median: 19303 (2%) max: 27537 Points
3DMark - 3DMark Ice Storm Extreme Graphics
min: 45185 avg: 56792 median: 56791.5 (7%) max: 68398 Points
3DMark - 3DMark Cloud Gate Score
min: 6730 avg: 7255 median: 7235 (8%) max: 7822 Points
min: 769 avg: 1454 median: 1488 (2%) max: 1905 Points
3DMark - 3DMark Cloud Gate Graphics
min: 9392 avg: 10896 median: 11327 (3%) max: 11893 Points
min: 1537 avg: 1851 median: 1783.5 (0%) max: 2272 Points
3DMark - 3DMark Fire Strike Standard Score
min: 1106 avg: 1268 median: 1354 (2%) max: 1395 Points
min: 174 avg: 390.4 median: 248 (0%) max: 1059 Points
3DMark - 3DMark Fire Strike Standard Graphics
min: 1193 avg: 1358 median: 1448 (2%) max: 1479 Points
min: 193 avg: 233 median: 225 (0%) max: 281 Points
3DMark - 3DMark Ice Storm Graphics
min: 67714 avg: 81160 median: 82680.5 (10%) max: 91565 Points
min: 7544 avg: 16078 median: 17063.5 (2%) max: 23395 Points
3DMark - 3DMark Sling Shot (ES 3.0) Unlimited
min: 1445 avg: 1525 median: 1525 (7%) max: 1605 Points
3DMark - 3DMark Sling Shot (ES 3.0) Unlimited Graphics
min: 1598 avg: 1684 median: 1684 (4%) max: 1770 Points
3DMark - 3DMark Sling Shot Extreme (ES 3.1) Unlimited
min: 1072 avg: 1215 median: 1159 (6%) max: 1414 Points
3DMark - 3DMark Sling Shot Extreme (ES 3.1) Unlimited Graphics
min: 1058 avg: 1251 median: 1142 (3%) max: 1554 Points
3DMark - 3DMark Sling Shot (ES 3.0)
min: 1353 avg: 1429 median: 1398 (12%) max: 1593 Points
3DMark - 3DMark Sling Shot (ES 3.0) Graphics
min: 1300 avg: 1505 median: 1530 (9%) max: 1732 Points
3DMark - 3DMark Sling Shot Extreme (ES 3.1)
min: 1037 avg: 1133 median: 1070 (5%) max: 1319 Points
3DMark - 3DMark Sling Shot Extreme (ES 3.1) Graphics
min: 973 avg: 1102 median: 1054 (4%) max: 1261 Points
3DMark 11 - 3DM11 Performance Score
min: 2039 avg: 2340 median: 2364 (3%) max: 2624 Points
min: 314 avg: 359.4 median: 343 (0%) max: 562 Points
3DMark 11 - 3DM11 Performance GPU
min: 1898 avg: 2187 median: 2211.5 (2%) max: 2450 Points
min: 278 avg: 319.9 median: 298 (0%) max: 494 Points
3DMark Vantage 3DM Vant. Perf. total + Intel Iris Graphics 540 3DMark Vantage - 3DM Vant. Perf. total
min: 8647 avg: 8828 median: 8828 (3%) max: 9009 Points
3DM Vant. Perf. GPU no PhysX + Intel Iris Graphics 540 3DMark Vantage - 3DM Vant. Perf. GPU no PhysX
min: 8052 avg: 8220 median: 8219.5 (4%) max: 8387 Points
3DMark 06 3DMark 06 - Standard 1280x1024 + Intel Iris Graphics 540
min: 13403 avg: 13569 median: 13568.5 (18%) max: 13734 Points
3DMark 06 - Standard 1280x1024 + Intel HD Graphics (Cherry Trail)
min: 2403 avg: 2833 median: 2595 (3%) max: 3330 Points
3DMark 06 - Standard 1024x768 + Intel HD Graphics (Cherry Trail)
2877 Points (4%)
Unigine Valley 1.0 - Unigine Valley 1.0 DX
6.5 fps (2%)
1.2 fps (0%)
Unigine Heaven 2.1 - Heaven 2.1 high
5.7 fps (1%)
SPECviewperf 12 specvp12 sw-03 + Intel Iris Graphics 540 SPECviewperf 12 - specvp12 sw-03
min: 26.2 avg: 26.3 median: 26.3 (7%) max: 26.3 fps
specvp12 snx-02 + Intel Iris Graphics 540 SPECviewperf 12 - specvp12 snx-02
min: 2.6 avg: 2.8 median: 2.8 (0%) max: 2.9 fps
specvp12 showcase-01 + Intel Iris Graphics 540 SPECviewperf 12 - specvp12 showcase-01
min: 8.2 avg: 8.5 median: 8.5 (2%) max: 8.8 fps
specvp12 mediacal-01 + Intel Iris Graphics 540 SPECviewperf 12 - specvp12 mediacal-01
min: 2.7 avg: 3.9 median: 3.9 (1%) max: 5.1 fps
specvp12 maya-04 + Intel Iris Graphics 540 SPECviewperf 12 - specvp12 maya-04
min: 16.5 avg: 16.8 median: 16.8 (5%) max: 17 fps
specvp12 energy-01 + Intel Iris Graphics 540 SPECviewperf 12 - specvp12 energy-01
min: 0.08 avg: 0.2 median: 0.2 (0%) max: 0.33 fps
specvp12 creo-01 + Intel Iris Graphics 540 SPECviewperf 12 - specvp12 creo-01
10.8 fps (4%)
specvp12 catia-04 + Intel Iris Graphics 540 SPECviewperf 12 - specvp12 catia-04
min: 15.2 avg: 15.4 median: 15.4 (3%) max: 15.5 fps
specvp12 3dsmax-05 + Intel Iris Graphics 540 SPECviewperf 12 - specvp12 3dsmax-05
14.6 fps (3%)
Cinebench R10 Cinebench R10 Shading (32bit) + Intel Iris Graphics 540 Cinebench R10 - Cinebench R10 Shading (32bit)
min: 7271 avg: 8395 median: 8277.5 (6%) max: 9755 Points
Cinebench R10 Shading (32bit) + Intel HD Graphics (Cherry Trail)
min: 1192 avg: 2009 median: 1973 (1%) max: 2551 Points
Cinebench R11.5 Cinebench R11.5 OpenGL 64 Bit + Intel Iris Graphics 540 Cinebench R11.5 - Cinebench R11.5 OpenGL 64 Bit
min: 41.07 avg: 46.9 median: 47.9 (16%) max: 50.6 fps
Cinebench R11.5 OpenGL 64 Bit + Intel HD Graphics (Cherry Trail)
min: 4.01 avg: 8.8 median: 8.4 (3%) max: 11.71 fps
Cinebench R15 Cinebench R15 OpenGL 64 Bit + Intel Iris Graphics 540 Cinebench R15 - Cinebench R15 OpenGL 64 Bit
min: 35.34 avg: 52.5 median: 55.3 (3%) max: 62.1 fps
Cinebench R15 OpenGL 64 Bit + Intel HD Graphics (Cherry Trail)
min: 6.64 avg: 10.3 median: 9.7 (1%) max: 15.52 fps
Cinebench R15 OpenGL Ref. Match 64 Bit + Intel Iris Graphics 540 Cinebench R15 - Cinebench R15 OpenGL Ref. Match 64 Bit
min: 97.8 avg: 98.1 median: 97.8 (98%) max: 99.3 %
Cinebench R15 OpenGL Ref. Match 64 Bit + Intel HD Graphics (Cherry Trail)
min: 98 avg: 98 median: 98 (98%) max: 98.6 %
GFXBench - GFXBench Car Chase Offscreen
42 fps (5%)
min: 6.3 avg: 7.3 median: 7 (1%) max: 9 fps
GFXBench 3.1 - GFXBench Manhattan ES 3.1 Offscreen
60.4 fps (1%)
min: 9.2 avg: 10.8 median: 11 (0%) max: 13 fps
GFXBench 3.0 - GFXBench 3.0 Manhattan Offscreen
86 fps (5%)
min: 8.4 avg: 13.8 median: 13.5 (1%) max: 18 fps
GFXBench (DX / GLBenchmark) 2.7 GFXBench T-Rex HD Offscreen C24Z16 + Intel Iris Graphics 540 GFXBench (DX / GLBenchmark) 2.7 - GFXBench T-Rex HD Offscreen C24Z16
183 fps (1%)
GFXBench T-Rex HD Offscreen C24Z16 + Intel HD Graphics (Cherry Trail) min: 22 avg: 30.5 median: 32 (0%) max: 38.5 fps
LuxMark v2.0 64Bit - LuxMark v2.0 Room GPU
min: 258 avg: 291.8 median: 301.5 (1%) max: 306 Samples/s
min: 48 avg: 58.7 median: 59 (0%) max: 69 Samples/s
LuxMark v2.0 64Bit - LuxMark v2.0 Sala GPU
min: 614 avg: 700 median: 712.5 (1%) max: 762 Samples/s
min: 69 avg: 87.7 median: 89 (0%) max: 105 Samples/s
ComputeMark v2.1 - ComputeMark v2.1 Result
min: 1257 avg: 1483 median: 1525.5 (2%) max: 1625 Points
277 Points (0%)
Average Benchmarks Intel Iris Graphics 540 → 100% n=21 Average Benchmarks Intel HD Graphics (Cherry Trail) → 21% n=21
- Bereich der Benchmarkergebnisse für diese Grafikkarte
- Durchschnittliche Benchmarkergebnisse für diese Grafikkarte
* Smaller numbers mean a higher performance
1 This benchmark is not used for the average calculation
Spiele-Benchmarks Die folgenden Benchmarks basieren auf unseren Spieletests mit Testnotebooks. Die Performance dieser Grafikkarte bei den gelisteten Spielen ist abhängig von der verwendeten CPU, Speicherausstattung, Treiber und auch Betriebssystem. Dadurch müssen die untenstehenden Werte nicht repräsentativ sein. Detaillierte Informationen über das verwendete System sehen Sie nach einem Klick auf den fps-Wert.
100%
Iris Graphics 540:
114 fps
100%
Iris Graphics 540:
94 fps
100%
Iris Graphics 540:
74 fps
100%
Iris Graphics 540:
71 fps
100%
Iris Graphics 540:
174 fps
100%
Iris Graphics 540:
24.4 fps
100%
Iris Graphics 540:
9.5 fps
100%
Iris Graphics 540:
23.6 fps
100%
Iris Graphics 540:
16.9 fps
100%
Iris Graphics 540:
13.6 fps
HD Graphics (Cherry Trail):
21.4 fps
HD Graphics (Cherry Trail):
15.5 fps
100%
Iris Graphics 540:
17.3 fps
100%
Iris Graphics 540:
30 fps
100%
Iris Graphics 540:
27.3 fps
100%
Iris Graphics 540:
55.3 fps
100%
Iris Graphics 540:
38.6 fps
100%
Iris Graphics 540:
14.3 fps
100%
Iris Graphics 540:
112 fps
20%
HD Graphics (Cherry Trail):
22.6 [X] Chuwi Hi12 Intel Atom x5-Z8300 1.4GHz
HD Graphics (Cherry Trail)
min:
21 fps, max:
27 fps
fps
100%
Iris Graphics 540:
76 fps
100%
Iris Graphics 540:
30.6 fps
100%
Iris Graphics 540:
19.1 fps
100%
Iris Graphics 540:
43.4 fps
100%
Iris Graphics 540:
25.3 fps
100%
Iris Graphics 540:
12.6 fps
100%
Iris Graphics 540:
11.3 fps
100%
Iris Graphics 540:
61 (!) [X] Apple MacBook Pro 13 2016 Intel Core i5-6360U 2GHz
Iris Graphics 540
Problem during benchmarking occured: Leichte grafische Probleme min:
51 fps, max:
75 fps
fps
100%
Iris Graphics 540:
72 (!) [X] Apple MacBook Pro 13 2016 Intel Core i5-6360U 2GHz
Iris Graphics 540
Problem during benchmarking occured: Leichte grafische Probleme min:
61 fps, max:
80 fps
fps
Iris Graphics 540:
0 (!) fps
100%
Iris Graphics 540:
16.7 20.5 ~ 19 fps
100%
Iris Graphics 540:
35 fps
100%
Iris Graphics 540:
20.5 fps
100%
Iris Graphics 540:
58.2 68 ~ 63 fps
100%
Iris Graphics 540:
40 47.6 ~ 44 fps
100%
Iris Graphics 540:
18.9 21.3 ~ 20 fps
100%
Iris Graphics 540:
31.5 fps
100%
Iris Graphics 540:
13.3 fps
100%
Iris Graphics 540:
17.3 fps
100%
Iris Graphics 540:
13.5 17.7 ~ 16 fps
100%
Iris Graphics 540:
13.8 fps
100%
Iris Graphics 540:
7.6 fps
100%
Iris Graphics 540:
21.7 27.9 (!) [X] Intel NUC6i5SYH Intel Core i5-6260U 1.8GHz
Iris Graphics 540
Problem during benchmarking occured: Leichte grafische Probleme some missing textures in benchmarkmin:
20 fps, max:
35 fps
~ 25 fps
100%
Iris Graphics 540:
12.9 fps
100%
Iris Graphics 540:
22 22 23 ~ 22 fps
100%
Iris Graphics 540:
10 11 12 ~ 11 fps
100%
Iris Graphics 540:
8 fps
100%
Iris Graphics 540:
18 27.6 ~ 23 fps
100%
Iris Graphics 540:
6.7 8.9 ~ 8 fps
100%
Iris Graphics 540:
21.5 23.7 24.9 (!) [X] Apple MacBook Pro 13 2016 Intel Core i5-6360U 2GHz
Iris Graphics 540
Problem during benchmarking occured: Leichte grafische Probleme wrong cloudsmin:
23 fps, max:
27 fps
~ 23 fps
Iris Graphics 540:
0 (!) fps
100%
Iris Graphics 540:
39.1 44.3 ~ 42 fps
27%
HD Graphics (Cherry Trail):
11.5 fps
100%
Iris Graphics 540:
24.2 27.4 ~ 26 fps
27%
HD Graphics (Cherry Trail):
7 fps
100%
Iris Graphics 540:
13.5 16.8 ~ 15 fps
100%
Iris Graphics 540:
11 13.6 ~ 12 fps
100%
Iris Graphics 540:
35.9 fps
100%
Iris Graphics 540:
28.6 fps
100%
Iris Graphics 540:
15.5 fps
100%
Iris Graphics 540:
14.2 fps
100%
Iris Graphics 540:
40.2 fps
22%
HD Graphics (Cherry Trail):
8.8 fps
100%
Iris Graphics 540:
22.9 fps
21%
HD Graphics (Cherry Trail):
4.8 fps
Iris Graphics 540:
0 (!) fps
100%
Iris Graphics 540:
4.9 5.2 ~ 5 fps
100%
Iris Graphics 540:
23.2 fps
21%
HD Graphics (Cherry Trail):
8.1 fps
19%
HD Graphics (Cherry Trail):
3.9 fps
100%
Iris Graphics 540:
65 (!) [X] Intel NUC6i5SYH Intel Core i5-6260U 1.8GHz
Iris Graphics 540
Problem during benchmarking occured: slight slowdownsmin:
56 fps, max:
72 fps
fps
100%
Iris Graphics 540:
38.8 (!) [X] Intel NUC6i5SYH Intel Core i5-6260U 1.8GHz
Iris Graphics 540
Problem during benchmarking occured: slow gameplaymin:
33 fps, max:
43 fps
fps
100%
Iris Graphics 540:
78.7 120 ~ 99 fps
15%
HD Graphics (Cherry Trail):
13.9 [X] Chuwi Hi12 Intel Atom x5-Z8300 1.4GHz
HD Graphics (Cherry Trail)
min:
7 fps, max:
19 fps
16.8 ~ 15 fps
100%
Iris Graphics 540:
18.7 25.4 ~ 22 fps
100%
Iris Graphics 540:
48.6 58 ~ 53 fps
28%
HD Graphics (Cherry Trail):
15.1 fps
100%
Iris Graphics 540:
28.9 43.3 ~ 36 fps
27%
HD Graphics (Cherry Trail):
9.8 fps
100%
Iris Graphics 540:
13.9 16.7 ~ 15 fps
100%
Iris Graphics 540:
28.9 34.3 ~ 32 fps
100%
Iris Graphics 540:
13.2 16.9 ~ 15 fps
29%
HD Graphics (Cherry Trail):
20 [X] Chuwi Hi12 Intel Atom x5-Z8300 1.4GHz
HD Graphics (Cherry Trail)
min:
18 fps
fps
29%
HD Graphics (Cherry Trail):
15.2 [X] Chuwi Hi12 Intel Atom x5-Z8300 1.4GHz
HD Graphics (Cherry Trail)
min:
13 fps
fps
24%
HD Graphics (Cherry Trail):
7.2 [X] Chuwi Hi12 Intel Atom x5-Z8300 1.4GHz
HD Graphics (Cherry Trail)
min:
6 fps
fps
100%
Iris Graphics 540:
19.1 34.6 ~ 27 fps
Iris Graphics 540:
0 (!) fps
100%
Iris Graphics 540:
119.2 149 177 (!) [X] Intel NUC6i5SYH Intel Core i5-6260U 1.8GHz
Iris Graphics 540
Problem during benchmarking occured: Leichte grafische Probleme reflections on hood too muchmin:
156 fps, max:
206 fps
~ 148 fps
14%
HD Graphics (Cherry Trail):
20.1 fps
36%
HD Graphics (Cherry Trail):
12.5 fps
100%
Iris Graphics 540:
12.5 12.5 ~ 13 fps
HD Graphics (Cherry Trail):
10.8 (!) [X] Microsoft Surface 3 Intel Atom x7-Z8700 1.6GHz
HD Graphics (Cherry Trail)
Problem during benchmarking occured: Schwere grafische Probleme fps
100%
Iris Graphics 540:
59 fps
100%
Iris Graphics 540:
50 fps
100%
Iris Graphics 540:
19.5 fps
100%
Iris Graphics 540:
10.4 fps
100%
Iris Graphics 540:
52.3 fps
18%
HD Graphics (Cherry Trail):
9.5 fps
100%
Iris Graphics 540:
35.2 fps
16%
HD Graphics (Cherry Trail):
5.7 fps
100%
Iris Graphics 540:
11.6 fps
HD Graphics (Cherry Trail):
16.2 fps
HD Graphics (Cherry Trail):
6.1 fps
HD Graphics (Cherry Trail):
16 fps
HD Graphics (Cherry Trail):
12 fps
HD Graphics (Cherry Trail):
15.6 fps
HD Graphics (Cherry Trail):
5.5 10 ~ 8 fps
100%
Iris Graphics 540:
32.2 fps
HD Graphics (Cherry Trail):
22 27.3 ~ 25 fps
HD Graphics (Cherry Trail):
12.5 13.5 ~ 13 fps
100%
Iris Graphics 540:
23.3 fps
100%
Iris Graphics 540:
15.7 fps
100%
Iris Graphics 540:
13.7 fps
100%
Iris Graphics 540:
29.8 (!) 65 (!) [X] Intel NUC6i5SYH Intel Core i5-6260U 1.8GHz
Iris Graphics 540
Problem during benchmarking occured: Leichte grafische Probleme street textures wrongmin:
59 fps, max:
87 fps
~ 47 fps
28%
HD Graphics (Cherry Trail):
13.3 fps
100%
Iris Graphics 540:
18.4 (!) 45.1 (!) [X] Intel NUC6i5SYH Intel Core i5-6260U 1.8GHz
Iris Graphics 540
Problem during benchmarking occured: Leichte grafische Probleme street textures wrongmin:
39 fps, max:
56 fps
~ 32 fps
100%
Iris Graphics 540:
11.4 31.3 (!) [X] Intel NUC6i5SYH Intel Core i5-6260U 1.8GHz
Iris Graphics 540
Problem during benchmarking occured: Leichte grafische Probleme street textures wrongmin:
29 fps, max:
41 fps
~ 21 fps
100%
Iris Graphics 540:
10.4 fps
HD Graphics (Cherry Trail):
58 fps
HD Graphics (Cherry Trail):
47 fps
HD Graphics (Cherry Trail):
29.7 fps
HD Graphics (Cherry Trail):
16.5 fps
HD Graphics (Cherry Trail):
24 fps
HD Graphics (Cherry Trail):
13.5 fps
100%
Iris Graphics 540:
23 35.4 38 ~ 32 fps
100%
Iris Graphics 540:
9.5 11 ~ 10 fps
18%
HD Graphics (Cherry Trail):
2.4 2.6 ~ 2 fps
100%
Iris Graphics 540:
85 137 ~ 111 fps
100%
Iris Graphics 540:
49.2 70 ~ 60 fps
100%
Iris Graphics 540:
33.3 46.4 ~ 40 fps
20%
HD Graphics (Cherry Trail):
7 8.3 9 ~ 8 fps
100%
Iris Graphics 540:
20.6 fps
19%
HD Graphics (Cherry Trail):
3.7 3.8 ~ 4 fps
100%
Iris Graphics 540:
37.6 53.7 ~ 46 fps
100%
Iris Graphics 540:
27.6 32.2 ~ 30 fps
100%
Iris Graphics 540:
19.6 20 ~ 20 fps
100%
Iris Graphics 540:
6.6 fps
HD Graphics (Cherry Trail):
34 fps
HD Graphics (Cherry Trail):
15.2 fps
HD Graphics (Cherry Trail):
11.6 fps
HD Graphics (Cherry Trail):
0 (!) [X] Microsoft Surface 3 Intel Atom x7-Z8700 1.6GHz
HD Graphics (Cherry Trail)
Problem during benchmarking occured: Spiel startete nicht fps
HD Graphics (Cherry Trail):
0 (!) [X] Microsoft Surface 3 Intel Atom x7-Z8700 1.6GHz
HD Graphics (Cherry Trail)
Problem during benchmarking occured: Spiel startete nicht fps
HD Graphics (Cherry Trail):
20.3 fps
HD Graphics (Cherry Trail):
11.4 fps
HD Graphics (Cherry Trail):
24.3 [X] Chuwi Hi12 Intel Atom x5-Z8300 1.4GHz
HD Graphics (Cherry Trail)
min:
20 fps, max:
29 fps
31.9 ~ 28 fps
HD Graphics (Cherry Trail):
16 [X] Chuwi Hi12 Intel Atom x5-Z8300 1.4GHz
HD Graphics (Cherry Trail)
min:
13 fps, max:
19 fps
19 ~ 18 fps
100%
Iris Graphics 540:
57 fps
HD Graphics (Cherry Trail):
8 fps
HD Graphics (Cherry Trail):
15.5 18.9 ~ 17 fps
HD Graphics (Cherry Trail):
7.2 8.5 ~ 8 fps
HD Graphics (Cherry Trail):
25.6 fps
HD Graphics (Cherry Trail):
12 fps
HD Graphics (Cherry Trail):
28.1 fps
HD Graphics (Cherry Trail):
12.5 fps
HD Graphics (Cherry Trail):
18.7 fps
HD Graphics (Cherry Trail):
63.2 64 ~ 64 fps
HD Graphics (Cherry Trail):
18 18.8 ~ 18 fps
HD Graphics (Cherry Trail):
14 fps
HD Graphics (Cherry Trail):
7 fps
HD Graphics (Cherry Trail):
44 50.9 [X] Chuwi Hi12 Intel Atom x5-Z8300 1.4GHz
HD Graphics (Cherry Trail)
min:
40 fps, max:
60 fps
~ 47 fps
HD Graphics (Cherry Trail):
18.3 [X] Chuwi Hi12 Intel Atom x5-Z8300 1.4GHz
HD Graphics (Cherry Trail)
min:
13 fps, max:
29 fps
fps
100%
Iris Graphics 540:
55 fps
100%
Iris Graphics 540:
24 fps
Average Gaming Intel Iris Graphics 540 → 100% Average Gaming 30-70 fps → 100%
Average Gaming Intel HD Graphics (Cherry Trail) → 23% v1.28
log 01. 09:34:29
#0 ran 0s before starting gpusingle class +0s ... 0s
#1 checking url part for id 6472 +0s ... 0s
#2 checking url part for id 6197 +0s ... 0s
#3 redirected to Ajax server, took 1730450069s time from redirect:0 +0s ... 0s
#4 did not recreate cache, as it is less than 5 days old! Created at Fri, 01 Nov 2024 05:17:25 +0100 +0s ... 0s
#5 composed specs +0.008s ... 0.008s
#6 did output specs +0s ... 0.008s
#7 start showIntegratedCPUs +0s ... 0.008s
#8 getting avg benchmarks for device 6472 +0.025s ... 0.033s
#9 got single benchmarks 6472 +0.011s ... 0.043s
#10 getting avg benchmarks for device 6197 +0.003s ... 0.046s
#11 got single benchmarks 6197 +0.023s ... 0.07s
#12 got avg benchmarks for devices +0s ... 0.07s
#13 min, max, avg, median took s +0.03s ... 0.1s
#14 before gaming benchmark output +0s ... 0.1s
#15 Got 341 rows for game benchmarks. +0.021s ... 0.121s
#16 composed SQL query for gamebenchmarks +0s ... 0.121s
#17 got data and put it in $dataArray +0.003s ... 0.124s
#18 benchmarks composed for output. +0.02s ... 0.144s
#19 calculated avg scores. +0s ... 0.144s
#20 return log +0.002s ... 0.146s
Teilen Sie diesen Artikel, um uns zu unterstützen. Jeder Link hilft!
Autor: Klaus Hinum, 8.09.2017 (Update: 1.07.2023)