Notebookcheck Logo

Intel HD Graphics P630 vs Intel HD Graphics (Braswell) vs Intel Iris Plus Graphics 650

Intel HD Graphics P630

► remove from comparison Intel HD Graphics P630

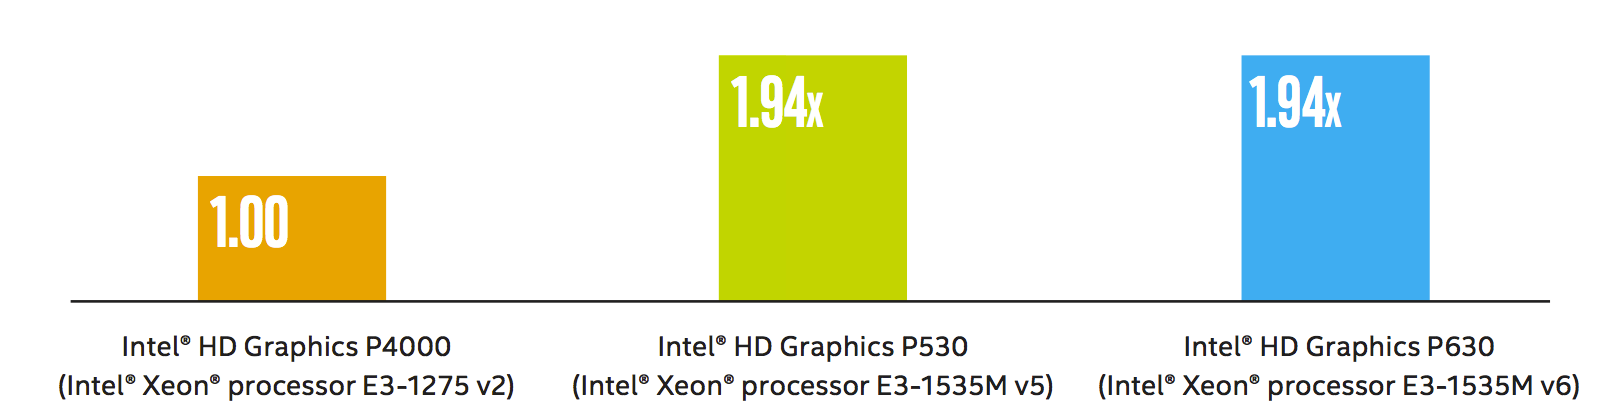
Die Intel HD Graphics P630 (GT2) ist eine integrierte Workstation-Grafikeinheit, die in verschiedenen Desktop- und Notebook-Prozessoren der 2017 vorgestellten Kaby-Lake-Generation zu finden ist (Xeon E3-1200 v6 und e3-1500M v6 Serien). Sie ist identisch mit der Intel HD Graphics 630, jedoch sind die Treiber für professionelle Software optimiert. Daher unterscheidet sie sich auch nicht von der Intel HD Graphics P530 und erreicht laut Intel auch die selbe Leistung im SPEC Viewperf12 (1.94x der alten Intel HD Graphics P4000). Die Grafikkarte ist derzeit für 15 CAD- und Workstation-Anwendungen zertifiziert.

Features

Neu bei der Kaby-Lake Generation ist die verbesserte Videoengine, welche nun auch H.265/HEVC im Main10-profil mit 10 Bit Farbtiefe sowie Googles VP9-Codec in Hardware dekodieren kann. Die Chips mit HD Graphics 530 sollten auch bereits HDCP 2.2 unterstützen und somit z.B. Netflix-Videos unter Windows 10 in 4K ausgeben können (im Gegensatz zu den ersten Kaby-Lake Dual-Core Chips mit Intel HD Graphics 620).

Leistungsaufnahme

Die HD Graphics P630 ist in Desktop- und Notebook-Prozessoren verschiedener TDP-Klassen zu finden. Die Quad-Core CPUs sind jedoch meistens in größeren und schwereren Notebooks verbaut. Der verbesserte 14nm+ Prozess verspricht jedoch eine etwas geringere Leistungsaufnahme im Vergleich zur Intel HD Graphics P530.

Quelle: http://www.intel.com/content/dam/www/public/us/en/documents/guides/hd-graphics-performance-guide.pdf

Intel HD Graphics (Braswell)

► remove from comparison Intel HD Graphics (Braswell)

Die Intel HD Graphics (Braswell) ist eine in den Low-End-SoCs der Braswell-Serie (z.B. Pentium N3700) integrierte Grafikeinheit. Sie basiert auf der gleichen Architektur wie die GPU verschiedener Broadwell-Prozessoren (z.B. HD Graphics 5300), bietet allerdings deutlich weniger Shadereinheiten und geringere Taktraten. Die genauen Spezifikationen hängen vom jeweiligen SoC ab: Die schnellste Variante mit 16 EUs und maximal 700 MHz schlägt die ältere HD Graphics (Bay Trail) um etwa Faktor zwei, andere Modelle mit lediglich 12 aktiven EUs schneiden etwas schlechter an. Zum Zeitpunkt der Vorstellung im ersten Quartal 2015 existieren folgende Varianten:

Anfangs wurde die GPU nur Intel HD Graphics benannt, später ab 2016 als Intel HD Graphics 400 (12 EU Version) und Intel HD Graphics 405 (16 EU Version) bezeichnet.

Anwender müssen sich deshalb insbesondere bei den Celeron-Modellen, die zusätzlich durch die Beschneidung auf nur zwei CPU-Kerne ausgebremst werden, auf ältere und anspruchslose Spiele beschränken. Videos werden dagegen auch in 4K/H.265 flüssig wiedergeben.

Intel Iris Plus Graphics 650

► remove from comparison Intel Iris Plus Graphics 650

Die Intel Iris Plus Graphics 650 (GT3e) ist eine Prozessorgrafikkarte der im Jänner 2017 vorgestellten Kaby-Lake-Modelle. Als Nachfolger der Intel Iris Graphics 550 (Skylake) ist die Iris Plus Graphics 650 dabei in den Modellen der 28-Watt-Klasse zu finden und besitzt einen dedizierten eDRAM-Cache mit 64 MB Kapazität. Technisch dürfte es kaum Unterschiede zur Iris Graphics 550 geben.

Die sogenannte GT3e-Ausbaustufe der Kaby-Lake-GPU verfügt wahrscheinlich weiterhin über 48 Execution Units (EUs), die je nach Modell mit bis zu 1.100 MHz takten. Neben dem eDRAM-Cache kann die Iris 650 auch über das Interface des Prozessors auf den Hauptspeicher zugreifen (2x 64 Bit DDR3L-1600/DDR4-2400).

Von der Iris Plus 640 der 15-Watt-Modelle unterscheidet sich die Iris 650 lediglich durch ihren etwas höheren Maximaltakt sowie die annähernd verdoppelte TDP, die eine bessere Ausnutzung des Turbo-Boost-Spielraumes erlaubt.

Performance

Die exakte Leistung der Iris Plus Graphics 650 hängt vom jeweiligen CPU-Modell ab, da sich die Maximaltaktrate sowie die Größe des L3-Caches leicht unterscheiden können. Zum anderen beeinflusst auch der verwendete Speicher (DDR3/DDR4) die Performance.

Die höchste Leistung erreichen hochtaktende Core-i7-Ableger wie der Core i7-6567U. Je nach Spiel ordnet sich die Iris Plus 650 vermutlich im Bereich einer dedizierten GeForce 930M ein und kann aktuelle Titel (Stand 2015) in niedrigen bis mittleren Einstellungen flüssig darstellen.

Features

Die überarbeitete Videoeinheit dekodiert H.265-/HEVC-Videos vollständig in Hardware. Anders als Skylake kann Kaby Lake nun auch H.265/HEVC im Main10-Profil mit 10 Bit Farbtiefe sowie Googles VP9-Codec in Hardware dekodieren. Die Bildausgabe erfolgt über DP 1.2/eDP 1.3 (max. 3.840 x 2.160 @ 60 Hz), wohingegen HDMI nur in der älteren Version 1.4a angeboten wird. Ein HDMI-2.0-Anschluss kann aber mittels Konverter von DisplayPort ergänzt werden. Maximal lassen sich drei Displays parallel angesteuern.

Leistungsaufnahme

Die Iris Plus Graphics 650 ist in den Prozessoren der 28-Watt-Klasse zu finden und damit für mittelgroße Laptops geeignet.

Intel HD Graphics P630Intel HD Graphics (Braswell)Intel Iris Plus Graphics 650
Gen. 9.5 Serie
Iris Plus Graphics 655 48 @ 0.3 - 1.2 GHz
Iris Plus Graphics 650 48 @ 0.3 - 1.1 GHz64/128 Bit
Iris Plus Graphics 645 48 @ 0.3 - 1.15 GHz
Iris Plus Graphics 640 48 @ 0.3 - 1.05 GHz64/128 Bit
UHD Graphics 630 24 @ 0.3 - 1.15 GHz64/128 Bit
UHD Graphics P630 24 @ 0.3 - 1.2 GHz64/128 Bit
HD Graphics 630 24 @ 0.3 - 1.15 GHz64/128 Bit
HD Graphics P630 24 64/128 Bit
UHD Graphics 620 24 @ 0.3 - 1.15 GHz
HD Graphics 620 24 @ 0.3 - 1.05 GHz64/128 Bit
UHD Graphics 617 24 @ 0.3 - 1.15 GHz64/128 Bit
UHD Graphics 615 24 @ 0.3 - 1 GHz64/128 Bit
HD Graphics 615 24 @ 0.3 - 1.05 GHz64/128 Bit
HD Graphics P530 24 @ 0.35 - 1.05 GHz64/128 Bit
HD Graphics 5600 24 @ 0.3 - 1.05 GHz64/128 Bit
HD Graphics 6000 48 @ 0.3 - 1 GHz64/128 Bit
HD Graphics 4600 20 @ 0.2 - 1.35 GHz64/128 Bit
HD Graphics 5500 24 @ 0.3 - 0.95 GHz64/128 Bit
HD Graphics 5000 40 @ 0.2 - 1.1 GHz64/128 Bit
HD Graphics 4400 20 @ 0.2 - 1.1 GHz64/128 Bit
HD Graphics 5300 24 @ 0.1 - 0.9 GHz64/128 Bit
HD Graphics 4000 16 @ 0.35 - 1.35 GHz64/128 Bit
HD Graphics (Broadwell) 12 @ 0.1 - 0.85 GHz64/128 Bit
HD Graphics 4200 20 @ 0.2 - 0.85 GHz64/128 Bit
HD Graphics (Skylake) 12 @ 0.3 - 0.8 GHz64/128 Bit
HD Graphics 405 (Braswell) 16 @ 0.32 - 0.7 GHz64/128 Bit
HD Graphics (Braswell) 16 @ 0.32 - 0.7 GHz64/128 Bit
HD Graphics 400 (Braswell) 12 @ 0.32 - 0.64 GHz64/128 Bit
HD Graphics (Haswell) 10 @ 0.2 - 1 GHz64/128 Bit
HD Graphics (Cherry Trail) 16 @ 0.2 - 0.6 GHz64/128 Bit
HD Graphics 3000 12 @ 0.35 - 1.35 GHz64/128 Bit
HD Graphics 2500 6 @ 0.65 - 1.15 GHz64/128 Bit
HD Graphics (Ivy Bridge) 6 @ 0.35 - 1.1 GHz64/128 Bit
HD Graphics 2000 6 @ 0.85 - 1.35 GHz64/128 Bit
HD Graphics (Sandy Bridge) 6 @ 0.35 - 1.1 GHz64/128 Bit
HD Graphics (Bay Trail) 4 @ 0.31 - 0.9 GHz32/64/128 Bit
Iris Plus Graphics 655 48 @ 0.3 - 1.2 GHz
Iris Plus Graphics 650 48 @ 0.3 - 1.1 GHz64/128 Bit
Iris Plus Graphics 645 48 @ 0.3 - 1.15 GHz
Iris Plus Graphics 640 48 @ 0.3 - 1.05 GHz64/128 Bit
UHD Graphics 630 24 @ 0.3 - 1.15 GHz64/128 Bit
UHD Graphics P630 24 @ 0.3 - 1.2 GHz64/128 Bit
HD Graphics 630 24 @ 0.3 - 1.15 GHz64/128 Bit
HD Graphics P630 24 64/128 Bit
UHD Graphics 620 24 @ 0.3 - 1.15 GHz
HD Graphics 620 24 @ 0.3 - 1.05 GHz64/128 Bit
UHD Graphics 617 24 @ 0.3 - 1.15 GHz64/128 Bit
UHD Graphics 615 24 @ 0.3 - 1 GHz64/128 Bit
HD Graphics 615 24 @ 0.3 - 1.05 GHz64/128 Bit
CodenameKaby-Lake-H-GT2BraswellKaby Lake GT3e
ArchitekturGen. 9.5 Kaby LakeGen. 8Gen. 9.5 Kaby Lake
Pipelines24 - unified16 - unified48 - unified
Speicherbandbreite64/128 Bit64/128 Bit64/128 Bit
Shared Memoryjajaja
APIDirectX 12_1, OpenGL 4.4DirectX 11.2, Shader 5.0DirectX 12_1, OpenGL 4.4
Herstellungsprozess14 nm14 nm14 nm
FeaturesQuickSyncQuickSync
Erscheinungsdatum05.08.2015 01.04.2015 03.01.2017
Kerntakt320 - 700 (Boost) MHz300 - 1100 (Boost) MHz
SpeichertypDDR4
CPU in HD Graphics P630GPU Base SpeedGPU Boost / Turbo
Intel Xeon E3-1535M v64 x 3100 MHz, 45 W300 MHz1150 MHz
Intel Xeon E3-1505M v64 x 3000 MHz, 45 W300 MHz1150 MHz
min. - max.300 MHz1150 MHz
CPU in HD Graphics (Braswell)GPU Base SpeedGPU Boost / Turbo
Intel Pentium N37004 x 1600 MHz, 6 W400 MHz700 MHz
Intel Celeron N31604 x 1600 MHz, 6 W320 MHz640 MHz
Intel Celeron N31504 x 1600 MHz, 6 W320 MHz640 MHz
min. - max.300 - 400 MHz600 - 1150 MHz
CPU in Iris Plus Graphics 650GPU Base SpeedGPU Boost / Turbo
Intel Core i7-7567U2 x 3500 MHz, 28 W300 MHz1100 MHz
Intel Core i5-7287U2 x 3300 MHz, 28 W300 MHz1100 MHz
Intel Core i5-7267U2 x 3100 MHz, 28 W300 MHz1050 MHz
Intel Core i3-7167U2 x 2800 MHz, 28 W300 MHz1000 MHz
min. - max.300 - 400 MHz600 - 1150 MHz

Benchmarks

Performance Rating - 3DMark 11 + Fire Strike + Time Spy - HD Graphics (Braswell)
0.1 pt (0%)
3DMark - 3DMark Time Spy Score
400 Points (1%)
623 Points (2%)
3DMark - 3DMark Time Spy Graphics
555 Points (1%)
3DMark - 3DMark Ice Storm Unlimited Graphics
161538 Points (16%)
3DMark - 3DMark Cloud Gate Score
8280 Points (9%)
min: 8403     avg: 9150     median: 9149.5 (10%)     max: 9896 Points
3DMark - 3DMark Fire Strike Standard Score
1040 Points (2%)
min: 1586     avg: 1655     median: 1655 (3%)     max: 1724 Points
2924 Points (4%)
3DMark Vantage
3DM Vant. Perf. total + Intel HD Graphics (Braswell)
3DMark Vantage - 3DM Vant. Perf. total
1479 Points (0%)
3DM Vant. Perf. GPU no PhysX + Intel HD Graphics (Braswell)
3DMark Vantage - 3DM Vant. Perf. GPU no PhysX
1328 Points (1%)
3DMark 06 3DMark 06 - Standard 1280x1024 + Intel HD Graphics (Braswell)
3DMark 06
1311 Points (2%)
3DMark 06 - Standard 1280x1024 + Intel Iris Plus Graphics 650
15175 Points (20%)
Unigine Heaven 2.1 - Heaven 2.1 high
min: 3.2     avg: 4.9     median: 4.9 (1%)     max: 6.6 fps
Cinebench R10 Cinebench R10 Shading (32bit) + Intel HD Graphics (Braswell)
Cinebench R10 Shading (32bit) + Intel Iris Plus Graphics 650
Cinebench R11.5 Cinebench R11.5 OpenGL 64 Bit + Intel HD Graphics (Braswell)
Cinebench R11.5 OpenGL 64 Bit + Intel Iris Plus Graphics 650
Cinebench R15
Cinebench R15 OpenGL 64 Bit + Intel HD Graphics (Braswell)
Cinebench R15 OpenGL 64 Bit + Intel Iris Plus Graphics 650
min: 41.21     avg: 59.1     median: 59.1 (3%)     max: 77 fps
Cinebench R15 OpenGL Ref. Match 64 Bit + Intel HD Graphics (Braswell)
Cinebench R15 OpenGL Ref. Match 64 Bit + Intel Iris Plus Graphics 650
GFXBench 3.1 - GFXBench Manhattan ES 3.1 Offscreen
12.5 fps (0%)
GFXBench 3.0 - GFXBench 3.0 Manhattan Offscreen
16.1 fps (1%)
GFXBench (DX / GLBenchmark) 2.7
GFXBench T-Rex HD Offscreen C24Z16 + Intel HD Graphics (Braswell)
GFXBench (DX / GLBenchmark) 2.7 - GFXBench T-Rex HD Offscreen C24Z16
33 fps (0%)
LuxMark v2.0 64Bit - LuxMark v2.0 Room GPU
min: 54     avg: 54.5     median: 54.5 (0%)     max: 55 Samples/s
LuxMark v2.0 64Bit - LuxMark v2.0 Sala GPU
min: 76     avg: 80.5     median: 80.5 (0%)     max: 85 Samples/s
ComputeMark v2.1 - ComputeMark v2.1 Result
306 Points (0%)
Power Consumption - Furmark Stress Test Power Consumption - external Monitor *
51.4 Watt (7%)
Power Consumption - The Witcher 3 Power Consumption - external Monitor *
51.4 Watt (7%)
Emissions Witcher 3 Fan Noise + Intel Iris Plus Graphics 650
Emissions - Witcher 3 Fan Noise
39.1 dB(A) (63%)
Clock Speed - GPU Clock Witcher 3 ultra
998 MHz (39%)
Clock Speed - GPU Clock Speed Furmark
848 MHz (34%)

Average Benchmarks Intel HD Graphics P630 → 100% n=2

Average Benchmarks Intel HD Graphics (Braswell) → 21% n=2

Average Benchmarks Intel Iris Plus Graphics 650 → 135% n=2

- Bereich der Benchmarkergebnisse für diese Grafikkarte
- Durchschnittliche Benchmarkergebnisse für diese Grafikkarte
* Smaller numbers mean a higher performance
1 This benchmark is not used for the average calculation

Spiele-Benchmarks

Die folgenden Benchmarks basieren auf unseren Spieletests mit Testnotebooks. Die Performance dieser Grafikkarte bei den gelisteten Spielen ist abhängig von der verwendeten CPU, Speicherausstattung, Treiber und auch Betriebssystem. Dadurch müssen die untenstehenden Werte nicht repräsentativ sein. Detaillierte Informationen über das verwendete System sehen Sie nach einem Klick auf den fps-Wert.

Dirt 4

Dirt 4

2017
low 1280x720
Iris Plus Graphics 650:
64  fps
med. 1920x1080
Iris Plus Graphics 650:
21.3  fps
high 1920x1080
Iris Plus Graphics 650:
14.2  fps
low 1280x720
Iris Plus Graphics 650:
113  fps
med. 1920x1080
Iris Plus Graphics 650:
56.8  fps
high 1920x1080
Iris Plus Graphics 650:
38.9  fps
Prey

Prey

2017
low 1280x720
Iris Plus Graphics 650:
51.4  fps
med. 1920x1080
Iris Plus Graphics 650:
20.2  fps
low 1280x720
Iris Plus Graphics 650:
25.8  fps
med. 1920x1080
Iris Plus Graphics 650:
10.5  fps
low 1280x720
Iris Plus Graphics 650:
17.6  fps
For Honor

For Honor

2017
low 1280x720
Iris Plus Graphics 650:
39.7  fps
med. 1920x1080
Iris Plus Graphics 650:
15.2  fps
low 1280x720
Iris Plus Graphics 650:
15  fps
low 1280x720
Iris Plus Graphics 650:
32.4  fps
low 1280x720
Iris Plus Graphics 650:
54.1  fps
med. 1366x768
Iris Plus Graphics 650:
37.9  fps
high 1920x1080
Iris Plus Graphics 650:
36.8  fps
ultra 1920x1080
Iris Plus Graphics 650:
19.9  fps
low 1280x720
Iris Plus Graphics 650:
46.1  fps
med. 1366x768
Iris Plus Graphics 650:
29.5  fps
low 1024x768
Iris Plus Graphics 650:
42.2  fps
med. 1366x768
Iris Plus Graphics 650:
20.2  fps
low 1280x720
Iris Plus Graphics 650:
19.2  fps
med. 1366x768
Iris Plus Graphics 650:
14.6  fps
high 1920x1080
Iris Plus Graphics 650:
8.2  fps
Overwatch

Overwatch

2016
low 1280x720
Iris Plus Graphics 650:
79.2  fps
med. 1366x768
Iris Plus Graphics 650:
57.4  fps
high 1920x1080
Iris Plus Graphics 650:
25.6  fps
ultra 1920x1080
Iris Plus Graphics 650:
21.4  fps
low 1280x720
Iris Plus Graphics 650:
30  fps
low 1280x720
Iris Plus Graphics 650:
32  fps
med. 1920x1080
Iris Plus Graphics 650:
15  fps
low 1024x768
Iris Plus Graphics 650:
25.9  fps
med. 1366x768
Iris Plus Graphics 650:
18.3  fps
low 1024x768
Iris Plus Graphics 650:
54.2  fps
med. 1366x768
Iris Plus Graphics 650:
35.6  fps
high 1920x1080
Iris Plus Graphics 650:
20.8  fps
low 1366x768
HD Graphics (Braswell):
16.8  fps
med. 1366x768
HD Graphics (Braswell):
11.9  fps
low 1024x768
HD Graphics (Braswell):
13.7  fps
med. 1366x768
HD Graphics (Braswell):
9.5  fps
low 1280x720
Iris Plus Graphics 650:
95  fps
med. 1366x768
Iris Plus Graphics 650:
64  fps
high 1920x1080
Iris Plus Graphics 650:
29.7  fps
ultra 1920x1080
Iris Plus Graphics 650:
25  fps
low 1024x768
Iris Plus Graphics 650:
21.4  fps
low 1024x768
HD Graphics (Braswell):
27.2  fps
med. 1366x768
HD Graphics (Braswell):
7.1  fps
GTA V

GTA V

2015
low 1024x768
Iris Plus Graphics 650:
56.5  fps
med. 1366x768
Iris Plus Graphics 650:
49.9  fps
high 1920x1080
Iris Plus Graphics 650:
11.6  fps
ultra 1920x1080
Iris Plus Graphics 650:
5  fps
low 1024x768
HD Graphics (Braswell):
13.2  fps
med. 1366x768
HD Graphics (Braswell):
8.7  fps
Evolve

Evolve

2015
low 1024x768
HD Graphics (Braswell):
5.4  fps
med. 1366x768
HD Graphics (Braswell):
3.9  fps
low 1024x768
HD Graphics (Braswell):
8.2  fps
med. 1366x768
HD Graphics (Braswell):
6.1  fps
Far Cry 4

Far Cry 4

2014
low 1024x768
HD Graphics (Braswell):
6.1  fps
med. 1366x768
HD Graphics (Braswell):
4.3  fps
low 1024x768
HD Graphics (Braswell):
6  fps
med. 1366x768
HD Graphics (Braswell):
3.2  fps
F1 2014

F1 2014

2014
low 1024x768
HD Graphics (Braswell):
13 13 ~ 13 fps
med. 1366x768
HD Graphics (Braswell):
12 12.5 ~ 12 fps
low 1024x768
HD Graphics (Braswell):
13.7  fps
med. 1366x768
HD Graphics (Braswell):
8.8  fps
Sims 4

Sims 4

2014
low 1024x768
HD Graphics (Braswell):
64  fps
med. 1366x768
HD Graphics (Braswell):
18.7  fps
low 1024x768
HD Graphics (Braswell):
7.9  fps
med. 1366x768
HD Graphics (Braswell):
5.6  fps
low 1024x768
HD Graphics (Braswell):
23  fps
med. 1366x768
HD Graphics (Braswell):
12.5  fps
low 1280x720
HD Graphics (Braswell):
3.8  fps
med. 1366x768
HD Graphics (Braswell):
2.1  fps
GRID 2

GRID 2

2013
low 1024x768
HD Graphics (Braswell):
19.2  fps
med. 1366x768
HD Graphics (Braswell):
12.6  fps
high 1366x768
HD Graphics (Braswell):
12.5  fps
low 1280x720
HD Graphics (Braswell):
16.2 17.4 17.5 17.7 22.1 ~ 18 fps
Iris Plus Graphics 650:
84  fps
med. 1366x768
HD Graphics (Braswell):
8.3 9.1 9.8 10 11.4 ~ 10 fps
Iris Plus Graphics 650:
54.4  fps
high 1366x768
HD Graphics (Braswell):
6.9 7 7.4 8.4 9.6 ~ 8 fps
Iris Plus Graphics 650:
46.5  fps
ultra 1920x1080
Iris Plus Graphics 650:
13.3  fps
low 1024x768
HD Graphics (Braswell):
19.4 22.5 23 23.4 23.7 ~ 22 fps
med. 1366x768
HD Graphics (Braswell):
11 12.1 12.2 12.6 12.9 ~ 12 fps
high 1366x768
HD Graphics (Braswell):
8 8.2 8.2 8.7 9.1 ~ 8 fps
Crysis 3

Crysis 3

2013
low 1024x768
HD Graphics (Braswell):
9.3  fps
med. 1366x768
HD Graphics (Braswell):
5.7  fps
high 1366x768
HD Graphics (Braswell):
2.1  fps
low 1024x768
HD Graphics (Braswell):
28.6  fps
med. 1366x768
HD Graphics (Braswell):
13  fps
high 1366x768
HD Graphics (Braswell):
9.9  fps
low 1024x768
HD Graphics (Braswell):
15  fps
med. 1366x768
HD Graphics (Braswell):
12  fps
high 1366x768
HD Graphics (Braswell):
11.3  fps
low 1024x768
HD Graphics (Braswell):
12.2  fps
med. 1366x768
HD Graphics (Braswell):
11.5  fps
high 1366x768
HD Graphics (Braswell):
10.4  fps
low 1024x768
HD Graphics (Braswell):
25.5  fps
med. 1366x768
HD Graphics (Braswell):
16.7  fps
high 1366x768
HD Graphics (Braswell):
13.2  fps
Anno 2070

Anno 2070

2011
low 1024x768
HD Graphics (Braswell):
28 30 ~ 29 fps
med. 1366x768
HD Graphics (Braswell):
12.7 13.1 ~ 13 fps
high 1366x768
HD Graphics (Braswell):
8.1  fps
low 1280x720
HD Graphics (Braswell):
16.5  fps
med. 1366x768
HD Graphics (Braswell):
8.2  fps
high 1366x768
HD Graphics (Braswell):
5  fps
low 1024x768
HD Graphics (Braswell):
28  fps
high 1366x768
HD Graphics (Braswell):
13.9  fps
low 1024x768
HD Graphics (Braswell):
6.7  fps
med. 1366x768
HD Graphics (Braswell):
4.2  fps
high 1366x768
HD Graphics (Braswell):
2.1  fps
Trackmania Nations Forever

Trackmania Nations Forever

2008
low 640x480
HD Graphics (Braswell):
79.3 97.6 97.6 106 106 ~ 97 fps
high 1024x768
HD Graphics (Braswell):
18.9 21.4 22.9 25.5 25.8 ~ 23 fps
Intel Iris Plus Graphics 650lowmed.highultraQHD4K
Dirt 46421.314.2
Rocket League11356.838.9
Prey51.420.2
Mass Effect Andromeda25.810.5
Ghost Recon Wildlands17.6
For Honor39.715.2
Dishonored 215
Call of Duty Infinite Warfare32.4
Titanfall 254.137.9
Farming Simulator 1736.819.9
Battlefield 146.129.5
Civilization VI42.220.2
Deus Ex Mankind Divided19.214.68.2
Overwatch79.257.425.621.4
The Division30
Far Cry Primal3215
Rise of the Tomb Raider25.918.3
Rainbow Six Siege54.235.620.8
Dota 2 Reborn956429.725
The Witcher 321.4
GTA V56.549.911.65
BioShock Infinite8454.446.513.3
< 30 fps
< 60 fps
< 120 fps
≥ 120 fps
6
10
5
9
6
1
6
3

5


Intel HD Graphics (Braswell)lowmed.highultraQHD4K
World of Warships16.811.9
Metal Gear Solid V13.79.5
Dirt Rally27.27.1
Battlefield Hardline13.28.7
Evolve5.43.9
Dragon Age: Inquisition8.26.1
Far Cry 46.14.3
Civilization: Beyond Earth63.2
F1 20141312
Alien: Isolation13.78.8
Sims 46418.7
Risen 3: Titan Lords7.95.6
GRID: Autosport2312.5
Saints Row IV3.82.1
GRID 219.212.612.5
BioShock Infinite18108
Tomb Raider22128
Crysis 39.35.72.1
Dead Space 328.6139.9
Dishonored151211.3
Counter-Strike: GO12.211.510.4
Diablo III25.516.713.2
Anno 207029138.1
The Elder Scrolls V: Skyrim16.58.25
Deus Ex Human Revolution2813.9
Battlefield: Bad Company 26.74.22.1
Trackmania Nations Forever9723
< 30 fps
< 60 fps
< 120 fps
≥ 120 fps
25

2
25


13


Eine Liste mit weiteren Spielen und allen Grafikkarten finden Sie auf unserer Seite: Welches Spiel ist mit welcher Grafikkarte spielbar?

v1.28
log 21. 15:52:20

#0 ran 0s before starting gpusingle class +0s ... 0s

#1 checking url part for id 7657 +0s ... 0s

#2 checking url part for id 6273 +0s ... 0s

#3 checking url part for id 7655 +0s ... 0s

#4 redirected to Ajax server, took 1726926740s time from redirect:0 +0s ... 0s

#5 did not recreate cache, as it is less than 5 days old! Created at Thu, 19 Sep 2024 05:16:33 +0200 +0s ... 0s

#6 composed specs +0.007s ... 0.008s

#7 did output specs +0s ... 0.008s

#8 start showIntegratedCPUs +0s ... 0.008s

#9 getting avg benchmarks for device 7657 +0.019s ... 0.026s

#10 got single benchmarks 7657 +0s ... 0.026s

#11 getting avg benchmarks for device 6273 +0.003s ... 0.03s

#12 got single benchmarks 6273 +0.024s ... 0.054s

#13 getting avg benchmarks for device 7655 +0s ... 0.055s

#14 got single benchmarks 7655 +0.005s ... 0.059s

#15 got avg benchmarks for devices +0s ... 0.059s

#16 min, max, avg, median took s +0.021s ... 0.08s

#17 before gaming benchmark output +0s ... 0.08s

#18 Got 152 rows for game benchmarks. +0.01s ... 0.091s

#19 composed SQL query for gamebenchmarks +0s ... 0.091s

#20 got data and put it in $dataArray +0.003s ... 0.094s

#21 benchmarks composed for output. +0.014s ... 0.108s

#22 calculated avg scores. +0s ... 0.108s

#23 return log +0s ... 0.109s

Teilen Sie diesen Artikel, um uns zu unterstützen. Jeder Link hilft!
> Notebook Test, Laptop Test und News > Benchmarks / Technik > Benchmarks / Technik > Grafikkarten Vergleich - Head 2 Head
Autor: Klaus Hinum,  8.09.2017 (Update:  1.07.2023)