Intel HD Graphics P630 vs Intel HD Graphics 400 (Braswell) vs Intel HD Graphics (Cherry Trail)
Intel HD Graphics P630 ► remove from comparison
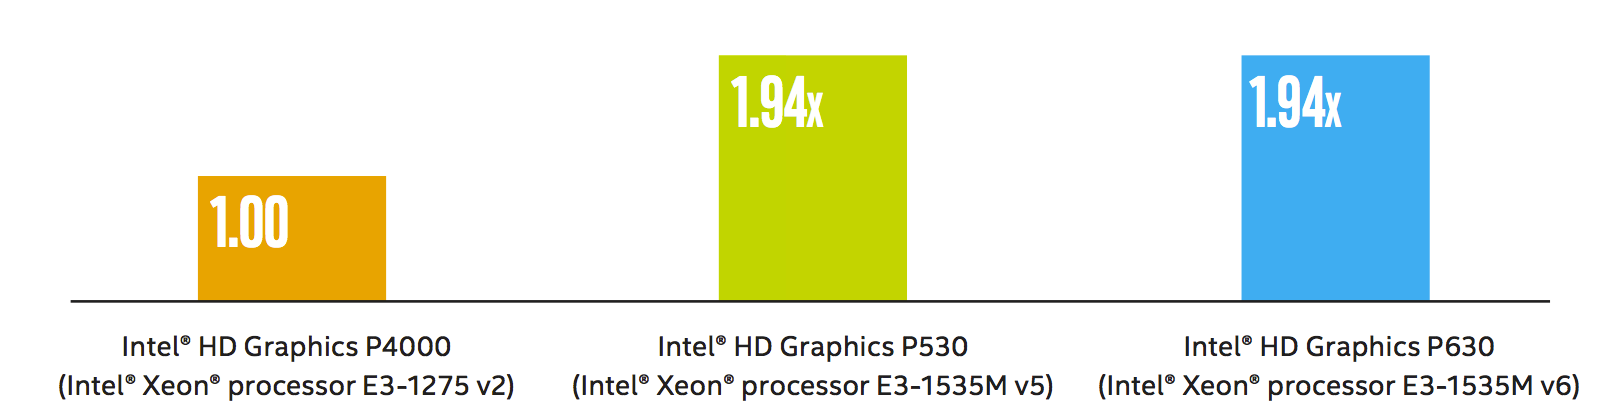
Die Intel HD Graphics P630 (GT2) ist eine integrierte Workstation-Grafikeinheit, die in verschiedenen Desktop- und Notebook-Prozessoren der 2017 vorgestellten Kaby-Lake-Generation zu finden ist (Xeon E3-1200 v6 und e3-1500M v6 Serien). Sie ist identisch mit der Intel HD Graphics 630, jedoch sind die Treiber für professionelle Software optimiert. Daher unterscheidet sie sich auch nicht von der Intel HD Graphics P530 und erreicht laut Intel auch die selbe Leistung im SPEC Viewperf12 (1.94x der alten Intel HD Graphics P4000). Die Grafikkarte ist derzeit für 15 CAD- und Workstation-Anwendungen zertifiziert .
Features
Neu bei der Kaby-Lake Generation ist die verbesserte Videoengine, welche nun auch H.265/HEVC im Main10-profil mit 10 Bit Farbtiefe sowie Googles VP9-Codec in Hardware dekodieren kann. Die Chips mit HD Graphics 530 sollten auch bereits HDCP 2.2 unterstützen und somit z.B. Netflix-Videos unter Windows 10 in 4K ausgeben können (im Gegensatz zu den ersten Kaby-Lake Dual-Core Chips mit Intel HD Graphics 620 ).
Leistungsaufnahme
Die HD Graphics P630 ist in Desktop- und Notebook-Prozessoren verschiedener TDP-Klassen zu finden. Die Quad-Core CPUs sind jedoch meistens in größeren und schwereren Notebooks verbaut. Der verbesserte 14nm+ Prozess verspricht jedoch eine etwas geringere Leistungsaufnahme im Vergleich zur Intel HD Graphics P530.
Quelle : http://www.intel.com/content/dam/www/public/us/en/documents/guides/hd-graphics-performance-guide.pdf
Intel HD Graphics 400 (Braswell) ► remove from comparison
Die Intel HD Graphics 400 ist eine in den Low-End-SoCs der Braswell-Serie (z.B. Celeron Serie in 2016) integrierte Grafikeinheit. Sie basiert auf der gleichen Architektur wie die GPU verschiedener Broadwell-Prozessoren (z.B. HD Graphics 5300 ), bietet allerdings deutlich weniger Shadereinheiten und geringere Taktraten. Die genauen Spezifikationen hängen vom jeweiligen SoC ab: Die schnellste Variante bietet derzeit 12 EUs und maximal 640 MHz.
Anfangs wurde die GPU nur Intel HD Graphics benannt, später als Intel HD Graphics 400 (12 EU Version) und Intel HD Graphics 405 (16 EU Version) bezeichnet.
Anwender müssen sich deshalb insbesondere bei den Celeron-Modellen, die zusätzlich durch die Beschneidung auf nur zwei CPU-Kerne ausgebremst werden, auf ältere und anspruchslose Spiele beschränken. Videos werden dagegen auch in 4K/H.265 flüssig wiedergeben.
Für mehr Benchmarks besuchen sie auch die Seite der Intel HD Graphics (Braswell) GPU , welche Benchmarks der älteren baugleichen 12 und 16 EU Versionen beinhaltet.
Intel HD Graphics (Cherry Trail) ► remove from comparison
Die Intel HD Graphics (Cherry Trail) ist eine in den Tablet-SoCs der Cherry-Trail-Serie (z.B. Atom x7-Z8700 ) integrierte Grafikeinheit. Sie basiert auf der gleichen Architektur wie die GPU verschiedener Broadwell-Prozessoren (z.B. HD Graphics 5300 ), bietet allerdings deutlich weniger Shadereinheiten und geringere Taktraten. Die genauen Spezifikationen hängen vom jeweiligen SoC ab:
Die schnellste Variante mit 16 EUs und maximal 600 MHz schlägt die ältere HD Graphics (Bay Trail) um Faktor zwei, womit sich die GPU etwas oberhalb einer Qualcomm Adreno 330 oder PowerVR G6430 , jedoch deutlich unter einer Adreno 420 oder GX6450 einordnet. Auch Nvidias Tegra-SoCs K1 und X1 rechnen weitaus schneller.
Unter Windows werden sich Anwender deshalb weiter auf sehr alte und anspruchslose Spiele beschränken müssen, wohingegen moderne Android-Games auch in hohen Auflösungen zumeist flüssig dargestellt werden sollten. Der x7-Z8700 war z.B. nur knapp in der Lage Team Fortress 2 in minimalen Details und 1280x720 flüssig wiederzugeben (11 - 69 fps).
Videos kann die GPU auch in 4K/H.265 flüssig wiedergeben (je nach Bitrate und Farbtiefe).
Die Intel HD Graphics Grafikkarte in den Cherry Trail SoCs unterstützt nach unseren Tests mit dem MS Surface 3 mit Atom x7-Z8700 nur DisplayPort 1.1 und damit lediglich 30 Hz bei 4K (3.840 x 2.160).
Intel HD Graphics P630 Intel HD Graphics 400 (Braswell) Intel HD Graphics (Cherry Trail) HD Graphics Serie Codename Kaby-Lake-H-GT2 Braswell Cherry Trail Architektur Gen. 9.5 Kaby Lake Gen. 8 Gen. 8 Pipelines 24 - unified 12 - unified 16 - unified Speicherbandbreite 64/128 Bit 64/128 Bit 64/128 Bit Shared Memory ja ja ja API DirectX 12_1, OpenGL 4.4 DirectX 11.2, Shader 5.0 DirectX 12 (FL 11_1), Shader 5.0, OpenGL 4.3 Herstellungsprozess 14 nm 14 nm 14 nm Features QuickSync Erscheinungsdatum 05.08.2015 01.04.2016 02.03.2015 Kerntakt 320 - 640 (Boost) MHz 200 - 600 (Boost) MHz
Benchmarks Performance Rating - 3DMark 11 + Fire Strike + Time Spy - HD Graphics 400 (Braswell)
0.1 pt (0%)
Intel HD Graphics 400 (Braswell)
...
max:
Performance Rating - 3DMark 11 + Fire Strike + Time Spy - HD Graphics (Cherry Trail)
0.1 pt (0%)
Intel HD Graphics (Cherry Trail)
...
max:
3DMark - 3DMark Time Spy Score
400 Points (1%)
3DMark - 3DMark Ice Storm Unlimited Graphics
min: 17968 avg: 20459 median: 20277 (2%) max: 23161 Points
min: 18563 avg: 20873 median: 19303 (2%) max: 27537 Points
3DMark - 3DMark Ice Storm Extreme Graphics
14334 Points (2%)
3DMark - 3DMark Cloud Gate Score
8280 Points (8%)
min: 1350 avg: 1553 median: 1457 (1%) max: 2087 Points
min: 769 avg: 1454 median: 1488 (1%) max: 1905 Points
3DMark - 3DMark Cloud Gate Graphics
min: 1519 avg: 1865 median: 1841 (0%) max: 2455 Points
min: 1537 avg: 1851 median: 1783.5 (0%) max: 2272 Points
3DMark - 3DMark Fire Strike Standard Score
1040 Points (2%)
min: 176 avg: 188 median: 188 (0%) max: 200 Points
min: 174 avg: 390.4 median: 248 (0%) max: 1059 Points
3DMark - 3DMark Fire Strike Standard Graphics
min: 202 avg: 218 median: 218 (0%) max: 234 Points
min: 193 avg: 233 median: 225 (0%) max: 281 Points
3DMark - 3DMark Ice Storm Graphics
min: 13689 avg: 18517 median: 18516.5 (2%) max: 23344 Points
min: 7544 avg: 16078 median: 17063.5 (2%) max: 23395 Points
3DMark - 3DMark Sling Shot (ES 3.0) Unlimited
min: 1502 avg: 1926 median: 1925.5 (8%) max: 2349 Points
min: 1445 avg: 1525 median: 1525 (7%) max: 1605 Points
3DMark - 3DMark Sling Shot (ES 3.0) Unlimited Graphics
min: 1452 avg: 2046 median: 2046 (4%) max: 2640 Points
min: 1598 avg: 1684 median: 1684 (4%) max: 1770 Points
3DMark - 3DMark Sling Shot Extreme (ES 3.1) Unlimited
1180 Points (6%)
min: 1072 avg: 1215 median: 1159 (6%) max: 1414 Points
3DMark - 3DMark Sling Shot Extreme (ES 3.1) Unlimited Graphics
977 Points (3%)
min: 1058 avg: 1251 median: 1142 (3%) max: 1554 Points
3DMark - 3DMark Sling Shot (ES 3.0)
min: 1473 avg: 1871 median: 1870.5 (17%) max: 2268 Points
min: 1353 avg: 1429 median: 1398 (12%) max: 1593 Points
3DMark - 3DMark Sling Shot (ES 3.0) Graphics
min: 1431 avg: 2005 median: 2005 (12%) max: 2579 Points
min: 1300 avg: 1505 median: 1530 (9%) max: 1732 Points
3DMark - 3DMark Sling Shot Extreme (ES 3.1)
1050 Points (5%)
min: 1037 avg: 1133 median: 1070 (5%) max: 1319 Points
3DMark - 3DMark Sling Shot Extreme (ES 3.1) Graphics
967 Points (3%)
min: 973 avg: 1102 median: 1054 (4%) max: 1261 Points
3DMark 11 - 3DM11 Performance Score
min: 289 avg: 386.1 median: 397 (1%) max: 478 Points
min: 314 avg: 359.4 median: 343 (0%) max: 562 Points
3DMark 11 - 3DM11 Performance GPU
min: 247 avg: 341.1 median: 349 (0%) max: 418 Points
min: 278 avg: 319.9 median: 298 (0%) max: 494 Points
3DMark 06 3DMark 06 - Standard 1280x1024 + Intel HD Graphics 400 (Braswell)
2474 Points (3%)
3DMark 06 - Standard 1280x1024 + Intel HD Graphics (Cherry Trail)
min: 2403 avg: 2833 median: 2595 (3%) max: 3330 Points
3DMark 06 - Standard 1024x768 + Intel HD Graphics (Cherry Trail)
2877 Points (4%)
Unigine Valley 1.0 - Unigine Valley 1.0 DX
1.2 fps (0%)
Unigine Heaven 2.1 - Heaven 2.1 high
5.7 fps (1%)
Cinebench R10 Cinebench R10 Shading (32bit) + Intel HD Graphics 400 (Braswell) Cinebench R10 - Cinebench R10 Shading (32bit)
min: 1627 avg: 2057 median: 2052.5 (1%) max: 2510 Points
Cinebench R10 Shading (32bit) + Intel HD Graphics (Cherry Trail)
min: 1192 avg: 2009 median: 1973 (1%) max: 2551 Points
Cinebench R11.5 Cinebench R11.5 OpenGL 64 Bit + Intel HD Graphics 400 (Braswell) Cinebench R11.5 - Cinebench R11.5 OpenGL 64 Bit
min: 9.97 avg: 10.1 median: 10 (3%) max: 10.12 fps
Cinebench R11.5 OpenGL 64 Bit + Intel HD Graphics (Cherry Trail)
min: 4.01 avg: 8.8 median: 8.4 (3%) max: 11.71 fps
Cinebench R15 + Intel HD Graphics 400 (Braswell) Cinebench R15 - Cinebench R15 OpenGL 64 Bit
min: 8.48 avg: 11 median: 11.3 (1%) max: 13.98 fps
Cinebench R15 OpenGL 64 Bit + Intel HD Graphics (Cherry Trail)
min: 6.64 avg: 10.3 median: 9.7 (1%) max: 15.52 fps
Cinebench R15 OpenGL Ref. Match 64 Bit + Intel HD Graphics 400 (Braswell) Cinebench R15 - Cinebench R15 OpenGL Ref. Match 64 Bit
98 % (98%)
Cinebench R15 OpenGL Ref. Match 64 Bit + Intel HD Graphics (Cherry Trail)
min: 98 avg: 98 median: 98 (98%) max: 98.6 %
GFXBench - GFXBench 5.0 Aztec Ruins High Tier Offscreen
3.3 fps (1%)
GFXBench - GFXBench 5.0 Aztec Ruins Normal Tier Offscreen
9.3 fps (1%)
GFXBench - GFXBench Car Chase Offscreen
min: 6.3 avg: 7.3 median: 7 (1%) max: 9 fps
GFXBench 3.1 - GFXBench Manhattan ES 3.1 Offscreen
min: 7.2 avg: 10.6 median: 10.6 (0%) max: 14 fps
min: 9.2 avg: 10.8 median: 11 (0%) max: 13 fps
GFXBench 3.0 - GFXBench 3.0 Manhattan Offscreen
min: 14 avg: 16 median: 16 (1%) max: 18 fps
min: 8.4 avg: 13.8 median: 13.5 (1%) max: 18 fps
GFXBench (DX / GLBenchmark) 2.7 + Intel HD Graphics 400 (Braswell) GFXBench (DX / GLBenchmark) 2.7 - GFXBench T-Rex HD Offscreen C24Z16
min: 27 avg: 29 median: 29 (0%) max: 31 fps
GFXBench T-Rex HD Offscreen C24Z16 + Intel HD Graphics (Cherry Trail) min: 22 avg: 30.5 median: 32 (0%) max: 38.5 fps
LuxMark v2.0 64Bit - LuxMark v2.0 Room GPU
min: 48 avg: 58.7 median: 59 (0%) max: 69 Samples/s
LuxMark v2.0 64Bit - LuxMark v2.0 Sala GPU
min: 69 avg: 87.7 median: 89 (0%) max: 105 Samples/s
ComputeMark v2.1 - ComputeMark v2.1 Result
277 Points (0%)
Average Benchmarks Intel HD Graphics P630 → 100% n=2 Average Benchmarks Intel HD Graphics 400 (Braswell) → 18% n=2 Average Benchmarks Intel HD Graphics (Cherry Trail) → 21% n=2
- Bereich der Benchmarkergebnisse für diese Grafikkarte
- Durchschnittliche Benchmarkergebnisse für diese Grafikkarte
* Smaller numbers mean a higher performance
1 This benchmark is not used for the average calculation
Spiele-Benchmarks Die folgenden Benchmarks basieren auf unseren Spieletests mit Testnotebooks. Die Performance dieser Grafikkarte bei den gelisteten Spielen ist abhängig von der verwendeten CPU, Speicherausstattung, Treiber und auch Betriebssystem. Dadurch müssen die untenstehenden Werte nicht repräsentativ sein. Detaillierte Informationen über das verwendete System sehen Sie nach einem Klick auf den fps-Wert.
HD Graphics 400 (Braswell):
14.1 fps
HD Graphics 400 (Braswell):
18.5 fps
HD Graphics (Cherry Trail):
21.4 fps
HD Graphics 400 (Braswell):
16 fps
HD Graphics 400 (Braswell):
12.7 fps
HD Graphics (Cherry Trail):
15.5 fps
HD Graphics 400 (Braswell):
6.8 fps
HD Graphics 400 (Braswell):
10.7 fps
HD Graphics 400 (Braswell):
20.9 fps
HD Graphics (Cherry Trail):
22.6 [X] Chuwi Hi12 Intel Atom x5-Z8300 1.4GHz
HD Graphics (Cherry Trail)
min:
21 fps, max:
27 fps
fps
HD Graphics 400 (Braswell):
5.8 fps
HD Graphics 400 (Braswell):
9.7 fps
HD Graphics 400 (Braswell):
15 15.1 ~ 15 fps
HD Graphics 400 (Braswell):
9.5 9.7 ~ 10 fps
HD Graphics 400 (Braswell):
5.3 fps
HD Graphics 400 (Braswell):
7.3 fps
HD Graphics (Cherry Trail):
11.5 fps
HD Graphics 400 (Braswell):
3.2 fps
HD Graphics (Cherry Trail):
7 fps
HD Graphics (Cherry Trail):
8.8 fps
HD Graphics (Cherry Trail):
4.8 fps
HD Graphics (Cherry Trail):
8.1 fps
HD Graphics (Cherry Trail):
3.9 fps
HD Graphics 400 (Braswell):
36.5 fps
HD Graphics 400 (Braswell):
14.2 fps
HD Graphics 400 (Braswell):
9 fps
HD Graphics 400 (Braswell):
13 fps
HD Graphics (Cherry Trail):
13.9 [X] Chuwi Hi12 Intel Atom x5-Z8300 1.4GHz
HD Graphics (Cherry Trail)
min:
7 fps, max:
19 fps
16.8 ~ 15 fps
HD Graphics 400 (Braswell):
8 fps
HD Graphics 400 (Braswell):
13.3 fps
HD Graphics (Cherry Trail):
15.1 fps
HD Graphics (Cherry Trail):
9.8 fps
HD Graphics 400 (Braswell):
21.3 fps
HD Graphics (Cherry Trail):
20 [X] Chuwi Hi12 Intel Atom x5-Z8300 1.4GHz
HD Graphics (Cherry Trail)
min:
18 fps
fps
HD Graphics 400 (Braswell):
11.4 fps
HD Graphics (Cherry Trail):
15.2 [X] Chuwi Hi12 Intel Atom x5-Z8300 1.4GHz
HD Graphics (Cherry Trail)
min:
13 fps
fps
HD Graphics (Cherry Trail):
7.2 [X] Chuwi Hi12 Intel Atom x5-Z8300 1.4GHz
HD Graphics (Cherry Trail)
min:
6 fps
fps
HD Graphics 400 (Braswell):
8.5 fps
HD Graphics 400 (Braswell):
5.6 fps
HD Graphics 400 (Braswell):
40.1 fps
HD Graphics (Cherry Trail):
20.1 fps
HD Graphics 400 (Braswell):
11.7 fps
HD Graphics (Cherry Trail):
12.5 fps
HD Graphics 400 (Braswell):
14.3 fps
HD Graphics (Cherry Trail):
10.8 (!) [X] Microsoft Surface 3 Intel Atom x7-Z8700 1.6GHz
HD Graphics (Cherry Trail)
fps
HD Graphics 400 (Braswell):
5.4 fps
HD Graphics (Cherry Trail):
9.5 fps
HD Graphics 400 (Braswell):
2.9 fps
HD Graphics (Cherry Trail):
5.7 fps
HD Graphics (Cherry Trail):
16.2 fps
HD Graphics (Cherry Trail):
6.1 fps
HD Graphics 400 (Braswell):
27 fps
HD Graphics (Cherry Trail):
16 fps
HD Graphics 400 (Braswell):
16 fps
HD Graphics (Cherry Trail):
12 fps
HD Graphics 400 (Braswell):
11.5 11.9 ~ 12 fps
HD Graphics 400 (Braswell):
7 fps
HD Graphics (Cherry Trail):
15.6 fps
HD Graphics 400 (Braswell):
37 fps
HD Graphics 400 (Braswell):
7.6 fps
HD Graphics (Cherry Trail):
5.5 10 ~ 8 fps
HD Graphics 400 (Braswell):
6.5 fps
HD Graphics 400 (Braswell):
4.8 fps
HD Graphics 400 (Braswell):
28.9 fps
HD Graphics (Cherry Trail):
22 27.3 ~ 25 fps
HD Graphics 400 (Braswell):
12.5 fps
HD Graphics (Cherry Trail):
12.5 13.5 ~ 13 fps
HD Graphics 400 (Braswell):
11.8 fps
HD Graphics 400 (Braswell):
16.2 fps
HD Graphics (Cherry Trail):
13.3 fps
HD Graphics 400 (Braswell):
12.3 fps
HD Graphics 400 (Braswell):
7.9 fps
HD Graphics 400 (Braswell):
30 fps
HD Graphics 400 (Braswell):
28 fps
HD Graphics 400 (Braswell):
17 fps
HD Graphics 400 (Braswell):
30 fps
HD Graphics (Cherry Trail):
58 fps
HD Graphics 400 (Braswell):
30 fps
HD Graphics (Cherry Trail):
47 fps
HD Graphics (Cherry Trail):
29.7 fps
HD Graphics (Cherry Trail):
16.5 fps
HD Graphics 400 (Braswell):
19.9 fps
HD Graphics (Cherry Trail):
24 fps
HD Graphics 400 (Braswell):
12.5 fps
HD Graphics (Cherry Trail):
13.5 fps
HD Graphics 400 (Braswell):
6.2 fps
HD Graphics 400 (Braswell):
1.8 fps
HD Graphics (Cherry Trail):
2.4 2.6 ~ 2 fps
HD Graphics 400 (Braswell):
24.8 fps
HD Graphics (Cherry Trail):
7 8.3 9 ~ 8 fps
HD Graphics (Cherry Trail):
3.7 3.8 ~ 4 fps
HD Graphics 400 (Braswell):
21.1 fps
HD Graphics 400 (Braswell):
10.8 fps
HD Graphics 400 (Braswell):
8.7 fps
HD Graphics (Cherry Trail):
34 fps
HD Graphics (Cherry Trail):
15.2 fps
HD Graphics (Cherry Trail):
11.6 fps
HD Graphics (Cherry Trail):
0 (!) [X] Microsoft Surface 3 Intel Atom x7-Z8700 1.6GHz
HD Graphics (Cherry Trail)
fps
HD Graphics (Cherry Trail):
0 (!) [X] Microsoft Surface 3 Intel Atom x7-Z8700 1.6GHz
HD Graphics (Cherry Trail)
fps
HD Graphics 400 (Braswell):
10.5 fps
HD Graphics (Cherry Trail):
20.3 fps
HD Graphics (Cherry Trail):
11.4 fps
HD Graphics 400 (Braswell):
18.3 fps
HD Graphics (Cherry Trail):
24.3 [X] Chuwi Hi12 Intel Atom x5-Z8300 1.4GHz
HD Graphics (Cherry Trail)
min:
20 fps, max:
29 fps
31.9 ~ 28 fps
HD Graphics (Cherry Trail):
16 [X] Chuwi Hi12 Intel Atom x5-Z8300 1.4GHz
HD Graphics (Cherry Trail)
min:
13 fps, max:
19 fps
19 ~ 18 fps
HD Graphics 400 (Braswell):
27.7 fps
HD Graphics (Cherry Trail):
8 fps
HD Graphics 400 (Braswell):
19.8 fps
HD Graphics (Cherry Trail):
15.5 18.9 ~ 17 fps
HD Graphics 400 (Braswell):
9.5 fps
HD Graphics (Cherry Trail):
7.2 8.5 ~ 8 fps
HD Graphics 400 (Braswell):
18.4 fps
HD Graphics (Cherry Trail):
25.6 fps
HD Graphics 400 (Braswell):
11.3 fps
HD Graphics (Cherry Trail):
12 fps
HD Graphics 400 (Braswell):
29.4 fps
HD Graphics (Cherry Trail):
28.1 fps
HD Graphics 400 (Braswell):
14.3 fps
HD Graphics (Cherry Trail):
12.5 fps
HD Graphics 400 (Braswell):
12.5 fps
HD Graphics (Cherry Trail):
18.7 fps
HD Graphics 400 (Braswell):
34.5 fps
HD Graphics (Cherry Trail):
63.2 64 ~ 64 fps
HD Graphics 400 (Braswell):
8.8 fps
HD Graphics (Cherry Trail):
18 18.8 ~ 18 fps
HD Graphics 400 (Braswell):
5.6 fps
HD Graphics (Cherry Trail):
14 fps
HD Graphics (Cherry Trail):
7 fps
HD Graphics 400 (Braswell):
60 88.5 ~ 74 fps
HD Graphics 400 (Braswell):
22.6 25.2 ~ 24 fps
HD Graphics 400 (Braswell):
9.9 fps
HD Graphics (Cherry Trail):
44 50.9 [X] Chuwi Hi12 Intel Atom x5-Z8300 1.4GHz
HD Graphics (Cherry Trail)
min:
40 fps, max:
60 fps
~ 47 fps
HD Graphics (Cherry Trail):
18.3 [X] Chuwi Hi12 Intel Atom x5-Z8300 1.4GHz
HD Graphics (Cherry Trail)
min:
13 fps, max:
29 fps
fps
v1.28
log 14. 09:23:26
#0 ran 0s before starting gpusingle class +0s ... 0s
#1 checking url part for id 7657 +0s ... 0s
#2 checking url part for id 7349 +0s ... 0s
#3 checking url part for id 6197 +0s ... 0s
#4 redirected to Ajax server, took 1731572606s time from redirect:0 +0s ... 0s
#5 did not recreate cache, as it is less than 5 days old! Created at Wed, 13 Nov 2024 05:16:40 +0100 +0s ... 0s
#6 composed specs +0.005s ... 0.005s
#7 did output specs +0s ... 0.005s
#8 start showIntegratedCPUs +0s ... 0.005s
#9 getting avg benchmarks for device 7657 +0s ... 0.006s
#10 got single benchmarks 7657 +0s ... 0.006s
#11 getting avg benchmarks for device 7349 +0.001s ... 0.007s
#12 got single benchmarks 7349 +0.003s ... 0.01s
#13 getting avg benchmarks for device 6197 +0.003s ... 0.013s
#14 got single benchmarks 6197 +0.003s ... 0.017s
#15 got avg benchmarks for devices +0s ... 0.017s
#16 min, max, avg, median took s +0.025s ... 0.042s
#17 before gaming benchmark output +0s ... 0.042s
#18 Got 232 rows for game benchmarks. +0.02s ... 0.062s
#19 composed SQL query for gamebenchmarks +0s ... 0.062s
#20 got data and put it in $dataArray +0.002s ... 0.063s
#21 benchmarks composed for output. +0.014s ... 0.077s
#22 calculated avg scores. +0s ... 0.077s
#23 return log +0.001s ... 0.078s
Teilen Sie diesen Artikel, um uns zu unterstützen. Jeder Link hilft!
Autor: Klaus Hinum, 8.09.2017 (Update: 1.07.2023)
 Deutsch
 English
 Español
 Français
 Italiano
 Nederlands
 Polski
 Português
 Русский
 Türkçe
 Svenska
 Chinese
 Magyar