Intel HD Graphics P530 vs Intel UHD Graphics (Jasper Lake 16 EU) vs Intel HD Graphics 6000
Intel HD Graphics P530 ► remove from comparison
Die Intel HD Graphics P530 (GT2) ist eine integrierte Grafikeinheit, die in Skylake-Prozessoren der Xeon-Baureihe für Workstation-Notebooks verbaut wird. Die mittlere, auch "GT2" genannte Ausbaustufe verfügt über 24 EUs (Execution Units bzw. Ausführungseinheiten) und taktet je nach Modell mit bis zu 1.050 MHz (Turbo). Mangels eigenem Grafikspeicher oder eDRAM-Cache greift die HD Graphics P530 über das Interface des Prozessors auf den System-RAM zu (2x 64 Bit DDR3L-1600/DDR4-2133).
Performance
Die Leistung der HD Graphics P530 dürfte entsprechend der identischen technischen Daten genau auf dem Niveau der HD Graphics 530 liegen. Je nach Spiel kann die GPU damit in etwa mit einer dedizierten GeForce 920M konkurrieren und aktuelle Spiele (Stand 2015) zumeist in niedrigen, selten auch mittleren Einstellungen flüssig darstellen.
Features
Der überarbeitete Videodecoder decodiert nun auch H.265-/HEVC-Videos vollständig in Hardware und arbeitet dadurch deutlich effizienter als bislang. Die Bildausgabe erfolgt über DP 1.2/eDP 1.3 (max. 3.840 x 2.160 @ 60 Hz), wohingegen HDMI nur in der älteren Version 1.4a angeboten wird. Ein HDMI-2.0-Anschluss kann aber mittels Konverter von DisplayPort ergänzt werden. Maximal lassen sich drei Displays parallel angesteuern.
Leistungsaufnahme
Mobile Xeon-Modelle wie der E3-1535M v5 werden von Intel mit einer TDP von 45 Watt spezifiziert, sodass die HD Graphics P530 vor allem in größeren Notebooks ab etwa 15 Zoll zu finden ist.
Intel UHD Graphics (Jasper Lake 16 EU) ► remove from comparison
Die Intel UHD Graphics 16 EUs (Jasper Lake, Gen. 11) ist eine Prozessorgrafikkarte, die im Januar 2021 vorgestellt wurde. Sie wird in den Mid-Range-Modellen der Jasper Lake Prozessoren genutzt (Celeron) und bietet alle 16 der 32 EUs (Executing Units - Shader Cluster) und keinen eigenen dedizierten Grafikspeicher. Die Taktung ist abhängig vom CPU-Modell und variiert von 350 - 750 MHz (minimaler Basis bis maximaler Boost-Takt). Zum Launch findet man die GPU im mobilen Celeron N4500 (6W) und im Desktop N4505 (10W).
Die Gen. 11 (Generation 11) Architektur wird in Ice Lake, Lakefield und Jasper Lake eingesetzt und bietet einen deutlichen Geschwindigkeitsschub im Vergleich zur Vorgängergeneration. Die neuere Xe Graphics (Gen. 12) in Tiger Lake ist aber nochmals deutlich schneller.
Als besonderes Feature hebt Intel das neue Variable Rate Shading (VRS) der Gen11 Grafik hervor. Damit kann der Spielentwickler Bereiche definieren die mit weniger Genauigkeit geshadet werden (z.B. weit entfernte Objekte, oder Objekte im Nebel) und somit bei gleicher visueller Qualität deutlich Performance gewinnen. Hier können je nach Szene bis zu 20 - 30% (Unreal Engine bzw Civ6) an Leistung gewonnen werden. Bis jetzt unterstütz VRS lediglich Nvidia mit Turing (GTX 1650 und aufwärts).
Neben der Spieleleistung soll auch der Videoencoder deutlich schneller geworden sein. Wie der Vorgänger sollte er weiterhin H.265/HEVC im Main10-Profil mit 10 Bit Farbtiefe sowie Googles VP9-Codec in Hardware dekodieren.
Die Intel UHD wird wie Ice Lake und Lakefield im 10nm Prozess bei Intel gefertigt und soll mit TSMCs 7nm Prozess mithalten können.
Intel HD Graphics 6000 ► remove from comparison
Die Intel HD Graphics 6000 (GT3) ist eine Prozessorgrafikkarte in den CPUs der Broadwell- Generation. Die GPU wird in einigen ULV-Modellen (15 Watt) der Core-i5- und Core-i7-Serie verbaut (z.B. Core i5-5250U , Core i7-5650U ) und verfügt über 48 EUs. Die maximale Turbo-Taktrate der Grafikkarte hängt vom konkreten Modell ab und liegt zwischen 950 und 1.000 MHz.
Architektur und Features
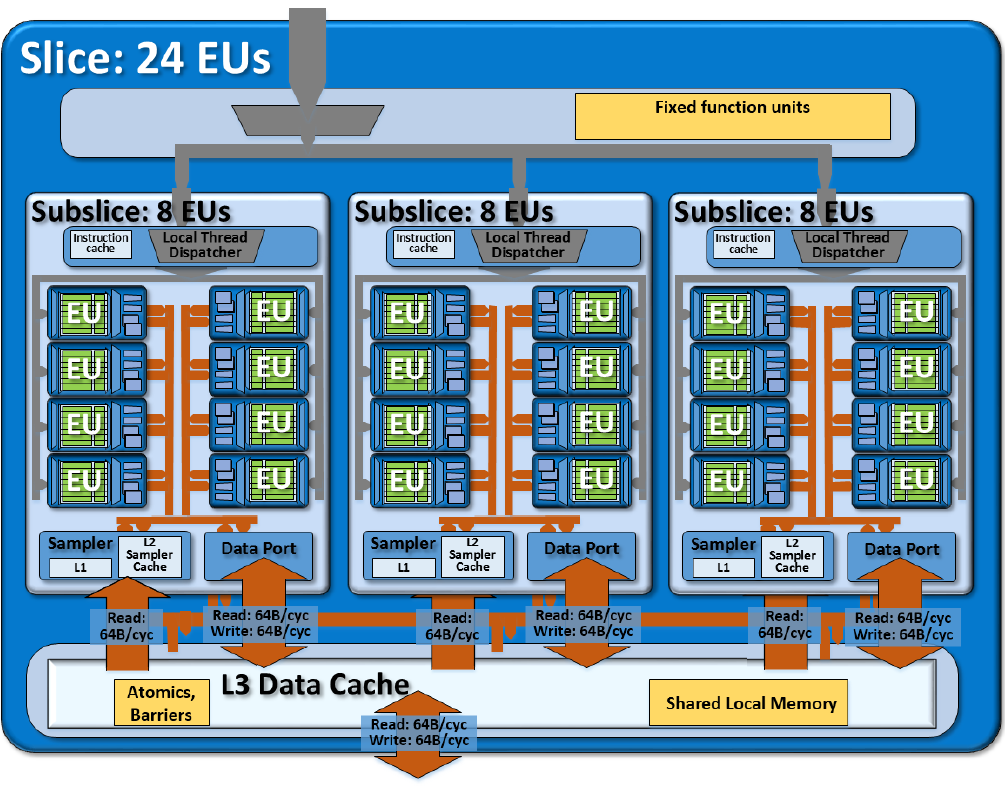
Broadwell integriert eine Grafikeinheit auf Basis der Intel-Gen8-Architektur, die gegenüber dem Vorgänger Intel Gen7.5 (Haswell) in verschiedenen Punkten weiterentwickelt wurde. So hat Intel unter anderem die "Subslice" genannten Shader-Arrays umorganisiert, die nun jeweils 8 Execution Units (EUs) beinhalten. Drei Subslices bilden wiederum einen Slice mit insgesamt 24 EUs. Hinzu kommen größere L1-Caches und Verbesserungen im Front-End, die die Leistung zusätzlich steigern sollen.
Die HD Graphics 6000 repräsentiert die größte, auch "GT3" bezeichnete Ausbaustufe mit zwei Slices und dementsprechend 48 EUs. Daneben existieren auch noch die kleineren GT1- (12 EUs) und GT2-Varianten (24 EUs) sowie die High-End-Version GT3e (48 EUs + eDRAM-Cache).
Alle Broadwell-GPUs unterstützen OpenCL 2.0 sowie DirectX 12 (FL 11_1) . Zudem kann der Videodecoder nun auch den H.265-Codec verarbeiten, greift dafür allerdings nur teilweise auf besonders sparsame Fixed-Function-Einheiten zurück. Die Bildausgabe erfolgt über DP 1.2/eDP 1.3 (max. 3.840 x 2.160 @ 60 Hz) oder HDMI 1.4a (max. 3.840 x 2.160 @ 24 Hz), HDMI 2.0 steht dagegen nicht zur Verfügung. Es können maximal drei Displays parallel angesteuert werden.
Performance
Je nach Modell liegt der maximale GPU-Takt zwischen 950 und 1.000 MHz, der aufgrund der niedrigen TDP jedoch nicht immer vollständig ausgeschöpft werden kann. In 3D-Anwendungen und Spielen übertrifft die HD 6000 die ältere HD Graphics 5000 (Haswell) um etwa 20 - 25 Prozent, was auch dem verbesserten Speicher-Support bis LPDDR3-1866 zu verdanken ist. Insgesamt sehen wir die HD Graphics 6000 knapp unter dem Niveau einer dedizierten GeForce 820M , weshalb Spiele des Jahres 2014/2015 meist nur in sehr niedrigen Einstellungen flüssig bewältigt werden.
Leistungsaufnahme
Die TDP des gesamten Chips liegt standardmäßig bei 15 Watt, sodass die HD Graphics 6000 vor allem in kompakten Ultrabooks zu finden ist. Bei Bedarf kann die TDP auch auf 9,5 Watt abgesenkt werden, was sich jedoch negativ auf die Leistungsfähigkeit auswirkt.
Intel HD Graphics P530 Intel UHD Graphics (Jasper Lake 16 EU) Intel HD Graphics 6000 HD Graphics Serie Codename Skylake GT2 Gen. 11 Broadwell GT3 Architektur Gen. 9 Skylake Gen. 11 Gen. 8 Broadwell Pipelines 24 - unified 24 - unified 48 - unified Kerntakt 350 - 1050 (Boost) MHz 350 - 800 (Boost) MHz 300 - 1000 (Boost) MHz Speicherbandbreite 64/128 Bit 64/128 Bit Speichertyp DDR3/DDR4 Shared Memory ja ja ja API DirectX 12_1, OpenGL 4.4 DirectX 12_1, OpenGL 4.5, OpenCL 1.2 DirectX 12 (FL 11_1), OpenGL 4.3 Herstellungsprozess 14 nm 10 nm 14 nm Features QuickSync QuickSync QuickSync Erscheinungsdatum 01.09.2015 11.01.2021 05.01.2015 Stromverbrauch 4.8 - 10 Watt Displays 3 Displays (max.) Predecessor UHD Graphics 600 Transistors 1.9 Billion
CPU in HD Graphics P530 GPU Base Speed GPU Boost / Turbo Intel Xeon E3-1535M v5 4 x 2900 MHz, 45 W 350 MHz 1050 MHz Intel Xeon E3-1505M v5 4 x 2800 MHz, 45 W 350 MHz 1050 MHz min. - max. 350 MHz 1050 MHz
CPU in UHD Graphics (Jasper Lake 16 EU) GPU Base Speed GPU Boost / Turbo Intel Celeron N5095A 4 x 2000 MHz, 15 W 450 MHz 750 MHz Intel Celeron N5095 4 x 2000 MHz, 15 W 450 MHz 750 MHz Intel Celeron N6211 2 x 1200 MHz, 6.5 W 250 MHz 750 MHz » show 2 more Intel Celeron N4505 2 x 2000 MHz, 10 W 450 MHz 750 MHz Intel Celeron N4500 2 x 1100 MHz, 6 W 350 MHz 750 MHz min. - max. 250 - 450 MHz 750 - 1050 MHz
CPU in HD Graphics 6000 GPU Base Speed GPU Boost / Turbo Intel Core i7-5650U 2 x 2200 MHz, 15 W 300 MHz 1000 MHz Intel Core i7-5550U 2 x 2000 MHz, 15 W 300 MHz 1000 MHz Intel Core i5-5350U 2 x 1800 MHz, 15 W 300 MHz 1000 MHz Intel Core i5-5250U 2 x 1600 MHz, 15 W 300 MHz 1000 MHz min. - max. 250 - 450 MHz 750 - 1050 MHz
Benchmarks Performance Rating - 3DMark 11 + Fire Strike + Time Spy - UHD Graphics (Jasper Lake 16 EU)
0.3 pt (1%)
...
Intel UHD Graphics (Jasper Lake 16 EU)
...
max:
Performance Rating - 3DMark 11 + Fire Strike + Time Spy - HD Graphics 6000
0.4 pt (1%)
...
...
max:
3DMark - 3DMark Time Spy Score
min: 145 avg: 192.4 median: 203 (1%) max: 210 Points
374 Points (1%)
3DMark - 3DMark Time Spy Graphics
min: 129 avg: 168.2 median: 178 (0%) max: 182 Points
334 Points (1%)
3DMark - 3DMark Ice Storm Unlimited Graphics
min: 43067 avg: 44131 median: 43609.5 (4%) max: 46236 Points
3DMark - 3DMark Ice Storm Extreme Graphics
min: 15477 avg: 18377 median: 17921 (2%) max: 22189 Points
3DMark - 3DMark Cloud Gate Score
min: 3022 avg: 4251 median: 4596.5 (4%) max: 4845 Points
min: 5425 avg: 5737 median: 5872 (6%) max: 6061 Points
3DMark - 3DMark Cloud Gate Graphics
min: 4210 avg: 4863 median: 4910.5 (1%) max: 5217 Points
min: 7378 avg: 7700 median: 7660 (2%) max: 8102 Points
3DMark - 3DMark Fire Strike Standard Score
min: 378 avg: 595 median: 626 (1%) max: 658 Points
min: 844 avg: 906 median: 903 (2%) max: 971 Points
3DMark - 3DMark Fire Strike Standard Graphics
min: 392 avg: 613 median: 645 (1%) max: 679 Points
min: 858 avg: 947 median: 951 (1%) max: 1033 Points
3DMark - 3DMark Ice Storm Graphics
min: 23782 avg: 32522 median: 35101 (4%) max: 38682 Points
min: 61674 avg: 62508 median: 61979 (7%) max: 63871 Points
3DMark - 3DMark Sling Shot (ES 3.0)
2356 Points (21%)
3DMark - 3DMark Sling Shot (ES 3.0) Graphics
2842 Points (17%)
3DMark - 3DMark Sling Shot Extreme (ES 3.1)
1952 Points (10%)
3DMark - 3DMark Sling Shot Extreme (ES 3.1) Graphics
2129 Points (7%)
3DMark 11 - 3DM11 Performance Score
min: 591 avg: 935 median: 975.5 (1%) max: 1028 Points
min: 1328 avg: 1487 median: 1513.5 (2%) max: 1591 Points
3DMark 11 - 3DM11 Performance GPU
min: 554 avg: 819 median: 854 (1%) max: 894 Points
min: 1210 avg: 1372 median: 1395.5 (1%) max: 1487 Points
3DMark Vantage + Intel UHD Graphics (Jasper Lake 16 EU) 3DMark Vantage - 3DM Vant. Perf. total
3411 Points (1%)
3DM Vant. Perf. total + Intel HD Graphics 6000
min: 5797 avg: 6106 median: 6188 (2%) max: 6333 Points
3DM Vant. Perf. GPU no PhysX + Intel UHD Graphics (Jasper Lake 16 EU) 3DMark Vantage - 3DM Vant. Perf. GPU no PhysX
2969 Points (2%)
3DM Vant. Perf. GPU no PhysX + Intel HD Graphics 6000
min: 5129 avg: 5410 median: 5432 (3%) max: 5670 Points
3DMark 05 - 3DMark 05 - Standard
12573 Points (14%)
3DMark 06 3DMark 06 - Standard 1280x1024 + Intel UHD Graphics (Jasper Lake 16 EU)
min: 5796 avg: 6344 median: 6438 (8%) max: 6704 Points
3DMark 06 - Standard 1280x1024 + Intel HD Graphics 6000
min: 7844 avg: 8448 median: 8091 (11%) max: 9408 Points
Unigine Valley 1.0 - Unigine Valley 1.0 DX
3.5 fps (1%)
3.7 fps (1%)
Unigine Heaven 2.1 - Heaven 2.1 high
min: 18.6 avg: 19 median: 18.7 (4%) max: 19.8 fps
SPECviewperf 12 + Intel HD Graphics 6000 SPECviewperf 12 - specvp12 sw-03
16.6 fps (4%)
specvp12 snx-02 + Intel HD Graphics 6000 SPECviewperf 12 - specvp12 snx-02
2.5 fps (0%)
specvp12 showcase-01 + Intel HD Graphics 6000 SPECviewperf 12 - specvp12 showcase-01
5.6 fps (1%)
specvp12 mediacal-01 + Intel HD Graphics 6000 SPECviewperf 12 - specvp12 mediacal-01
1.6 fps (0%)
specvp12 maya-04 + Intel HD Graphics 6000 SPECviewperf 12 - specvp12 maya-04
3.3 fps (1%)
specvp12 energy-01 + Intel HD Graphics 6000 SPECviewperf 12 - specvp12 energy-01
0.1 fps (0%)
specvp12 creo-01 + Intel HD Graphics 6000 SPECviewperf 12 - specvp12 creo-01
9.9 fps (4%)
specvp12 catia-04 + Intel HD Graphics 6000 SPECviewperf 12 - specvp12 catia-04
11.3 fps (2%)
Windows 7 Experience Index - Win7 Gaming graphics
6.9 Points (87%)
Windows 7 Experience Index - Win7 Graphics
5.9 Points (75%)
Cinebench R10 Cinebench R10 Shading (32bit) + Intel UHD Graphics (Jasper Lake 16 EU) Cinebench R10 - Cinebench R10 Shading (32bit)
min: 4674 avg: 5514 median: 5649.5 (4%) max: 6082 Points
Cinebench R10 Shading (32bit) + Intel HD Graphics 6000
min: 6148 avg: 6928 median: 6527 (5%) max: 8110 Points
Cinebench R11.5 Cinebench R11.5 OpenGL 64 Bit + Intel UHD Graphics (Jasper Lake 16 EU) Cinebench R11.5 - Cinebench R11.5 OpenGL 64 Bit
min: 19.02 avg: 19.5 median: 19.3 (6%) max: 20.53 fps
Cinebench R11.5 OpenGL 64 Bit + Intel HD Graphics 6000
min: 21.27 avg: 23.7 median: 23.9 (8%) max: 25.67 fps
Cinebench R15 + Intel UHD Graphics (Jasper Lake 16 EU) Cinebench R15 - Cinebench R15 OpenGL 64 Bit
min: 11.8 avg: 24.5 median: 26.2 (2%) max: 28.9 fps
Cinebench R15 OpenGL 64 Bit + Intel HD Graphics 6000
min: 25.89 avg: 30.1 median: 30.7 (2%) max: 34.45 fps
Cinebench R15 OpenGL Ref. Match 64 Bit + Intel UHD Graphics (Jasper Lake 16 EU) Cinebench R15 - Cinebench R15 OpenGL Ref. Match 64 Bit
97.8 % (98%)
Cinebench R15 OpenGL Ref. Match 64 Bit + Intel HD Graphics 6000
min: 98 avg: 98.5 median: 98 (98%) max: 99.3 %
GFXBench - GFXBench 5.0 4K Aztec Ruins High Tier Offscreen
1.4 fps (1%)
GFXBench - GFXBench 5.0 Aztec Ruins High Tier Offscreen
min: 3.2 avg: 4.9 median: 4.9 (1%) max: 6.5 fps
GFXBench - GFXBench 5.0 Aztec Ruins Normal Tier Offscreen
min: 7.8 avg: 12.7 median: 12.7 (1%) max: 17.5 fps
GFXBench - GFXBench Car Chase Offscreen
min: 10 avg: 14.2 median: 14.2 (2%) max: 18.3 fps
GFXBench 3.1 - GFXBench Manhattan ES 3.1 Offscreen
min: 8.2 avg: 16.5 median: 16.5 (0%) max: 24.7 fps
GFXBench 3.0 - GFXBench 3.0 Manhattan Offscreen
min: 18 avg: 30.7 median: 30.7 (2%) max: 43.4 fps
min: 34.22 avg: 39.5 median: 39.5 (2%) max: 44.7 fps
GFXBench (DX / GLBenchmark) 2.7 + Intel UHD Graphics (Jasper Lake 16 EU) GFXBench (DX / GLBenchmark) 2.7 - GFXBench T-Rex HD Offscreen C24Z16
min: 38 avg: 56.3 median: 56.3 (0%) max: 74.5 fps
Geekbench 6.3 - Geekbench 6.3 GPU Vulkan
1452 Points (0%)
LuxMark v2.0 64Bit - LuxMark v2.0 Room GPU
min: 96 avg: 106.3 median: 111 (0%) max: 112 Samples/s
min: 127 avg: 136 median: 135 (0%) max: 146 Samples/s
LuxMark v2.0 64Bit - LuxMark v2.0 Sala GPU
min: 206 avg: 220 median: 226 (0%) max: 228 Samples/s
min: 342 avg: 357 median: 350 (1%) max: 379 Samples/s
ComputeMark v2.1 - ComputeMark v2.1 Result
min: 536 avg: 549 median: 548 (1%) max: 564 Points
min: 941 avg: 1032 median: 1021 (1%) max: 1134 Points
Power Consumption - Furmark Stress Test Power Consumption - external Monitor *
min: 11.1 avg: 14.4 median: 15.2 (2%) max: 16 Watt
32.9 Watt (5%)
Power Consumption - The Witcher 3 Power Consumption - external Monitor *
0 Watt (0%)
32.1 Watt (4%)
Power Consumption - Witcher 3 Power Consumption *
13.1 Watt (3%)
Power Consumption - GFXBench Aztec Ruins Normal Tier Offscreen Power Consumption 150cd *
12.7 Watt (5%)
Emissions Witcher 3 Fan Noise + Intel UHD Graphics (Jasper Lake 16 EU) Emissions - Witcher 3 Fan Noise
30.4 dB(A) (49%)
Clock Speed - GPU Clock Witcher 3 ultra
850 MHz (33%)
Clock Speed - GPU Clock Speed Furmark
649 MHz (26%)
Average Benchmarks Intel UHD Graphics (Jasper Lake 16 EU) → 0% n=0 Average Benchmarks Intel HD Graphics 6000 → 0% n=0
- Bereich der Benchmarkergebnisse für diese Grafikkarte
- Durchschnittliche Benchmarkergebnisse für diese Grafikkarte
* Smaller numbers mean a higher performance
1 This benchmark is not used for the average calculation
Spiele-Benchmarks Die folgenden Benchmarks basieren auf unseren Spieletests mit Testnotebooks. Die Performance dieser Grafikkarte bei den gelisteten Spielen ist abhängig von der verwendeten CPU, Speicherausstattung, Treiber und auch Betriebssystem. Dadurch müssen die untenstehenden Werte nicht repräsentativ sein. Detaillierte Informationen über das verwendete System sehen Sie nach einem Klick auf den fps-Wert.
UHD Graphics (Jasper Lake 16 EU):
0 (!) [X] Asus VIVO Mini PN41-BBC055MVN Intel Celeron N4505 2GHz
UHD Graphics (Jasper Lake 16 EU)
fps
UHD Graphics (Jasper Lake 16 EU):
5.2 [X] Asus VIVO Mini PN41-BBC055MVN Intel Celeron N4505 2GHz
UHD Graphics (Jasper Lake 16 EU)
min:
1.68 fps, P0.1:
1.865 fps, P1:
3.62 fps, max:
22 fps
fps
UHD Graphics (Jasper Lake 16 EU):
19 [X] Asus VIVO Mini PN41-BBC055MVN 803111
Intel Celeron N4505 2GHz
UHD Graphics (Jasper Lake 16 EU)
min:
5 fps, P1:
12 fps, max:
23 fps
fps
UHD Graphics (Jasper Lake 16 EU):
15.2 [X] Asus VIVO Mini PN41-BBC055MVN Intel Celeron N4505 2GHz
UHD Graphics (Jasper Lake 16 EU)
min:
12 fps, max:
16 fps
fps
HD Graphics 6000:
18.4 [X] Intel NUC5i5RYK Intel Core i5-5250U 1.6GHz
HD Graphics 6000
min:
15 fps, max:
22 fps
fps
UHD Graphics (Jasper Lake 16 EU):
7 [X] Asus VIVO Mini PN41-BBC055MVN Intel Celeron N4505 2GHz
UHD Graphics (Jasper Lake 16 EU)
min:
6 fps, max:
15 fps
fps
UHD Graphics (Jasper Lake 16 EU):
16.2 [X] Asus VIVO Mini PN41-BBC055MVN 1.47.22.14 D3D12
Intel Celeron N4505 2GHz
UHD Graphics (Jasper Lake 16 EU)
min:
5 fps, P1:
7.29 fps, max:
116 fps
16.2 [X] Intel NUC11ATKC2, N4505 1.47.22.14 D3D12
Intel Celeron N4505 2GHz
UHD Graphics (Jasper Lake 16 EU)
min:
5 fps, P1:
7.31 fps, max:
115.7 fps
~ 16 fps
UHD Graphics (Jasper Lake 16 EU):
6.5 [X] Intel NUC11ATKC2, N4505 1.47.22.14 D3D12
Intel Celeron N4505 2GHz
UHD Graphics (Jasper Lake 16 EU)
min:
5 fps, P1:
5 fps, max:
89.2 fps
6.6 [X] Asus VIVO Mini PN41-BBC055MVN 1.47.22.14 D3D12
Intel Celeron N4505 2GHz
UHD Graphics (Jasper Lake 16 EU)
min:
5 fps, P1:
5 fps, max:
87.4 fps
~ 7 fps
UHD Graphics (Jasper Lake 16 EU):
6 [X] Asus VIVO Mini PN41-BBC055MVN 1.47.22.14 D3D12
Intel Celeron N4505 2GHz
UHD Graphics (Jasper Lake 16 EU)
min:
5 fps, P1:
5 fps, max:
78.1 fps
6.5 [X] Intel NUC11ATKC2, N4505 1.47.22.14 D3D12
Intel Celeron N4505 2GHz
UHD Graphics (Jasper Lake 16 EU)
min:
5 fps, P1:
5 fps, max:
82.6 fps
~ 6 fps
UHD Graphics (Jasper Lake 16 EU):
7 [X] Asus VIVO Mini PN41-BBC055MVN Intel Celeron N4505 2GHz
UHD Graphics (Jasper Lake 16 EU)
min:
3 fps, max:
9 fps
fps
UHD Graphics (Jasper Lake 16 EU):
10.1 10.8 [X] Beelink U59 Intel Celeron N5095 2GHz
UHD Graphics (Jasper Lake 16 EU)
11 [X] Asus VIVO Mini PN41-BBC055MVN Intel Celeron N4505 2GHz
UHD Graphics (Jasper Lake 16 EU)
13.2 13.3 15.1 ~ 12 fps
HD Graphics 6000:
18.2 [X] Intel NUC5i5RYK Intel Core i5-5250U 1.6GHz
HD Graphics 6000
fps
UHD Graphics (Jasper Lake 16 EU):
7.5 8.4 9 [X] Asus VIVO Mini PN41-BBC055MVN Intel Celeron N4505 2GHz
UHD Graphics (Jasper Lake 16 EU)
9.2 [X] Beelink U59 Intel Celeron N5095 2GHz
UHD Graphics (Jasper Lake 16 EU)
9.2 ~ 9 fps
HD Graphics 6000:
12.9 [X] Intel NUC5i5RYK Intel Core i5-5250U 1.6GHz
HD Graphics 6000
fps
UHD Graphics (Jasper Lake 16 EU):
7.1 7.9 8.3 [X] Asus VIVO Mini PN41-BBC055MVN Intel Celeron N4505 2GHz
UHD Graphics (Jasper Lake 16 EU)
8.6 8.6 [X] Beelink U59 Intel Celeron N5095 2GHz
UHD Graphics (Jasper Lake 16 EU)
~ 8 fps
HD Graphics 6000:
11.6 [X] Intel NUC5i5RYK Intel Core i5-5250U 1.6GHz
HD Graphics 6000
fps
UHD Graphics (Jasper Lake 16 EU):
3.2 3.3 3.3 ~ 3 fps
UHD Graphics (Jasper Lake 16 EU):
2.3 2.3 ~ 2 fps
HD Graphics 6000:
64.2 [X] Intel NUC5i5RYK Intel Core i5-5250U 1.6GHz
HD Graphics 6000
min:
58 fps
fps
HD Graphics 6000:
37.4 (!) [X] Intel NUC5i5RYK Intel Core i5-5250U 1.6GHz
HD Graphics 6000
min:
34 fps
fps
HD Graphics 6000:
41.3 [X] Intel NUC5i5RYK Intel Core i5-5250U 1.6GHz
HD Graphics 6000
min:
37 fps, max:
45 fps
fps
HD Graphics 6000:
28.4 [X] Intel NUC5i5RYK Intel Core i5-5250U 1.6GHz
HD Graphics 6000
min:
22 fps, max:
35 fps
fps
HD Graphics 6000:
55.3 61 [X] Intel NUC5i5RYK Intel Core i5-5250U 1.6GHz
HD Graphics 6000
min:
53 fps, max:
80 fps
~ 58 fps
HD Graphics 6000:
32.7 fps
HD Graphics 6000:
18.9 fps
HD Graphics 6000:
20.8 [X] Intel NUC5i5RYK Intel Core i5-5250U 1.6GHz
HD Graphics 6000
min:
17 fps, max:
23 fps
fps
HD Graphics 6000:
25 [X] Intel NUC5i5RYK Intel Core i5-5250U 1.6GHz
HD Graphics 6000
min:
20 fps, max:
31 fps
fps
HD Graphics 6000:
28.9 [X] Intel NUC5i5RYK Intel Core i5-5250U 1.6GHz
HD Graphics 6000
min:
9 fps, max:
80 fps
fps
HD Graphics 6000:
18.2 [X] Intel NUC5i5RYK Intel Core i5-5250U 1.6GHz
HD Graphics 6000
min:
8 fps, max:
71 fps
fps
HD Graphics 6000:
10.9 [X] Intel NUC5i5RYK Intel Core i5-5250U 1.6GHz
HD Graphics 6000
min:
5 fps, max:
70 fps
fps
HD Graphics 6000:
9.1 [X] Intel NUC5i5RYK Intel Core i5-5250U 1.6GHz
HD Graphics 6000
min:
4 fps, max:
80 fps
fps
HD Graphics 6000:
18.6 [X] Intel NUC5i5RYK Intel Core i5-5250U 1.6GHz
HD Graphics 6000
min:
14 fps, max:
23 fps
fps
HD Graphics 6000:
14 [X] Intel NUC5i5RYK Intel Core i5-5250U 1.6GHz
HD Graphics 6000
min:
10 fps, max:
18 fps
fps
HD Graphics 6000:
24.6 [X] Intel NUC5i5RYK Intel Core i5-5250U 1.6GHz
HD Graphics 6000
min:
20 fps, max:
31 fps
fps
HD Graphics 6000:
16.6 [X] Intel NUC5i5RYK Intel Core i5-5250U 1.6GHz
HD Graphics 6000
min:
14 fps, max:
19 fps
fps
HD Graphics 6000:
53 (!) [X] Intel NUC5i5RYK Intel Core i5-5250U 1.6GHz
HD Graphics 6000
min:
47 fps, max:
59 fps
fps
HD Graphics 6000:
39 (!) [X] Intel NUC5i5RYK Intel Core i5-5250U 1.6GHz
HD Graphics 6000
min:
33 fps, max:
42 fps
fps
HD Graphics 6000:
21.3 [X] Intel NUC5i5RYK Intel Core i5-5250U 1.6GHz
HD Graphics 6000
min:
18 fps, max:
24 fps
fps
HD Graphics 6000:
52.3 [X] Intel NUC5i5RYK 0.5.0.0
Intel Core i5-5250U 1.6GHz
HD Graphics 6000
min:
34 fps, max:
63 fps
fps
HD Graphics 6000:
16 [X] Intel NUC5i5RYK Intel Core i5-5250U 1.6GHz
HD Graphics 6000
min:
10 fps, max:
22 fps
fps
HD Graphics 6000:
35 [X] Intel NUC5i5RYK Intel Core i5-5250U 1.6GHz
HD Graphics 6000
min:
31 fps, max:
37 fps
fps
HD Graphics 6000:
24.8 [X] Intel NUC5i5RYK Intel Core i5-5250U 1.6GHz
HD Graphics 6000
min:
22 fps, max:
28 fps
fps
HD Graphics 6000:
9.5 [X] Intel NUC5i5RYK Intel Core i5-5250U 1.6GHz
HD Graphics 6000
min:
8 fps, max:
10 fps
fps
HD Graphics 6000:
19.3 [X] Intel NUC5i5RYK Intel Core i5-5250U 1.6GHz
HD Graphics 6000
min:
16 fps, max:
22 fps
fps
UHD Graphics (Jasper Lake 16 EU):
18.9 36.2 47.7 [X] Asus VIVO Mini PN41-BBC055MVN Intel Celeron N4505 2GHz
UHD Graphics (Jasper Lake 16 EU)
min:
34.8 fps, max:
-1 fps
57.3 [X] Beelink U59 Intel Celeron N5095 2GHz
UHD Graphics (Jasper Lake 16 EU)
min:
47 fps, max:
-1 fps
58.3 [X] Beelink U59 Mini-S Intel Celeron N5095 2GHz
UHD Graphics (Jasper Lake 16 EU)
min:
51.4 fps, max:
-1 fps
58.6 61.2 ~ 48 fps
HD Graphics 6000:
54.7 [X] Intel NUC5i5RYK Intel Core i5-5250U 1.6GHz
HD Graphics 6000
fps
UHD Graphics (Jasper Lake 16 EU):
20.7 [X] Beelink U59 Mini-S Intel Celeron N5095 2GHz
UHD Graphics (Jasper Lake 16 EU)
min:
13.8 fps, max:
-1 fps
22 22.8 26.6 [X] Beelink U59 Intel Celeron N5095 2GHz
UHD Graphics (Jasper Lake 16 EU)
min:
20.6 fps, max:
-1 fps
26.9 [X] Asus VIVO Mini PN41-BBC055MVN Intel Celeron N4505 2GHz
UHD Graphics (Jasper Lake 16 EU)
min:
19.7 fps, max:
-1 fps
26.9 ~ 24 fps
HD Graphics 6000:
33.9 [X] Intel NUC5i5RYK Intel Core i5-5250U 1.6GHz
HD Graphics 6000
min:
30.7 fps
fps
UHD Graphics (Jasper Lake 16 EU):
11.6 11.8 [X] Asus VIVO Mini PN41-BBC055MVN Intel Celeron N4505 2GHz
UHD Graphics (Jasper Lake 16 EU)
min:
5.8 fps, max:
-1 fps
11.8 11.8 12 [X] Beelink U59 Intel Celeron N5095 2GHz
UHD Graphics (Jasper Lake 16 EU)
min:
9.3 fps, max:
-1 fps
12 ~ 12 fps
HD Graphics 6000:
16.7 [X] Intel NUC5i5RYK Intel Core i5-5250U 1.6GHz
HD Graphics 6000
min:
15.4 fps
fps
UHD Graphics (Jasper Lake 16 EU):
10.8 [X] Asus VIVO Mini PN41-BBC055MVN Intel Celeron N4505 2GHz
UHD Graphics (Jasper Lake 16 EU)
min:
6.2 fps, max:
-1 fps
10.8 10.9 10.9 11.2 [X] Beelink U59 Intel Celeron N5095 2GHz
UHD Graphics (Jasper Lake 16 EU)
min:
8.6 fps, max:
-1 fps
11.2 ~ 11 fps
HD Graphics 6000:
15.4 [X] Intel NUC5i5RYK Intel Core i5-5250U 1.6GHz
HD Graphics 6000
min:
14.4 fps
fps
HD Graphics 6000:
11 [X] Core i5-5250U (Intel NUC) Intel Core i5-5250U 1.6GHz
HD Graphics 6000
min:
8 fps, max:
15 fps
fps
HD Graphics 6000:
10 [X] Core i5-5250U (Intel NUC) Intel Core i5-5250U 1.6GHz
HD Graphics 6000
min:
7 fps, max:
14 fps
fps
UHD Graphics (Jasper Lake 16 EU):
4 13.5 [X] Asus VIVO Mini PN41-BBC055MVN Intel Celeron N4505 2GHz
UHD Graphics (Jasper Lake 16 EU)
min:
4.28 fps, P0.1:
4.38 fps, P1:
5.85 fps, max:
73 fps
14 [X] Beelink U59 Intel Celeron N5095 2GHz
UHD Graphics (Jasper Lake 16 EU)
min:
13 fps, max:
15 fps
~ 11 fps
HD Graphics 6000:
13.4 [X] Core i5-5250U (Intel NUC) 1.07
Intel Core i5-5250U 1.6GHz
HD Graphics 6000
min:
10 fps, max:
18 fps
13.8 [X] Core i5-5250U (Intel NUC) 1.03
Intel Core i5-5250U 1.6GHz
HD Graphics 6000
min:
10 fps, max:
17 fps
~ 14 fps
HD Graphics 6000:
93 [X] Core i5-5250U (Intel NUC) Intel Core i5-5250U 1.6GHz
HD Graphics 6000
min:
79 fps, max:
120 fps
fps
HD Graphics 6000:
22.8 [X] Core i5-5250U (Intel NUC) Intel Core i5-5250U 1.6GHz
HD Graphics 6000
min:
18 fps, max:
33 fps
fps
HD Graphics 6000:
12.9 [X] Core i5-5250U (Intel NUC) Intel Core i5-5250U 1.6GHz
HD Graphics 6000
min:
12.5 fps, max:
16.5 fps
fps
UHD Graphics (Jasper Lake 16 EU):
0 (!) [X] Asus VIVO Mini PN41-BBC055MVN Intel Celeron N4505 2GHz
UHD Graphics (Jasper Lake 16 EU)
25.1 ~ 13 fps
UHD Graphics (Jasper Lake 16 EU):
25 fps
UHD Graphics (Jasper Lake 16 EU):
5.6 fps
HD Graphics 6000:
35.3 [X] Core i5-5250U (Intel NUC) Intel Core i5-5250U 1.6GHz
HD Graphics 6000
min:
30 fps, max:
45 fps
fps
HD Graphics 6000:
26.9 [X] Core i5-5250U (Intel NUC) Intel Core i5-5250U 1.6GHz
HD Graphics 6000
min:
23 fps, max:
33 fps
fps
HD Graphics 6000:
9.1 [X] Core i5-5250U (Intel NUC) Intel Core i5-5250U 1.6GHz
HD Graphics 6000
min:
7 fps, max:
12 fps
fps
HD Graphics 6000:
18.7 [X] Core i5-5250U (Intel NUC) Intel Core i5-5250U 1.6GHz
HD Graphics 6000
min:
16 fps, max:
21 fps
fps
HD Graphics 6000:
13.5 [X] Core i5-5250U (Intel NUC) Intel Core i5-5250U 1.6GHz
HD Graphics 6000
min:
11 fps, max:
16 fps
fps
HD Graphics 6000:
20.9 [X] Core i5-5250U (Intel NUC) Intel Core i5-5250U 1.6GHz
HD Graphics 6000
min:
18.1 fps
fps
HD Graphics 6000:
16.8 [X] Core i5-5250U (Intel NUC) Intel Core i5-5250U 1.6GHz
HD Graphics 6000
min:
13.4 fps
fps
HD Graphics 6000:
6.1 [X] Core i5-5250U (Intel NUC) Intel Core i5-5250U 1.6GHz
HD Graphics 6000
min:
5.1 fps
fps
HD Graphics 6000:
0 (!) [X] Core i5-5250U (Intel NUC) Intel Core i5-5250U 1.6GHz
HD Graphics 6000
fps
HD Graphics 6000:
33 [X] Core i5-5250U (Intel NUC) Intel Core i5-5250U 1.6GHz
HD Graphics 6000
min:
24 fps, max:
61 fps
fps
HD Graphics 6000:
17.6 [X] Core i5-5250U (Intel NUC) Intel Core i5-5250U 1.6GHz
HD Graphics 6000
min:
14 fps, max:
32 fps
fps
HD Graphics 6000:
40.9 [X] Core i5-5250U (Intel NUC) Intel Core i5-5250U 1.6GHz
HD Graphics 6000
min:
16 fps, max:
68 fps
fps
HD Graphics 6000:
20.8 [X] Core i5-5250U (Intel NUC) Intel Core i5-5250U 1.6GHz
HD Graphics 6000
min:
10 fps, max:
33 fps
fps
HD Graphics 6000:
13.3 [X] Core i5-5250U (Intel NUC) Intel Core i5-5250U 1.6GHz
HD Graphics 6000
min:
5 fps, max:
38 fps
fps
HD Graphics 6000:
10.7 [X] Core i5-5250U (Intel NUC) Intel Core i5-5250U 1.6GHz
HD Graphics 6000
min:
7 fps, max:
22 fps
fps
HD Graphics 6000:
55 [X] Core i5-5250U (Intel NUC) Intel Core i5-5250U 1.6GHz
HD Graphics 6000
min:
40 fps
fps
HD Graphics 6000:
37 [X] Core i5-5250U (Intel NUC) Intel Core i5-5250U 1.6GHz
HD Graphics 6000
min:
27 fps
fps
HD Graphics 6000:
21 [X] Core i5-5250U (Intel NUC) Intel Core i5-5250U 1.6GHz
HD Graphics 6000
min:
16 fps
fps
HD Graphics 6000:
13 [X] Core i5-5250U (Intel NUC) Intel Core i5-5250U 1.6GHz
HD Graphics 6000
min:
12 fps
fps
HD Graphics 6000:
26.4 fps
HD Graphics 6000:
50 [X] Core i5-5250U (Intel NUC) Intel Core i5-5250U 1.6GHz
HD Graphics 6000
min:
42 fps, max:
61 fps
fps
HD Graphics 6000:
35.7 [X] Core i5-5250U (Intel NUC) Intel Core i5-5250U 1.6GHz
HD Graphics 6000
min:
30 fps, max:
40 fps
fps
HD Graphics 6000:
23.3 [X] Core i5-5250U (Intel NUC) Intel Core i5-5250U 1.6GHz
HD Graphics 6000
min:
20 fps, max:
27 fps
fps
HD Graphics 6000:
144 [X] Core i5-5250U (Intel NUC) Intel Core i5-5250U 1.6GHz
HD Graphics 6000
min:
110 fps, max:
187 fps
fps
HD Graphics 6000:
45.4 [X] Core i5-5250U (Intel NUC) Intel Core i5-5250U 1.6GHz
HD Graphics 6000
min:
34 fps, max:
64 fps
fps
HD Graphics 6000:
21.8 [X] Core i5-5250U (Intel NUC) Intel Core i5-5250U 1.6GHz
HD Graphics 6000
min:
15 fps, max:
28 fps
fps
HD Graphics 6000:
14.1 [X] Core i5-5250U (Intel NUC) Intel Core i5-5250U 1.6GHz
HD Graphics 6000
min:
10 fps, max:
20 fps
fps
HD Graphics 6000:
40 [X] Core i5-5250U (Intel NUC) Intel Core i5-5250U 1.6GHz
HD Graphics 6000
fps
HD Graphics 6000:
13 [X] Core i5-5250U (Intel NUC) Intel Core i5-5250U 1.6GHz
HD Graphics 6000
fps
HD Graphics 6000:
6.9 [X] Core i5-5250U (Intel NUC) Intel Core i5-5250U 1.6GHz
HD Graphics 6000
fps
HD Graphics 6000:
32 [X] Core i5-5250U (Intel NUC) Intel Core i5-5250U 1.6GHz
HD Graphics 6000
min:
26 fps, max:
43 fps
fps
HD Graphics 6000:
22.2 [X] Core i5-5250U (Intel NUC) Intel Core i5-5250U 1.6GHz
HD Graphics 6000
min:
19 fps, max:
28 fps
fps
HD Graphics 6000:
15.6 [X] Core i5-5250U (Intel NUC) Intel Core i5-5250U 1.6GHz
HD Graphics 6000
min:
12 fps, max:
22 fps
fps
HD Graphics 6000:
5.6 [X] Core i5-5250U (Intel NUC) Intel Core i5-5250U 1.6GHz
HD Graphics 6000
min:
3 fps, max:
9 fps
fps
HD Graphics 6000:
19 [X] Core i5-5250U (Intel NUC) Intel Core i5-5250U 1.6GHz
HD Graphics 6000
min:
10 fps, max:
36 fps
fps
HD Graphics 6000:
15.7 [X] Core i5-5250U (Intel NUC) Intel Core i5-5250U 1.6GHz
HD Graphics 6000
min:
8 fps, max:
32 fps
fps
HD Graphics 6000:
12 [X] Core i5-5250U (Intel NUC) Intel Core i5-5250U 1.6GHz
HD Graphics 6000
min:
7 fps, max:
23 fps
fps
HD Graphics 6000:
6 [X] Core i5-5250U (Intel NUC) Intel Core i5-5250U 1.6GHz
HD Graphics 6000
min:
2 fps, max:
10 fps
fps
HD Graphics 6000:
22.1 fps
HD Graphics 6000:
60 64.7 ~ 62 fps
HD Graphics 6000:
33 34.5 ~ 34 fps
HD Graphics 6000:
22 22.9 ~ 22 fps
HD Graphics 6000:
20.9 [X] Core i5-5250U (Intel NUC) Intel Core i5-5250U 1.6GHz
HD Graphics 6000
min:
16 fps, max:
29 fps
fps
HD Graphics 6000:
13.9 [X] Core i5-5250U (Intel NUC) Intel Core i5-5250U 1.6GHz
HD Graphics 6000
min:
11 fps, max:
19 fps
fps
UHD Graphics (Jasper Lake 16 EU):
57.6 [X] Asus VIVO Mini PN41-BBC055MVN Intel Celeron N4505 2GHz
UHD Graphics (Jasper Lake 16 EU)
fps
UHD Graphics (Jasper Lake 16 EU):
48.1 [X] Asus VIVO Mini PN41-BBC055MVN Intel Celeron N4505 2GHz
UHD Graphics (Jasper Lake 16 EU)
fps
UHD Graphics (Jasper Lake 16 EU):
17.8 [X] Asus VIVO Mini PN41-BBC055MVN Intel Celeron N4505 2GHz
UHD Graphics (Jasper Lake 16 EU)
fps
v1.28
log 17. 00:36:01
#0 ran 0s before starting gpusingle class +0s ... 0s
#1 checking url part for id 6452 +0s ... 0s
#2 checking url part for id 10644 +0s ... 0s
#3 checking url part for id 5943 +0s ... 0s
#4 redirected to Ajax server, took 1731800161s time from redirect:0 +0s ... 0s
#5 did not recreate cache, as it is less than 5 days old! Created at Sat, 16 Nov 2024 05:17:01 +0100 +0s ... 0s
#6 composed specs +0.031s ... 0.031s
#7 did output specs +0s ... 0.031s
#8 start showIntegratedCPUs +0s ... 0.031s
#9 getting avg benchmarks for device 6452 +0.029s ... 0.061s
#10 got single benchmarks 6452 +0s ... 0.061s
#11 getting avg benchmarks for device 10644 +0.004s ... 0.065s
#12 got single benchmarks 10644 +0.014s ... 0.079s
#13 getting avg benchmarks for device 5943 +0.004s ... 0.083s
#14 got single benchmarks 5943 +0.006s ... 0.089s
#15 got avg benchmarks for devices +0s ... 0.089s
#16 No cached benchmark found, getting uncached values +0.032s ... 0.121s
#17 min, max, avg, median took s +0.003s ... 0.123s
#18 before gaming benchmark output +0s ... 0.123s
#19 Got 196 rows for game benchmarks. +0.01s ... 0.133s
#20 composed SQL query for gamebenchmarks +0s ... 0.133s
#21 got data and put it in $dataArray +0.003s ... 0.136s
#22 benchmarks composed for output. +0.017s ... 0.153s
#23 calculated avg scores. +0s ... 0.153s
#24 return log +0.001s ... 0.154s
Teilen Sie diesen Artikel, um uns zu unterstützen. Jeder Link hilft!
Autor: Klaus Hinum, 8.09.2017 (Update: 1.07.2023)
 Deutsch
 English
 Español
 Français
 Italiano
 Nederlands
 Polski
 Português
 Русский
 Türkçe
 Svenska
 Chinese
 Magyar