Intel HD Graphics P530 vs Intel UHD Graphics 615 vs Intel HD Graphics 405 (Braswell)
Intel HD Graphics P530 ► remove from comparison
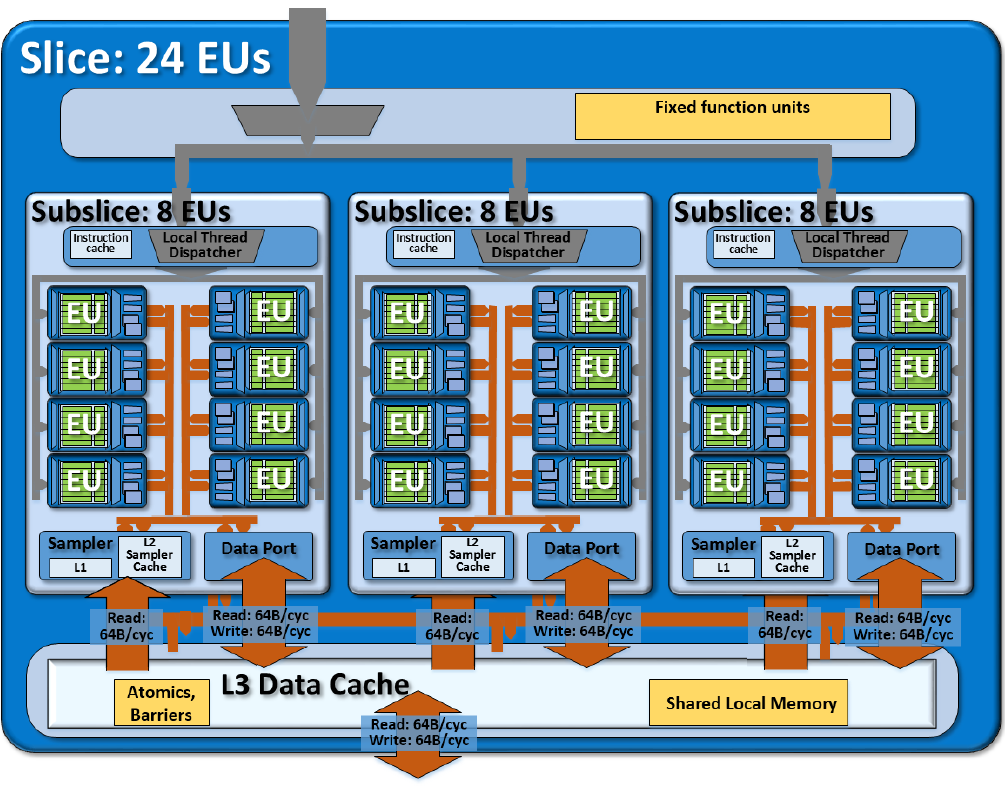
Die Intel HD Graphics P530 (GT2) ist eine integrierte Grafikeinheit, die in Skylake-Prozessoren der Xeon-Baureihe für Workstation-Notebooks verbaut wird. Die mittlere, auch "GT2" genannte Ausbaustufe verfügt über 24 EUs (Execution Units bzw. Ausführungseinheiten) und taktet je nach Modell mit bis zu 1.050 MHz (Turbo). Mangels eigenem Grafikspeicher oder eDRAM-Cache greift die HD Graphics P530 über das Interface des Prozessors auf den System-RAM zu (2x 64 Bit DDR3L-1600/DDR4-2133).
Performance
Die Leistung der HD Graphics P530 dürfte entsprechend der identischen technischen Daten genau auf dem Niveau der HD Graphics 530 liegen. Je nach Spiel kann die GPU damit in etwa mit einer dedizierten GeForce 920M konkurrieren und aktuelle Spiele (Stand 2015) zumeist in niedrigen, selten auch mittleren Einstellungen flüssig darstellen.
Features
Der überarbeitete Videodecoder decodiert nun auch H.265-/HEVC-Videos vollständig in Hardware und arbeitet dadurch deutlich effizienter als bislang. Die Bildausgabe erfolgt über DP 1.2/eDP 1.3 (max. 3.840 x 2.160 @ 60 Hz), wohingegen HDMI nur in der älteren Version 1.4a angeboten wird. Ein HDMI-2.0-Anschluss kann aber mittels Konverter von DisplayPort ergänzt werden. Maximal lassen sich drei Displays parallel angesteuern.
Leistungsaufnahme
Mobile Xeon-Modelle wie der E3-1535M v5 werden von Intel mit einer TDP von 45 Watt spezifiziert, sodass die HD Graphics P530 vor allem in größeren Notebooks ab etwa 15 Zoll zu finden ist.
Intel UHD Graphics 615 ► remove from comparison
Die Intel UHD Graphics 615 (GT2) ist eine Prozessorgrafikkarte der im Sommer 2018 vorgestellten Amber-Lake-Generation. Als Nachfolger der Intel HD Graphics 615 (Kaby-Lake-Y) ist die UHD 615 dabei in der besonders sparsamen Y-Serie mit 5 Watt TDP zu finden. Die sogenannte GT2-Ausbaustufe der GPU verfügt über 24 Ausführungseinheiten (EUs) und taktet je nach Modell mit bis zu 1.000 MHz. Technisch gibt es keine Unterschiede zur alten HD Graphics 615, nur die Taktraten wurden leicht abgeändert und durch den verbesserten 14nm++ Prozess könnte der Turbo etwas länger gehalten werden.
Mangels eigenem Grafikspeicher oder eDRAM-Cache greift die UHD Graphics 615 über das Interface des Prozessors auf den System-RAM zu (2x 64 Bit DDR3L/LPDDR3).
Performance
Die exakte Leistung der UHD Graphics 615 hängt stark vom jeweiligen CPU-Modell sowie dem konkreten Endgerät ab, da sich Maximaltaktrate sowie TDP-Konfiguration/Kühlung erheblich unterscheiden können. Zum anderen bestimmt auch der verwendete Speicher (DDR3L/LPDDR3) die Performance. Insgesamt dürfte die UHD 615 etwa das Niveau der alten Kaby-Lake HD Graphics 615 erreichen. Einige aktuelle anspruchslose Spiele wie Farming Simulator 17 oder Rocket League können so in niedrigsten Einstellungen flüssig dargestellt werden. Mit gelegentlichen Rucklern muss man jedoch immer rechnen. Detaillierte Benchmarks und viele Spieletests der gleich schnellen HD Graphics 615 finden sie hier .
Anders als Skylake kann Kaby Lake und damit auch Amber Lake nun auch H.265/HEVC im Main10-Profil mit 10 Bit Farbtiefe sowie Googles VP9-Codec in Hardware decodieren. HDCP 2.2 sollte unterstützt werden, was beispielsweise für die Ausgabe von Netflix-Videos in 4K benötigt wird. HDMI 2.0 unterstützt die UHD Graphics 615 jedoch weiterhin nur per Wandler (LSPCon) über den DisplayPort.
Leistungsaufnahme
Die UHD Graphics 615 ist in ULV-Prozessoren der 5-Watt-Klasse zu finden (TDP kann vom Gerätehersteller angepasst werden) und damit für passiv gekühlte Tablets und Ultrabooks geeignet.
Intel HD Graphics 405 (Braswell) ► remove from comparison
Die Intel HD Graphics 405 ist eine in den Low-End-SoCs der Braswell-Serie (z.B. Pentium N3710 ) integrierte Grafikeinheit. Sie basiert auf der gleichen Architektur wie die GPU verschiedener Broadwell-Prozessoren (z.B. HD Graphics 5300 ), bietet allerdings deutlich weniger Shadereinheiten und geringere Taktraten. Die genauen Spezifikationen hängen vom jeweiligen SoC ab: Die schnellste Variante mit 16 EUs und maximal 700 MHz schlägt die ältere HD Graphics (Bay Trail) um etwa Faktor zwei. Vor 2016 war die Grafikkarte nur unter Intel HD Graphics (Braswell) bekannt und beinhaltete 12 und 16-Kern-Modelle.
Anwender müssen sich deshalb insbesondere bei den Celeron-Modellen, die zusätzlich durch die Beschneidung auf nur zwei CPU-Kerne ausgebremst werden, auf ältere und anspruchslose Spiele beschränken. Videos werden dagegen auch in 4K/H.265 flüssig wiedergeben.
Weitere Benchmarks sind daher auch auf unserer Seite der Intel HD Graphics (Braswell) zu finden.
Intel HD Graphics P530 Intel UHD Graphics 615 Intel HD Graphics 405 (Braswell) HD Graphics Serie Codename Skylake GT2 Kaby-Lake GT2 Braswell Architektur Gen. 9 Skylake Gen. 9 Amber Lake Gen. 8 Pipelines 24 - unified 24 - unified 16 - unified Kerntakt 350 - 1050 (Boost) MHz 300 - 1000 (Boost) MHz 320 - 700 (Boost) MHz Speicherbandbreite 64/128 Bit 64/128 Bit 64/128 Bit Speichertyp DDR3/DDR4 DDR3L/LPDDR3 Shared Memory ja ja ja API DirectX 12_1, OpenGL 4.4 DirectX 12_1, OpenGL 4.4 DirectX 11.2, Shader 5.0 Herstellungsprozess 14 nm 14 nm 14 nm Features QuickSync QuickSync Erscheinungsdatum 01.09.2015 30.08.2018 01.04.2016 Stromverbrauch 5 Watt
CPU in HD Graphics P530 GPU Base Speed GPU Boost / Turbo Intel Xeon E3-1535M v5 4 x 2900 MHz, 45 W 350 MHz 1050 MHz Intel Xeon E3-1505M v5 4 x 2800 MHz, 45 W 350 MHz 1050 MHz min. - max. 350 MHz 1050 MHz
CPU in UHD Graphics 615 GPU Base Speed GPU Boost / Turbo Intel Core i5-10310Y 4 x 1100 MHz, 7 W 300 MHz 1050 MHz Intel Core i5-10210Y 4 x 1000 MHz, 7 W 300 MHz 1050 MHz Intel Core i7-8500Y 2 x 1500 MHz, 5 W 300 MHz 1000 MHz » show 6 more Intel Core i3-10110Y 2 x 1000 MHz, 7 W 300 MHz 1000 MHz Intel Core i5-8200Y 2 x 1300 MHz, 5 W 300 MHz 950 MHz Intel Core i3-10100Y 2 x 1300 MHz, 5 W 300 MHz 1000 MHz Intel Core m3-8100Y 2 x 1100 MHz, 5 W 300 MHz 950 MHz Intel Pentium Gold 6500Y 2 x 1100 MHz, 5 W 300 MHz 900 MHz Intel Pentium Gold 4425Y 2 x 1700 MHz, 6 W 300 MHz 850 MHz min. - max. 300 - 350 MHz 850 - 1050 MHz
CPU in HD Graphics 405 (Braswell) GPU Base Speed GPU Boost / Turbo Intel Pentium N3710 4 x 1600 MHz, 6 W 400 MHz 700 MHz Intel Atom x7-Z8750 4 x 1600 MHz 400 MHz 600 MHz min. - max. 300 - 400 MHz 600 - 1050 MHz
Benchmarks Performance Rating - 3DMark 11 + Fire Strike + Time Spy - UHD Graphics 615
0.4 pt (1%)
...
...
max:
Performance Rating - 3DMark 11 + Fire Strike + Time Spy - HD Graphics 405 (Braswell)
0.1 pt (0%)
Intel HD Graphics 405 (Braswell)
...
max:
3DMark - 3DMark Time Spy Score
min: 232 avg: 277.2 median: 275 (1%) max: 328 Points
3DMark - 3DMark Time Spy Graphics
min: 205 avg: 244.7 median: 242.5 (1%) max: 289 Points
3DMark - 3DMark Ice Storm Unlimited Graphics
min: 50702 avg: 60159 median: 57024 (6%) max: 73265 Points
min: 19812 avg: 23763 median: 23763 (2%) max: 27714 Points
3DMark - 3DMark Ice Storm Extreme Graphics
min: 23099 avg: 26792 median: 25456 (3%) max: 35452 Points
min: 12601 avg: 14069 median: 14068.5 (2%) max: 15536 Points
3DMark - 3DMark Cloud Gate Score
min: 3490 avg: 4533 median: 4423 (4%) max: 5622 Points
min: 1743 avg: 2000 median: 1933 (2%) max: 2392 Points
3DMark - 3DMark Cloud Gate Graphics
min: 4521 avg: 6316 median: 6583 (2%) max: 7568 Points
min: 1767 avg: 2206 median: 2113 (1%) max: 2831 Points
3DMark - 3DMark Fire Strike Standard Score
min: 509 avg: 730 median: 738 (1%) max: 881 Points
min: 216 avg: 237.5 median: 237.5 (0%) max: 259 Points
3DMark - 3DMark Fire Strike Standard Graphics
min: 563 avg: 816 median: 819 (1%) max: 976 Points
min: 231 avg: 254.5 median: 254.5 (0%) max: 278 Points
3DMark - 3DMark Ice Storm Graphics
min: 34728 avg: 42945 median: 42909 (5%) max: 53693 Points
min: 26056 avg: 28119 median: 28119 (3%) max: 30182 Points
3DMark - 3DMark Sling Shot (ES 3.0)
2413 Points (21%)
3DMark - 3DMark Sling Shot (ES 3.0) Graphics
3161 Points (19%)
3DMark - 3DMark Sling Shot Extreme (ES 3.1)
1838 Points (9%)
3DMark - 3DMark Sling Shot Extreme (ES 3.1) Graphics
2049 Points (7%)
3DMark - 3DMark Wild Life Unlimited
1911 Points (1%)
3DMark - 3DMark Wild Life Extreme Unlimited
530 Points (1%)
3DMark - 3DMark Night Raid
min: 2535 avg: 2962 median: 2975 (3%) max: 3376 Points
3DMark - 3DMark Night Raid Graphics Score
min: 2887 avg: 3543 median: 3810 (1%) max: 3933 Points
3DMark 11 - 3DM11 Performance Score
min: 893 avg: 1271 median: 1312.5 (2%) max: 1504 Points
min: 451 avg: 523 median: 537 (1%) max: 565 Points
3DMark 11 - 3DM11 Performance GPU
min: 821 avg: 1175 median: 1221 (1%) max: 1378 Points
min: 408 avg: 469.1 median: 473 (0%) max: 496 Points
3DMark Vantage + Intel UHD Graphics 615 3DMark Vantage - 3DM Vant. Perf. total
3813 Points (1%)
3DM Vant. Perf. total + Intel HD Graphics 405 (Braswell)
2081 Points (1%)
3DM Vant. Perf. GPU no PhysX + Intel UHD Graphics 615 3DMark Vantage - 3DM Vant. Perf. GPU no PhysX
3240 Points (2%)
3DM Vant. Perf. GPU no PhysX + Intel HD Graphics 405 (Braswell)
1730 Points (1%)
3DMark 06 3DMark 06 - Standard 1280x1024 + Intel UHD Graphics 615
min: 6386 avg: 6602 median: 6601.5 (9%) max: 6817 Points
3DMark 06 - Standard 1280x1024 + Intel HD Graphics 405 (Braswell)
min: 2274 avg: 2920 median: 2920 (4%) max: 3566 Points
Unigine Heaven 2.1 - Heaven 2.1 high
7.4 fps (1%)
Cinebench R10 Cinebench R10 Shading (32bit) + Intel UHD Graphics 615 Cinebench R10 - Cinebench R10 Shading (32bit)
min: 4302 avg: 6351 median: 6378 (5%) max: 8347 Points
Cinebench R10 Shading (32bit) + Intel HD Graphics 405 (Braswell)
min: 2412 avg: 2685 median: 2753 (2%) max: 2822 Points
Cinebench R11.5 Cinebench R11.5 OpenGL 64 Bit + Intel UHD Graphics 615 Cinebench R11.5 - Cinebench R11.5 OpenGL 64 Bit
min: 19.94 avg: 24.9 median: 25.6 (8%) max: 28.49 fps
Cinebench R11.5 OpenGL 64 Bit + Intel HD Graphics 405 (Braswell)
min: 10.24 avg: 11.7 median: 11.7 (4%) max: 13.06 fps
Cinebench R15 + Intel UHD Graphics 615 Cinebench R15 - Cinebench R15 OpenGL 64 Bit
min: 22.54 avg: 32.9 median: 35.2 (2%) max: 44.49 fps
Cinebench R15 OpenGL 64 Bit + Intel HD Graphics 405 (Braswell)
min: 10.3 avg: 13.8 median: 14.1 (1%) max: 15.74 fps
Cinebench R15 OpenGL Ref. Match 64 Bit + Intel UHD Graphics 615 Cinebench R15 - Cinebench R15 OpenGL Ref. Match 64 Bit
97.8 % (98%)
Cinebench R15 OpenGL Ref. Match 64 Bit + Intel HD Graphics 405 (Braswell)
min: 9 avg: 83.2 median: 98 (98%) max: 98 %
GFXBench - GFXBench 5.0 Aztec Ruins High Tier Offscreen
min: 6.5 avg: 7.1 median: 7.1 (1%) max: 7.6 fps
GFXBench - GFXBench 5.0 Aztec Ruins Normal Tier Offscreen
min: 16 avg: 18.1 median: 18.1 (1%) max: 20.2 fps
GFXBench - GFXBench Car Chase Offscreen
min: 15 avg: 17.7 median: 17.3 (2%) max: 20.9 fps
9.9 fps (1%)
GFXBench 3.1 - GFXBench Manhattan ES 3.1 Offscreen
min: 22 avg: 24.7 median: 24.4 (1%) max: 27.7 fps
20.3 fps (0%)
GFXBench 3.0 - GFXBench 3.0 Manhattan Offscreen
min: 32 avg: 36.6 median: 36.8 (2%) max: 40.9 fps
20.3 fps (1%)
GFXBench (DX / GLBenchmark) 2.7 + Intel UHD Graphics 615 GFXBench (DX / GLBenchmark) 2.7 - GFXBench T-Rex HD Offscreen C24Z16
min: 65 avg: 74.2 median: 69.6 (1%) max: 88 fps
GFXBench T-Rex HD Offscreen C24Z16 + Intel HD Graphics 405 (Braswell) 41.3 fps (0%)
Geekbench 6.3 - Geekbench 6.3 GPU OpenCL
3272 Points (1%)
Geekbench 6.3 - Geekbench 6.3 GPU Vulkan
4154 Points (1%)
LuxMark v2.0 64Bit - LuxMark v2.0 Room GPU
198 Samples/s (1%)
min: 56 avg: 68 median: 68 (0%) max: 80 Samples/s
LuxMark v2.0 64Bit - LuxMark v2.0 Sala GPU
473 Samples/s (1%)
min: 81 avg: 102.5 median: 102.5 (0%) max: 124 Samples/s
ComputeMark v2.1 - ComputeMark v2.1 Result
860 Points (1%)
min: 388 avg: 390.5 median: 390.5 (0%) max: 393 Points
Power Consumption - Furmark Stress Test Power Consumption - external Monitor *
21 Watt (3%)
9.8 Watt (1%)
Average Benchmarks Intel UHD Graphics 615 → 0% n=0 Average Benchmarks Intel HD Graphics 405 (Braswell) → 0% n=0
- Bereich der Benchmarkergebnisse für diese Grafikkarte
- Durchschnittliche Benchmarkergebnisse für diese Grafikkarte
* Smaller numbers mean a higher performance
1 This benchmark is not used for the average calculation
Spiele-Benchmarks Die folgenden Benchmarks basieren auf unseren Spieletests mit Testnotebooks. Die Performance dieser Grafikkarte bei den gelisteten Spielen ist abhängig von der verwendeten CPU, Speicherausstattung, Treiber und auch Betriebssystem. Dadurch müssen die untenstehenden Werte nicht repräsentativ sein. Detaillierte Informationen über das verwendete System sehen Sie nach einem Klick auf den fps-Wert.
HD Graphics 405 (Braswell):
17.8 fps
HD Graphics 405 (Braswell):
18 fps
HD Graphics 405 (Braswell):
9.9 fps
UHD Graphics 615:
17.7 fps
HD Graphics 405 (Braswell):
23.6 fps
HD Graphics 405 (Braswell):
18 fps
HD Graphics 405 (Braswell):
13.9 fps
UHD Graphics 615:
15.2 fps
UHD Graphics 615:
19.2 fps
UHD Graphics 615:
7 [X] HP Spectre Folio 13-ak0020ng Intel Core i7-8500Y 1.5GHz
UHD Graphics 615
fps
UHD Graphics 615:
10.5 [X] HP Spectre Folio 13-ak0020ng Intel Core i7-8500Y 1.5GHz
UHD Graphics 615
fps
UHD Graphics 615:
15.7 [X] HP Spectre Folio 13-ak0020ng Intel Core i7-8500Y 1.5GHz
UHD Graphics 615
fps
UHD Graphics 615:
5 [X] HP Spectre Folio 13-ak0020ng Intel Core i7-8500Y 1.5GHz
UHD Graphics 615
fps
UHD Graphics 615:
42.1 [X] HP Spectre Folio 13-ak0020ng Intel Core i7-8500Y 1.5GHz
UHD Graphics 615
fps
UHD Graphics 615:
15.8 [X] HP Spectre Folio 13-ak0020ng Intel Core i7-8500Y 1.5GHz
UHD Graphics 615
fps
UHD Graphics 615:
7.6 [X] HP Spectre Folio 13-ak0020ng Intel Core i7-8500Y 1.5GHz
UHD Graphics 615
fps
UHD Graphics 615:
7 [X] HP Spectre Folio 13-ak0020ng Intel Core i7-8500Y 1.5GHz
UHD Graphics 615
fps
UHD Graphics 615:
13 [X] HP Spectre Folio 13-ak0020ng Intel Core i7-8500Y 1.5GHz
UHD Graphics 615
fps
UHD Graphics 615:
10 [X] HP Spectre Folio 13-ak0020ng Intel Core i7-8500Y 1.5GHz
UHD Graphics 615
fps
UHD Graphics 615:
19 [X] HP Spectre Folio 13-ak0020ng Intel Core i7-8500Y 1.5GHz
UHD Graphics 615
fps
UHD Graphics 615:
12 [X] HP Spectre Folio 13-ak0020ng Intel Core i7-8500Y 1.5GHz
UHD Graphics 615
fps
UHD Graphics 615:
11.5 [X] HP Spectre Folio 13-ak0020ng Intel Core i7-8500Y 1.5GHz
UHD Graphics 615
fps
HD Graphics 405 (Braswell):
0 (!) [X] Teclast Tbook 16 Power Intel Atom x7-Z8750 1.6GHz
HD Graphics 405 (Braswell)
fps
HD Graphics 405 (Braswell):
37 fps
HD Graphics 405 (Braswell):
24 fps
HD Graphics 405 (Braswell):
25 fps
HD Graphics 405 (Braswell):
30 fps
HD Graphics 405 (Braswell):
37 fps
UHD Graphics 615:
95.1 fps
UHD Graphics 615:
11.8 fps
UHD Graphics 615:
7.8 [X] Microsoft Surface Go 2 Pentium Gold 4425Y Intel Pentium Gold 4425Y 1.7GHz
UHD Graphics 615
8.1 10 [X] Chuwi AeroBook Pro Intel Core m3-8100Y 1.1GHz
UHD Graphics 615
10.2 19.2 ~ 11 fps
UHD Graphics 615:
6.3 6.5 [X] Microsoft Surface Go 2 Pentium Gold 4425Y Intel Pentium Gold 4425Y 1.7GHz
UHD Graphics 615
7.2 [X] Chuwi AeroBook Pro Intel Core m3-8100Y 1.1GHz
UHD Graphics 615
8.2 12.5 ~ 8 fps
UHD Graphics 615:
6 [X] Microsoft Surface Go 2 Pentium Gold 4425Y Intel Pentium Gold 4425Y 1.7GHz
UHD Graphics 615
6.1 7.7 11.3 ~ 8 fps
UHD Graphics 615:
15.9 fps
UHD Graphics 615:
9.2 [X] HP Spectre Folio 13-ak0020ng Intel Core i7-8500Y 1.5GHz
UHD Graphics 615
fps
UHD Graphics 615:
15 17 [X] HP Spectre Folio 13-ak0020ng Intel Core i7-8500Y 1.5GHz
UHD Graphics 615
~ 16 fps
UHD Graphics 615:
51.8 [X] HP Spectre Folio 13-ak0020ng Intel Core i7-8500Y 1.5GHz
UHD Graphics 615
fps
HD Graphics 405 (Braswell):
19.6 fps
UHD Graphics 615:
45.6 [X] HP Spectre Folio 13-ak0020ng Intel Core i7-8500Y 1.5GHz
UHD Graphics 615
fps
UHD Graphics 615:
29 [X] HP Spectre Folio 13-ak0020ng Intel Core i7-8500Y 1.5GHz
UHD Graphics 615
fps
UHD Graphics 615:
33.2 49.1 [X] HP Spectre Folio 13-ak0020ng Intel Core i7-8500Y 1.5GHz
UHD Graphics 615
~ 41 fps
HD Graphics 405 (Braswell):
18.7 fps
UHD Graphics 615:
10.3 fps
UHD Graphics 615:
14.1 16.8 [X] HP Spectre Folio 13-ak0020ng Intel Core i7-8500Y 1.5GHz
UHD Graphics 615
~ 15 fps
UHD Graphics 615:
6.9 8.6 [X] HP Spectre Folio 13-ak0020ng Intel Core i7-8500Y 1.5GHz
UHD Graphics 615
~ 8 fps
UHD Graphics 615:
8.1 [X] HP Spectre Folio 13-ak0020ng Intel Core i7-8500Y 1.5GHz
UHD Graphics 615
fps
UHD Graphics 615:
16.4 [X] HP Spectre Folio 13-ak0020ng Intel Core i7-8500Y 1.5GHz
UHD Graphics 615
fps
HD Graphics 405 (Braswell):
13.5 fps
HD Graphics 405 (Braswell):
11 fps
HD Graphics 405 (Braswell):
14.4 fps
HD Graphics 405 (Braswell):
10.5 fps
HD Graphics 405 (Braswell):
17.6 31.3 ~ 24 fps
HD Graphics 405 (Braswell):
21.3 fps
UHD Graphics 615:
29.5 [X] HP Spectre Folio 13-ak0020ng Intel Core i7-8500Y 1.5GHz
UHD Graphics 615
fps
HD Graphics 405 (Braswell):
12.2 fps
HD Graphics 405 (Braswell):
5.2 fps
HD Graphics 405 (Braswell):
10.5 fps
HD Graphics 405 (Braswell):
6.1 fps
UHD Graphics 615:
29.9 [X] HP Spectre Folio 13-ak0020ng Intel Core i7-8500Y 1.5GHz
UHD Graphics 615
fps
UHD Graphics 615:
21.6 [X] HP Spectre Folio 13-ak0020ng Intel Core i7-8500Y 1.5GHz
UHD Graphics 615
fps
HD Graphics 405 (Braswell):
7.1 fps
UHD Graphics 615:
6.3 9.9 ~ 8 fps
HD Graphics 405 (Braswell):
4.2 fps
UHD Graphics 615:
31.3 [X] HP Spectre Folio 13-ak0020ng Intel Core i7-8500Y 1.5GHz
UHD Graphics 615
fps
HD Graphics 405 (Braswell):
15.3 fps
UHD Graphics 615:
19.5 [X] HP Spectre Folio 13-ak0020ng Intel Core i7-8500Y 1.5GHz
UHD Graphics 615
fps
HD Graphics 405 (Braswell):
8.9 fps
HD Graphics 405 (Braswell):
10.8 fps
HD Graphics 405 (Braswell):
6.9 fps
UHD Graphics 615:
53 [X] HP Spectre Folio 13-ak0020ng Intel Core i7-8500Y 1.5GHz
UHD Graphics 615
fps
HD Graphics 405 (Braswell):
15 21.8 ~ 18 fps
UHD Graphics 615:
34.6 [X] HP Spectre Folio 13-ak0020ng Intel Core i7-8500Y 1.5GHz
UHD Graphics 615
fps
HD Graphics 405 (Braswell):
16.2 fps
HD Graphics 405 (Braswell):
18.8 fps
HD Graphics 405 (Braswell):
13 fps
UHD Graphics 615:
40.8 [X] Chuwi AeroBook Pro Intel Core m3-8100Y 1.1GHz
UHD Graphics 615
min:
35.2 fps, max:
-1 fps
49.5 [X] Microsoft Surface Go 2 Pentium Gold 4425Y Intel Pentium Gold 4425Y 1.7GHz
UHD Graphics 615
min:
40.6 fps, max:
-1 fps
52 52.6 55.3 [X] HP Spectre Folio 13-ak0020ng Intel Core i7-8500Y 1.5GHz
UHD Graphics 615
56.6 57.2 60.1 ~ 53 fps
HD Graphics 405 (Braswell):
22.1 35.2 ~ 29 fps
UHD Graphics 615:
17.4 17.7 [X] Chuwi AeroBook Pro Intel Core m3-8100Y 1.1GHz
UHD Graphics 615
min:
15 fps, max:
-1 fps
25.9 25.9 26.3 27.3 [X] HP Spectre Folio 13-ak0020ng Intel Core i7-8500Y 1.5GHz
UHD Graphics 615
29.3 32.1 [X] Microsoft Surface Go 2 Pentium Gold 4425Y Intel Pentium Gold 4425Y 1.7GHz
UHD Graphics 615
min:
27.7 fps, max:
-1 fps
~ 25 fps
HD Graphics 405 (Braswell):
13.7 22.8 ~ 18 fps
UHD Graphics 615:
8.5 [X] Chuwi AeroBook Pro Intel Core m3-8100Y 1.1GHz
UHD Graphics 615
min:
7.7 fps, max:
-1 fps
11.3 12.1 12.9 13.4 [X] Microsoft Surface Go 2 Pentium Gold 4425Y Intel Pentium Gold 4425Y 1.7GHz
UHD Graphics 615
min:
12.1 fps, max:
-1 fps
13.6 15.2 15.4 [X] HP Spectre Folio 13-ak0020ng Intel Core i7-8500Y 1.5GHz
UHD Graphics 615
~ 13 fps
UHD Graphics 615:
7.6 [X] Chuwi AeroBook Pro Intel Core m3-8100Y 1.1GHz
UHD Graphics 615
min:
7.1 fps, max:
-1 fps
10.3 11.3 11.6 11.8 [X] Microsoft Surface Go 2 Pentium Gold 4425Y Intel Pentium Gold 4425Y 1.7GHz
UHD Graphics 615
min:
10.8 fps, max:
-1 fps
12.3 13.7 ~ 11 fps
HD Graphics 405 (Braswell):
41.5 fps
HD Graphics 405 (Braswell):
12.5 fps
UHD Graphics 615:
16.4 fps
UHD Graphics 615:
16.9 fps
HD Graphics 405 (Braswell):
12.1 fps
HD Graphics 405 (Braswell):
7.6 fps
HD Graphics 405 (Braswell):
28 fps
HD Graphics 405 (Braswell):
17 fps
HD Graphics 405 (Braswell):
18.9 fps
HD Graphics 405 (Braswell):
13.6 fps
UHD Graphics 615:
27.8 [X] HP Spectre Folio 13-ak0020ng Intel Core i7-8500Y 1.5GHz
UHD Graphics 615
fps
UHD Graphics 615:
16.7 [X] HP Spectre Folio 13-ak0020ng Intel Core i7-8500Y 1.5GHz
UHD Graphics 615
fps
HD Graphics 405 (Braswell):
77.5 fps
HD Graphics 405 (Braswell):
19.6 fps
HD Graphics 405 (Braswell):
14 fps
HD Graphics 405 (Braswell):
9.1 fps
UHD Graphics 615:
97.4 [X] HP Spectre Folio 13-ak0020ng Intel Core i7-8500Y 1.5GHz
UHD Graphics 615
fps
HD Graphics 405 (Braswell):
50.5 fps
UHD Graphics 615:
34.4 [X] HP Spectre Folio 13-ak0020ng Intel Core i7-8500Y 1.5GHz
UHD Graphics 615
fps
HD Graphics 405 (Braswell):
15 fps
UHD Graphics 615:
24.7 [X] HP Spectre Folio 13-ak0020ng Intel Core i7-8500Y 1.5GHz
UHD Graphics 615
fps
HD Graphics 405 (Braswell):
6 fps
HD Graphics 405 (Braswell):
16.5 fps
HD Graphics 405 (Braswell):
12.5 fps
HD Graphics 405 (Braswell):
8.3 fps
HD Graphics 405 (Braswell):
9.2 10 ~ 10 fps
UHD Graphics 615:
51.2 59.9 [X] HP Spectre Folio 13-ak0020ng Intel Core i7-8500Y 1.5GHz
UHD Graphics 615
~ 56 fps
HD Graphics 405 (Braswell):
27.8 fps
UHD Graphics 615:
25.7 31.4 [X] HP Spectre Folio 13-ak0020ng Intel Core i7-8500Y 1.5GHz
UHD Graphics 615
~ 29 fps
HD Graphics 405 (Braswell):
12.8 fps
UHD Graphics 615:
16.9 21.2 [X] HP Spectre Folio 13-ak0020ng Intel Core i7-8500Y 1.5GHz
UHD Graphics 615
~ 19 fps
HD Graphics 405 (Braswell):
9.5 fps
HD Graphics 405 (Braswell):
43.2 fps
HD Graphics 405 (Braswell):
19.6 fps
HD Graphics 405 (Braswell):
14.3 fps
UHD Graphics 615:
100.2 [X] HP Spectre Folio 13-ak0020ng Intel Core i7-8500Y 1.5GHz
UHD Graphics 615
fps
HD Graphics 405 (Braswell):
42.6 fps
UHD Graphics 615:
61.4 [X] HP Spectre Folio 13-ak0020ng Intel Core i7-8500Y 1.5GHz
UHD Graphics 615
fps
HD Graphics 405 (Braswell):
32 fps
UHD Graphics 615:
36 [X] HP Spectre Folio 13-ak0020ng Intel Core i7-8500Y 1.5GHz
UHD Graphics 615
fps
HD Graphics 405 (Braswell):
20.4 fps
UHD Graphics 615:
54.7 [X] HP Spectre Folio 13-ak0020ng Intel Core i7-8500Y 1.5GHz
UHD Graphics 615
fps
HD Graphics 405 (Braswell):
32 fps
UHD Graphics 615:
37.5 [X] HP Spectre Folio 13-ak0020ng Intel Core i7-8500Y 1.5GHz
UHD Graphics 615
fps
HD Graphics 405 (Braswell):
19.1 fps
UHD Graphics 615:
33.9 [X] HP Spectre Folio 13-ak0020ng Intel Core i7-8500Y 1.5GHz
UHD Graphics 615
fps
HD Graphics 405 (Braswell):
14.4 fps
UHD Graphics 615:
19.4 [X] HP Spectre Folio 13-ak0020ng Intel Core i7-8500Y 1.5GHz
UHD Graphics 615
fps
UHD Graphics 615:
41.7 [X] HP Spectre Folio 13-ak0020ng Intel Core i7-8500Y 1.5GHz
UHD Graphics 615
fps
HD Graphics 405 (Braswell):
21.8 fps
UHD Graphics 615:
23.3 [X] HP Spectre Folio 13-ak0020ng Intel Core i7-8500Y 1.5GHz
UHD Graphics 615
fps
HD Graphics 405 (Braswell):
10.4 fps
HD Graphics 405 (Braswell):
6.5 fps
UHD Graphics 615:
58 [X] HP Spectre Folio 13-ak0020ng Intel Core i7-8500Y 1.5GHz
UHD Graphics 615
fps
HD Graphics 405 (Braswell):
35.4 fps
UHD Graphics 615:
39.6 [X] HP Spectre Folio 13-ak0020ng Intel Core i7-8500Y 1.5GHz
UHD Graphics 615
fps
HD Graphics 405 (Braswell):
14.7 fps
UHD Graphics 615:
16 [X] HP Spectre Folio 13-ak0020ng Intel Core i7-8500Y 1.5GHz
UHD Graphics 615
fps
UHD Graphics 615:
144.1 [X] HP Spectre Folio 13-ak0020ng Intel Core i7-8500Y 1.5GHz
UHD Graphics 615
fps
UHD Graphics 615:
36.3 [X] HP Spectre Folio 13-ak0020ng Intel Core i7-8500Y 1.5GHz
UHD Graphics 615
fps
UHD Graphics 615:
23.5 [X] HP Spectre Folio 13-ak0020ng Intel Core i7-8500Y 1.5GHz
UHD Graphics 615
fps
v1.28
log 14. 09:25:45
#0 ran 0s before starting gpusingle class +0s ... 0s
#1 checking url part for id 6452 +0s ... 0s
#2 checking url part for id 8832 +0s ... 0s
#3 checking url part for id 7348 +0s ... 0s
#4 redirected to Ajax server, took 1731572745s time from redirect:0 +0s ... 0s
#5 did not recreate cache, as it is less than 5 days old! Created at Wed, 13 Nov 2024 05:16:40 +0100 +0s ... 0s
#6 composed specs +0.005s ... 0.006s
#7 did output specs +0s ... 0.006s
#8 start showIntegratedCPUs +0s ... 0.006s
#9 getting avg benchmarks for device 6452 +0.02s ... 0.026s
#10 got single benchmarks 6452 +0s ... 0.026s
#11 getting avg benchmarks for device 8832 +0.001s ... 0.027s
#12 got single benchmarks 8832 +0.002s ... 0.029s
#13 getting avg benchmarks for device 7348 +0.004s ... 0.033s
#14 got single benchmarks 7348 +0.01s ... 0.043s
#15 got avg benchmarks for devices +0s ... 0.043s
#16 min, max, avg, median took s +0.02s ... 0.063s
#17 before gaming benchmark output +0s ... 0.063s
#18 Got 264 rows for game benchmarks. +0.021s ... 0.085s
#19 composed SQL query for gamebenchmarks +0s ... 0.085s
#20 got data and put it in $dataArray +0.003s ... 0.088s
#21 benchmarks composed for output. +0.023s ... 0.111s
#22 calculated avg scores. +0s ... 0.111s
#23 return log +0.001s ... 0.112s
Teilen Sie diesen Artikel, um uns zu unterstützen. Jeder Link hilft!
Autor: Klaus Hinum, 8.09.2017 (Update: 1.07.2023)
 Deutsch
 English
 Español
 Français
 Italiano
 Nederlands
 Polski
 Português
 Русский
 Türkçe
 Svenska
 Chinese
 Magyar