Notebookcheck Logo

Intel HD Graphics P530 vs AMD Radeon 660M vs Intel HD Graphics (Ivy Bridge)

Intel HD Graphics P530

► remove from comparison Intel HD Graphics P530

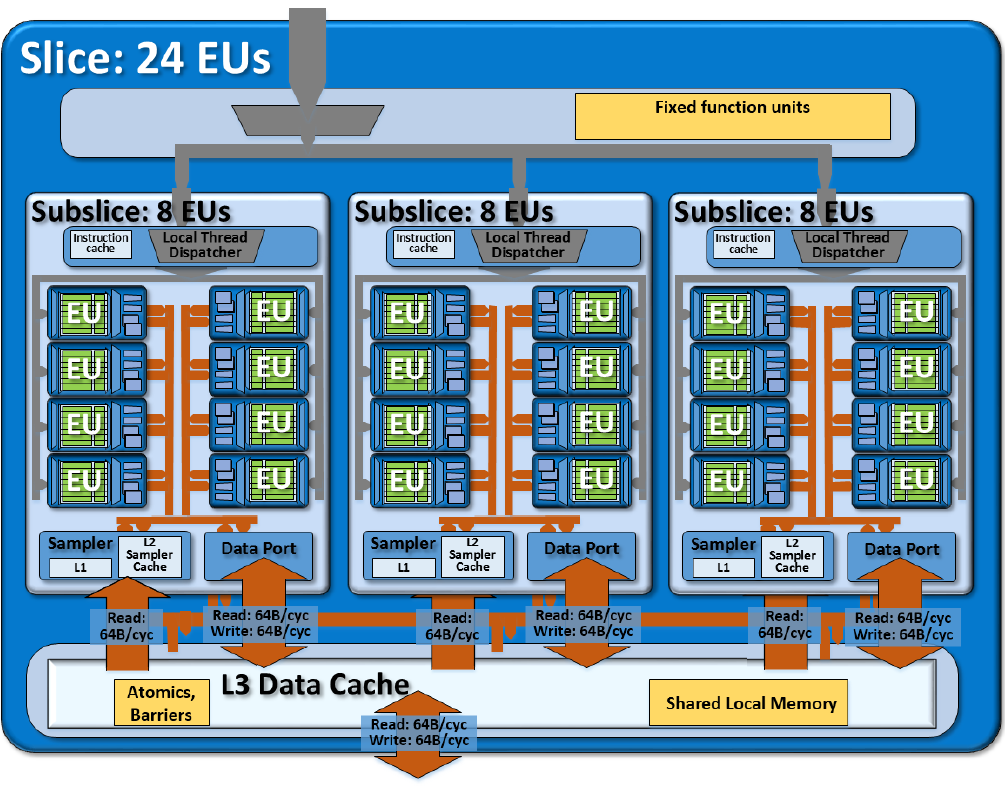
Die Intel HD Graphics P530 (GT2) ist eine integrierte Grafikeinheit, die in Skylake-Prozessoren der Xeon-Baureihe für Workstation-Notebooks verbaut wird. Die mittlere, auch "GT2" genannte Ausbaustufe verfügt über 24 EUs (Execution Units bzw. Ausführungseinheiten) und taktet je nach Modell mit bis zu 1.050 MHz (Turbo). Mangels eigenem Grafikspeicher oder eDRAM-Cache greift die HD Graphics P530 über das Interface des Prozessors auf den System-RAM zu (2x 64 Bit DDR3L-1600/DDR4-2133).

Performance

Die Leistung der HD Graphics P530 dürfte entsprechend der identischen technischen Daten genau auf dem Niveau der HD Graphics 530 liegen. Je nach Spiel kann die GPU damit in etwa mit einer dedizierten GeForce 920M konkurrieren und aktuelle Spiele (Stand 2015) zumeist in niedrigen, selten auch mittleren Einstellungen flüssig darstellen.

Features

Der überarbeitete Videodecoder decodiert nun auch H.265-/HEVC-Videos vollständig in Hardware und arbeitet dadurch deutlich effizienter als bislang. Die Bildausgabe erfolgt über DP 1.2/eDP 1.3 (max. 3.840 x 2.160 @ 60 Hz), wohingegen HDMI nur in der älteren Version 1.4a angeboten wird. Ein HDMI-2.0-Anschluss kann aber mittels Konverter von DisplayPort ergänzt werden. Maximal lassen sich drei Displays parallel angesteuern.

Leistungsaufnahme

Mobile Xeon-Modelle wie der E3-1535M v5 werden von Intel mit einer TDP von 45 Watt spezifiziert, sodass die HD Graphics P530 vor allem in größeren Notebooks ab etwa 15 Zoll zu finden ist.

AMD Radeon 660M

► remove from comparison AMD Radeon 660M

Die AMD Radeon 660M (oder RX 660M) ist eine integrierte Grafikkarte (iGPU) für Notebooks. Sie befindet sich in den Einstiegs-Rembrandt-APUs (Ryzen 6000 Mobile) und bietet nur 6  (384 Shader) der 12 CUs. Sie nutzt die aktuelle RDNA 2 Architektur (wie die RX 6000M Serie). Die Taktrate ist abhängig vom CPU-Modell und rangiert beim Launch von 1,5 - 1,9 GHz (maximaler Boost-Takt). Die GPU hat keinen eigenen Grafikspeicher, sondern nutzt den gemeinsamen Hauptspeicher (bis zu LPDDR5 6400 MT/s oder DDR5 4800 MT/s). Als erste iGPU neben der 680M, unterstützt die 660M Raytracing in Hardware, ist jedoch bei aktuellen Spielen zu langsam um dieses Feature sinnvoll nutzen zu können.

Die Leistung der GPU ist abhängig von der CPU, dem konfiguriertem TDP (15 - 45W+), der Kühlung und dem verbautem Hauptspeicher. Die Performance sollte durch die geringere CU-Anzahl und geringere Taktung deutlich hinter der Radeon 680M liegen und wohl nur auf dem Level der alten Vega 7 iGPUs.

Der Stromverbrauch ist dank 6nm Prozess und ausgeklügelten Stromsparmechanismen relativ gering (laut AMD) und daher eignet sich die Grafikkarte auch für dünne und leichte Notebooks (vor allem die 15W Varianten).

Intel HD Graphics (Ivy Bridge)

► remove from comparison Intel HD Graphics (Ivy Bridge)

Die Intel HD Graphics ist eine in den Ivy Bridge Prozessoren integrierte Grafikkarte. Sie kommt in den mobilen Celeron- und Pentium-Modellen zu Einsatz. Im Vergleich zur stärkeren Intel HD Graphics 4000, ist die HD Graphics deutlich abgespeckt und bietet weniger Execution Units (6 EUs) und Texture Sampler (nur einer). Daher ist die Performance deutlich geringer und liegt nur etwas oberhalb der alten Intel HD Graphics 2000. Je nach Prozessor weist die HD Graphics eine unterschiedliche Basis- und Turbo-Taktrate auf.

Da die Leistung nur zwischen der HD Graphics 2000 und 3000 liegt, ist die Ivy Bridge GT1 nur für ältere und anspruchslose Spiele ausreichend. Intel selbst gibt eine Geschwindigkeit 10-15% über der alten HD Graphics 2000 in Sandy Bridge CPUs an. Unsere Benchmarks (siehe weiter unten) zeigen eine Performance auf dem Niveau integrierter Einstiegslösungen von AMD wie der Radeon HD 8210.

Eine Besonderheit der Ivy Bride Grafikkerne ist, dass nur 4x MSAA von der Hardware unterstützt wird. 2x MSAA wird per Software berechnet und geht durch die 4x MSAA Pipeline. Daher empfiehlt sich der Einsatz des gleich schnellen 4x MSAA. 

Auch der integrierte Videodecoder genannt Multi Format Codec Engine (MFX) wurde kräftig überarbeitet und soll nun sogar mehrere 4K Videos parallel dekodieren können (ev. nur in den High-End Modellen). DXVA Checker gibt weiterhin die Formate MPEG2, VC1, WMV9 und H264 als unterstützt an. QuickSync zum schnellen Transkodieren von Videos wurde ebenfalls verbessert und soll nun schneller bei gleichzeitig höherer Qualität laufen.

Ebenfalls neu ist die Unterstützung für drei unabhängige Bildschirme. Bis Sandy Bridge waren nur zwei möglich und lediglich die AMD Grafikkarten mit Eyefinity Support bieten mehr als zwei Anschlüsse für Notebooks (jedoch nur mit DisplayPort). 

Aufgrund der Integration in den mit 22nm gefertigten Prozessor und die halbierte Shaderzahl ist der Stromverbrauch relativ gering und eignet sich auch für flache und kleine Notebooks.

Intel HD Graphics P530AMD Radeon 660MIntel HD Graphics (Ivy Bridge)
HD Graphics Serie
HD Graphics P530 24 @ 0.35 - 1.05 GHz64/128 Bit
HD Graphics 5600 24 @ 0.3 - 1.05 GHz64/128 Bit
HD Graphics 6000 48 @ 0.3 - 1 GHz64/128 Bit
HD Graphics 4600 20 @ 0.2 - 1.35 GHz64/128 Bit
HD Graphics 5500 24 @ 0.3 - 0.95 GHz64/128 Bit
HD Graphics 5000 40 @ 0.2 - 1.1 GHz64/128 Bit
HD Graphics 4400 20 @ 0.2 - 1.1 GHz64/128 Bit
HD Graphics 5300 24 @ 0.1 - 0.9 GHz64/128 Bit
HD Graphics 4000 16 @ 0.35 - 1.35 GHz64/128 Bit
HD Graphics (Broadwell) 12 @ 0.1 - 0.85 GHz64/128 Bit
HD Graphics 4200 20 @ 0.2 - 0.85 GHz64/128 Bit
HD Graphics (Skylake) 12 @ 0.3 - 0.8 GHz64/128 Bit
HD Graphics 405 (Braswell) 16 @ 0.32 - 0.7 GHz64/128 Bit
HD Graphics (Braswell) 16 @ 0.32 - 0.7 GHz64/128 Bit
HD Graphics 400 (Braswell) 12 @ 0.32 - 0.64 GHz64/128 Bit
HD Graphics (Haswell) 10 @ 0.2 - 1 GHz64/128 Bit
HD Graphics (Cherry Trail) 16 @ 0.2 - 0.6 GHz64/128 Bit
HD Graphics 3000 12 @ 0.35 - 1.35 GHz64/128 Bit
HD Graphics 2500 6 @ 0.65 - 1.15 GHz64/128 Bit
HD Graphics (Ivy Bridge) 6 @ 0.35 - 1.1 GHz64/128 Bit
HD Graphics 2000 6 @ 0.85 - 1.35 GHz64/128 Bit
HD Graphics (Sandy Bridge) 6 @ 0.35 - 1.1 GHz64/128 Bit
HD Graphics (Bay Trail) 4 @ 0.31 - 0.9 GHz32/64/128 Bit
Radeon 680M 768 @ 2.4 GHz
Radeon 660M 384 @ 1.9 GHz
Radeon Graphics (Ryzen 7000) 128 @ 2.2 GHz
Radeon 610M 128 @ 0.4 - 2.2 GHz
HD Graphics P530 24 @ 0.35 - 1.05 GHz64/128 Bit
HD Graphics 5600 24 @ 0.3 - 1.05 GHz64/128 Bit
HD Graphics 6000 48 @ 0.3 - 1 GHz64/128 Bit
HD Graphics 4600 20 @ 0.2 - 1.35 GHz64/128 Bit
HD Graphics 5500 24 @ 0.3 - 0.95 GHz64/128 Bit
HD Graphics 5000 40 @ 0.2 - 1.1 GHz64/128 Bit
HD Graphics 4400 20 @ 0.2 - 1.1 GHz64/128 Bit
HD Graphics 5300 24 @ 0.1 - 0.9 GHz64/128 Bit
HD Graphics 4000 16 @ 0.35 - 1.35 GHz64/128 Bit
HD Graphics (Broadwell) 12 @ 0.1 - 0.85 GHz64/128 Bit
HD Graphics 4200 20 @ 0.2 - 0.85 GHz64/128 Bit
HD Graphics (Skylake) 12 @ 0.3 - 0.8 GHz64/128 Bit
HD Graphics 405 (Braswell) 16 @ 0.32 - 0.7 GHz64/128 Bit
HD Graphics (Braswell) 16 @ 0.32 - 0.7 GHz64/128 Bit
HD Graphics 400 (Braswell) 12 @ 0.32 - 0.64 GHz64/128 Bit
HD Graphics (Haswell) 10 @ 0.2 - 1 GHz64/128 Bit
HD Graphics (Cherry Trail) 16 @ 0.2 - 0.6 GHz64/128 Bit
HD Graphics 3000 12 @ 0.35 - 1.35 GHz64/128 Bit
HD Graphics 2500 6 @ 0.65 - 1.15 GHz64/128 Bit
HD Graphics (Ivy Bridge) 6 @ 0.35 - 1.1 GHz64/128 Bit
HD Graphics 2000 6 @ 0.85 - 1.35 GHz64/128 Bit
HD Graphics (Sandy Bridge) 6 @ 0.35 - 1.1 GHz64/128 Bit
HD Graphics (Bay Trail) 4 @ 0.31 - 0.9 GHz32/64/128 Bit
CodenameSkylake GT2RDNA 2 RembrandtIvy Bridge GT1
ArchitekturGen. 9 SkylakeRDNA 2Gen. 7 Ivy Bridge
Pipelines24 - unified384 - unified6 - unified
Kerntakt350 - 1050 (Boost) MHz1900 (Boost) MHz350 - 1100 (Boost) MHz
Speicherbandbreite64/128 Bit64/128 Bit
SpeichertypDDR3/DDR4
Shared Memoryjaneinja
APIDirectX 12_1, OpenGL 4.4DirectX 12_1DirectX 11.0, Shader 5.0
Herstellungsprozess14 nm6 nm22 nm
FeaturesQuickSyncTiled Rasterization, Shared Memory (up to Dual-Channel DDR4-3200)
Erscheinungsdatum01.09.2015 04.01.2022 01.10.2012
Stromverbrauch45 Watt
CPU in HD Graphics P530GPU Base SpeedGPU Boost / Turbo
Intel Xeon E3-1535M v54 x 2900 MHz, 45 W350 MHz1050 MHz
Intel Xeon E3-1505M v54 x 2800 MHz, 45 W350 MHz1050 MHz
min. - max.350 MHz1050 MHz
CPU in Radeon 660MGPU Base SpeedGPU Boost / Turbo
AMD Ryzen 5 PRO 6650H6 x 3300 MHz, 45 W? MHz1900 MHz
AMD Ryzen 5 6600H6 x 3300 MHz, 45 W? MHz1900 MHz
AMD Ryzen 5 PRO 6650HS6 x 3300 MHz, 35 W? MHz1900 MHz
min. - max.? - 350 MHz1050 - 1900 MHz
CPU in HD Graphics (Ivy Bridge)GPU Base SpeedGPU Boost / Turbo
Intel Pentium 2030M2 x 2500 MHz, 35 W650 MHz1100 MHz
Intel Pentium 2020M2 x 2400 MHz, 35 W650 MHz1100 MHz
Intel Celeron 1020E2 x 2200 MHz, 35 W650 MHz1000 MHz
min. - max.350 - 650 MHz800 - 1900 MHz

Benchmarks

Performance Rating - 3DMark 11 + Fire Strike + Time Spy - Radeon 660M
2.2 pt (7%)
Performance Rating - 3DMark 11 + Fire Strike + Time Spy - HD Graphics (Ivy Bridge)
0.1 pt (0%)
3DMark - 3DMark Time Spy Score
min: 1153     avg: 1631     median: 1714.5 (5%)     max: 1793 Points
3DMark - 3DMark Time Spy Graphics
min: 1016     avg: 1442     median: 1544 (4%)     max: 1588 Points
3DMark - 3DMark Ice Storm Unlimited Graphics
283076 Points (29%)
3DMark - 3DMark Ice Storm Extreme Graphics
102211 Points (13%)
3DMark - 3DMark Cloud Gate Score
min: 18216     avg: 22289     median: 22811 (24%)     max: 24842 Points
3DMark - 3DMark Cloud Gate Graphics
min: 21857     avg: 30318     median: 31514.5 (8%)     max: 33949 Points
3DMark - 3DMark Fire Strike Standard Score
min: 3216     avg: 4184     median: 4472 (8%)     max: 4664 Points
3DMark - 3DMark Fire Strike Standard Graphics
min: 3447     avg: 4521     median: 4848 (5%)     max: 4993 Points
3DMark - 3DMark Ice Storm Graphics
min: 156497     avg: 205151     median: 195922 (23%)     max: 272265 Points
3DMark 11 - 3DM11 Performance Score
min: 4904     avg: 6712     median: 7067 (10%)     max: 7680 Points
3DMark 11 - 3DM11 Performance GPU
min: 4636     avg: 6332     median: 6743 (6%)     max: 7184 Points
3DMark Vantage
3DM Vant. Perf. total + AMD Radeon 660M
3DMark Vantage - 3DM Vant. Perf. total
min: 22854     avg: 23222     median: 23222 (7%)     max: 23590 Points
3DM Vant. Perf. total + Intel HD Graphics (Ivy Bridge)
3DM Vant. Perf. GPU no PhysX + AMD Radeon 660M
3DMark Vantage - 3DM Vant. Perf. GPU no PhysX
min: 20168     avg: 20571     median: 20570.5 (11%)     max: 20973 Points
3DM Vant. Perf. GPU no PhysX + Intel HD Graphics (Ivy Bridge)
3DMark 2001SE - 3DMark 2001 - Standard
min: 8075     avg: 9212     median: 9212 (10%)     max: 10349 Points
3DMark 03 - 3DMark 03 - Standard
min: 5909     avg: 7584     median: 7434 (4%)     max: 10124 Points
3DMark 05 - 3DMark 05 - Standard
43616 Points (48%)
min: 3839     avg: 5085     median: 5186 (6%)     max: 6252 Points
3DMark 06 3DMark 06 - Standard 1280x1024 + AMD Radeon 660M
3DMark 06
min: 27171     avg: 27876     median: 27876 (36%)     max: 28581 Points
3DMark 06 - Standard 1280x1024 + Intel HD Graphics (Ivy Bridge)
min: 2186     avg: 2949     median: 2930 (4%)     max: 3573 Points
Unigine Valley 1.0 - Unigine Valley 1.0 DX
10.9 fps (3%)
Blender - Blender 3.3 Classroom HIP *
min: 438     avg: 561     median: 548 (45%)     max: 755 Seconds
SPECviewperf 11
specvp11 snx-01 + Intel HD Graphics (Ivy Bridge)
SPECviewperf 11 - specvp11 snx-01
min: 0.75     avg: 0.8     median: 0.8 (0%)     max: 0.87 fps
specvp11 tcvis-02 + Intel HD Graphics (Ivy Bridge)
SPECviewperf 11 - specvp11 tcvis-02
min: 1.31     avg: 1.5     median: 1.5 (1%)     max: 1.66 fps
specvp11 sw-02 + Intel HD Graphics (Ivy Bridge)
SPECviewperf 11 - specvp11 sw-02
min: 4.68     avg: 5.3     median: 5.3 (4%)     max: 5.88 fps
specvp11 proe-05 + Intel HD Graphics (Ivy Bridge)
SPECviewperf 11 - specvp11 proe-05
min: 0.91     avg: 1.1     median: 1.1 (1%)     max: 1.19 fps
specvp11 maya-03 + Intel HD Graphics (Ivy Bridge)
SPECviewperf 11 - specvp11 maya-03
min: 8.71     avg: 8.8     median: 8.8 (7%)     max: 8.93 fps
specvp11 lightwave-01 + Intel HD Graphics (Ivy Bridge)
SPECviewperf 11 - specvp11 lightwave-01
min: 7.83     avg: 8.9     median: 8.9 (10%)     max: 10.03 fps
specvp11 ensight-04 + Intel HD Graphics (Ivy Bridge)
SPECviewperf 11 - specvp11 ensight-04
min: 1.27     avg: 1.4     median: 1.4 (1%)     max: 1.51 fps
specvp11 catia-03 + Intel HD Graphics (Ivy Bridge)
SPECviewperf 11 - specvp11 catia-03
0 fps (0%)
SPECviewperf 12
specvp12 sw-03 + AMD Radeon 660M
SPECviewperf 12 - specvp12 sw-03
74.6 fps (19%)
specvp12 snx-02 + AMD Radeon 660M
SPECviewperf 12 - specvp12 snx-02
42.4 fps (6%)
specvp12 showcase-01 + AMD Radeon 660M
SPECviewperf 12 - specvp12 showcase-01
22.8 fps (5%)
specvp12 mediacal-01 + AMD Radeon 660M
SPECviewperf 12 - specvp12 mediacal-01
25.8 fps (7%)
specvp12 maya-04 + AMD Radeon 660M
SPECviewperf 12 - specvp12 maya-04
44.4 fps (12%)
specvp12 energy-01 + AMD Radeon 660M
SPECviewperf 12 - specvp12 energy-01
51.1 fps (46%)
specvp12 creo-01 + AMD Radeon 660M
SPECviewperf 12 - specvp12 creo-01
39.3 fps (16%)
specvp12 catia-04 + AMD Radeon 660M
SPECviewperf 12 - specvp12 catia-04
45 fps (7%)
specvp12 3dsmax-05 + AMD Radeon 660M
SPECviewperf 12 - specvp12 3dsmax-05
55.8 fps (10%)
SPECviewperf 13 specvp13 sw-04 + AMD Radeon 660M
SPECviewperf 13 - specvp13 sw-04
66.6 fps (18%)
specvp13 snx-03 + AMD Radeon 660M
SPECviewperf 13 - specvp13 snx-03
72.7 fps (8%)
specvp13 showcase-02 + AMD Radeon 660M
SPECviewperf 13 - specvp13 showcase-02
23.9 fps (5%)
specvp13 medical-02 + AMD Radeon 660M
SPECviewperf 13 - specvp13 medical-02
24.9 fps (5%)
specvp13 maya-05 + AMD Radeon 660M
SPECviewperf 13 - specvp13 maya-05
62.6 fps (7%)
specvp13 energy-02 + AMD Radeon 660M
SPECviewperf 13 - specvp13 energy-02
6.2 fps (2%)
specvp13 creo-02 + AMD Radeon 660M
SPECviewperf 13 - specvp13 creo-02
53.8 fps (8%)
specvp13 catia-05 + AMD Radeon 660M
SPECviewperf 13 - specvp13 catia-05
56.9 fps (6%)
specvp13 3dsmax-06 + AMD Radeon 660M
SPECviewperf 13 - specvp13 3dsmax-06
51.7 fps (9%)
SPECviewperf 2020 specvp2020 snx-04 4k + AMD Radeon 660M
SPECviewperf 2020 - specvp2020 snx-04 4k
42.1 fps (4%)
specvp2020 medical-03 4k + AMD Radeon 660M
SPECviewperf 2020 - specvp2020 medical-03 4k
5.2 fps (5%)
specvp2020 maya-06 4k + AMD Radeon 660M
SPECviewperf 2020 - specvp2020 maya-06 4k
27 fps (4%)
specvp2020 energy-03 4k + AMD Radeon 660M
SPECviewperf 2020 - specvp2020 energy-03 4k
4.7 fps (1%)
specvp2020 creo-03 4k + AMD Radeon 660M
SPECviewperf 2020 - specvp2020 creo-03 4k
19.8 fps (9%)
specvp2020 catia-06 4k + AMD Radeon 660M
SPECviewperf 2020 - specvp2020 catia-06 4k
14.2 fps (9%)
specvp2020 3dsmax-07 4k + AMD Radeon 660M
SPECviewperf 2020 - specvp2020 3dsmax-07 4k
10.8 fps (5%)
Windows 7 Experience Index - Win7 Gaming graphics
6.2 Points (78%)
Windows 7 Experience Index - Win7 Graphics
min: 4.6     avg: 4.7     median: 4.7 (59%)     max: 4.7 Points
Cinebench R10 Cinebench R10 Shading (32bit) + AMD Radeon 660M
Cinebench R10 - Cinebench R10 Shading (32bit)
min: 12942     avg: 13243     median: 13243 (9%)     max: 13544 Points
Cinebench R10 Shading (32bit) + Intel HD Graphics (Ivy Bridge)
Cinebench R11.5 Cinebench R11.5 OpenGL 64 Bit + AMD Radeon 660M
Cinebench R11.5 - Cinebench R11.5 OpenGL 64 Bit
114.4 fps (38%)
Cinebench R11.5 OpenGL 64 Bit + Intel HD Graphics (Ivy Bridge)
Cinebench R15
Cinebench R15 OpenGL 64 Bit + AMD Radeon 660M
Cinebench R15 - Cinebench R15 OpenGL 64 Bit
min: 93.3     avg: 120.8     median: 121.3 (7%)     max: 154.4 fps
Cinebench R15 OpenGL Ref. Match 64 Bit + AMD Radeon 660M
Cinebench R15 - Cinebench R15 OpenGL Ref. Match 64 Bit
min: 97.9     avg: 97.9     median: 97.9 (98%)     max: 98 %
GFXBench - GFXBench 5.0 4K Aztec Ruins High Tier Offscreen
min: 10.6     avg: 14.7     median: 14.7 (6%)     max: 18.7 fps
GFXBench - GFXBench 5.0 Aztec Ruins High Tier Offscreen
min: 22.9     avg: 33.5     median: 33.5 (6%)     max: 44.1 fps
GFXBench - GFXBench 5.0 Aztec Ruins Normal Tier Offscreen
min: 63.9     avg: 86     median: 86 (6%)     max: 108.1 fps
GFXBench - GFXBench Car Chase Offscreen
69.4 fps (8%)
GFXBench 3.1 - GFXBench Manhattan ES 3.1 Offscreen
93.3 fps (2%)
GFXBench 3.0 - GFXBench 3.0 Manhattan Offscreen
104.3 fps (6%)
GFXBench (DX / GLBenchmark) 2.7
GFXBench T-Rex HD Offscreen C24Z16 + AMD Radeon 660M
GFXBench (DX / GLBenchmark) 2.7 - GFXBench T-Rex HD Offscreen C24Z16
258.5 fps (2%)
GFXBench T-Rex HD Offscreen C24Z16 + Intel HD Graphics (Ivy Bridge)
Basemark GPU 1.2 - Basemark GPU 1.2 Vulkan Official Medium Offscreen 1080
min: 104.6     avg: 128.2     median: 114.6 (1%)     max: 178.9 fps
Basemark GPU 1.2 - Basemark GPU 1.2 Vulkan Official High Offscreen 2160
3.6 fps (1%)
Geekbench 6.2 - Geekbench 6.2 GPU OpenCL
min: 13189     avg: 14723     median: 15012 (4%)     max: 15678 Points
Geekbench 6.2 - Geekbench 6.2 GPU Vulkan
min: 14297     avg: 16531     median: 16743.5 (5%)     max: 18338 Points
LuxMark v2.0 64Bit - LuxMark v2.0 Room GPU
min: 187     avg: 270     median: 270 (1%)     max: 353 Samples/s
min: 27     avg: 38.3     median: 44 (0%)     max: 44 Samples/s
LuxMark v2.0 64Bit - LuxMark v2.0 Sala GPU
min: 785     avg: 822     median: 822 (1%)     max: 859 Samples/s
44 Samples/s (0%)
ComputeMark v2.1 - ComputeMark v2.1 Result
min: 3416     avg: 3428     median: 3427.5 (4%)     max: 3439 Points
Power Consumption - Furmark Stress Test Power Consumption - external Monitor *
min: 28.3     avg: 40.4     median: 40.7 (6%)     max: 54.7 Watt
Power Consumption - The Witcher 3 Power Consumption - external Monitor *
min: 24.8     avg: 37.5     median: 38.4 (5%)     max: 47.3 Watt
Power Consumption - Witcher 3 Power Consumption *
min: 27.6     avg: 38.3     median: 39.7 (9%)     max: 47.3 Watt
Power Consumption - Witcher 3 ultra Power Efficiency
min: 0.3575     avg: 0.4     median: 0.4 (34%)     max: 0.4565 fps per Watt
Power Consumption - Witcher 3 ultra Power Efficiency - external Monitor
min: 0.3158     avg: 0.4     median: 0.4 (32%)     max: 0.508 fps per Watt
Power Consumption - Cyberpunk 2077 Power Consumption 150cd *
min: 36.6     avg: 38.1     median: 38.1 (12%)     max: 39.6 Watt
Power Consumption - Cyberpunk 2077 Power Consumption - external Monitor *
min: 35.6     avg: 38     median: 38 (5%)     max: 40.4 Watt
Power Consumption - Cyberpunk 2077 ultra Power Efficiency
0.2 fps per Watt (28%)
Emissions Witcher 3 Fan Noise + AMD Radeon 660M
Emissions - Witcher 3 Fan Noise
min: 35     avg: 38.6     median: 38 (61%)     max: 48.5 dB(A)
Clock Speed - GPU Clock Witcher 3 ultra
1900 MHz (75%)

Average Benchmarks AMD Radeon 660M → 0% n=0

Average Benchmarks Intel HD Graphics (Ivy Bridge) → 0% n=0

- Bereich der Benchmarkergebnisse für diese Grafikkarte
- Durchschnittliche Benchmarkergebnisse für diese Grafikkarte
* Smaller numbers mean a higher performance
1 This benchmark is not used for the average calculation

Spiele-Benchmarks

Die folgenden Benchmarks basieren auf unseren Spieletests mit Testnotebooks. Die Performance dieser Grafikkarte bei den gelisteten Spielen ist abhängig von der verwendeten CPU, Speicherausstattung, Treiber und auch Betriebssystem. Dadurch müssen die untenstehenden Werte nicht repräsentativ sein. Detaillierte Informationen über das verwendete System sehen Sie nach einem Klick auf den fps-Wert.

F1 24

F1 24

2024
low 1920x1080
Radeon 660M:
31.6 31.6 42.2 ~ 35 fps
med. 1920x1080
Radeon 660M:
26.8 26.8 35.5 ~ 30 fps
high 1920x1080
Radeon 660M:
19.8 25.6 ~ 23 fps
ultra 1920x1080
Radeon 660M:
5.6  fps
low 1920x1080
Radeon 660M:
14.9 22.9 24.3 ~ 21 fps
med. 1920x1080
Radeon 660M:
11.5 17.4 18.1 ~ 16 fps
high 1920x1080
Radeon 660M:
8.9 11 11.6 13.2 ~ 11 fps
ultra 1920x1080
Radeon 660M:
7.8 11.2 ~ 9 fps
low 1920x1080
Radeon 660M:
16.5 22 22.9 ~ 20 fps
med. 1920x1080
Radeon 660M:
12.8 14 15.1 ~ 14 fps
high 1920x1080
Radeon 660M:
10.3 13 13.3 ~ 12 fps
ultra 1920x1080
Radeon 660M:
10 12 12.6 ~ 12 fps
F1 23

F1 23

2023
low 1920x1080
Radeon 660M:
49.6  fps
med. 1920x1080
Radeon 660M:
42.7  fps
high 1920x1080
Radeon 660M:
29.2  fps
Diablo 4

Diablo 4

2023
low 1920x1080
Radeon 660M:
34.6  fps
med. 1920x1080
Radeon 660M:
27.6  fps
high 1920x1080
Radeon 660M:
26  fps
ultra 1920x1080
Radeon 660M:
23.9  fps
low 1920x1080
Radeon 660M:
11.5  fps
med. 1920x1080
Radeon 660M:
10.2  fps
low 1920x1080
Radeon 660M:
36.8  fps
med. 1920x1080
Radeon 660M:
30.1  fps
high 1920x1080
Radeon 660M:
22.3  fps
ultra 1920x1080
Radeon 660M:
14.6  fps
low 1920x1080
Radeon 660M:
17.7  fps
med. 1920x1080
Radeon 660M:
13.2  fps
high 1920x1080
Radeon 660M:
11.1  fps
low 1920x1080
Radeon 660M:
20.1  fps
med. 1920x1080
Radeon 660M:
14.7  fps
high 1920x1080
Radeon 660M:
0 (!)  fps
low 1920x1080
Radeon 660M:
23.7  fps
med. 1920x1080
Radeon 660M:
22  fps
high 1920x1080
Radeon 660M:
15.9  fps
low 1920x1080
Radeon 660M:
24.7  fps
med. 1920x1080
Radeon 660M:
16.7  fps
high 1920x1080
Radeon 660M:
15.3  fps
ultra 1920x1080
Radeon 660M:
14.8  fps
low 1920x1080
Radeon 660M:
29  fps
med. 1920x1080
Radeon 660M:
22.9  fps
high 1920x1080
Radeon 660M:
13  fps
ultra 1920x1080
Radeon 660M:
10.2  fps
Returnal

Returnal

2023
low 1920x1080
Radeon 660M:
16  fps
med. 1920x1080
Radeon 660M:
15  fps
high 1920x1080
Radeon 660M:
13  fps
low 1920x1080
Radeon 660M:
23.3  fps
med. 1920x1080
Radeon 660M:
17.2  fps
high 1920x1080
Radeon 660M:
12.8  fps
ultra 1920x1080
Radeon 660M:
10.3  fps
low 1920x1080
Radeon 660M:
31.8  fps
med. 1920x1080
Radeon 660M:
25.3  fps
high 1920x1080
Radeon 660M:
10.1  fps
low 1920x1080
Radeon 660M:
37.8  fps
med. 1920x1080
Radeon 660M:
23.3  fps
high 1920x1080
Radeon 660M:
19.2  fps
ultra 1920x1080
Radeon 660M:
14.5  fps
low 1920x1080
Radeon 660M:
26.7  fps
med. 1920x1080
Radeon 660M:
18.5  fps
high 1920x1080
Radeon 660M:
17.9  fps
ultra 1920x1080
Radeon 660M:
10.3  fps
low 1920x1080
Radeon 660M:
29.3  fps
med. 1920x1080
Radeon 660M:
24.1  fps
high 1920x1080
Radeon 660M:
18.6  fps
ultra 1920x1080
Radeon 660M:
17.6  fps
low 1920x1080
Radeon 660M:
27.3  fps
med. 1920x1080
Radeon 660M:
22.6  fps
high 1920x1080
Radeon 660M:
20.2  fps
low 1920x1080
Radeon 660M:
25 28 ~ 27 fps
med. 1920x1080
Radeon 660M:
21 26 ~ 24 fps
high 1920x1080
Radeon 660M:
15 19 ~ 17 fps
ultra 1920x1080
Radeon 660M:
14 17 ~ 16 fps
low 1920x1080
Radeon 660M:
12.3  fps
med. 1920x1080
Radeon 660M:
11.4  fps
high 1920x1080
Radeon 660M:
9.6  fps
low 1920x1080
Radeon 660M:
9.4  fps
med. 1920x1080
Radeon 660M:
7.8  fps
high 1920x1080
Radeon 660M:
6.7  fps
low 1920x1080
Radeon 660M:
24.5  fps
med. 1920x1080
Radeon 660M:
18  fps
high 1920x1080
Radeon 660M:
14.4  fps
F1 22

F1 22

2022
low 1920x1080
Radeon 660M:
42.4 44.7 48 58.3 ~ 48 fps
med. 1920x1080
Radeon 660M:
37 40.2 42 52.3 ~ 43 fps
high 1920x1080
Radeon 660M:
26.2 27.2 28 37.2 ~ 30 fps
ultra 1920x1080
Radeon 660M:
5.1 5.9 8.4 ~ 6 fps
low 1920x1080
Radeon 660M:
0 (!) 45.7 ~ 23 fps
med. 1920x1080
Radeon 660M:
0 (!) 24.6 ~ 12 fps
high 1920x1080
Radeon 660M:
0 (!) 24.4 ~ 12 fps
ultra 1920x1080
Radeon 660M:
22.4  fps
low 1920x1080
Radeon 660M:
16.1 25.9 ~ 21 fps
med. 1920x1080
Radeon 660M:
24  fps
high 1920x1080
Radeon 660M:
23.9  fps
low 1920x1080
Radeon 660M:
26.9 34.2 40 ~ 34 fps
med. 1920x1080
Radeon 660M:
19.7 27 31.3 ~ 26 fps
high 1920x1080
Radeon 660M:
12.6 17.6 20.5 ~ 17 fps
ultra 1920x1080
Radeon 660M:
9.6 15.6 ~ 13 fps
low 1920x1080
Radeon 660M:
20.3 27 ~ 24 fps
med. 1920x1080
Radeon 660M:
15 24 ~ 20 fps
high 1920x1080
Radeon 660M:
12.2 15 ~ 14 fps
Elex 2

Elex 2

2022
low 1920x1080
Radeon 660M:
22.5 33.5 ~ 28 fps
med. 1920x1080
Radeon 660M:
19.3 25.8 ~ 23 fps
high 1920x1080
Radeon 660M:
15.8 22.8 ~ 19 fps
low 1920x1080
Radeon 660M:
49.6 71 ~ 60 fps
med. 1920x1080
Radeon 660M:
36.5 53.4 ~ 45 fps
high 1920x1080
Radeon 660M:
27.4 40.4 ~ 34 fps
ultra 1920x1080
Radeon 660M:
19.5  fps
low 1920x1080
Radeon 660M:
39.6  fps
med. 1920x1080
Radeon 660M:
29.9  fps
high 1920x1080
Radeon 660M:
26.9  fps
low 1920x1080
Radeon 660M:
19.7  fps
med. 1920x1080
Radeon 660M:
15.4  fps
high 1920x1080
Radeon 660M:
12.4  fps
low 1920x1080
Radeon 660M:
45  fps
med. 1920x1080
Radeon 660M:
35  fps
high 1920x1080
Radeon 660M:
30  fps
low 1920x1080
Radeon 660M:
16 21.7 23.9 ~ 21 fps
med. 1920x1080
Radeon 660M:
12.6 17.5 18.9 ~ 16 fps
high 1920x1080
Radeon 660M:
10 12.6 16.1 ~ 13 fps
ultra 1920x1080
Radeon 660M:
10.8  fps
low 1280x720
Radeon 660M:
39.6  fps
med. 1920x1080
Radeon 660M:
20.3  fps
high 1920x1080
Radeon 660M:
17.1  fps
low 1280x720
Radeon 660M:
102  fps
med. 1920x1080
Radeon 660M:
57.1  fps
high 1920x1080
Radeon 660M:
38.9  fps
low 1280x720
Radeon 660M:
92  fps
med. 1920x1080
Radeon 660M:
39  fps
high 1920x1080
Radeon 660M:
32  fps
low 1280x720
Radeon 660M:
56  fps
med. 1920x1080
Radeon 660M:
30  fps
high 1920x1080
Radeon 660M:
23  fps
low 1280x720
Radeon 660M:
0 (!)  fps
med. 1920x1080
Radeon 660M:
0 (!)  fps
high 1920x1080
Radeon 660M:
0 (!)  fps
low 1280x720
Radeon 660M:
104.3  fps
med. 1920x1080
Radeon 660M:
40.4  fps
high 1920x1080
Radeon 660M:
34.3  fps
Far Cry 6

Far Cry 6

2021
low 1280x720
Radeon 660M:
50 58.5 ~ 54 fps
med. 1920x1080
Radeon 660M:
21 25.6 ~ 23 fps
high 1920x1080
Radeon 660M:
18 21.8 ~ 20 fps
ultra 1920x1080
Radeon 660M:
18.3  fps
low 1280x720
Radeon 660M:
53.6  fps
med. 1920x1080
Radeon 660M:
32.7  fps
high 1920x1080
Radeon 660M:
26.4  fps
Deathloop

Deathloop

2021
low 1280x720
Radeon 660M:
45.5  fps
med. 1920x1080
Radeon 660M:
23.3  fps
high 1920x1080
Radeon 660M:
18.1  fps
F1 2021

F1 2021

2021
low 1280x720
Radeon 660M:
103.8 109.5 ~ 107 fps
med. 1920x1080
Radeon 660M:
44.4 47.3 ~ 46 fps
high 1920x1080
Radeon 660M:
35.2 36 ~ 36 fps
ultra 1920x1080
Radeon 660M:
14.1 14.7 ~ 14 fps
Days Gone

Days Gone

2021
low 1280x720
Radeon 660M:
50  fps
med. 1920x1080
Radeon 660M:
25.3  fps
high 1920x1080
Radeon 660M:
22.2  fps
low 1280x720
Radeon 660M:
70  fps
ultra 1920x1080
Radeon 660M:
38.9  fps
low 1280x720
Radeon 660M:
75.3  fps
med. 1920x1080
Radeon 660M:
33.4  fps
high 1920x1080
Radeon 660M:
29.9  fps
Outriders

Outriders

2021
low 1280x720
Radeon 660M:
35.3  fps
med. 1920x1080
Radeon 660M:
30.4  fps
high 1920x1080
Radeon 660M:
27.9  fps
Hitman 3

Hitman 3

2021
low 1280x720
Radeon 660M:
91.1  fps
med. 1920x1080
Radeon 660M:
34.5  fps
high 1920x1080
Radeon 660M:
30.5  fps
low 1280x720
Radeon 660M:
64.7  fps
med. 1920x1080
Radeon 660M:
21.2  fps
high 1920x1080
Radeon 660M:
21.1  fps
low 1280x720
Radeon 660M:
52  fps
med. 1920x1080
Radeon 660M:
26  fps
high 1920x1080
Radeon 660M:
19  fps
Dirt 5

Dirt 5

2020
low 1280x720
Radeon 660M:
68.6  fps
med. 1920x1080
Radeon 660M:
24.2  fps
high 1920x1080
Radeon 660M:
17.8  fps
low 1280x720
Radeon 660M:
49  fps
med. 1920x1080
Radeon 660M:
26  fps
high 1920x1080
Radeon 660M:
22  fps
low 1280x720
Radeon 660M:
170.4  fps
med. 1920x1080
Radeon 660M:
66.6  fps
high 1920x1080
Radeon 660M:
57.4  fps
low 1280x720
Radeon 660M:
48.2  fps
med. 1920x1080
Radeon 660M:
20.7  fps
high 1920x1080
Radeon 660M:
19.1  fps
low 1280x720
Radeon 660M:
113  fps
med. 1920x1080
Radeon 660M:
29.2  fps
high 1920x1080
Radeon 660M:
24.1  fps
low 1280x720
Radeon 660M:
88.1  fps
med. 1920x1080
Radeon 660M:
39.2  fps
high 1920x1080
Radeon 660M:
10.9  fps
low 1280x720
Radeon 660M:
41.6  fps
med. 1920x1080
Radeon 660M:
14.2  fps
high 1920x1080
Radeon 660M:
10.4  fps
low 1280x720
Radeon 660M:
58.1  fps
med. 1920x1080
Radeon 660M:
30.6  fps
high 1920x1080
Radeon 660M:
29.1  fps
F1 2020

F1 2020

2020
low 1280x720
Radeon 660M:
102.1  fps
med. 1920x1080
Radeon 660M:
44.6  fps
high 1920x1080
Radeon 660M:
32.3  fps
ultra 1920x1080
Radeon 660M:
22.2  fps
low 1280x720
Radeon 660M:
132  fps
med. 1920x1080
Radeon 660M:
47.4  fps
high 1920x1080
Radeon 660M:
28.5  fps
low 1280x720
Radeon 660M:
86.9  fps
med. 1920x1080
Radeon 660M:
36.2  fps
high 1920x1080
Radeon 660M:
34.2  fps
low 1280x720
Radeon 660M:
70.8  fps
med. 1920x1080
Radeon 660M:
24.2  fps
high 1920x1080
Radeon 660M:
19.2  fps
low 1280x720
Radeon 660M:
49  fps
med. 1920x1080
Radeon 660M:
20.5  fps
high 1920x1080
Radeon 660M:
13.6  fps
ultra 1920x1080
Radeon 660M:
10.7  fps
low 1280x720
Radeon 660M:
58  fps
med. 1920x1080
Radeon 660M:
32  fps
high 1920x1080
Radeon 660M:
29  fps
ultra 1920x1080
Radeon 660M:
27  fps
low 1280x720
Radeon 660M:
48  fps
med. 1920x1080
Radeon 660M:
18.8  fps
high 1920x1080
Radeon 660M:
14.4  fps
ultra 1920x1080
Radeon 660M:
11.2  fps
low 1280x720
Radeon 660M:
69.3 77 ~ 73 fps
med. 1920x1080
Radeon 660M:
22.2 29 ~ 26 fps
high 1920x1080
Radeon 660M:
17.3 27 ~ 22 fps
ultra 1920x1080
Radeon 660M:
13.4 23 ~ 18 fps
Strange Brigade

Strange Brigade

2018
low 1280x720
Radeon 660M:
70.2 99.5 99.9 114.4 117.4 117.7 120.2 120.7 ~ 108 fps
med. 1920x1080
Radeon 660M:
26.8 37.8 38.6 40 43 43.3 43.3 44.5 ~ 40 fps
high 1920x1080
Radeon 660M:
21.4 29.5 31.5 32.7 33.9 35 35.3 35.9 ~ 32 fps
ultra 1920x1080
Radeon 660M:
18.4 24.3 25.5 26.7 28.6 29 29.6 29.7 ~ 26 fps
Far Cry 5

Far Cry 5

2018
low 1280x720
Radeon 660M:
38 55 61 62 63 71 ~ 58 fps
med. 1920x1080
Radeon 660M:
18 26 29 30 31 33 ~ 28 fps
high 1920x1080
Radeon 660M:
16 23 26 26 29 30 ~ 25 fps
ultra 1920x1080
Radeon 660M:
16 22 25 26 27 ~ 23 fps
low 1280x720
Radeon 660M:
34.8 36 38.4 38.5 48.2 49.1 49.2 50.6 51.8 ~ 44 fps
med. 1920x1080
Radeon 660M:
24.2 25 27.4 28.3 33.7 35.6 36.7 37.4 38.5 ~ 32 fps
high 1920x1080
Radeon 660M:
22.1 23 25.1 25.4 29.3 30.8 30.8 33.2 33.8 ~ 28 fps
low 1280x720
Radeon 660M:
33.1 33.6 40.9 43.8 44.9 45.5 48.3 51.6 53.4 ~ 44 fps
med. 1920x1080
Radeon 660M:
16 16.2 19.8 20.7 21.9 23.7 23.8 24.3 24.7 ~ 21 fps
high 1920x1080
Radeon 660M:
11.1 11.4 14.5 15 16 16.3 17.2 17.4 17.9 ~ 15 fps
low 1280x720
Radeon 660M:
93.7 101 103.6 108.6 109.3 114.5 121.1 135.9 144.9 ~ 115 fps
med. 1366x768
Radeon 660M:
72.2 74.4 78.6 83.6 94.4 98.5 99.3 107.7 107.9 ~ 91 fps
high 1920x1080
Radeon 660M:
37.4 47.1 49.2 50.7 61 63.1 64.9 65.8 70 ~ 57 fps
ultra 1920x1080
Radeon 660M:
32.8 41.3 42.7 43.8 52.9 53.9 55.4 55.7 60.8 ~ 49 fps
low 1024x768
Radeon 660M:
61.7 76.8 82.2 86.7 90.5 93.2 98.2 ~ 84 fps
med. 1366x768
Radeon 660M:
40.2 45.9 46.8 52.5 52.6 58.5 ~ 49 fps
high 1920x1080
Radeon 660M:
18.5 19.7 22.6 25.7 27.1 27.6 28.6 ~ 24 fps
ultra 1920x1080
Radeon 660M:
12.3 12.6 14.4 15.3 17.8 17.9 17.9 ~ 15 fps
GTA V

GTA V

2015
low 1024x768
Radeon 660M:
92.6 93.8 118.8 128.8 128.9 132.5 133.9 142.9 ~ 122 fps
med. 1366x768
Radeon 660M:
80 83.6 99.7 103.2 116.1 118.5 120 124.9 ~ 106 fps
high 1920x1080
Radeon 660M:
23.1 23.6 31.2 33.9 36.4 40 40.5 40.7 ~ 34 fps
ultra 1920x1080
Radeon 660M:
9.7 10.3 14.1 14.2 14.5 17.2 18 18.9 ~ 15 fps
low 1024x768
HD Graphics (Ivy Bridge):
34.5  fps
med. 1366x768
HD Graphics (Ivy Bridge):
14.3  fps
high 1366x768
HD Graphics (Ivy Bridge):
8.6  fps
Thief

Thief

2014
low 1024x768
HD Graphics (Ivy Bridge):
5.9  fps
med. 1366x768
HD Graphics (Ivy Bridge):
3.6  fps
low 1024x768
HD Graphics (Ivy Bridge):
15  fps
med. 1366x768
HD Graphics (Ivy Bridge):
7.6  fps
F1 2013

F1 2013

2013
low 1024x768
HD Graphics (Ivy Bridge):
20  fps
med. 1366x768
HD Graphics (Ivy Bridge):
14  fps
Fifa 14

Fifa 14

2013
med. 1366x768
HD Graphics (Ivy Bridge):
54.4  fps
high 1366x768
HD Graphics (Ivy Bridge):
32  fps
Dota 2

Dota 2

2013
low 1024x768
HD Graphics (Ivy Bridge):
18.4 30.5 ~ 24 fps
med. 1366x768
HD Graphics (Ivy Bridge):
8.2 24.5 ~ 16 fps
GRID 2

GRID 2

2013
low 1024x768
HD Graphics (Ivy Bridge):
27.5  fps
med. 1366x768
HD Graphics (Ivy Bridge):
12.8  fps
high 1366x768
HD Graphics (Ivy Bridge):
12.5  fps
low 1024x768
HD Graphics (Ivy Bridge):
10.5  fps
med. 1366x768
HD Graphics (Ivy Bridge):
8.1  fps
high 1366x768
HD Graphics (Ivy Bridge):
4.4  fps
low 1280x720
HD Graphics (Ivy Bridge):
16 16.4 19.1 ~ 17 fps
med. 1366x768
HD Graphics (Ivy Bridge):
8.6 8.9 9 ~ 9 fps
high 1366x768
HD Graphics (Ivy Bridge):
7.7  fps
low 1024x768
HD Graphics (Ivy Bridge):
80.8 112 ~ 96 fps
med. 1366x768
HD Graphics (Ivy Bridge):
19.3 24 ~ 22 fps
high 1366x768
HD Graphics (Ivy Bridge):
10.8 15 ~ 13 fps
ultra 1920x1080
HD Graphics (Ivy Bridge):
4  fps
low 1024x768
HD Graphics (Ivy Bridge):
8.8 16.1 18.6 20.1 21.5 21.5 22.5 22.7 23.1 23.6 24 ~ 20 fps
med. 1366x768
HD Graphics (Ivy Bridge):
7.7 9.4 10.5 10.8 11 11 11.1 11.4 11.7 ~ 11 fps
high 1366x768
HD Graphics (Ivy Bridge):
5.1 7.4 7.6 8 ~ 7 fps
low 1024x768
HD Graphics (Ivy Bridge):
42  fps
med. 1366x768
HD Graphics (Ivy Bridge):
17  fps
high 1366x768
HD Graphics (Ivy Bridge):
12  fps
ultra 1920x1080
HD Graphics (Ivy Bridge):
6  fps
low 1024x768
HD Graphics (Ivy Bridge):
13  fps
med. 1366x768
HD Graphics (Ivy Bridge):
11  fps
high 1366x768
HD Graphics (Ivy Bridge):
4  fps
low 1024x768
HD Graphics (Ivy Bridge):
18 19 ~ 19 fps
med. 1366x768
HD Graphics (Ivy Bridge):
14 15.2 ~ 15 fps
Fifa 13

Fifa 13

2012
low 1024x768
HD Graphics (Ivy Bridge):
18.3 52 69.7 90 ~ 58 fps
med. 1366x768
HD Graphics (Ivy Bridge):
13.2 32.8 42.7 54 ~ 36 fps
high 1366x768
HD Graphics (Ivy Bridge):
8.6 20.9 23 29 ~ 20 fps
ultra 1920x1080
HD Graphics (Ivy Bridge):
13  fps
F1 2012

F1 2012

2012
low 1024x768
HD Graphics (Ivy Bridge):
20 25 ~ 23 fps
med. 1366x768
HD Graphics (Ivy Bridge):
18 20 ~ 19 fps
high 1366x768
HD Graphics (Ivy Bridge):
16 16 ~ 16 fps
ultra 1920x1080
HD Graphics (Ivy Bridge):
12  fps
low 1024x768
HD Graphics (Ivy Bridge):
30  fps
high 1366x768
HD Graphics (Ivy Bridge):
8  fps
ultra 1920x1080
HD Graphics (Ivy Bridge):
5  fps
med. 1366x768
HD Graphics (Ivy Bridge):
37  fps
high 1366x768
HD Graphics (Ivy Bridge):
20  fps
ultra 1920x1080
HD Graphics (Ivy Bridge):
11  fps
low 1024x768
HD Graphics (Ivy Bridge):
33.3 38 ~ 36 fps
med. 1366x768
HD Graphics (Ivy Bridge):
13.2 13.5 ~ 13 fps
low 1024x768
HD Graphics (Ivy Bridge):
29.2  fps
med. 1366x768
HD Graphics (Ivy Bridge):
17.5  fps
high 1366x768
HD Graphics (Ivy Bridge):
14.6  fps
Anno 2070

Anno 2070

2011
low 1024x768
HD Graphics (Ivy Bridge):
11.1 23.1 26 26.5 27.6 27.8 28.4 28.5 37.1 ~ 26 fps
med. 1366x768
HD Graphics (Ivy Bridge):
5.5 11.2 11.4 11.5 11.7 11.9 13 15.4 16.8 ~ 12 fps
high 1366x768
HD Graphics (Ivy Bridge):
7.1 7.1 7.5 9.2 ~ 8 fps
low 1280x720
HD Graphics (Ivy Bridge):
12.7 16.9 17.4 18.3 ~ 16 fps
med. 1366x768
HD Graphics (Ivy Bridge):
7.3 9.4 9.6 ~ 9 fps
high 1366x768
HD Graphics (Ivy Bridge):
4.6  fps
Fifa 12

Fifa 12

2011
med. 1024x768
HD Graphics (Ivy Bridge):
55.8  fps
high 1360x768
HD Graphics (Ivy Bridge):
21.2  fps
low 1024x768
HD Graphics (Ivy Bridge):
25.4  fps
high 1366x768
HD Graphics (Ivy Bridge):
11.4  fps
Dirt 3

Dirt 3

2011
low 800x600
HD Graphics (Ivy Bridge):
41.4  fps
med. 1024x768
HD Graphics (Ivy Bridge):
16.5  fps
Trackmania Nations Forever

Trackmania Nations Forever

2008
low 640x480
HD Graphics (Ivy Bridge):
90  fps
high 1024x768
HD Graphics (Ivy Bridge):
20.7  fps
World of Warcraft

World of Warcraft

2005
low 800x600
HD Graphics (Ivy Bridge):
78.3  fps
med. 1024x768
HD Graphics (Ivy Bridge):
28.3  fps
AMD Radeon 660Mlowmed.highultraQHD4K
F1 243530235.6
Cyberpunk 2077 2.1 Phantom Liberty2116119
Baldur's Gate 320141212
F1 2349.642.729.2
Diablo 434.627.62623.9
Star Wars Jedi Survivor11.510.2
Dead Island 236.830.122.314.6
The Last of Us17.713.211.1
Resident Evil 4 Remake20.114.7
Company of Heroes 323.72215.9
Sons of the Forest24.716.715.314.8
Atomic Heart2922.91310.2
Returnal161513
Hogwarts Legacy23.317.212.810.3
The Witcher 3 v4.0031.825.310.1
High On Life37.823.319.214.5
The Callisto Protocol26.718.517.910.3
Need for Speed Unbound29.324.118.617.6
Spider-Man Miles Morales27.322.620.2
Call of Duty Modern Warfare 2 202227241716
Uncharted Legacy of Thieves Collection12.311.49.6
A Plague Tale Requiem9.437.836.74
The Quarry24.51814.4
F1 224843306
Vampire Bloodhunt23121222.4
Ghostwire Tokyo212423.9
Tiny Tina's Wonderlands34261713
Cyberpunk 2077 1.6242014
Elex 2282319
GRID Legends60453419.5
Elden Ring39.629.926.9
Dying Light 219.715.412.4
Rainbow Six Extraction453530
God of War21161310.8
Halo Infinite39.620.317.1
Farming Simulator 2210257.138.9
Forza Horizon 5923932
Riders Republic563023
Guardians of the Galaxy
Back 4 Blood104.340.434.3
Far Cry 654232018.3
Alan Wake Remastered53.632.726.4
Deathloop45.523.318.1
F1 2021107463614
Days Gone5025.322.2
Mass Effect Legendary Edition7038.9
Resident Evil Village75.333.429.9
Outriders35.330.427.9
Hitman 391.134.530.5
Yakuza Like a Dragon64.721.221.1
Assassin´s Creed Valhalla522619
Dirt 568.624.217.8
Watch Dogs Legion492622
Star Wars Squadrons170.466.657.4
Mafia Definitive Edition48.220.719.1
Serious Sam 411329.224.1
Crysis Remastered88.139.210.9
Flight Simulator 202041.614.210.4
Death Stranding58.130.629.1
F1 2020102.144.632.322.2
Gears Tactics13247.428.5
Doom Eternal86.936.234.2
Hunt Showdown70.824.219.2
Borderlands 34920.513.610.7
Far Cry New Dawn58322927
Metro Exodus4818.814.411.2
Shadow of the Tomb Raider73262218
Strange Brigade108403226
Far Cry 558282523
X-Plane 11.11443228
Final Fantasy XV Benchmark442115
Dota 2 Reborn115915749
The Witcher 384492415
GTA V1221063415
< 30 fps
< 60 fps
< 120 fps
≥ 120 fps
23
28
19
3
45
24
3
56
14

28
2


Intel HD Graphics (Ivy Bridge)lowmed.highultraQHD4K
The Elder Scrolls Online34.514.38.6
Thief5.93.6
X-Plane 10.25157.6
F1 20132014
Fifa 1454.432
Dota 22416
GRID 227.5412.8412.5
Metro: Last Light10.528.094.35
BioShock Infinite1797.72
StarCraft II: Heart of the Swarm9622134
Tomb Raider20117
Dead Space 34217126
Hitman: Absolution13114
Dishonored1915
Fifa 1358362013
F1 201223191612
Guild Wars 23085
Counter-Strike: GO372011
Dirt Showdown3613
Diablo III29.217.514.6
Anno 207026128
The Elder Scrolls V: Skyrim1694.55
Fifa 1255.821.2
Deus Ex Human Revolution25.411.4
Dirt 341.416.5
Trackmania Nations Forever9020.7
World of Warcraft78.328.3
< 30 fps
< 60 fps
< 120 fps
≥ 120 fps
15
6
3
20
4

18
1

6


Eine Liste mit weiteren Spielen und allen Grafikkarten finden Sie auf unserer Seite: Welches Spiel ist mit welcher Grafikkarte spielbar?

v1.28
log 18. 10:52:25

#0 ran 0s before starting gpusingle class +0s ... 0s

#1 checking url part for id 6452 +0s ... 0s

#2 checking url part for id 11126 +0s ... 0s

#3 checking url part for id 3563 +0s ... 0s

#4 redirected to Ajax server, took 1729241544s time from redirect:1 +0s ... 0s

#5 did not recreate cache, as it is less than 5 days old! Created at Wed, 16 Oct 2024 05:17:20 +0200 +0s ... 0s

#6 composed specs +0.004s ... 0.004s

#7 did output specs +0s ... 0.004s

#8 start showIntegratedCPUs +0s ... 0.004s

#9 getting avg benchmarks for device 6452 +0.001s ... 0.005s

#10 got single benchmarks 6452 +0s ... 0.005s

#11 getting avg benchmarks for device 11126 +0.001s ... 0.006s

#12 got single benchmarks 11126 +0.002s ... 0.008s

#13 getting avg benchmarks for device 3563 +0.001s ... 0.009s

#14 got single benchmarks 3563 +0.006s ... 0.015s

#15 got avg benchmarks for devices +0s ... 0.015s

#16 No cached benchmark found, getting uncached values +0.01s ... 0.025s

#17 min, max, avg, median took s +0.016s ... 0.042s

#18 before gaming benchmark output +0s ... 0.042s

#19 Got 643 rows for game benchmarks. +0.05s ... 0.092s

#20 composed SQL query for gamebenchmarks +0s ... 0.092s

#21 got data and put it in $dataArray +0.005s ... 0.097s

#22 benchmarks composed for output. +0.035s ... 0.132s

#23 calculated avg scores. +0s ... 0.132s

#24 return log +0.001s ... 0.133s

Teilen Sie diesen Artikel, um uns zu unterstützen. Jeder Link hilft!
> Notebook Test, Laptop Test und News > Benchmarks / Technik > Benchmarks / Technik > Grafikkarten Vergleich - Head 2 Head
Autor: Klaus Hinum,  8.09.2017 (Update:  1.07.2023)