Notebookcheck Logo

Intel HD Graphics (Haswell) vs Intel UHD Graphics (Jasper Lake 32 EU)

Intel HD Graphics (Haswell)

► remove from comparison Intel HD Graphics (Haswell)

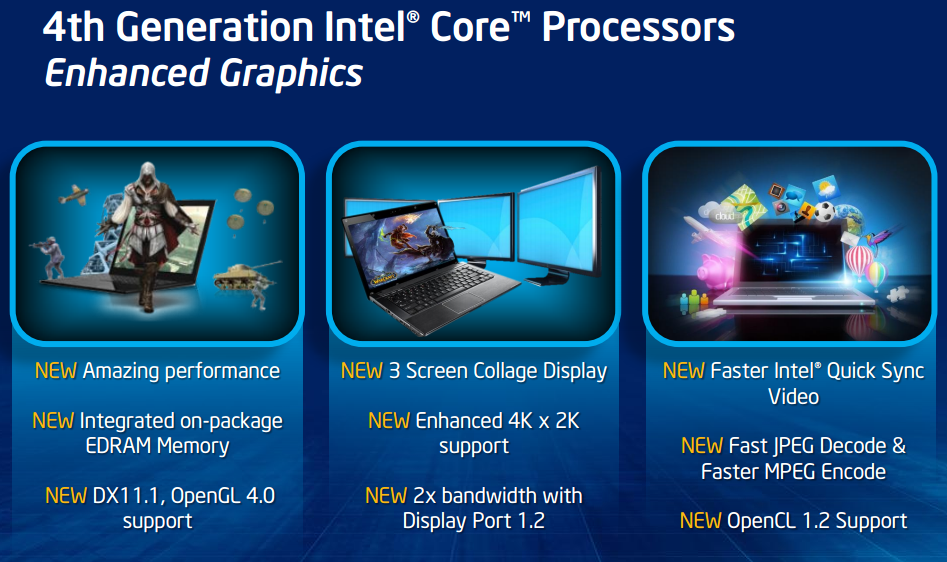
Die Intel HD Graphics ist eine in den Haswell Prozessoren integrierte Grafikkarte. Sie kommt in den mobilen Celeron- und Pentium-Modellen zu Einsatz. Je nach Prozessormodell kann die HD Graphics (auch GT1 genannt) unterschiedlich getaktet sein (typischerweise 200 MHz Basis- und 1.000 MHz Turbo-Takt). Dies sowie die Geschwindigkeit des angebundenen Arbeitsspeichers beeinflusst die Performance entscheidend.

Der Grafikkern wurde im Vergleich zum Intel HD Graphics 4000 der Ivy-Bridge-Generation in verschiedenen Punkten weiterentwickelt. So unterstützt die GPU nun mit DirectX 11.1, OpenCL 1.2 und OpenGL 4.0 alle wichtigen aktuellen Standards. Auch ein verbesserter Decoder für 4K-Videos sowie ein überarbeiteter Quick-Sync-Encoder (bei vielen Einstiegsmodellen deaktiviert) sind mit an Bord.

Die Performance der HD Graphics (Haswell) liegt durch die Beschneidung auf nur noch 10 EUs deutlich unter der HD Graphics 4400/4600 und etwa auf dem Level der älteren HD Graphics 3000 oder AMDs Radeon HD 8250. Nur die wenigsten aktuellen Spiele des Jahres 2013, beispielsweise das sehr anspruchslose Dota 2, können mit niedrigsten Details flüssig dargestellt werden.

Der Stromverbrauch ist dank des 22-Nanometer-Prozesses mit Tri-Gate-Transistoren relativ gering und wird dynamisch vom TDP-Budget des gesamten Chips abgezweigt. Die HD Graphics (Haswell) wird in Dual-Core-Prozessoren der ULV- und regulären 37-Watt-Klasse eingesetzt.

Weitere Details zur Grafikkartenarchitektur der Haswell Generation finden Sie in unserem Artikel zur Haswell-Architektur sowie dem Testbericht der HD Graphics 4600.

Intel UHD Graphics (Jasper Lake 32 EU)

► remove from comparison Intel UHD Graphics (Jasper Lake 32 EU)

Die Intel UHD Graphics 32 EUs (Jasper Lake, Gen. 11) ist eine Prozessorgrafikkarte, die im Januar 2021 vorgestellt wurde. Sie wird in den Topmodellen der Jasper Lake Pentium Silver Prozessoren genutzt und bietet alle 32 EUs (Executing Units - Shader Cluster) und keinen eigenen dedizierten Grafikspeicher. Die Taktung ist abhängig vom CPU-Modell und variiert von 350 - 900 MHz (minimaler Basis bis maximaler Boost-Takt). Zum Launch findet man die GPU im mobilen Pentium Silver N6000 (6W) und im Desktop N6005 (10W).

Die Gen. 11 (Generation 11) Architektur wird in Ice Lake, Lakefield und Jasper Lake eingesetzt und bietet einen deutlichen Geschwindigkeitsschub im Vergleich zur Vorgängergeneration. Die neuere Xe Graphics (Gen. 12) in Tiger Lake ist aber nochmals deutlich schneller.

Als besonderes Feature hebt Intel das neue Variable Rate Shading (VRS) der Gen11 Grafik hervor. Damit kann der Spielentwickler Bereiche definieren die mit weniger Genauigkeit geshadet werden (z.B. weit entfernte Objekte, oder Objekte im Nebel) und somit bei gleicher visueller Qualität deutlich Performance gewinnen. Hier können je nach Szene bis zu 20 - 30% (Unreal Engine bzw Civ6) an Leistung gewonnen werden. Bis jetzt unterstütz VRS lediglich Nvidia mit Turing (GTX 1650 und aufwärts).

Neben der Spieleleistung soll auch der Videoencoder deutlich schneller geworden sein. Wie der Vorgänger sollte er weiterhin H.265/HEVC im Main10-Profil mit 10 Bit Farbtiefe sowie Googles VP9-Codec in Hardware dekodieren.

Die Intel UHD wird wie Ice Lake und Lakefield im 10nm Prozess bei Intel gefertigt und soll mit TSMCs 7nm Prozess mithalten können.

Intel HD Graphics (Haswell)Intel UHD Graphics (Jasper Lake 32 EU)
Gen. 11 Serie
HD Graphics P530 compare 24 @ 0.35 - 1.05 GHz64/128 Bit
HD Graphics 5600 compare 24 @ 0.3 - 1.05 GHz64/128 Bit
HD Graphics 6000 compare 48 @ 0.3 - 1 GHz64/128 Bit
HD Graphics 4600 compare 20 @ 0.2 - 1.35 GHz64/128 Bit
HD Graphics 5500 compare 24 @ 0.3 - 0.95 GHz64/128 Bit
HD Graphics 5000 compare 40 @ 0.2 - 1.1 GHz64/128 Bit
HD Graphics 4400 compare 20 @ 0.2 - 1.1 GHz64/128 Bit
HD Graphics 5300 compare 24 @ 0.1 - 0.9 GHz64/128 Bit
HD Graphics 4000 compare 16 @ 0.35 - 1.35 GHz64/128 Bit
HD Graphics (Broadwell) compare 12 @ 0.1 - 0.85 GHz64/128 Bit
HD Graphics 4200 compare 20 @ 0.2 - 0.85 GHz64/128 Bit
HD Graphics (Skylake) compare 12 @ 0.3 - 0.8 GHz64/128 Bit
HD Graphics 405 (Braswell) compare 16 @ 0.32 - 0.7 GHz64/128 Bit
HD Graphics (Braswell) compare 16 @ 0.32 - 0.7 GHz64/128 Bit
HD Graphics 400 (Braswell) compare 12 @ 0.32 - 0.64 GHz64/128 Bit
HD Graphics (Haswell) 10 @ 0.2 - 1 GHz64/128 Bit
HD Graphics (Cherry Trail) compare 16 @ 0.2 - 0.6 GHz64/128 Bit
HD Graphics 3000 compare 12 @ 0.35 - 1.35 GHz64/128 Bit
HD Graphics 2500 compare 6 @ 0.65 - 1.15 GHz64/128 Bit
HD Graphics (Ivy Bridge) compare 6 @ 0.35 - 1.1 GHz64/128 Bit
HD Graphics 2000 compare 6 @ 0.85 - 1.35 GHz64/128 Bit
HD Graphics (Sandy Bridge) compare 6 @ 0.35 - 1.1 GHz64/128 Bit
HD Graphics (Bay Trail) compare 4 @ 0.31 - 0.9 GHz32/64/128 Bit
Iris Plus Graphics G7 (Ice Lake 64 EU) compare 64 @ 0.3 - 1.1 GHz
Iris Plus Graphics G4 (Ice Lake 48 EU) compare 48 @ 0.3 - 1.1 GHz
UHD Graphics G1 (Ice Lake 32 EU) compare 32 @ 0.3 - 1.1 GHz
UHD Graphics G7 (Lakefield GT2 64 EU) compare 64 @ 0.2 - 0.5 GHz
UHD Graphics G4 (Lakefield GT1 48 EU) compare 48 @ 0.2 - 0.5 GHz
UHD Graphics (Jasper Lake 32 EU) 32 @ 0.35 - 0.9 GHz
UHD Graphics (Elkhart Lake 32 EU) compare 32 @ 0.4 - 0.85 GHz
UHD Graphics (Jasper Lake 24 EU) compare 24 @ 0.35 - 0.8 GHz
UHD Graphics (Elkhart Lake 16 EU) compare 16 @ 0.25 - 0.85 GHz
UHD Graphics (Jasper Lake 16 EU) compare 24 @ 0.35 - 0.8 GHz
CodenameHaswell GT1Gen. 11
ArchitekturGen. 7.5 HaswellGen. 11
Pipelines10 - unified32 - unified
Kerntakt200 - 1000 (Boost) MHz350 - 900 (Boost) MHz
Speicherbandbreite64/128 Bit
Shared Memoryjaja
APIDirectX 11.1, Shader 5.0DirectX 12_1, OpenGL 4.5
Herstellungsprozess22 nm10 nm
Erscheinungsdatum01.10.2012 11.01.2021
Stromverbrauch4.8 - 10 Watt
FeaturesQuickSync
CPU in HD Graphics (Haswell)GPU Base SpeedGPU Boost / Turbo
Intel Pentium 3560M2 x 2400 MHz, 37 W400 MHz1100 MHz
Intel Pentium 3550M2 x 2300 MHz, 37 W400 MHz1100 MHz
Intel Celeron 2970M2 x 2200 MHz, 37 W400 MHz1100 MHz
min. - max.200 - 400 MHz850 - 1100 MHz
CPU in UHD Graphics (Jasper Lake 32 EU)GPU Base SpeedGPU Boost / Turbo
Intel Pentium Silver N60054 x 2000 MHz, 10 W450 MHz900 MHz
Intel Pentium Silver N60004 x 1100 MHz, 6 W350 MHz850 MHz
min. - max.200 - 450 MHz850 - 1100 MHz

Benchmarks

Performance Rating - 3DMark 11 + Fire Strike + Time Spy - HD Graphics (Haswell)
0.2 pt (0%)
Performance Rating - 3DMark 11 + Fire Strike + Time Spy - UHD Graphics (Jasper Lake 32 EU)
0.5 pt (1%)
3DMark - 3DMark Time Spy Score
min: 274     avg: 371.2     median: 372 (1%)     max: 456 Points
3DMark - 3DMark Time Spy Graphics
min: 242     avg: 328.8     median: 330 (1%)     max: 402 Points
3DMark - 3DMark Ice Storm Unlimited Graphics
43493 Points (4%)
min: 62122     avg: 71176     median: 72158 (7%)     max: 78266 Points
3DMark - 3DMark Ice Storm Extreme Graphics
min: 20602     avg: 28831     median: 30464 (4%)     max: 33792 Points
3DMark - 3DMark Cloud Gate Score
min: 2141     avg: 2403     median: 2335.5 (2%)     max: 3011 Points
min: 4709     avg: 5737     median: 5531.5 (6%)     max: 7589 Points
3DMark - 3DMark Cloud Gate Graphics
min: 3111     avg: 3415     median: 3278 (1%)     max: 4199 Points
min: 5681     avg: 7297     median: 6977 (2%)     max: 9405 Points
3DMark - 3DMark Fire Strike Standard Score
min: 300     avg: 323.8     median: 314 (1%)     max: 383 Points
min: 650     avg: 998     median: 982 (2%)     max: 1260 Points
3DMark - 3DMark Fire Strike Standard Graphics
min: 340     avg: 370.8     median: 362.5 (0%)     max: 433 Points
min: 712     avg: 1056     median: 1016 (1%)     max: 1360 Points
3DMark - 3DMark Ice Storm Graphics
min: 29291     avg: 34138     median: 34675 (4%)     max: 40515 Points
min: 21465     avg: 39252     median: 40638.5 (5%)     max: 54265 Points
3DMark - 3DMark Wild Life Unlimited
min: 2289     avg: 2505     median: 2504.5 (1%)     max: 2720 Points
3DMark - 3DMark Wild Life Extreme Unlimited
681 Points (1%)
3DMark - 3DMark Night Raid
min: 3217     avg: 3440     median: 3439.5 (3%)     max: 3662 Points
3DMark - 3DMark Night Raid Graphics Score
min: 4254     avg: 4588     median: 4588 (2%)     max: 4922 Points
3DMark 11 - 3DM11 Performance Score
min: 435     avg: 543     median: 544 (1%)     max: 688 Points
min: 1448     avg: 1756     median: 1652 (2%)     max: 2086 Points
3DMark 11 - 3DM11 Performance GPU
min: 384     avg: 479.6     median: 484 (0%)     max: 602 Points
min: 1356     avg: 1625     median: 1589 (1%)     max: 1872 Points
3DMark Vantage
3DM Vant. Perf. total + Intel HD Graphics (Haswell)
3DMark Vantage - 3DM Vant. Perf. total
min: 2146     avg: 2163     median: 2163 (1%)     max: 2180 Points
3DM Vant. Perf. total + Intel UHD Graphics (Jasper Lake 32 EU)
min: 5185     avg: 6317     median: 6316.5 (2%)     max: 7448 Points
3DM Vant. Perf. GPU no PhysX + Intel HD Graphics (Haswell)
3DMark Vantage - 3DM Vant. Perf. GPU no PhysX
min: 1848     avg: 1859     median: 1859 (1%)     max: 1870 Points
3DM Vant. Perf. GPU no PhysX + Intel UHD Graphics (Jasper Lake 32 EU)
min: 4446     avg: 5452     median: 5451.5 (3%)     max: 6457 Points
3DMark 05 - 3DMark 05 - Standard
min: 8291     avg: 11395     median: 11395 (12%)     max: 14499 Points
3DMark 06 3DMark 06 - Standard 1280x1024 + Intel HD Graphics (Haswell)
3DMark 06
min: 2917     avg: 3274     median: 3357.5 (4%)     max: 3463 Points
3DMark 06 - Standard 1280x1024 + Intel UHD Graphics (Jasper Lake 32 EU)
min: 5416     avg: 7321     median: 6074 (8%)     max: 10473 Points
Unigine Valley 1.0 - Unigine Valley 1.0 DX
min: 3.5     avg: 4.6     median: 4.6 (1%)     max: 5.6 fps
Unigine Heaven 3.0 - Unigine Heaven 3.0 DX 11
12.6 fps (4%)
Unigine Heaven 3.0 - Unigine Heaven 3.0 OpenGL
13.7 fps (6%)
Unigine Heaven 2.1 - Heaven 2.1 high
15.4 fps (3%)
Windows 7 Experience Index - Win7 Gaming graphics
6.3 Points (80%)
Windows 7 Experience Index - Win7 Graphics
4.7 Points (59%)
Cinebench R10 Cinebench R10 Shading (32bit) + Intel HD Graphics (Haswell)
Cinebench R10 - Cinebench R10 Shading (32bit)
min: 3867     avg: 4235     median: 4215.5 (3%)     max: 4642 Points
Cinebench R10 Shading (32bit) + Intel UHD Graphics (Jasper Lake 32 EU)
min: 6115     avg: 6526     median: 6561 (5%)     max: 6868 Points
Cinebench R11.5 Cinebench R11.5 OpenGL 64 Bit + Intel HD Graphics (Haswell)
Cinebench R11.5 - Cinebench R11.5 OpenGL 64 Bit
min: 9.38     avg: 11.4     median: 11.6 (4%)     max: 12.78 fps
Cinebench R11.5 OpenGL 64 Bit + Intel UHD Graphics (Jasper Lake 32 EU)
min: 18.59     avg: 20.5     median: 19.8 (7%)     max: 23.82 fps
Cinebench R15
Cinebench R15 OpenGL 64 Bit + Intel HD Graphics (Haswell)
Cinebench R15 - Cinebench R15 OpenGL 64 Bit
min: 10.28     avg: 13.2     median: 13.9 (1%)     max: 14.59 fps
Cinebench R15 OpenGL 64 Bit + Intel UHD Graphics (Jasper Lake 32 EU)
min: 25.4     avg: 31.3     median: 31.6 (2%)     max: 37.14 fps
Cinebench R15 OpenGL Ref. Match 64 Bit + Intel HD Graphics (Haswell)
Cinebench R15 - Cinebench R15 OpenGL Ref. Match 64 Bit
98 % (98%)
Cinebench R15 OpenGL Ref. Match 64 Bit + Intel UHD Graphics (Jasper Lake 32 EU)
97.8 % (98%)
GFXBench - GFXBench 5.0 Aztec Ruins High Tier Offscreen
min: 9.6     avg: 10.5     median: 10.5 (2%)     max: 11.3 fps
GFXBench - GFXBench 5.0 Aztec Ruins Normal Tier Offscreen
min: 24.4     avg: 26.5     median: 26.5 (2%)     max: 28.6 fps
GFXBench - GFXBench Car Chase Offscreen
11.6 fps (1%)
min: 24     avg: 25.1     median: 25.1 (3%)     max: 26.1 fps
GFXBench 3.1 - GFXBench Manhattan ES 3.1 Offscreen
20.1 fps (0%)
min: 31.7     avg: 34     median: 34 (1%)     max: 36.2 fps
GFXBench 3.0 - GFXBench 3.0 Manhattan Offscreen
28.7 fps (2%)
min: 48.7     avg: 53.7     median: 53.7 (3%)     max: 58.7 fps
GFXBench (DX / GLBenchmark) 2.7
GFXBench T-Rex HD Offscreen C24Z16 + Intel HD Graphics (Haswell)
GFXBench (DX / GLBenchmark) 2.7 - GFXBench T-Rex HD Offscreen C24Z16
53.5 fps (0%)
GFXBench T-Rex HD Offscreen C24Z16 + Intel UHD Graphics (Jasper Lake 32 EU)
min: 85.6     avg: 91.2     median: 91.2 (1%)     max: 96.8 fps
LuxMark v2.0 64Bit - LuxMark v2.0 Room GPU
min: 77     avg: 93     median: 93 (0%)     max: 109 Samples/s
min: 136     avg: 163.8     median: 160 (1%)     max: 199 Samples/s
LuxMark v2.0 64Bit - LuxMark v2.0 Sala GPU
min: 115     avg: 140     median: 140 (0%)     max: 165 Samples/s
min: 274     avg: 364.5     median: 387 (1%)     max: 410 Samples/s
ComputeMark v2.1 - ComputeMark v2.1 Result
min: 355     avg: 370     median: 370 (0%)     max: 385 Points
min: 771     avg: 983     median: 1012.5 (1%)     max: 1136 Points
Power Consumption - Furmark Stress Test Power Consumption - external Monitor *
43.7 Watt (6%)
Power Consumption - The Witcher 3 Power Consumption - external Monitor *
30.5 Watt (4%)
min: 13.2     avg: 14.5     median: 13.9 (2%)     max: 16.3 Watt
Power Consumption - Witcher 3 Power Consumption *
min: 14.3     avg: 15.4     median: 15.4 (3%)     max: 16.5 Watt
Power Consumption - Witcher 3 ultra Power Efficiency
0.2 fps per Watt (15%)
Power Consumption - Witcher 3 ultra Power Efficiency - external Monitor
0.2 fps per Watt (15%)

Average Benchmarks Intel HD Graphics (Haswell) → 100% n=22

Average Benchmarks Intel UHD Graphics (Jasper Lake 32 EU) → 220% n=22

- Bereich der Benchmarkergebnisse für diese Grafikkarte
- Durchschnittliche Benchmarkergebnisse für diese Grafikkarte
* Smaller numbers mean a higher performance
1 This benchmark is not used for the average calculation

Spiele-Benchmarks

Die folgenden Benchmarks basieren auf unseren Spieletests mit Testnotebooks. Die Performance dieser Grafikkarte bei den gelisteten Spielen ist abhängig von der verwendeten CPU, Speicherausstattung, Treiber und auch Betriebssystem. Dadurch müssen die untenstehenden Werte nicht repräsentativ sein. Detaillierte Informationen über das verwendete System sehen Sie nach einem Klick auf den fps-Wert.

low 1920x1080
UHD Graphics (Jasper Lake 32 EU):
5.4  fps
med. 1920x1080
UHD Graphics (Jasper Lake 32 EU):
6.6  fps
high 1920x1080
UHD Graphics (Jasper Lake 32 EU):
4.3  fps
low 1280x720
UHD Graphics (Jasper Lake 32 EU):
20.5  fps
low 1280x720
UHD Graphics (Jasper Lake 32 EU):
12.8  fps
low 1280x720
UHD Graphics (Jasper Lake 32 EU):
10.6  fps
New World

New World

2021
low 1280x720
UHD Graphics (Jasper Lake 32 EU):
17  fps
F1 2021

F1 2021

2021
low 1280x720
UHD Graphics (Jasper Lake 32 EU):
37.6  fps
med. 1920x1080
UHD Graphics (Jasper Lake 32 EU):
15.8  fps
high 1920x1080
UHD Graphics (Jasper Lake 32 EU):
12.7  fps
low 1280x720
UHD Graphics (Jasper Lake 32 EU):
18.8  fps
low 1280x720
UHD Graphics (Jasper Lake 32 EU):
4.4  fps
low 1280x720
UHD Graphics (Jasper Lake 32 EU):
6.8  fps
F1 2020

F1 2020

2020
low 1280x720
UHD Graphics (Jasper Lake 32 EU):
15.3 30.8 ~ 23 fps
med. 1920x1080
UHD Graphics (Jasper Lake 32 EU):
14.7  fps
high 1920x1080
UHD Graphics (Jasper Lake 32 EU):
10.5  fps
ultra 1920x1080
UHD Graphics (Jasper Lake 32 EU):
6.4  fps
low 1280x720
UHD Graphics (Jasper Lake 32 EU):
4.1 19.2 ~ 12 fps
med. 1920x1080
UHD Graphics (Jasper Lake 32 EU):
8  fps
high 1920x1080
UHD Graphics (Jasper Lake 32 EU):
4.7  fps
low 1280x720
UHD Graphics (Jasper Lake 32 EU):
5.2  fps
low 1280x720
HD Graphics (Haswell):
0 (!)  fps
Hitman 2

Hitman 2

2018
low 1280x720
100%
HD Graphics (Haswell):
4.9 (!)  fps
Strange Brigade

Strange Brigade

2018
low 1280x720
UHD Graphics (Jasper Lake 32 EU):
15.6 16.3 18.7 20.3 32 ~ 21 fps
med. 1920x1080
UHD Graphics (Jasper Lake 32 EU):
8.2 9.7 12.1 ~ 10 fps
high 1920x1080
UHD Graphics (Jasper Lake 32 EU):
7.7 10.2 ~ 9 fps
ultra 1920x1080
UHD Graphics (Jasper Lake 32 EU):
13.3  fps
Far Cry 5

Far Cry 5

2018
low 1280x720
UHD Graphics (Jasper Lake 32 EU):
3  fps
med. 1920x1080
UHD Graphics (Jasper Lake 32 EU):
1  fps
high 1920x1080
UHD Graphics (Jasper Lake 32 EU):
1  fps
ultra 1920x1080
UHD Graphics (Jasper Lake 32 EU):
1  fps
World of Tanks enCore

World of Tanks enCore

2018
low 1366x768
UHD Graphics (Jasper Lake 32 EU):
91.2  fps
med. 1920x1080
UHD Graphics (Jasper Lake 32 EU):
13.3  fps
low 1280x720
100%
HD Graphics (Haswell):
14.3  fps
126%
UHD Graphics (Jasper Lake 32 EU):
14.2 15.2 16.1 17.3 20 21 23.4 ~ 18 fps
med. 1920x1080
100%
HD Graphics (Haswell):
8  fps
138%
UHD Graphics (Jasper Lake 32 EU):
0 (!) 10.2 10.2 11.4 12.4 14.5 15.9 ~ 11 fps
high 1920x1080
UHD Graphics (Jasper Lake 32 EU):
8.9 9 9.1 10.5 12.5 13.2 14.6 ~ 11 fps
low 1280x720
UHD Graphics (Jasper Lake 32 EU):
5.3 5.4 9 10.7 12.4 14.3 ~ 10 fps
med. 1920x1080
UHD Graphics (Jasper Lake 32 EU):
1.9 3 4.5 5 5.8 6.7 ~ 4 fps
high 1920x1080
UHD Graphics (Jasper Lake 32 EU):
0.8 2 4.6 ~ 2 fps
low 1280x720
100%
HD Graphics (Haswell):
5.9  fps
F1 2017

F1 2017

2017
low 1280x720
100%
HD Graphics (Haswell):
13  fps
low 1280x720
100%
HD Graphics (Haswell):
62  fps
med. 1366x768
100%
HD Graphics (Haswell):
28.6  fps
Dirt 4

Dirt 4

2017
low 1280x720
100%
HD Graphics (Haswell):
16.4  fps
low 1280x720
100%
HD Graphics (Haswell):
45.1  fps
med. 1920x1080
100%
HD Graphics (Haswell):
15.9  fps
low 1280x720
HD Graphics (Haswell):
0 (!)  fps
low 1280x720
100%
HD Graphics (Haswell):
17.8  fps
low 1280x720
100%
HD Graphics (Haswell):
38.6  fps
med. 1366x768
100%
HD Graphics (Haswell):
21.6  fps
high 1920x1080
100%
HD Graphics (Haswell):
6.3  fps
low 1280x720
100%
HD Graphics (Haswell):
14.1  fps
low 1280x720
100%
HD Graphics (Haswell):
12.4  fps
med. 1366x768
100%
HD Graphics (Haswell):
7.1  fps
Overwatch

Overwatch

2016
low 1280x720
100%
HD Graphics (Haswell):
26.1  fps
med. 1366x768
100%
HD Graphics (Haswell):
16.3  fps
Doom

Doom

2016
low 1280x720
HD Graphics (Haswell):
0 (!)  fps
low 1280x720
100%
HD Graphics (Haswell):
6  fps
low 1280x720
100%
HD Graphics (Haswell):
8.5  fps
low 1280x720
100%
HD Graphics (Haswell):
9  fps
low 1024x768
100%
HD Graphics (Haswell):
9.4  fps
med. 1366x768
100%
HD Graphics (Haswell):
5.3  fps
high 1920x1080
100%
HD Graphics (Haswell):
2.5  fps
ultra 1920x1080
100%
HD Graphics (Haswell):
1.8  fps
low 1024x768
100%
HD Graphics (Haswell):
13.7  fps
med. 1366x768
100%
HD Graphics (Haswell):
8.9  fps
low 1024x768
100%
HD Graphics (Haswell):
11.7  fps
low 1024x768
HD Graphics (Haswell):
0 (!)  fps
low 1366x768
100%
HD Graphics (Haswell):
41.4  fps
med. 1366x768
100%
HD Graphics (Haswell):
24.1  fps
high 1920x1080
100%
HD Graphics (Haswell):
11.4  fps
low 1280x720
UHD Graphics (Jasper Lake 32 EU):
35.2 48.1 50.1 53.1 54 67.9 79.8 ~ 55 fps
med. 1366x768
UHD Graphics (Jasper Lake 32 EU):
16.4 21.5 22.4 22.4 23.5 26.9 27.8 ~ 23 fps
high 1920x1080
UHD Graphics (Jasper Lake 32 EU):
8.9 10.8 11.1 12.8 14.9 15.8 19.5 ~ 13 fps
ultra 1920x1080
UHD Graphics (Jasper Lake 32 EU):
8.3 8.4 10.4 11.5 13.8 14.4 18.3 ~ 12 fps
low 1024x768
100%
HD Graphics (Haswell):
8.9  fps
146%
UHD Graphics (Jasper Lake 32 EU):
8.4 11.3 20.1 ~ 13 fps
med. 1366x768
100%
HD Graphics (Haswell):
5.2 5.8 ~ 6 fps
150%
UHD Graphics (Jasper Lake 32 EU):
7.8 9.2 10 ~ 9 fps
high 1920x1080
100%
HD Graphics (Haswell):
3.1  fps
129%
UHD Graphics (Jasper Lake 32 EU):
3.5 4.8 ~ 4 fps
ultra 1920x1080
UHD Graphics (Jasper Lake 32 EU):
2.4 2.7 ~ 3 fps
low 1024x768
100%
HD Graphics (Haswell):
52.4  fps
med. 1366x768
100%
HD Graphics (Haswell):
12.8  fps
GTA V

GTA V

2015
low 1024x768
UHD Graphics (Jasper Lake 32 EU):
6.6 11.4 15.2 17.4 26 26.8 ~ 17 fps
med. 1366x768
UHD Graphics (Jasper Lake 32 EU):
7.5 12 13.3 26.1 ~ 15 fps
high 1920x1080
UHD Graphics (Jasper Lake 32 EU):
3.4 3.5 10.8 ~ 6 fps
low 1024x768
100%
HD Graphics (Haswell):
15.9  fps
med. 1366x768
100%
HD Graphics (Haswell):
11.2  fps
Evolve

Evolve

2015
low 1024x768
100%
HD Graphics (Haswell):
7.7  fps
med. 1366x768
100%
HD Graphics (Haswell):
5.7  fps
The Crew

The Crew

2014
low 1280x720
100%
HD Graphics (Haswell):
9.7  fps
med. 1366x768
100%
HD Graphics (Haswell):
8.4  fps
low 1024x768
100%
HD Graphics (Haswell):
10.9  fps
med. 1366x768
100%
HD Graphics (Haswell):
7  fps
F1 2014

F1 2014

2014
low 1024x768
100%
HD Graphics (Haswell):
31  fps
med. 1366x768
100%
HD Graphics (Haswell):
20  fps
low 1024x768
100%
HD Graphics (Haswell):
9  fps
med. 1366x768
100%
HD Graphics (Haswell):
5.8  fps
low 1024x768
100%
HD Graphics (Haswell):
21.6  fps
med. 1366x768
100%
HD Graphics (Haswell):
12.9  fps
low 1280x720
100%
HD Graphics (Haswell):
13.5  fps
med. 1344x756
100%
HD Graphics (Haswell):
8.3  fps
Fifa 15

Fifa 15

2014
low 1280x720
100%
HD Graphics (Haswell):
16.4  fps
high 1366x768
100%
HD Graphics (Haswell):
11.3  fps
Sims 4

Sims 4

2014
low 1024x768
100%
HD Graphics (Haswell):
123.6  fps
58%
UHD Graphics (Jasper Lake 32 EU):
71.2  fps
med. 1366x768
100%
HD Graphics (Haswell):
26.2  fps
70%
UHD Graphics (Jasper Lake 32 EU):
18.3  fps
low 1024x768
100%
HD Graphics (Haswell):
13.3  fps
med. 1366x768
100%
HD Graphics (Haswell):
9.7  fps
low 1024x768
100%
HD Graphics (Haswell):
58.2  fps
med. 1366x768
100%
HD Graphics (Haswell):
19.6  fps
low 1024x768
100%
HD Graphics (Haswell):
2.2  fps
low 1280x720
100%
HD Graphics (Haswell):
19.9  fps
med. 1280x720
100%
HD Graphics (Haswell):
14  fps
low 1024x768
100%
HD Graphics (Haswell):
35.2  fps
med. 1366x768
100%
HD Graphics (Haswell):
13.6  fps
high 1366x768
100%
HD Graphics (Haswell):
9  fps
Titanfall

Titanfall

2014
low 1024x768
100%
HD Graphics (Haswell):
23.1  fps
med. 1366x768
100%
HD Graphics (Haswell):
13.7  fps
Thief

Thief

2014
low 1024x768
100%
HD Graphics (Haswell):
10.1  fps
med. 1366x768
100%
HD Graphics (Haswell):
5.7  fps
low 1024x768
100%
HD Graphics (Haswell):
22.1  fps
med. 1366x768
100%
HD Graphics (Haswell):
13  fps
low 1024x768
100%
HD Graphics (Haswell):
11.1  fps
low 1024x768
100%
HD Graphics (Haswell):
12.8 27.8 ~ 20 fps
med. 1366x768
100%
HD Graphics (Haswell):
10 18.2 ~ 14 fps
high 1366x768
100%
HD Graphics (Haswell):
11.8  fps
ultra 1920x1080
100%
HD Graphics (Haswell):
3.9  fps
low 1024x768
100%
HD Graphics (Haswell):
21  fps
med. 1366x768
100%
HD Graphics (Haswell):
12  fps
F1 2013

F1 2013

2013
low 1024x768
100%
HD Graphics (Haswell):
27  fps
med. 1366x768
100%
HD Graphics (Haswell):
18  fps
high 1366x768
100%
HD Graphics (Haswell):
14  fps
Fifa 14

Fifa 14

2013
med. 1366x768
100%
HD Graphics (Haswell):
57.7  fps
high 1366x768
100%
HD Graphics (Haswell):
37  fps
low 1024x768
100%
HD Graphics (Haswell):
22.4  fps
med. 1366x768
100%
HD Graphics (Haswell):
16.9  fps
low 1280x720
100%
HD Graphics (Haswell):
14  fps
med. 1366x768
100%
HD Graphics (Haswell):
7.8  fps
low 1024x768
100%
HD Graphics (Haswell):
15.9  fps
med. 1366x768
100%
HD Graphics (Haswell):
8.9  fps
low 1024x768
100%
HD Graphics (Haswell):
14.2  fps
med. 1366x768
100%
HD Graphics (Haswell):
11.5  fps
Dota 2

Dota 2

2013
low 1024x768
100%
HD Graphics (Haswell):
36.9  fps
med. 1366x768
100%
HD Graphics (Haswell):
24.2  fps
low 1024x768
100%
HD Graphics (Haswell):
7.2  fps
GRID 2

GRID 2

2013
low 1024x768
100%
HD Graphics (Haswell):
38 38.5 ~ 38 fps
med. 1366x768
100%
HD Graphics (Haswell):
18.6 19.6 ~ 19 fps
high 1366x768
100%
HD Graphics (Haswell):
13.2  fps
low 1024x768
100%
HD Graphics (Haswell):
11.2  fps
low 1280x720
100%
HD Graphics (Haswell):
23 32.8 ~ 28 fps
125%
UHD Graphics (Jasper Lake 32 EU):
35  fps
med. 1366x768
100%
HD Graphics (Haswell):
10.3 14.2 ~ 12 fps
172%
UHD Graphics (Jasper Lake 32 EU):
20.6  fps
high 1366x768
100%
HD Graphics (Haswell):
11.9  fps
130%
UHD Graphics (Jasper Lake 32 EU):
15.5  fps
ultra 1920x1080
100%
HD Graphics (Haswell):
3.7  fps
low 1024x768
100%
HD Graphics (Haswell):
96.5  fps
110%
UHD Graphics (Jasper Lake 32 EU):
106  fps
med. 1366x768
100%
HD Graphics (Haswell):
28.3  fps
54%
UHD Graphics (Jasper Lake 32 EU):
15.3  fps
high 1366x768
100%
HD Graphics (Haswell):
15  fps
SimCity

SimCity

2013
low 1024x768
100%
HD Graphics (Haswell):
59.6  fps
med. 1366x768
100%
HD Graphics (Haswell):
11.2  fps
low 1024x768
100%
HD Graphics (Haswell):
28.9 30.2 30.3 30.3 31.8 ~ 30 fps
151%
UHD Graphics (Jasper Lake 32 EU):
45.4  fps
med. 1366x768
100%
HD Graphics (Haswell):
13.8 14.2 14.3 14.3 14.6 ~ 14 fps
182%
UHD Graphics (Jasper Lake 32 EU):
25.5  fps
high 1366x768
100%
HD Graphics (Haswell):
8.1 8.2 8.2 8.4 ~ 8 fps
201%
UHD Graphics (Jasper Lake 32 EU):
16.1  fps
Crysis 3

Crysis 3

2013
low 1024x768
100%
HD Graphics (Haswell):
12.2  fps
med. 1366x768
100%
HD Graphics (Haswell):
7.6  fps
low 1024x768
100%
HD Graphics (Haswell):
38.7  fps
med. 1366x768
100%
HD Graphics (Haswell):
17.7  fps
high 1366x768
100%
HD Graphics (Haswell):
13.1  fps
Far Cry 3

Far Cry 3

2012
low 1024x768
100%
HD Graphics (Haswell):
18.7  fps
med. 1366x768
100%
HD Graphics (Haswell):
11.4  fps
low 1024x768
100%
HD Graphics (Haswell):
12.3  fps
med. 1366x768
100%
HD Graphics (Haswell):
9.9  fps
low 1024x768
100%
HD Graphics (Haswell):
25.6  fps
med. 1366x768
100%
HD Graphics (Haswell):
17.6  fps
low 1024x768
100%
HD Graphics (Haswell):
22.3  fps
med. 1366x768
100%
HD Graphics (Haswell):
16.8  fps
low 1024x768
100%
HD Graphics (Haswell):
46.2  fps
med. 1366x768
100%
HD Graphics (Haswell):
34.7  fps
high 1366x768
100%
HD Graphics (Haswell):
22.5  fps
low 1024x768
100%
HD Graphics (Haswell):
31  fps
med. 1366x768
100%
HD Graphics (Haswell):
18.8  fps
high 1366x768
100%
HD Graphics (Haswell):
11.7  fps
low 1024x768
100%
HD Graphics (Haswell):
36.9  fps
121%
UHD Graphics (Jasper Lake 32 EU):
44.6  fps
med. 1366x768
100%
HD Graphics (Haswell):
23  fps
142%
UHD Graphics (Jasper Lake 32 EU):
32.6  fps
high 1366x768
100%
HD Graphics (Haswell):
19.5  fps
110%
UHD Graphics (Jasper Lake 32 EU):
21.4  fps
ultra 1920x1080
UHD Graphics (Jasper Lake 32 EU):
14.9  fps
low 1024x768
100%
HD Graphics (Haswell):
12.5  fps
Anno 2070

Anno 2070

2011
low 1024x768
100%
HD Graphics (Haswell):
36  fps
med. 1366x768
100%
HD Graphics (Haswell):
16  fps
high 1366x768
100%
HD Graphics (Haswell):
9.8  fps
low 1280x720
100%
HD Graphics (Haswell):
21.7 22.2 ~ 22 fps
med. 1366x768
100%
HD Graphics (Haswell):
11.2 11.3 ~ 11 fps
high 1366x768
100%
HD Graphics (Haswell):
6.8  fps
low 1024x768
100%
HD Graphics (Haswell):
36.8  fps
high 1366x768
100%
HD Graphics (Haswell):
16.7  fps
Dirt 3

Dirt 3

2011
low 800x600
100%
HD Graphics (Haswell):
51.9  fps
med. 1024x768
100%
HD Graphics (Haswell):
27.4  fps
high 1360x768
100%
HD Graphics (Haswell):
14.8  fps
Total War: Shogun 2

Total War: Shogun 2

2011
low 1024x768
100%
HD Graphics (Haswell):
49.2  fps
low 1024x768
100%
HD Graphics (Haswell):
28  fps
med. 1366x768
100%
HD Graphics (Haswell):
21.2  fps
Resident Evil 5

Resident Evil 5

2009
low 800x600
100%
HD Graphics (Haswell):
42.6  fps
high 1360x768
100%
HD Graphics (Haswell):
17.8  fps
Trackmania Nations Forever

Trackmania Nations Forever

2008
low 640x480
100%
HD Graphics (Haswell):
113  fps
high 1024x768
100%
HD Graphics (Haswell):
45.1  fps
World of Warcraft

World of Warcraft

2005
low 800x600
100%
HD Graphics (Haswell):
93.7  fps
med. 1024x768
100%
HD Graphics (Haswell):
39.2  fps

Average Gaming Intel HD Graphics (Haswell) → 100%

Average Gaming 30-70 fps → 100%

Average Gaming Intel UHD Graphics (Jasper Lake 32 EU) → 129%

Average Gaming 30-70 fps → 135%

Intel UHD Graphics (Jasper Lake 32 EU)lowmed.highultraQHD4K
Tiny Tina's Wonderlands5.436.634.25
Farming Simulator 2220.5
Back 4 Blood12.8
Alan Wake Remastered10.6
New World17
F1 202137.615.812.7
Monster Hunter Stories 218.8
Mass Effect Legendary Edition4.39
Serious Sam 46.75
F1 20202314.710.56.41
Borderlands 3127.964.68
Apex Legends5.2
Strange Brigade2110913.3
Far Cry 53111
World of Tanks enCore91.213.3
X-Plane 11.11181111
Final Fantasy XV Benchmark1042
Dota 2 Reborn55231312
The Witcher 313943
GTA V17156
Sims 471.218.3
BioShock Infinite3520.615.5
StarCraft II: Heart of the Swarm10615.3
Tomb Raider45.425.516.1
Diablo III44.632.621.414.9
< 30 fps
< 60 fps
< 120 fps
≥ 120 fps
17
5
3
16
1

14


6


Intel HD Graphics (Haswell)lowmed.highultraQHD4K
Fallout 76
Hitman 24.9
X-Plane 11.1114.38
Ark Survival Evolved5.9
F1 201713
Team Fortress 26228.6
Dirt 416.4
Rocket League45.115.9
Mass Effect Andromeda
Resident Evil 717.8
Farming Simulator 1738.621.66.3
Battlefield 114.1
Mirror's Edge Catalyst12.47.1
Overwatch26.116.3
Doom
Hitman 20166
The Division8.5
Far Cry Primal9
Rise of the Tomb Raider9.45.32.51.8
Rainbow Six Siege13.78.9
Just Cause 311.7
Star Wars Battlefront0
World of Warships41.424.111.4
The Witcher 38.963.1
Dirt Rally52.412.8
Battlefield Hardline15.911.2
Evolve7.75.7
The Crew9.78.4
Dragon Age: Inquisition10.97
F1 20143120
Ryse: Son of Rome95.8
Alien: Isolation21.612.9
Middle-earth: Shadow of Mordor13.58.3
Fifa 1516.411.3
Sims 4123.626.2
Risen 3: Titan Lords13.39.7
GRID: Autosport58.219.6
Watch Dogs2.2
Wolfenstein: The New Order19.914
The Elder Scrolls Online35.213.69
Titanfall23.113.7
Thief10.15.7
X-Plane 10.2522.113
Need for Speed: Rivals11.1
Battlefield 4201411.83.9
Batman: Arkham Origins2112
F1 2013271814
Fifa 1457.737
Total War: Rome II22.416.9
Saints Row IV147.8
The Bureau: XCOM Declassified15.98.9
Splinter Cell: Blacklist14.211.5
Dota 236.924.2
Company of Heroes 27.2
GRID 2381913.2
Metro: Last Light11.2
BioShock Infinite281211.93.7
StarCraft II: Heart of the Swarm96.528.315
SimCity59.611.2
Tomb Raider30148
Crysis 312.27.6
Dead Space 338.717.713.1
Far Cry 318.711.4
Hitman: Absolution12.39.9
Call of Duty: Black Ops 225.617.6
Dishonored22.316.8
Counter-Strike: GO46.234.722.5
Dirt Showdown3118.811.7
Diablo III36.92319.5
Risen 2: Dark Waters12.5
Anno 207036169.8
The Elder Scrolls V: Skyrim22116.8
Deus Ex Human Revolution36.816.7
Dirt 351.927.414.8
Total War: Shogun 249.2
Battlefield: Bad Company 22821.2
Resident Evil 542.617.8
Trackmania Nations Forever11345.1
World of Warcraft93.739.2
< 30 fps
< 60 fps
< 120 fps
≥ 120 fps
49
20
4
1
52
3

21
2

3


Eine Liste mit weiteren Spielen und allen Grafikkarten finden Sie auf unserer Seite: Welches Spiel ist mit welcher Grafikkarte spielbar?

Add one or more devices and compare

In the following list you can select (and also search for) devices that should be added to the comparison. You can select more than one device.

restrict list:

show all (including archived), 2024, 2023
v1.28
log 05. 01:21:21

#0 ran 0s before starting gpusingle class +0s ... 0s

#1 checking url part for id 4622 +0s ... 0s

#2 checking url part for id 10640 +0s ... 0s

#3 redirected to Ajax server, took 1728084081s time from redirect:0 +0s ... 0s

#4 did not recreate cache, as it is less than 5 days old! Created at Fri, 04 Oct 2024 05:16:46 +0200 +0s ... 0s

#5 composed specs +0.005s ... 0.005s

#6 did output specs +0s ... 0.005s

#7 start showIntegratedCPUs +0s ... 0.005s

#8 getting avg benchmarks for device 4622 +0.014s ... 0.019s

#9 got single benchmarks 4622 +0.014s ... 0.033s

#10 getting avg benchmarks for device 10640 +0.001s ... 0.034s

#11 got single benchmarks 10640 +0.001s ... 0.035s

#12 got avg benchmarks for devices +0s ... 0.035s

#13 min, max, avg, median took s +0.022s ... 0.058s

#14 before gaming benchmark output +0s ... 0.058s

#15 Got 350 rows for game benchmarks. +0.014s ... 0.072s

#16 composed SQL query for gamebenchmarks +0s ... 0.072s

#17 got data and put it in $dataArray +0.004s ... 0.076s

#18 benchmarks composed for output. +0.029s ... 0.105s

#19 calculated avg scores. +0s ... 0.105s

#20 return log +0.002s ... 0.107s

Teilen Sie diesen Artikel, um uns zu unterstützen. Jeder Link hilft!
> Notebook Test, Laptop Test und News > Benchmarks / Technik > Benchmarks / Technik > Grafikkarten Vergleich - Head 2 Head
Autor: Klaus Hinum,  8.09.2017 (Update:  1.07.2023)