Intel HD Graphics (Haswell) vs Intel Iris Plus Graphics 650 vs Intel HD Graphics P630
Intel HD Graphics (Haswell) ► remove from comparison
Die Intel HD Graphics ist eine in den Haswell Prozessoren integrierte Grafikkarte. Sie kommt in den mobilen Celeron- und Pentium-Modellen zu Einsatz. Je nach Prozessormodell kann die HD Graphics (auch GT1 genannt) unterschiedlich getaktet sein (typischerweise 200 MHz Basis- und 1.000 MHz Turbo-Takt). Dies sowie die Geschwindigkeit des angebundenen Arbeitsspeichers beeinflusst die Performance entscheidend.
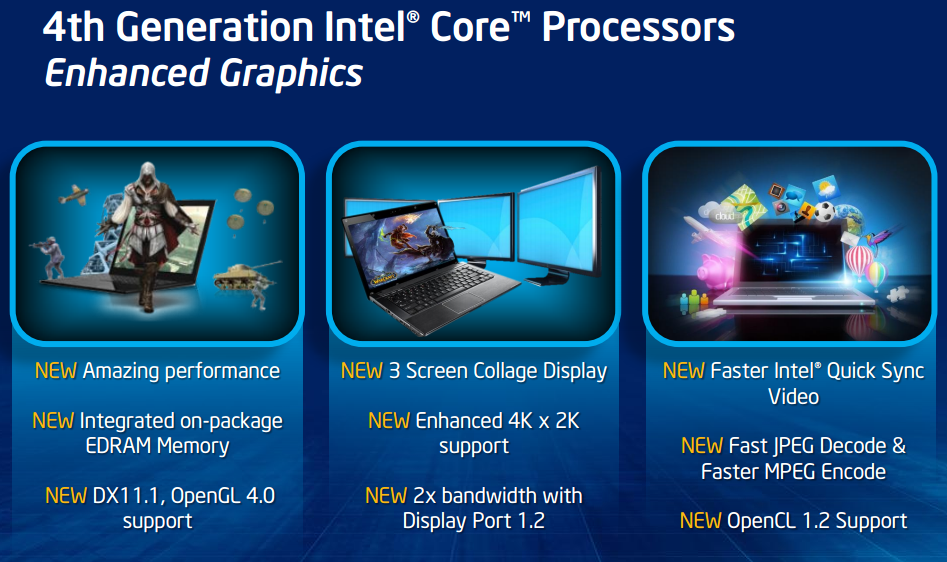
Der Grafikkern wurde im Vergleich zum Intel HD Graphics 4000 der Ivy-Bridge-Generation in verschiedenen Punkten weiterentwickelt. So unterstützt die GPU nun mit DirectX 11.1, OpenCL 1.2 und OpenGL 4.0 alle wichtigen aktuellen Standards. Auch ein verbesserter Decoder für 4K-Videos sowie ein überarbeiteter Quick-Sync-Encoder (bei vielen Einstiegsmodellen deaktiviert) sind mit an Bord.
Die Performance der HD Graphics (Haswell) liegt durch die Beschneidung auf nur noch 10 EUs deutlich unter der HD Graphics 4400 /4600 und etwa auf dem Level der älteren HD Graphics 3000 oder AMDs Radeon HD 8250 . Nur die wenigsten aktuellen Spiele des Jahres 2013, beispielsweise das sehr anspruchslose Dota 2, können mit niedrigsten Details flüssig dargestellt werden.
Der Stromverbrauch ist dank des 22-Nanometer-Prozesses mit Tri-Gate-Transistoren relativ gering und wird dynamisch vom TDP-Budget des gesamten Chips abgezweigt. Die HD Graphics (Haswell) wird in Dual-Core-Prozessoren der ULV- und regulären 37-Watt-Klasse eingesetzt.
Weitere Details zur Grafikkartenarchitektur der Haswell Generation finden Sie in unserem Artikel zur Haswell-Architektur sowie dem Testbericht der HD Graphics 4600 .
Intel Iris Plus Graphics 650 ► remove from comparison
Die Intel Iris Plus Graphics 650 (GT3e) ist eine Prozessorgrafikkarte der im Jänner 2017 vorgestellten Kaby-Lake-Modelle. Als Nachfolger der Intel Iris Graphics 550 (Skylake) ist die Iris Plus Graphics 650 dabei in den Modellen der 28-Watt-Klasse zu finden und besitzt einen dedizierten eDRAM-Cache mit 64 MB Kapazität. Technisch dürfte es kaum Unterschiede zur Iris Graphics 550 geben.
Die sogenannte GT3e-Ausbaustufe der Kaby-Lake-GPU verfügt wahrscheinlich weiterhin über 48 Execution Units (EUs), die je nach Modell mit bis zu 1.100 MHz takten. Neben dem eDRAM-Cache kann die Iris 650 auch über das Interface des Prozessors auf den Hauptspeicher zugreifen (2x 64 Bit DDR3L-1600/DDR4-2400).
Von der Iris Plus 640 der 15-Watt-Modelle unterscheidet sich die Iris 650 lediglich durch ihren etwas höheren Maximaltakt sowie die annähernd verdoppelte TDP, die eine bessere Ausnutzung des Turbo-Boost-Spielraumes erlaubt.
Performance
Die exakte Leistung der Iris Plus Graphics 650 hängt vom jeweiligen CPU-Modell ab, da sich die Maximaltaktrate sowie die Größe des L3-Caches leicht unterscheiden können. Zum anderen beeinflusst auch der verwendete Speicher (DDR3/DDR4) die Performance.
Die höchste Leistung erreichen hochtaktende Core-i7-Ableger wie der Core i7-6567U . Je nach Spiel ordnet sich die Iris Plus 650 vermutlich im Bereich einer dedizierten GeForce 930M ein und kann aktuelle Titel (Stand 2015) in niedrigen bis mittleren Einstellungen flüssig darstellen.
Features
Die überarbeitete Videoeinheit dekodiert H.265-/HEVC-Videos vollständig in Hardware. Anders als Skylake kann Kaby Lake nun auch H.265/HEVC im Main10-Profil mit 10 Bit Farbtiefe sowie Googles VP9-Codec in Hardware dekodieren. Die Bildausgabe erfolgt über DP 1.2/eDP 1.3 (max. 3.840 x 2.160 @ 60 Hz), wohingegen HDMI nur in der älteren Version 1.4a angeboten wird. Ein HDMI-2.0-Anschluss kann aber mittels Konverter von DisplayPort ergänzt werden. Maximal lassen sich drei Displays parallel angesteuern.
Leistungsaufnahme
Die Iris Plus Graphics 650 ist in den Prozessoren der 28-Watt-Klasse zu finden und damit für mittelgroße Laptops geeignet.
Intel HD Graphics P630 ► remove from comparison
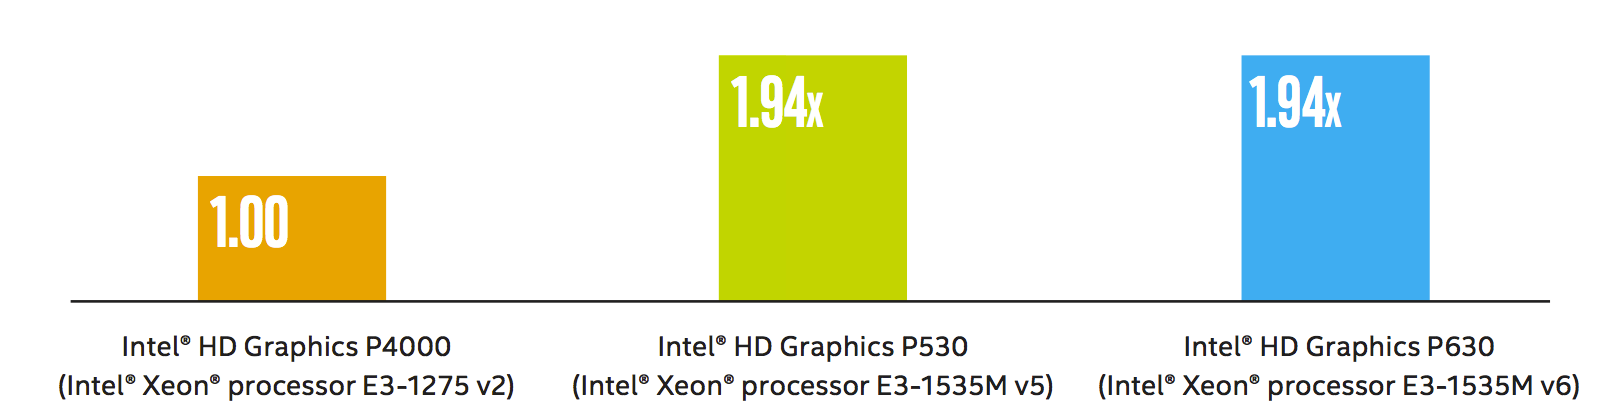
Die Intel HD Graphics P630 (GT2) ist eine integrierte Workstation-Grafikeinheit, die in verschiedenen Desktop- und Notebook-Prozessoren der 2017 vorgestellten Kaby-Lake-Generation zu finden ist (Xeon E3-1200 v6 und e3-1500M v6 Serien). Sie ist identisch mit der Intel HD Graphics 630, jedoch sind die Treiber für professionelle Software optimiert. Daher unterscheidet sie sich auch nicht von der Intel HD Graphics P530 und erreicht laut Intel auch die selbe Leistung im SPEC Viewperf12 (1.94x der alten Intel HD Graphics P4000). Die Grafikkarte ist derzeit für 15 CAD- und Workstation-Anwendungen zertifiziert .
Features
Neu bei der Kaby-Lake Generation ist die verbesserte Videoengine, welche nun auch H.265/HEVC im Main10-profil mit 10 Bit Farbtiefe sowie Googles VP9-Codec in Hardware dekodieren kann. Die Chips mit HD Graphics 530 sollten auch bereits HDCP 2.2 unterstützen und somit z.B. Netflix-Videos unter Windows 10 in 4K ausgeben können (im Gegensatz zu den ersten Kaby-Lake Dual-Core Chips mit Intel HD Graphics 620 ).
Leistungsaufnahme
Die HD Graphics P630 ist in Desktop- und Notebook-Prozessoren verschiedener TDP-Klassen zu finden. Die Quad-Core CPUs sind jedoch meistens in größeren und schwereren Notebooks verbaut. Der verbesserte 14nm+ Prozess verspricht jedoch eine etwas geringere Leistungsaufnahme im Vergleich zur Intel HD Graphics P530.
Quelle : http://www.intel.com/content/dam/www/public/us/en/documents/guides/hd-graphics-performance-guide.pdf
Intel HD Graphics (Haswell) Intel Iris Plus Graphics 650 Intel HD Graphics P630 Gen. 9.5 Serie Codename Haswell GT1 Kaby Lake GT3e Kaby-Lake-H-GT2 Architektur Gen. 7.5 Haswell Gen. 9.5 Kaby Lake Gen. 9.5 Kaby Lake Pipelines 10 - unified 48 - unified 24 - unified Kerntakt 200 - 1000 (Boost) MHz 300 - 1100 (Boost) MHz Speicherbandbreite 64/128 Bit 64/128 Bit 64/128 Bit Shared Memory ja ja ja API DirectX 11.1, Shader 5.0 DirectX 12_1, OpenGL 4.4 DirectX 12_1, OpenGL 4.4 Herstellungsprozess 22 nm 14 nm 14 nm Erscheinungsdatum 01.10.2012 03.01.2017 05.08.2015 Speichertyp DDR4 Features QuickSync QuickSync
CPU in HD Graphics (Haswell) GPU Base Speed GPU Boost / Turbo Intel Pentium 3560M 2 x 2400 MHz, 37 W 400 MHz 1100 MHz Intel Pentium 3550M 2 x 2300 MHz, 37 W 400 MHz 1100 MHz Intel Celeron 2970M 2 x 2200 MHz, 37 W 400 MHz 1100 MHz » show 10 more Intel Celeron 2950M 2 x 2000 MHz, 37 W 400 MHz 1100 MHz Intel Pentium 3558U 2 x 1700 MHz, 15 W 200 MHz 1000 MHz Intel Pentium 3556U 2 x 1700 MHz, 15 W 200 MHz 1000 MHz Intel Celeron 2981U 2 x 1600 MHz, 15 W 200 MHz 1000 MHz Intel Celeron 2980U 2 x 1600 MHz, 15 W 200 MHz 1000 MHz Intel Celeron 2957U 2 x 1400 MHz, 15 W 200 MHz 1000 MHz Intel Celeron 2955U 2 x 1400 MHz, 15 W 200 MHz 1000 MHz Intel Pentium 3561Y 2 x 1200 MHz, 11.5 W 200 MHz 850 MHz Intel Pentium 3560Y 2 x 1200 MHz, 11.5 W 200 MHz 850 MHz Intel Celeron 2961Y 2 x 1100 MHz, 11.5 W 200 MHz 850 MHz min. - max. 200 - 400 MHz 850 - 1100 MHz
CPU in Iris Plus Graphics 650 GPU Base Speed GPU Boost / Turbo Intel Core i7-7567U 2 x 3500 MHz, 28 W 300 MHz 1100 MHz Intel Core i5-7287U 2 x 3300 MHz, 28 W 300 MHz 1100 MHz Intel Core i5-7267U 2 x 3100 MHz, 28 W 300 MHz 1050 MHz Intel Core i3-7167U 2 x 2800 MHz, 28 W 300 MHz 1000 MHz min. - max. 200 - 400 MHz 850 - 1100 MHz
CPU in HD Graphics P630 GPU Base Speed GPU Boost / Turbo Intel Xeon E3-1535M v6 4 x 3100 MHz, 45 W 300 MHz 1150 MHz Intel Xeon E3-1505M v6 4 x 3000 MHz, 45 W 300 MHz 1150 MHz min. - max. 200 - 400 MHz 850 - 1150 MHz
Benchmarks Performance Rating - 3DMark 11 + Fire Strike + Time Spy - HD Graphics (Haswell)
0.2 pt (0%)
...
Intel HD Graphics (Haswell)
...
max:
3DMark - 3DMark Time Spy Score
623 Points (2%)
400 Points (1%)
3DMark - 3DMark Time Spy Graphics
555 Points (1%)
3DMark - 3DMark Ice Storm Unlimited Graphics
43493 Points (4%)
161538 Points (16%)
3DMark - 3DMark Cloud Gate Score
min: 2141 avg: 2403 median: 2335.5 (2%) max: 3011 Points
min: 8403 avg: 9150 median: 9149.5 (10%) max: 9896 Points
8280 Points (9%)
3DMark - 3DMark Cloud Gate Graphics
min: 3111 avg: 3415 median: 3278 (1%) max: 4199 Points
13153 Points (3%)
3DMark - 3DMark Fire Strike Standard Score
min: 300 avg: 323.8 median: 314 (1%) max: 383 Points
min: 1586 avg: 1655 median: 1655 (3%) max: 1724 Points
1040 Points (2%)
3DMark - 3DMark Fire Strike Standard Graphics
min: 340 avg: 370.8 median: 362.5 (0%) max: 433 Points
1698 Points (2%)
3DMark - 3DMark Ice Storm Graphics
min: 29291 avg: 34138 median: 34675 (4%) max: 40515 Points
3DMark 11 - 3DM11 Performance Score
min: 435 avg: 543 median: 544 (1%) max: 688 Points
2924 Points (4%)
3DMark 11 - 3DM11 Performance GPU
min: 384 avg: 479.6 median: 484 (0%) max: 602 Points
2762 Points (2%)
3DMark Vantage + Intel HD Graphics (Haswell) 3DMark Vantage - 3DM Vant. Perf. total
min: 2146 avg: 2163 median: 2163 (1%) max: 2180 Points
3DM Vant. Perf. GPU no PhysX + Intel HD Graphics (Haswell) 3DMark Vantage - 3DM Vant. Perf. GPU no PhysX
min: 1848 avg: 1859 median: 1859 (1%) max: 1870 Points
3DMark 06 3DMark 06 - Standard 1280x1024 + Intel HD Graphics (Haswell)
min: 2917 avg: 3274 median: 3357.5 (4%) max: 3463 Points
3DMark 06 - Standard 1280x1024 + Intel Iris Plus Graphics 650
15175 Points (20%)
Windows 7 Experience Index - Win7 Gaming graphics
6.3 Points (80%)
Windows 7 Experience Index - Win7 Graphics
4.7 Points (59%)
Cinebench R10 Cinebench R10 Shading (32bit) + Intel HD Graphics (Haswell) Cinebench R10 - Cinebench R10 Shading (32bit)
min: 3867 avg: 4235 median: 4215.5 (3%) max: 4642 Points
Cinebench R10 Shading (32bit) + Intel Iris Plus Graphics 650
8773 Points (6%)
Cinebench R11.5 Cinebench R11.5 OpenGL 64 Bit + Intel HD Graphics (Haswell) Cinebench R11.5 - Cinebench R11.5 OpenGL 64 Bit
min: 9.38 avg: 11.4 median: 11.6 (4%) max: 12.78 fps
Cinebench R11.5 OpenGL 64 Bit + Intel Iris Plus Graphics 650
45.2 fps (15%)
Cinebench R15 + Intel HD Graphics (Haswell) Cinebench R15 - Cinebench R15 OpenGL 64 Bit
min: 10.28 avg: 13.2 median: 13.9 (1%) max: 14.59 fps
Cinebench R15 OpenGL 64 Bit + Intel Iris Plus Graphics 650
min: 41.21 avg: 59.1 median: 59.1 (3%) max: 77 fps
Cinebench R15 OpenGL Ref. Match 64 Bit + Intel HD Graphics (Haswell) Cinebench R15 - Cinebench R15 OpenGL Ref. Match 64 Bit
98 % (98%)
Cinebench R15 OpenGL Ref. Match 64 Bit + Intel Iris Plus Graphics 650
99.3 % (99%)
GFXBench - GFXBench Car Chase Offscreen
11.6 fps (1%)
GFXBench 3.1 - GFXBench Manhattan ES 3.1 Offscreen
20.1 fps (0%)
GFXBench 3.0 - GFXBench 3.0 Manhattan Offscreen
28.7 fps (2%)
GFXBench (DX / GLBenchmark) 2.7 + Intel HD Graphics (Haswell) GFXBench (DX / GLBenchmark) 2.7 - GFXBench T-Rex HD Offscreen C24Z16
53.5 fps (0%)
LuxMark v2.0 64Bit - LuxMark v2.0 Room GPU
min: 77 avg: 93 median: 93 (0%) max: 109 Samples/s
336 Samples/s (2%)
LuxMark v2.0 64Bit - LuxMark v2.0 Sala GPU
min: 115 avg: 140 median: 140 (0%) max: 165 Samples/s
813 Samples/s (1%)
ComputeMark v2.1 - ComputeMark v2.1 Result
min: 355 avg: 370 median: 370 (0%) max: 385 Points
1730 Points (2%)
Power Consumption - Furmark Stress Test Power Consumption - external Monitor *
43.7 Watt (6%)
51.4 Watt (7%)
Power Consumption - The Witcher 3 Power Consumption - external Monitor *
30.5 Watt (4%)
51.4 Watt (7%)
Emissions Witcher 3 Fan Noise + Intel Iris Plus Graphics 650 Emissions - Witcher 3 Fan Noise
39.1 dB(A) (63%)
Clock Speed - GPU Clock Witcher 3 ultra
998 MHz (39%)
Clock Speed - GPU Clock Speed Furmark
848 MHz (34%)
Average Benchmarks Intel HD Graphics (Haswell) → 100% n=2 Average Benchmarks Intel Iris Plus Graphics 650 → 459% n=2 Average Benchmarks Intel HD Graphics P630 → 343% n=2
- Bereich der Benchmarkergebnisse für diese Grafikkarte
- Durchschnittliche Benchmarkergebnisse für diese Grafikkarte
* Smaller numbers mean a higher performance
1 This benchmark is not used for the average calculation
Spiele-Benchmarks Die folgenden Benchmarks basieren auf unseren Spieletests mit Testnotebooks. Die Performance dieser Grafikkarte bei den gelisteten Spielen ist abhängig von der verwendeten CPU, Speicherausstattung, Treiber und auch Betriebssystem. Dadurch müssen die untenstehenden Werte nicht repräsentativ sein. Detaillierte Informationen über das verwendete System sehen Sie nach einem Klick auf den fps-Wert.
HD Graphics (Haswell):
0 (!) [X] MSI CX61 2QC 2970M MS-16GD Intel Celeron 2970M 2.2GHz
HD Graphics (Haswell)
fps
100%
HD Graphics (Haswell):
4.9 (!) [X] MSI CX61 2QC 2970M MS-16GD Intel Celeron 2970M 2.2GHz
HD Graphics (Haswell)
min:
1 fps, max:
7 fps
fps
100%
HD Graphics (Haswell):
14.3 [X] MSI CX61 2QC 2970M MS-16GD Intel Celeron 2970M 2.2GHz
HD Graphics (Haswell)
fps
100%
HD Graphics (Haswell):
8 [X] MSI CX61 2QC 2970M MS-16GD Intel Celeron 2970M 2.2GHz
HD Graphics (Haswell)
fps
100%
HD Graphics (Haswell):
5.9 [X] MSI CX61 2QC 2970M MS-16GD Intel Celeron 2970M 2.2GHz
HD Graphics (Haswell)
min:
5 fps, max:
7 fps
fps
100%
HD Graphics (Haswell):
13 [X] MSI CX61 2QC 2970M MS-16GD Intel Celeron 2970M 2.2GHz
HD Graphics (Haswell)
min:
7 fps, max:
13 fps
fps
100%
HD Graphics (Haswell):
62 [X] MSI CX61 2QC 2970M MS-16GD Intel Celeron 2970M 2.2GHz
HD Graphics (Haswell)
min:
54 fps
fps
100%
HD Graphics (Haswell):
28.6 [X] MSI CX61 2QC 2970M MS-16GD Intel Celeron 2970M 2.2GHz
HD Graphics (Haswell)
min:
19 fps
fps
100%
HD Graphics (Haswell):
16.4 [X] MSI CX61 2QC 2970M MS-16GD Intel Celeron 2970M 2.2GHz
HD Graphics (Haswell)
min:
14 fps, max:
19 fps
fps
390%
Iris Plus Graphics 650:
64 fps
Iris Plus Graphics 650:
21.3 fps
Iris Plus Graphics 650:
14.2 fps
100%
HD Graphics (Haswell):
45.1 [X] MSI CX61 2QC 2970M MS-16GD Intel Celeron 2970M 2.2GHz
HD Graphics (Haswell)
min:
37 fps, max:
54 fps
fps
251%
Iris Plus Graphics 650:
113 fps
100%
HD Graphics (Haswell):
15.9 [X] MSI CX61 2QC 2970M MS-16GD Intel Celeron 2970M 2.2GHz
HD Graphics (Haswell)
min:
13 fps, max:
19 fps
fps
357%
Iris Plus Graphics 650:
56.8 fps
Iris Plus Graphics 650:
38.9 fps
Iris Plus Graphics 650:
51.4 fps
Iris Plus Graphics 650:
20.2 fps
HD Graphics (Haswell):
0 (!) [X] MSI CX61 2QC 2970M MS-16GD Intel Celeron 2970M 2.2GHz
HD Graphics (Haswell)
fps
Iris Plus Graphics 650:
25.8 fps
Iris Plus Graphics 650:
10.5 fps
Iris Plus Graphics 650:
17.6 fps
Iris Plus Graphics 650:
39.7 fps
Iris Plus Graphics 650:
15.2 fps
100%
HD Graphics (Haswell):
17.8 [X] MSI CX61 2QC 2970M MS-16GD Intel Celeron 2970M 2.2GHz
HD Graphics (Haswell)
min:
15 fps, max:
21 fps
fps
Iris Plus Graphics 650:
15 fps
Iris Plus Graphics 650:
32.4 fps
Iris Plus Graphics 650:
54.1 fps
Iris Plus Graphics 650:
37.9 fps
100%
HD Graphics (Haswell):
38.6 [X] MSI CX61 2QC 2970M MS-16GD Intel Celeron 2970M 2.2GHz
HD Graphics (Haswell)
min:
35 fps, max:
52 fps
fps
100%
HD Graphics (Haswell):
21.6 [X] MSI CX61 2QC 2970M MS-16GD Intel Celeron 2970M 2.2GHz
HD Graphics (Haswell)
min:
19 fps, max:
28 fps
fps
100%
HD Graphics (Haswell):
6.3 [X] MSI CX61 2QC 2970M MS-16GD Intel Celeron 2970M 2.2GHz
HD Graphics (Haswell)
min:
5 fps, max:
8 fps
fps
584%
Iris Plus Graphics 650:
36.8 fps
Iris Plus Graphics 650:
19.9 fps
100%
HD Graphics (Haswell):
14.1 [X] MSI CX61 2QC 2970M MS-16GD Intel Celeron 2970M 2.2GHz
HD Graphics (Haswell)
min:
12 fps, max:
15 fps
fps
327%
Iris Plus Graphics 650:
46.1 fps
Iris Plus Graphics 650:
29.5 fps
Iris Plus Graphics 650:
42.2 fps
Iris Plus Graphics 650:
20.2 fps
Iris Plus Graphics 650:
19.2 fps
Iris Plus Graphics 650:
14.6 fps
Iris Plus Graphics 650:
8.2 fps
100%
HD Graphics (Haswell):
12.4 [X] MSI CX61 2QC 2970M MS-16GD Intel Celeron 2970M 2.2GHz
HD Graphics (Haswell)
min:
11 fps, max:
14 fps
fps
100%
HD Graphics (Haswell):
7.1 [X] MSI CX61 2QC 2970M MS-16GD Intel Celeron 2970M 2.2GHz
HD Graphics (Haswell)
min:
6 fps, max:
8 fps
fps
100%
HD Graphics (Haswell):
26.1 [X] MSI CX61 2QC 2970M MS-16GD Intel Celeron 2970M 2.2GHz
HD Graphics (Haswell)
min:
19 fps, max:
33 fps
fps
303%
Iris Plus Graphics 650:
79.2 fps
100%
HD Graphics (Haswell):
16.3 [X] MSI CX61 2QC 2970M MS-16GD Intel Celeron 2970M 2.2GHz
HD Graphics (Haswell)
min:
12 fps, max:
21 fps
fps
352%
Iris Plus Graphics 650:
57.4 fps
Iris Plus Graphics 650:
25.6 fps
Iris Plus Graphics 650:
21.4 fps
HD Graphics (Haswell):
0 (!) [X] MSI CX61 2QC 2970M MS-16GD Intel Celeron 2970M 2.2GHz
HD Graphics (Haswell)
fps
100%
HD Graphics (Haswell):
6 [X] MSI CX61 2QC 2970M MS-16GD Intel Celeron 2970M 2.2GHz
HD Graphics (Haswell)
min:
3 fps, max:
9 fps
fps
100%
HD Graphics (Haswell):
8.5 [X] MSI CX61 2QC 2970M MS-16GD Intel Celeron 2970M 2.2GHz
HD Graphics (Haswell)
min:
6 fps, max:
11 fps
fps
353%
Iris Plus Graphics 650:
30 fps
100%
HD Graphics (Haswell):
9 [X] MSI CX61 2QC 2970M MS-16GD Intel Celeron 2970M 2.2GHz
HD Graphics (Haswell)
min:
8 fps, max:
11 fps
fps
356%
Iris Plus Graphics 650:
32 fps
Iris Plus Graphics 650:
15 fps
100%
HD Graphics (Haswell):
9.4 [X] MSI CX61 2QC 2970M MS-16GD Intel Celeron 2970M 2.2GHz
HD Graphics (Haswell)
min:
8 fps, max:
11 fps
fps
276%
Iris Plus Graphics 650:
25.9 fps
100%
HD Graphics (Haswell):
5.3 [X] MSI CX61 2QC 2970M MS-16GD Intel Celeron 2970M 2.2GHz
HD Graphics (Haswell)
fps
345%
Iris Plus Graphics 650:
18.3 fps
100%
HD Graphics (Haswell):
2.5 [X] MSI CX61 2QC 2970M MS-16GD Intel Celeron 2970M 2.2GHz
HD Graphics (Haswell)
fps
100%
HD Graphics (Haswell):
1.8 [X] MSI CX61 2QC 2970M MS-16GD Intel Celeron 2970M 2.2GHz
HD Graphics (Haswell)
fps
100%
HD Graphics (Haswell):
13.7 [X] MSI CX61 2QC 2970M MS-16GD Intel Celeron 2970M 2.2GHz
HD Graphics (Haswell)
min:
5 fps, max:
75 fps
fps
396%
Iris Plus Graphics 650:
54.2 fps
100%
HD Graphics (Haswell):
8.9 [X] MSI CX61 2QC 2970M MS-16GD Intel Celeron 2970M 2.2GHz
HD Graphics (Haswell)
min:
4 fps, max:
65 fps
fps
400%
Iris Plus Graphics 650:
35.6 fps
Iris Plus Graphics 650:
20.8 fps
100%
HD Graphics (Haswell):
11.7 [X] MSI CX61 2QC 2970M MS-16GD Intel Celeron 2970M 2.2GHz
HD Graphics (Haswell)
min:
10 fps, max:
14 fps
fps
HD Graphics (Haswell):
0 (!) [X] MSI CX61 2QC 2970M MS-16GD Intel Celeron 2970M 2.2GHz
HD Graphics (Haswell)
fps
100%
HD Graphics (Haswell):
41.4 [X] MSI CX61 2QC 2970M MS-16GD Intel Celeron 2970M 2.2GHz
HD Graphics (Haswell)
min:
21 fps, max:
51 fps
fps
100%
HD Graphics (Haswell):
24.1 [X] MSI CX61 2QC 2970M MS-16GD Intel Celeron 2970M 2.2GHz
HD Graphics (Haswell)
min:
11 fps, max:
35 fps
fps
100%
HD Graphics (Haswell):
11.4 [X] MSI CX61 2QC 2970M MS-16GD Intel Celeron 2970M 2.2GHz
HD Graphics (Haswell)
min:
5 fps, max:
18 fps
fps
Iris Plus Graphics 650:
95 fps
Iris Plus Graphics 650:
64 fps
Iris Plus Graphics 650:
29.7 fps
Iris Plus Graphics 650:
25 fps
100%
HD Graphics (Haswell):
8.9 [X] MSI CX61 2QC 2970M MS-16GD Intel Celeron 2970M 2.2GHz
HD Graphics (Haswell)
min:
5 fps, max:
12 fps
fps
240%
Iris Plus Graphics 650:
21.4 fps
100%
HD Graphics (Haswell):
5.2 [X] MSI CX61 2QC 2970M MS-16GD Intel Celeron 2970M 2.2GHz
HD Graphics (Haswell)
min:
3 fps, max:
8 fps
5.8 ~ 6 fps
100%
HD Graphics (Haswell):
3.1 fps
100%
HD Graphics (Haswell):
52.4 fps
100%
HD Graphics (Haswell):
12.8 fps
Iris Plus Graphics 650:
56.5 fps
Iris Plus Graphics 650:
49.9 fps
Iris Plus Graphics 650:
11.6 fps
Iris Plus Graphics 650:
5 fps
100%
HD Graphics (Haswell):
15.9 fps
100%
HD Graphics (Haswell):
11.2 fps
100%
HD Graphics (Haswell):
7.7 fps
100%
HD Graphics (Haswell):
5.7 fps
100%
HD Graphics (Haswell):
9.7 fps
100%
HD Graphics (Haswell):
8.4 fps
100%
HD Graphics (Haswell):
10.9 fps
100%
HD Graphics (Haswell):
7 fps
100%
HD Graphics (Haswell):
31 fps
100%
HD Graphics (Haswell):
20 fps
100%
HD Graphics (Haswell):
9 fps
100%
HD Graphics (Haswell):
5.8 fps
100%
HD Graphics (Haswell):
21.6 fps
100%
HD Graphics (Haswell):
12.9 fps
100%
HD Graphics (Haswell):
13.5 fps
100%
HD Graphics (Haswell):
8.3 fps
100%
HD Graphics (Haswell):
16.4 fps
100%
HD Graphics (Haswell):
11.3 fps
100%
HD Graphics (Haswell):
123.6 fps
100%
HD Graphics (Haswell):
26.2 fps
100%
HD Graphics (Haswell):
13.3 fps
100%
HD Graphics (Haswell):
9.7 fps
100%
HD Graphics (Haswell):
58.2 fps
100%
HD Graphics (Haswell):
19.6 fps
100%
HD Graphics (Haswell):
2.2 fps
100%
HD Graphics (Haswell):
19.9 fps
100%
HD Graphics (Haswell):
14 fps
100%
HD Graphics (Haswell):
35.2 fps
100%
HD Graphics (Haswell):
13.6 fps
100%
HD Graphics (Haswell):
9 fps
100%
HD Graphics (Haswell):
23.1 fps
100%
HD Graphics (Haswell):
13.7 fps
100%
HD Graphics (Haswell):
10.1 fps
100%
HD Graphics (Haswell):
5.7 fps
100%
HD Graphics (Haswell):
22.1 fps
100%
HD Graphics (Haswell):
13 fps
100%
HD Graphics (Haswell):
11.1 fps
100%
HD Graphics (Haswell):
12.8 27.8 [X] MSI CX61 2QC 2970M MS-16GD Intel Celeron 2970M 2.2GHz
HD Graphics (Haswell)
~ 20 fps
100%
HD Graphics (Haswell):
10 18.2 [X] MSI CX61 2QC 2970M MS-16GD Intel Celeron 2970M 2.2GHz
HD Graphics (Haswell)
~ 14 fps
100%
HD Graphics (Haswell):
11.8 [X] MSI CX61 2QC 2970M MS-16GD Intel Celeron 2970M 2.2GHz
HD Graphics (Haswell)
fps
100%
HD Graphics (Haswell):
3.9 [X] MSI CX61 2QC 2970M MS-16GD Intel Celeron 2970M 2.2GHz
HD Graphics (Haswell)
fps
100%
HD Graphics (Haswell):
21 fps
100%
HD Graphics (Haswell):
12 fps
100%
HD Graphics (Haswell):
27 fps
100%
HD Graphics (Haswell):
18 fps
100%
HD Graphics (Haswell):
14 fps
100%
HD Graphics (Haswell):
57.7 fps
100%
HD Graphics (Haswell):
37 fps
100%
HD Graphics (Haswell):
22.4 fps
100%
HD Graphics (Haswell):
16.9 fps
100%
HD Graphics (Haswell):
14 fps
100%
HD Graphics (Haswell):
7.8 fps
100%
HD Graphics (Haswell):
15.9 fps
100%
HD Graphics (Haswell):
8.9 fps
100%
HD Graphics (Haswell):
14.2 fps
100%
HD Graphics (Haswell):
11.5 fps
100%
HD Graphics (Haswell):
36.9 fps
100%
HD Graphics (Haswell):
24.2 fps
100%
HD Graphics (Haswell):
7.2 fps
100%
HD Graphics (Haswell):
38 38.5 ~ 38 fps
100%
HD Graphics (Haswell):
18.6 19.6 ~ 19 fps
100%
HD Graphics (Haswell):
13.2 fps
100%
HD Graphics (Haswell):
11.2 fps
100%
HD Graphics (Haswell):
23 32.8 [X] MSI CX61 2QC 2970M MS-16GD Intel Celeron 2970M 2.2GHz
HD Graphics (Haswell)
~ 28 fps
300%
Iris Plus Graphics 650:
84 fps
100%
HD Graphics (Haswell):
10.3 14.2 [X] MSI CX61 2QC 2970M MS-16GD Intel Celeron 2970M 2.2GHz
HD Graphics (Haswell)
~ 12 fps
453%
Iris Plus Graphics 650:
54.4 fps
100%
HD Graphics (Haswell):
11.9 [X] MSI CX61 2QC 2970M MS-16GD Intel Celeron 2970M 2.2GHz
HD Graphics (Haswell)
fps
391%
Iris Plus Graphics 650:
46.5 fps
100%
HD Graphics (Haswell):
3.7 [X] MSI CX61 2QC 2970M MS-16GD Intel Celeron 2970M 2.2GHz
HD Graphics (Haswell)
fps
359%
Iris Plus Graphics 650:
13.3 fps
100%
HD Graphics (Haswell):
96.5 fps
100%
HD Graphics (Haswell):
28.3 fps
100%
HD Graphics (Haswell):
15 fps
100%
HD Graphics (Haswell):
59.6 fps
100%
HD Graphics (Haswell):
11.2 fps
100%
HD Graphics (Haswell):
12.2 fps
100%
HD Graphics (Haswell):
7.6 fps
100%
HD Graphics (Haswell):
38.7 fps
100%
HD Graphics (Haswell):
17.7 fps
100%
HD Graphics (Haswell):
13.1 fps
100%
HD Graphics (Haswell):
18.7 fps
100%
HD Graphics (Haswell):
11.4 fps
100%
HD Graphics (Haswell):
12.3 fps
100%
HD Graphics (Haswell):
9.9 fps
100%
HD Graphics (Haswell):
25.6 fps
100%
HD Graphics (Haswell):
17.6 fps
100%
HD Graphics (Haswell):
22.3 fps
100%
HD Graphics (Haswell):
16.8 fps
100%
HD Graphics (Haswell):
46.2 fps
100%
HD Graphics (Haswell):
34.7 fps
100%
HD Graphics (Haswell):
22.5 fps
100%
HD Graphics (Haswell):
31 fps
100%
HD Graphics (Haswell):
18.8 fps
100%
HD Graphics (Haswell):
11.7 fps
100%
HD Graphics (Haswell):
36.9 fps
100%
HD Graphics (Haswell):
23 fps
100%
HD Graphics (Haswell):
19.5 fps
100%
HD Graphics (Haswell):
12.5 fps
100%
HD Graphics (Haswell):
36 fps
100%
HD Graphics (Haswell):
16 fps
100%
HD Graphics (Haswell):
9.8 fps
100%
HD Graphics (Haswell):
21.7 22.2 ~ 22 fps
100%
HD Graphics (Haswell):
11.2 11.3 ~ 11 fps
100%
HD Graphics (Haswell):
6.8 fps
100%
HD Graphics (Haswell):
36.8 fps
100%
HD Graphics (Haswell):
16.7 fps
100%
HD Graphics (Haswell):
51.9 fps
100%
HD Graphics (Haswell):
27.4 fps
100%
HD Graphics (Haswell):
14.8 fps
100%
HD Graphics (Haswell):
49.2 fps
100%
HD Graphics (Haswell):
28 fps
100%
HD Graphics (Haswell):
21.2 fps
100%
HD Graphics (Haswell):
42.6 fps
100%
HD Graphics (Haswell):
17.8 fps
100%
HD Graphics (Haswell):
113 fps
100%
HD Graphics (Haswell):
45.1 fps
100%
HD Graphics (Haswell):
93.7 fps
100%
HD Graphics (Haswell):
39.2 fps
Average Gaming Intel HD Graphics (Haswell) → 100% Average Gaming 30-70 fps → 100%
Average Gaming Intel Iris Plus Graphics 650 → 357% Average Gaming 30-70 fps → 401%
v1.28
log 21. 13:43:47
#0 ran 0s before starting gpusingle class +0s ... 0s
#1 checking url part for id 4622 +0s ... 0s
#2 checking url part for id 7655 +0s ... 0s
#3 checking url part for id 7657 +0s ... 0s
#4 redirected to Ajax server, took 1726919026s time from redirect:1 +0s ... 0s
#5 did not recreate cache, as it is less than 5 days old! Created at Thu, 19 Sep 2024 05:16:33 +0200 +0s ... 0s
#6 composed specs +0.005s ... 0.005s
#7 did output specs +0s ... 0.005s
#8 start showIntegratedCPUs +0s ... 0.005s
#9 getting avg benchmarks for device 4622 +0.002s ... 0.007s
#10 got single benchmarks 4622 +0.002s ... 0.008s
#11 getting avg benchmarks for device 7655 +0s ... 0.009s
#12 got single benchmarks 7655 +0s ... 0.009s
#13 getting avg benchmarks for device 7657 +0s ... 0.009s
#14 got single benchmarks 7657 +0s ... 0.009s
#15 got avg benchmarks for devices +0s ... 0.009s
#16 min, max, avg, median took s +0.015s ... 0.024s
#17 before gaming benchmark output +0s ... 0.024s
#18 Got 230 rows for game benchmarks. +0.01s ... 0.034s
#19 composed SQL query for gamebenchmarks +0s ... 0.034s
#20 got data and put it in $dataArray +0.003s ... 0.037s
#21 benchmarks composed for output. +0.025s ... 0.063s
#22 calculated avg scores. +0s ... 0.063s
#23 return log +0.001s ... 0.063s
Teilen Sie diesen Artikel, um uns zu unterstützen. Jeder Link hilft!
Autor: Klaus Hinum, 8.09.2017 (Update: 1.07.2023)
 Deutsch
 English
 Español
 Français
 Italiano
 Nederlands
 Polski
 Português
 Русский
 Türkçe
 Svenska
 Chinese
 Magyar