Intel HD Graphics (Broadwell) vs AMD Radeon R6 (Mullins)
Intel HD Graphics (Broadwell)
► remove from comparison
Die Intel HD Graphics (Broadwell) (GT1) ist eine Prozessorgrafikkarte in den CPUs der Broadwell-Generation. Die GPU wird in einigen Pentium- und Celeron-Modellen der Serie verbaut und bietet 12 EUs (Execution Units bzw. Ausführungseinheiten). Die maximale Turbo-Taktrate und damit auch die Performance kann sich von Modell zu Modell leicht unterscheiden, insgesamt siedelt sich die Grafikkarte aber nur im Low-End-Segment an und ist für neuere Spiele kaum ausreichend.
Architektur und Features
Broadwell integriert eine Grafikeinheit auf Basis der Intel-Gen8-Architektur, die gegenüber dem Vorgänger Intel Gen7.5 (Haswell) in verschiedenen Punkten weiterentwickelt wurde. So hat Intel unter anderem die "Subslice" genannten Shader-Arrays umorganisiert, die bei diesem Modell nun jeweils 6 Execution Units (EUs) beinhalten. Zwei Subslices bilden wiederum einen Slice mit insgesamt 12 EUs. Hinzu kommen größere L1-Caches und Verbesserungen im Front-End, die die Leistung zusätzlich steigern sollen.
Die HD Graphics (Broadwell) repräsentiert die kleinste, auch "GT1" bezeichnete Ausbaustufe mit einem Slice und 12 EUs. Daneben existieren auch schnellere Varianten wie die GT2 (24 EUs) sowie die GT3/GT3e (48 EUs) ohne/mit zusätzlichem eDRAM-Cache.
Alle Broadwell-GPUs unterstützen OpenCL 2.0 sowie DirectX 12 (FL 11_1). Zudem kann der Videodecoder nun auch den H.265-Codec verarbeiten, greift dafür allerdings nur teilweise auf besonders sparsame Fixed-Function-Einheiten zurück. Die Bildausgabe erfolgt über DP 1.2/eDP 1.3 (max. 3.840 x 2.160 @ 60 Hz) oder HDMI 1.4a (max. 3.840 x 2.160 @ 24 Hz), HDMI 2.0 steht dagegen nicht zur Verfügung. Es können maximal drei Displays parallel angesteuert werden.
Performance
Obwohl der maximale GPU-Takt etwas niedriger ausfällt, dürfte die HD Graphics (Broadwell) die ältere HD Graphics (Haswell) klar übertrumpfen und etwa das Niveau der HD Graphics 4000 erreichen. Nur sehr wenige aktuelle Spiele wie das anspruchslose Dota 2 lassen sich in niedrigen Einstellungen flüssig darstellen.
Leistungsaufnahme
Die bislang vorgestellten Celeron- und Pentium-Prozessoren gehören ausschließlich der sparsamen 15-Watt-Klasse an, später dürften auch weitere Dual-Core-Modelle mit 37 Watt TDP folgen. Abhängig davon ist die HD Graphics (Broadwell) sowohl in kleinen Subnotebooks als auch deutlich größeren Geräten zu finden.
AMD Radeon R6 (Mullins)
► remove from comparison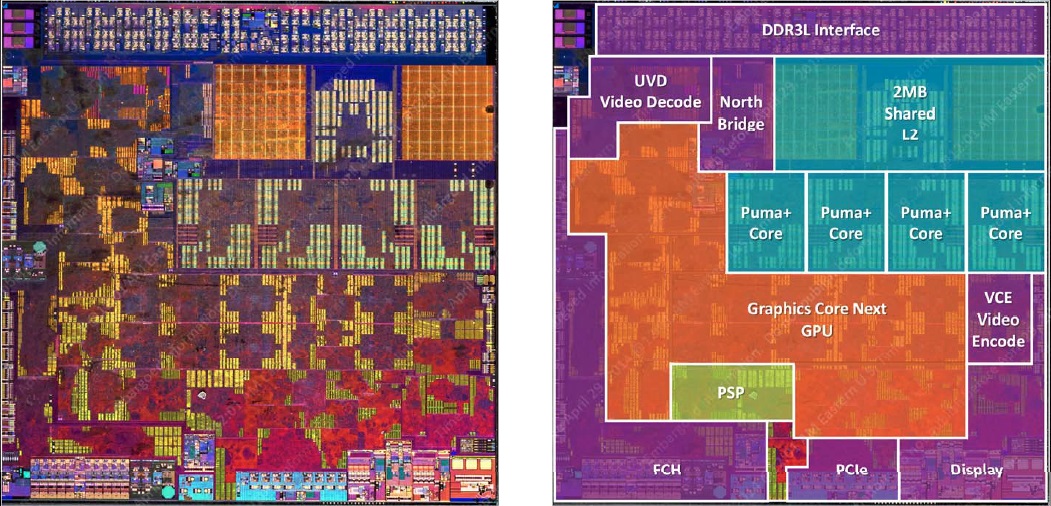
Die AMD Radeon R6 ist eine in einigen Mullins-APUs (A10 Micro-6700T) von AMD integrierte Grafikeinheit. Sie verfügt über 128 Shadereinheiten auf Basis der GCN-Architektur (zwei Compute Units), die mit bis zu 500 MHz takten und beherrscht DirectX 12 (FL 12_0). Die Grafikkarte besitzt keinen eigenen Speicher, sondern greift über den Controller der APU auf den Hauptspeicher zu (Single-Channel DDR3L-1333).
Per UVD (Unified Video Decoder) kann die Radeon R6 den Prozessor beim Decodieren von Videos unterstützen, zudem wurde ein spezialisierter Video-Encoder (VCE 2.0) integriert. Das Bildsignal kann per VGA, DVI, HDMI 1.4a und DisplayPort 1.2 an bis zu zwei externe Monitore ausgegeben werden.
Die Performance der Radeon R6 liegt gut 10 Prozent hinter einer Radeon HD 8330, da der maximale Turbo nicht immer vollständig ausgeschöpft werden kann. Damit entspricht die GPU knapp einer Radeon HD 8280 und siedelt sich im Low-End-Bereich an. In der Regel werden nur ältere oder sehr anspruchslose Spiele flüssig bewältigt (Stand 2014).
| Intel HD Graphics (Broadwell) | AMD Radeon R6 (Mullins) | |||||||||||||||||||||||||||||||||||||||||||||||||||||||||||||||||||||||||||||||||||||
| Radeon R Serie |
|
| ||||||||||||||||||||||||||||||||||||||||||||||||||||||||||||||||||||||||||||||||||||
| Codename | Broadwell GT1 | Mullins | ||||||||||||||||||||||||||||||||||||||||||||||||||||||||||||||||||||||||||||||||||||
| Architektur | Gen. 8 Broadwell | GCN 1.1 | ||||||||||||||||||||||||||||||||||||||||||||||||||||||||||||||||||||||||||||||||||||
| Pipelines | 12 - unified | 128 - unified | ||||||||||||||||||||||||||||||||||||||||||||||||||||||||||||||||||||||||||||||||||||
| Kerntakt | 100 - 850 (Boost) MHz | 500 MHz | ||||||||||||||||||||||||||||||||||||||||||||||||||||||||||||||||||||||||||||||||||||
| Speicherbandbreite | 64/128 Bit | 64 Bit | ||||||||||||||||||||||||||||||||||||||||||||||||||||||||||||||||||||||||||||||||||||
| Shared Memory | ja | ja | ||||||||||||||||||||||||||||||||||||||||||||||||||||||||||||||||||||||||||||||||||||
| API | DirectX 12 (FL 11_1), OpenGL 4.3 | DirectX 12 (FL 12_0), Shader 5.0 | ||||||||||||||||||||||||||||||||||||||||||||||||||||||||||||||||||||||||||||||||||||
| Herstellungsprozess | 14 nm | 28 nm | ||||||||||||||||||||||||||||||||||||||||||||||||||||||||||||||||||||||||||||||||||||
| Features | QuickSync | |||||||||||||||||||||||||||||||||||||||||||||||||||||||||||||||||||||||||||||||||||||
| Erscheinungsdatum | 05.01.2015 | 29.04.2014 |
|
| ||||||||||||||||||||||||||||||||
Benchmarks
3DM Vant. Perf. total + Intel HD Graphics (Broadwell)
Cinebench R15 OpenGL 64 Bit + Intel HD Graphics (Broadwell)
GFXBench T-Rex HD Offscreen C24Z16 + Intel HD Graphics (Broadwell)
Average Benchmarks Intel HD Graphics (Broadwell) → 100% n=5
Average Benchmarks AMD Radeon R6 (Mullins) → 70% n=5
* Smaller numbers mean a higher performance
1 This benchmark is not used for the average calculation
Spiele-Benchmarks
Die folgenden Benchmarks basieren auf unseren Spieletests mit Testnotebooks. Die Performance dieser Grafikkarte bei den gelisteten Spielen ist abhängig von der verwendeten CPU, Speicherausstattung, Treiber und auch Betriebssystem. Dadurch müssen die untenstehenden Werte nicht repräsentativ sein. Detaillierte Informationen über das verwendete System sehen Sie nach einem Klick auf den fps-Wert.


FIFA 16
2015
World of Warships
2015
Dirt Rally
2015
Battlefield Hardline
2015
F1 2014
2014
Sims 4
2014
GRID: Autosport
2014
Metro: Last Light
2013BioShock Infinite
2013
Tomb Raider
2013
Hitman: Absolution
2012Counter-Strike: GO
2012
Diablo III
2012Average Gaming Intel HD Graphics (Broadwell) → 100%
Average Gaming 30-70 fps → 100%
| Intel HD Graphics (Broadwell) | low | med. | high | ultra | QHD | 4K |
|---|---|---|---|---|---|---|
| Star Wars Battlefront | 15.3 | 8.5 | ||||
| FIFA 16 | 38.1 | 20.6 | ||||
| World of Warships | 29 | 20.8 | ||||
| Dirt Rally | 50 | 13.5 | ||||
| Battlefield Hardline | 23.9 | 16.4 | ||||
| Dragon Age: Inquisition | 13.9 | 9.4 | ||||
| F1 2014 | 34 | 24 | ||||
| Sims 4 | 113.6 | 26.3 | ||||
| GRID: Autosport | 57.6 | 22.6 | ||||
| Metro: Last Light | 13.7 | 10.7 | 7 | |||
| BioShock Infinite | 25.3 | 14.1 | 11.7 | |||
| Tomb Raider | 34.7 | 17.7 | 11.7 | |||
| Hitman: Absolution | 15.6 | 11.4 | 5.3 | |||
| Counter-Strike: GO | 43.7 | 31.5 | 23.9 | |||
| Diablo III | 38.4 | 24.9 | 19.7 | |||
| < 30 fps < 60 fps < 120 fps ≥ 120 fps | 7 7 1 | 13 1 | 7 | | | |
Eine Liste mit weiteren Spielen und allen Grafikkarten finden Sie auf unserer Seite: Welches Spiel ist mit welcher Grafikkarte spielbar?