Intel HD Graphics (Braswell) vs Intel HD Graphics 615 vs Intel HD Graphics 5300
Intel HD Graphics (Braswell) ► remove from comparison
Die Intel HD Graphics (Braswell) ist eine in den Low-End-SoCs der Braswell-Serie (z.B. Pentium N3700 ) integrierte Grafikeinheit. Sie basiert auf der gleichen Architektur wie die GPU verschiedener Broadwell-Prozessoren (z.B. HD Graphics 5300 ), bietet allerdings deutlich weniger Shadereinheiten und geringere Taktraten. Die genauen Spezifikationen hängen vom jeweiligen SoC ab: Die schnellste Variante mit 16 EUs und maximal 700 MHz schlägt die ältere HD Graphics (Bay Trail) um etwa Faktor zwei, andere Modelle mit lediglich 12 aktiven EUs schneiden etwas schlechter an. Zum Zeitpunkt der Vorstellung im ersten Quartal 2015 existieren folgende Varianten:
Anfangs wurde die GPU nur Intel HD Graphics benannt, später ab 2016 als Intel HD Graphics 400 (12 EU Version) und Intel HD Graphics 405 (16 EU Version) bezeichnet.
Anwender müssen sich deshalb insbesondere bei den Celeron-Modellen, die zusätzlich durch die Beschneidung auf nur zwei CPU-Kerne ausgebremst werden, auf ältere und anspruchslose Spiele beschränken. Videos werden dagegen auch in 4K/H.265 flüssig wiedergeben.
Intel HD Graphics 615 ► remove from comparison
Die Intel HD Graphics 615 (GT2) ist eine Prozessorgrafikkarte der im Sommer 2016 vorgestellten Kaby-Lake-Generation. Als Nachfolger der Intel HD Graphics 515 (Skylake) ist die HD 615 dabei in der besonders sparsamen Y-Serie mit 4,5 Watt TDP zu finden. Die sogenannte GT2-Ausbaustufe der Kaby-Lake-GPU verfügt über 24 Ausführungseinheiten (EUs) und taktet je nach Modell mit bis zu 1.050 MHz.
Mangels eigenem Grafikspeicher oder eDRAM-Cache greift die HD Graphics 615 über das Interface des Prozessors auf den System-RAM zu (2x 64 Bit DDR3L/LPDDR3).
Performance
Die exakte Leistung der HD Graphics 615 hängt stark vom jeweiligen CPU-Modell sowie dem konkreten Endgerät ab, da sich Maximaltaktrate sowie TDP-Konfiguration/Kühlung erheblich unterscheiden können. Zum anderen bestimmt auch der verwendete Speicher (DDR3L/LPDDR3) die Performance. Insgesamt dürfte die HD 615 etwa 20 bis 30 Prozent schneller als ihr Vorgänger HD Graphics 515 rechnen und im Optimalfall in etwa das Niveau der HD Graphics 520 erreichen. Einige Spiele des Jahres 2016 können so in niedrig(st)en Einstellungen flüssig dargestellt werden.
Anders als Skylake kann Kaby Lake nun auch H.265/HEVC im Main10-Profil mit 10 Bit Farbtiefe sowie Googles VP9-Codec in Hardware decodieren. Die ersten ausgelieferten Kaby-Lake CPUs unterstützen allerdings noch kein HDCP 2.2, was beispielsweise für die Ausgabe von Netflix-Videos in 4K benötigt wird. Dies wurde erst ab 2017 mit den neuen CPUs und ab April mit den alten CPUs (neue Kennung) ermöglicht. HDMI 2.0 unterstützt die HD Graphics 615 jedoch weiterhin nur per Wandler (LSPCon) über den DisplayPort.
Leistungsaufnahme
Die HD Graphics 615 ist in ULV-Prozessoren der 4,5-Watt-Klasse zu finden (TDP kann vom Gerätehersteller angepasst werden) und damit für passiv gekühlte Tablets und Ultrabooks geeignet.
Intel HD Graphics 5300 ► remove from comparison
Die Intel HD Graphics 5300 (GT2) ist eine Prozessorgrafikkarte in den Ende 2014 vorgestellten Core-M-CPUs Core M-5Y70 ). Zwar glänzt die GPU mit einer extrem niedrigen Leistungsaufnahme, allerdings siedelt sich die Performance nur im absoluten Low-End-Segment an und ist für neuere Spiele kaum ausreichend.
Architektur und Features
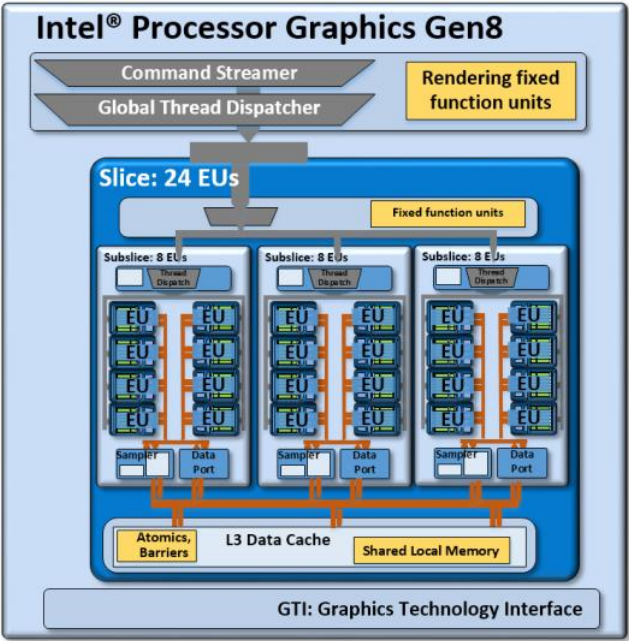
Broadwell integriert eine Grafikeinheit auf Basis der Intel-Gen8-Architektur, die gegenüber dem Vorgänger Intel Gen7.5 (Haswell) in verschiedenen Punkten weiterentwickelt wurde. So hat Intel unter anderem die "Subslice" genannten Shader-Arrays umorganisiert, die nun jeweils 8 Execution Units (EUs) beinhalten. Drei Subslices bilden wiederum einen Slice mit insgesamt 24 EUs. Hinzu kommen größere L1-Caches und Verbesserungen im Front-End, die die Leistung zusätzlich steigern sollen.
Die HD Graphics 5300 repräsentiert die mittlere, auch "GT2" bezeichnete Ausbaustufe mit einem Slice und 24 EUs. Daneben existieren auch eine teildeaktivierte GT1-Variante (12 EUs) sowie die GT3/GT3e (48 EUs) ohne/mit zusätzlichem eDRAM-Cache.
Alle Broadwell-GPUs unterstützen OpenCL 2.0 sowie DirectX 12 (FL 11_1) . Zudem kann der Videodecoder nun auch den H.265-Codec verarbeiten, greift dafür allerdings nur teilweise auf besonders sparsame Fixed-Function-Einheiten zurück. Die Bildausgabe erfolgt über DP 1.2/eDP 1.3 (max. 3.840 x 2.160 @ 60 Hz) oder HDMI 1.4a (max. 3.840 x 2.160 @ 24 Hz), HDMI 2.0 steht dagegen nicht zur Verfügung. Es können maximal drei Displays parallel angesteuert werden.
Performance
Je nach Modell liegt der maximale GPU-Takt zwischen 800 und 900 MHz, der durch die niedrige TDP jedoch nicht dauerhaft gehalten wird. In längeren Benchmarks ist die HD 5300 darum kaum schneller als die ältere HD 4000 oder HD 4200 , die bei gleicher Performance aber deutlich mehr Energie benötigen. Die TDP des Core M kann optional leicht abgesenkt oder angehoben werden, was spürbare Auswirkungen auf die Leistungsfähigkeit hat.
Insgesamt werden nur wenige Spiele aus 2014 (oder neuer) in niedrigen Einstellungen flüssig dargestellt, sodass man sich auf ältere und weniger anspruchsvolle Titel beschränken muss.
Leistungsaufnahme
Die TDP des gesamten Chips liegt standardmäßig bei zumeist 4,5 Watt, sodass viele Ultrabooks oder 2-in-1-Geräte mit einer rein passiven Kühlung auskommen. Teils kann die TDP auch auf niedrigere (3,5 Watt) oder höhere Werte (6 Watt) angepasst werden.
Intel HD Graphics (Braswell) Intel HD Graphics 615 Intel HD Graphics 5300 HD Graphics Serie Codename Braswell Kaby-Lake GT2 Broadwell GT2 Architektur Gen. 8 Gen. 9 Kaby Lake Gen. 8 Broadwell Pipelines 16 - unified 24 - unified 24 - unified Kerntakt 320 - 700 (Boost) MHz 300 - 1050 (Boost) MHz 100 - 900 (Boost) MHz Speicherbandbreite 64/128 Bit 64/128 Bit 64/128 Bit Shared Memory ja ja ja API DirectX 11.2, Shader 5.0 DirectX 12_1, OpenGL 4.4 DirectX 12 (FL 11_1), OpenGL 4.3 Herstellungsprozess 14 nm 14 nm 14 nm Erscheinungsdatum 01.04.2015 30.08.2016 05.09.2014 Speichertyp DDR3L/LPDDR3 Features QuickSync QuickSync Transistors 1.3 Billion
CPU in HD Graphics (Braswell) GPU Base Speed GPU Boost / Turbo Intel Pentium N3700 4 x 1600 MHz, 6 W 400 MHz 700 MHz Intel Celeron N3160 4 x 1600 MHz, 6 W 320 MHz 640 MHz Intel Celeron N3150 4 x 1600 MHz, 6 W 320 MHz 640 MHz » show 2 more Intel Celeron N3050 2 x 1600 MHz, 6 W 320 MHz 600 MHz Intel Celeron N3000 2 x 1040 MHz, 4 W 320 MHz 600 MHz min. - max. 320 - 400 MHz 600 - 700 MHz
CPU in HD Graphics 615 GPU Base Speed GPU Boost / Turbo Intel Core i7-7Y75 2 x 1300 MHz, 4.5 W 300 MHz 1050 MHz Intel Core i5-7Y57 2 x 1200 MHz, 4.5 W 300 MHz 950 MHz Intel Core i5-7Y54 2 x 1200 MHz, 4.5 W 300 MHz 950 MHz » show 5 more Intel Core m3-7Y32 2 x 1000 MHz, 4.5 W 300 MHz 900 MHz Intel Core m3-7Y30 2 x 1000 MHz, 4.5 W 300 MHz 900 MHz Intel Pentium Gold 4415Y 2 x 1600 MHz, 6 W 300 MHz 850 MHz Intel Pentium Gold 4410Y 2 x 1500 MHz, 6 W 300 MHz 850 MHz Intel Celeron 3965Y 2 x 1500 MHz, 6 W 300 MHz 850 MHz min. - max. 300 - 400 MHz 600 - 1050 MHz
CPU in HD Graphics 5300 GPU Base Speed GPU Boost / Turbo Intel Core M-5Y71 2 x 1200 MHz, 4.5 W 300 MHz 900 MHz Intel Core M-5Y51 2 x 1100 MHz, 4.5 W 300 MHz 900 MHz Intel Core M-5Y70 2 x 1100 MHz, 4.5 W 100 MHz 850 MHz » show 4 more Intel Core M-5Y31 2 x 900 MHz, 4.5 W 300 MHz 850 MHz Intel Core M-5Y10c 2 x 800 MHz, 4.5 W 300 MHz 800 MHz Intel Core M-5Y10a 2 x 800 MHz, 4.5 W 100 MHz 800 MHz Intel Core M-5Y10 2 x 800 MHz, 4.5 W 100 MHz 800 MHz min. - max. 100 - 400 MHz 600 - 1050 MHz
Benchmarks Performance Rating - 3DMark 11 + Fire Strike + Time Spy - HD Graphics (Braswell)
0.1 pt (0%)
Intel HD Graphics (Braswell)
...
max:
Performance Rating - 3DMark 11 + Fire Strike + Time Spy - HD Graphics 615
0.4 pt (1%)
...
...
max:
Performance Rating - 3DMark 11 + Fire Strike + Time Spy - HD Graphics 5300
0.2 pt (1%)
...
...
max:
3DMark - 3DMark Time Spy Score
min: 180 avg: 277.2 median: 296.5 (1%) max: 327 Points
3DMark - 3DMark Time Spy Graphics
min: 157 avg: 243.7 median: 261 (1%) max: 288 Points
3DMark - 3DMark Ice Storm Unlimited Graphics
min: 55271 avg: 69892 median: 70743 (7%) max: 79719 Points
min: 39138 avg: 55907 median: 59555 (6%) max: 65380 Points
3DMark - 3DMark Ice Storm Extreme Graphics
min: 28302 avg: 34366 median: 33200.5 (4%) max: 42163 Points
min: 19630 avg: 24597 median: 24597 (3%) max: 29564 Points
3DMark - 3DMark Cloud Gate Score
min: 1327 avg: 1595 median: 1529 (2%) max: 2134 Points
min: 4050 avg: 4904 median: 4893 (5%) max: 5828 Points
min: 1361 avg: 3085 median: 3041 (3%) max: 4274 Points
3DMark - 3DMark Cloud Gate Graphics
min: 1950 avg: 2187 median: 2193 (1%) max: 2457 Points
min: 5478 avg: 6502 median: 6387 (2%) max: 7839 Points
min: 2895 avg: 3862 median: 3720 (1%) max: 5512 Points
3DMark - 3DMark Fire Strike Standard Score
min: 204 avg: 235.2 median: 238 (0%) max: 256 Points
min: 582 avg: 750 median: 762 (1%) max: 861 Points
min: 327 avg: 413.8 median: 407 (1%) max: 620 Points
3DMark - 3DMark Fire Strike Standard Graphics
min: 218 avg: 256.5 median: 261 (0%) max: 299 Points
min: 647 avg: 830 median: 853 (1%) max: 965 Points
min: 352 avg: 453.8 median: 439 (0%) max: 671 Points
3DMark - 3DMark Ice Storm Graphics
min: 20067 avg: 24121 median: 24638 (3%) max: 26079 Points
min: 45589 avg: 54672 median: 50760 (6%) max: 69035 Points
min: 27164 avg: 35716 median: 34405 (4%) max: 48901 Points
3DMark - 3DMark Sling Shot (ES 3.0)
3735 Points (33%)
3DMark - 3DMark Sling Shot (ES 3.0) Graphics
4380 Points (26%)
3DMark - 3DMark Night Raid
2461 Points (2%)
3DMark - 3DMark Night Raid Graphics Score
2800 Points (1%)
3DMark 11 - 3DM11 Performance Score
min: 310 avg: 434.8 median: 436 (1%) max: 518 Points
min: 1141 avg: 1350 median: 1362.5 (2%) max: 1514 Points
min: 498 avg: 721 median: 731 (1%) max: 973 Points
3DMark 11 - 3DM11 Performance GPU
min: 275 avg: 389.9 median: 395 (0%) max: 468 Points
min: 1032 avg: 1233 median: 1242.5 (1%) max: 1384 Points
min: 458 avg: 648 median: 647 (1%) max: 885 Points
3DMark Vantage + Intel HD Graphics (Braswell) 3DMark Vantage - 3DM Vant. Perf. total
1479 Points (0%)
3DM Vant. Perf. total + Intel HD Graphics 615
min: 4081 avg: 4102 median: 4102 (1%) max: 4123 Points
3DM Vant. Perf. total + Intel HD Graphics 5300
min: 2966 avg: 3104 median: 3104 (1%) max: 3242 Points
3DM Vant. Perf. GPU no PhysX + Intel HD Graphics (Braswell) 3DMark Vantage - 3DM Vant. Perf. GPU no PhysX
1328 Points (1%)
3DM Vant. Perf. GPU no PhysX + Intel HD Graphics 615
min: 3514 avg: 3538 median: 3537.5 (2%) max: 3561 Points
3DM Vant. Perf. GPU no PhysX + Intel HD Graphics 5300
min: 2538 avg: 2914 median: 2913.5 (2%) max: 3289 Points
3DMark 2001SE - 3DMark 2001 - Standard
19381 Points (20%)
3DMark 03 - 3DMark 03 - Standard
16620 Points (9%)
3DMark 05 - 3DMark 05 - Standard
8649 Points (9%)
3DMark 06 3DMark 06 - Standard 1280x1024 + Intel HD Graphics (Braswell)
1311 Points (2%)
3DMark 06 - Standard 1280x1024 + Intel HD Graphics 615
min: 6299 avg: 7294 median: 7399 (10%) max: 7991 Points
3DMark 06 - Standard 1280x1024 + Intel HD Graphics 5300
min: 3951 avg: 5044 median: 4775 (6%) max: 6754 Points
3DMark 06 - Standard 1280x768 + Intel HD Graphics 615
6524 Points (9%)
Unigine Heaven 3.0 - Unigine Heaven 3.0 DX 11
7.6 fps (3%)
Unigine Heaven 2.1 - Heaven 2.1 high
min: 3.2 avg: 4.9 median: 4.9 (1%) max: 6.6 fps
17.4 fps (3%)
SPECviewperf 12 + Intel HD Graphics 5300 SPECviewperf 12 - specvp12 sw-03
min: 0.97 avg: 4.7 median: 4.7 (1%) max: 8.44 fps
specvp12 snx-02 + Intel HD Graphics 5300 SPECviewperf 12 - specvp12 snx-02
min: 1.07 avg: 1.2 median: 1.2 (0%) max: 1.28 fps
specvp12 showcase-01 + Intel HD Graphics 5300 SPECviewperf 12 - specvp12 showcase-01
min: 2.69 avg: 4.7 median: 4.7 (1%) max: 6.69 fps
specvp12 mediacal-01 + Intel HD Graphics 5300 SPECviewperf 12 - specvp12 mediacal-01
min: 0.58 avg: 0.8 median: 0.8 (0%) max: 1.1 fps
specvp12 maya-04 + Intel HD Graphics 5300 SPECviewperf 12 - specvp12 maya-04
min: 2.13 avg: 4 median: 4 (1%) max: 5.79 fps
specvp12 energy-01 + Intel HD Graphics 5300 SPECviewperf 12 - specvp12 energy-01
min: 0.04 avg: 4.5 median: 4.5 (4%) max: 9 fps
specvp12 creo-01 + Intel HD Graphics 5300 SPECviewperf 12 - specvp12 creo-01
min: 0.91 avg: 2.8 median: 2.8 (1%) max: 4.73 fps
specvp12 catia-04 + Intel HD Graphics 5300 SPECviewperf 12 - specvp12 catia-04
5.5 fps (1%)
Cinebench R10 Cinebench R10 Shading (32bit) + Intel HD Graphics (Braswell) Cinebench R10 - Cinebench R10 Shading (32bit)
min: 1788 avg: 2276 median: 2284 (2%) max: 2747 Points
Cinebench R10 Shading (32bit) + Intel HD Graphics 615
min: 5363 avg: 6543 median: 6470 (5%) max: 7323 Points
Cinebench R10 Shading (32bit) + Intel HD Graphics 5300
min: 2978 avg: 4412 median: 4018 (3%) max: 6679 Points
Cinebench R11.5 Cinebench R11.5 OpenGL 64 Bit + Intel HD Graphics (Braswell) Cinebench R11.5 - Cinebench R11.5 OpenGL 64 Bit
min: 6.89 avg: 9.1 median: 9.5 (3%) max: 9.86 fps
Cinebench R11.5 OpenGL 64 Bit + Intel HD Graphics 615
min: 23.45 avg: 28.6 median: 27.8 (9%) max: 32.97 fps
Cinebench R11.5 OpenGL 64 Bit + Intel HD Graphics 5300
min: 11.6 avg: 16.4 median: 15.9 (5%) max: 23.2 fps
Cinebench R15 + Intel HD Graphics (Braswell) Cinebench R15 - Cinebench R15 OpenGL 64 Bit
min: 11.13 avg: 12.4 median: 12.3 (1%) max: 13.82 fps
Cinebench R15 OpenGL 64 Bit + Intel HD Graphics 615
min: 24.79 avg: 33.1 median: 35 (2%) max: 37.62 fps
Cinebench R15 OpenGL 64 Bit + Intel HD Graphics 5300
min: 16.04 avg: 19 median: 18.4 (1%) max: 23.64 fps
Cinebench R15 OpenGL Ref. Match 64 Bit + Intel HD Graphics (Braswell) Cinebench R15 - Cinebench R15 OpenGL Ref. Match 64 Bit
98 % (98%)
Cinebench R15 OpenGL Ref. Match 64 Bit + Intel HD Graphics 615
min: 97.7 avg: 97.9 median: 97.8 (98%) max: 99.3 %
Cinebench R15 OpenGL Ref. Match 64 Bit + Intel HD Graphics 5300
min: 98 avg: 98.1 median: 98 (98%) max: 99.3 %
GFXBench 3.1 - GFXBench Manhattan ES 3.1 Offscreen
12.5 fps (0%)
42.7 fps (1%)
GFXBench 3.0 - GFXBench 3.0 Manhattan Offscreen
16.1 fps (1%)
min: 26.7 avg: 30.3 median: 30.1 (2%) max: 34.1 fps
GFXBench (DX / GLBenchmark) 2.7 + Intel HD Graphics (Braswell) GFXBench (DX / GLBenchmark) 2.7 - GFXBench T-Rex HD Offscreen C24Z16
33 fps (0%)
GFXBench T-Rex HD Offscreen C24Z16 + Intel HD Graphics 615
76.3 fps (1%)
GFXBench T-Rex HD Offscreen C24Z16 + Intel HD Graphics 5300
min: 39.4 avg: 54.4 median: 55 (0%) max: 66.2 fps
Basemark ES 2.0 - Basemark ES 2.0
59.8 fps (99%)
Basemark X 1.1 - Basemark X 1.1 High Quality
33662 Points (76%)
Basemark X 1.1 - Basemark X 1.1 Medium Quality
42892 Points (95%)
Basemark GPU 1.2 - Basemark GPU 1.2 Vulkan Official Medium Offscreen 1080
38.3 fps (0%)
Basemark GPU 1.2 - Basemark GPU 1.2 Vulkan Official High Offscreen 2160
3.4 fps (1%)
LuxMark v2.0 64Bit - LuxMark v2.0 Room GPU
min: 54 avg: 54.5 median: 54.5 (0%) max: 55 Samples/s
min: 145 avg: 181 median: 185 (1%) max: 213 Samples/s
min: 93 avg: 116.7 median: 112 (1%) max: 145 Samples/s
LuxMark v2.0 64Bit - LuxMark v2.0 Sala GPU
min: 76 avg: 80.5 median: 80.5 (0%) max: 85 Samples/s
min: 281 avg: 365.3 median: 369 (1%) max: 446 Samples/s
min: 180 avg: 228.7 median: 210 (0%) max: 296 Samples/s
ComputeMark v2.1 - ComputeMark v2.1 Result
306 Points (0%)
min: 447 avg: 654 median: 693 (1%) max: 783 Points
min: 460 avg: 519 median: 518.5 (1%) max: 577 Points
PassMark PerformanceTest Mobile V1 - PerformanceTest Mobile V1 2D Graphics Tests
18536 Points (6%)
PassMark PerformanceTest Mobile V1 - PerformanceTest Mobile V1 3D Graphics Tests
2667 Points (4%)
Power Consumption - Furmark Stress Test Power Consumption - external Monitor *
17.8 Watt (3%)
Clock Speed - GPU Clock Speed Furmark
630 MHz (25%)
Average Benchmarks Intel HD Graphics (Braswell) → 100% n=18 Average Benchmarks Intel HD Graphics 615 → 301% n=18 Average Benchmarks Intel HD Graphics 5300 → 187% n=18
- Bereich der Benchmarkergebnisse für diese Grafikkarte
- Durchschnittliche Benchmarkergebnisse für diese Grafikkarte
* Smaller numbers mean a higher performance
1 This benchmark is not used for the average calculation
Spiele-Benchmarks Die folgenden Benchmarks basieren auf unseren Spieletests mit Testnotebooks. Die Performance dieser Grafikkarte bei den gelisteten Spielen ist abhängig von der verwendeten CPU, Speicherausstattung, Treiber und auch Betriebssystem. Dadurch müssen die untenstehenden Werte nicht repräsentativ sein. Detaillierte Informationen über das verwendete System sehen Sie nach einem Klick auf den fps-Wert.
HD Graphics 615:
12.4 [X] Eve-Tech Eve V i7 Intel Core i7-7Y75 1.3GHz
HD Graphics 615
min:
1.279 fps, P0.1:
1.412 fps, P1:
4.02 fps, max:
38.7 fps
fps
HD Graphics 615:
34.2 [X] Eve-Tech Eve V i7 Intel Core i7-7Y75 1.3GHz
HD Graphics 615
min:
3.05 fps, P0.1:
13.5 fps, P1:
20.4 fps, max:
121 fps
fps
HD Graphics 615:
15.8 [X] Eve-Tech Eve V i7 Intel Core i7-7Y75 1.3GHz
HD Graphics 615
min:
8.65 fps, P0.1:
8.9 fps, P1:
10.7 fps, max:
34.6 fps
fps
HD Graphics 615:
0 (!) [X] Eve-Tech Eve V i7 Intel Core i7-7Y75 1.3GHz
HD Graphics 615
fps
HD Graphics 615:
0 (!) [X] Eve-Tech Eve V i7 Intel Core i7-7Y75 1.3GHz
HD Graphics 615
fps
HD Graphics 615:
18.2 [X] Eve-Tech Eve V i7 1.47.22.14 D3D12
Intel Core i7-7Y75 1.3GHz
HD Graphics 615
min:
5 fps, P1:
7.54 fps, max:
165 fps
fps
HD Graphics 615:
8 [X] Eve-Tech Eve V i7 1.47.22.14 D3D12
Intel Core i7-7Y75 1.3GHz
HD Graphics 615
min:
5 fps, P1:
5 fps, max:
116 fps
fps
HD Graphics 615:
8.8 [X] Eve-Tech Eve V i7 1.47.22.14 D3D12
Intel Core i7-7Y75 1.3GHz
HD Graphics 615
min:
5 fps, P1:
5 fps, max:
126 fps
fps
HD Graphics 615:
12.1 [X] Eve-Tech Eve V i7 1.47.22.14 D3D12
Intel Core i7-7Y75 1.3GHz
HD Graphics 615
min:
5 fps, P1:
5 fps, max:
108 fps
fps
HD Graphics 615:
36.8 (!) [X] Acer Spin 7 SP714-51-M09D Intel Core i5-7Y54 1.2GHz
HD Graphics 615
fps
HD Graphics 5300:
12.2 fps
HD Graphics 5300:
10.8 fps
HD Graphics 5300:
13.2 fps
HD Graphics 5300:
13.8 fps
HD Graphics 5300:
10.6 fps
HD Graphics 5300:
26.3 fps
HD Graphics 5300:
15.3 fps
100%
HD Graphics (Braswell):
16.8 fps
297%
HD Graphics 615:
49.9 fps
155%
HD Graphics 5300:
26 fps
100%
HD Graphics (Braswell):
11.9 fps
254%
HD Graphics 615:
30.2 fps
149%
HD Graphics 5300:
17.7 fps
100%
HD Graphics (Braswell):
13.7 fps
171%
HD Graphics 615:
23.4 fps
150%
HD Graphics 5300:
20.6 fps
100%
HD Graphics (Braswell):
9.5 fps
219%
HD Graphics 615:
20.8 fps
131%
HD Graphics 5300:
12.4 fps
100%
HD Graphics (Braswell):
27.2 fps
263%
HD Graphics 615:
71.6 fps
151%
HD Graphics 5300:
41 fps
100%
HD Graphics (Braswell):
7.1 fps
229%
HD Graphics 615:
16.3 fps
176%
HD Graphics 5300:
12.5 fps
HD Graphics 615:
19.9 24.2 [X] Eve-Tech Eve V i7 Intel Core i7-7Y75 1.3GHz
HD Graphics 615
min:
0.569 fps, P1:
8.13 fps, max:
41.3 fps
~ 22 fps
HD Graphics 615:
6.1 [X] Eve-Tech Eve V i7 Intel Core i7-7Y75 1.3GHz
HD Graphics 615
min:
1.81 fps, P1:
4.13 fps, max:
23.5 fps
fps
100%
HD Graphics (Braswell):
13.2 fps
149%
HD Graphics 615:
19.7 fps
116%
HD Graphics 5300:
15.3 fps
100%
HD Graphics (Braswell):
8.7 fps
178%
HD Graphics 615:
15.5 fps
126%
HD Graphics 5300:
11 fps
100%
HD Graphics (Braswell):
5.4 fps
130%
HD Graphics 5300:
7 fps
100%
HD Graphics (Braswell):
3.9 fps
131%
HD Graphics 5300:
5.1 fps
100%
HD Graphics (Braswell):
8.2 fps
215%
HD Graphics 615:
17.6 fps
134%
HD Graphics 5300:
11 11.9 ~ 11 fps
100%
HD Graphics (Braswell):
6.1 fps
200%
HD Graphics 615:
12.2 fps
131%
HD Graphics 5300:
7.6 8.2 ~ 8 fps
HD Graphics 5300:
3 3.1 ~ 3 fps
100%
HD Graphics (Braswell):
6.1 fps
151%
HD Graphics 5300:
9.2 fps
100%
HD Graphics (Braswell):
4.3 fps
158%
HD Graphics 5300:
6.8 fps
100%
HD Graphics (Braswell):
6 fps
353%
HD Graphics 5300:
21.2 fps
100%
HD Graphics (Braswell):
3.2 fps
275%
HD Graphics 5300:
8.8 fps
100%
HD Graphics (Braswell):
13 13 ~ 13 fps
423%
HD Graphics 615:
55 fps
269%
HD Graphics 5300:
33 34 39 ~ 35 fps
100%
HD Graphics (Braswell):
12 12.5 ~ 12 fps
283%
HD Graphics 615:
34 fps
183%
HD Graphics 5300:
20 20 25 ~ 22 fps
HD Graphics 5300:
12 13 14 ~ 13 fps
100%
HD Graphics (Braswell):
13.7 fps
192%
HD Graphics 615:
26.3 fps
100%
HD Graphics (Braswell):
8.8 fps
216%
HD Graphics 615:
19 fps
100%
HD Graphics (Braswell):
64 fps
142%
HD Graphics 5300:
91 fps
100%
HD Graphics (Braswell):
18.7 fps
492%
HD Graphics 615:
90 94.2 ~ 92 fps
94%
HD Graphics 5300:
17.6 fps
100%
HD Graphics (Braswell):
7.9 fps
219%
HD Graphics 5300:
17.3 fps
100%
HD Graphics (Braswell):
5.6 fps
209%
HD Graphics 5300:
11.7 fps
100%
HD Graphics (Braswell):
23 fps
326%
HD Graphics 615:
74.9 fps
100%
HD Graphics (Braswell):
12.5 fps
197%
HD Graphics 615:
24.6 fps
HD Graphics 5300:
12.5 fps
HD Graphics 5300:
18.3 fps
HD Graphics 5300:
11.1 fps
HD Graphics 5300:
8.3 [X] HP Elitebook Folio 1020 G1 H9V72EA Intel Core M-5Y51 1.1GHz
HD Graphics 5300
9.3 9.5 10.8 ~ 9 fps
HD Graphics 5300:
5.1 5.3 5.5 [X] HP Elitebook Folio 1020 G1 H9V72EA Intel Core M-5Y51 1.1GHz
HD Graphics 5300
6.9 ~ 6 fps
HD Graphics 5300:
4.3 4.3 4.4 4.6 [X] HP Elitebook Folio 1020 G1 H9V72EA Intel Core M-5Y51 1.1GHz
HD Graphics 5300
~ 4 fps
HD Graphics 5300:
2 [X] HP Elitebook Folio 1020 G1 H9V72EA Intel Core M-5Y51 1.1GHz
HD Graphics 5300
2.2 ~ 2 fps
HD Graphics 5300:
26.7 fps
HD Graphics 5300:
10.7 fps
HD Graphics 5300:
15.2 fps
HD Graphics 5300:
11.6 fps
HD Graphics 5300:
91.4 fps
HD Graphics 5300:
48.8 fps
HD Graphics 5300:
45.2 fps
HD Graphics 5300:
21.6 fps
HD Graphics 5300:
24.9 fps
HD Graphics 5300:
17.4 fps
100%
HD Graphics (Braswell):
3.8 fps
100%
HD Graphics (Braswell):
2.1 fps
HD Graphics 5300:
18.2 fps
HD Graphics 5300:
11.7 fps
HD Graphics 5300:
33.1 48 50.9 51.2 [X] HP Elitebook Folio 1020 G1 H9V72EA Intel Core M-5Y51 1.1GHz
HD Graphics 5300
53.6 ~ 47 fps
HD Graphics 5300:
21.4 23.2 26.7 28.6 29.7 [X] HP Elitebook Folio 1020 G1 H9V72EA Intel Core M-5Y51 1.1GHz
HD Graphics 5300
~ 26 fps
HD Graphics 5300:
9.8 12.2 14.9 15.4 [X] HP Elitebook Folio 1020 G1 H9V72EA Intel Core M-5Y51 1.1GHz
HD Graphics 5300
~ 13 fps
100%
HD Graphics (Braswell):
19.2 fps
214%
HD Graphics 5300:
41 fps
100%
HD Graphics (Braswell):
12.6 fps
169%
HD Graphics 5300:
21.3 fps
100%
HD Graphics (Braswell):
12.5 fps
120%
HD Graphics 5300:
15 fps
HD Graphics 5300:
13.3 fps
HD Graphics 5300:
10.1 fps
HD Graphics 5300:
18 20.5 ~ 19 fps
HD Graphics 5300:
12.4 fps
213%
HD Graphics 615:
16 18.4 ~ 17 fps
100%
HD Graphics (Braswell):
9.3 fps
226%
HD Graphics 615:
21 fps
134%
HD Graphics 5300:
12.5 fps
100%
HD Graphics (Braswell):
5.7 fps
223%
HD Graphics 615:
12.7 fps
132%
HD Graphics 5300:
7.5 fps
100%
HD Graphics (Braswell):
2.1 fps
200%
HD Graphics 5300:
4.2 fps
100%
HD Graphics (Braswell):
28.6 fps
126%
HD Graphics 5300:
35.9 fps
100%
HD Graphics (Braswell):
13 fps
141%
HD Graphics 5300:
18.3 fps
100%
HD Graphics (Braswell):
9.9 fps
140%
HD Graphics 5300:
13.9 fps
HD Graphics 5300:
19.4 fps
HD Graphics 5300:
12.6 fps
HD Graphics 5300:
11.8 fps
100%
HD Graphics (Braswell):
15 fps
100%
HD Graphics (Braswell):
12 fps
100%
HD Graphics (Braswell):
11.3 fps
HD Graphics 5300:
20.2 fps
HD Graphics 5300:
11.3 fps
HD Graphics 5300:
46.6 fps
HD Graphics 5300:
12.9 fps
100%
HD Graphics (Braswell):
12.2 fps
819%
HD Graphics 615:
99.9 fps
516%
HD Graphics 5300:
53.5 62 73 ~ 63 fps
100%
HD Graphics (Braswell):
11.5 fps
498%
HD Graphics 615:
57.3 fps
100%
HD Graphics (Braswell):
10.4 fps
380%
HD Graphics 615:
39.5 fps
HD Graphics 5300:
14.1 17 ~ 16 fps
HD Graphics 5300:
7.1 7.2 ~ 7 fps
100%
HD Graphics (Braswell):
25.5 fps
219%
HD Graphics 615:
55.8 fps
100%
HD Graphics (Braswell):
16.7 fps
217%
HD Graphics 615:
36.3 fps
100%
HD Graphics (Braswell):
13.2 fps
228%
HD Graphics 615:
30.1 fps
152%
HD Graphics 5300:
12 18 28.9 ~ 20 fps
HD Graphics 5300:
10.6 20 ~ 15 fps
HD Graphics 5300:
11.2 fps
100%
HD Graphics (Braswell):
28 30 ~ 29 fps
148%
HD Graphics 5300:
40.5 45 ~ 43 fps
100%
HD Graphics (Braswell):
12.7 13.1 ~ 13 fps
100%
HD Graphics (Braswell):
8.1 fps
100%
HD Graphics (Braswell):
16.5 fps
213%
HD Graphics 615:
35.1 fps
118%
HD Graphics 5300:
19.5 fps
100%
HD Graphics (Braswell):
8.2 fps
220%
HD Graphics 615:
18 fps
112%
HD Graphics 5300:
9.2 fps
100%
HD Graphics (Braswell):
5 fps
158%
HD Graphics 615:
7.9 fps
116%
HD Graphics 5300:
5.8 fps
HD Graphics 5300:
16.3 fps
HD Graphics 5300:
12.7 fps
100%
HD Graphics (Braswell):
28 fps
146%
HD Graphics 5300:
40.9 fps
100%
HD Graphics (Braswell):
13.9 fps
155%
HD Graphics 5300:
21.5 fps
HD Graphics 5300:
57.4 fps
HD Graphics 5300:
26.5 fps
HD Graphics 5300:
16.7 fps
HD Graphics 5300:
18.9 [X] HP Elitebook Folio 1020 G1 H9V72EA Intel Core M-5Y51 1.1GHz
HD Graphics 5300
fps
HD Graphics 5300:
15.4 [X] HP Elitebook Folio 1020 G1 H9V72EA Intel Core M-5Y51 1.1GHz
HD Graphics 5300
fps
HD Graphics 5300:
13.4 [X] HP Elitebook Folio 1020 G1 H9V72EA Intel Core M-5Y51 1.1GHz
HD Graphics 5300
fps
HD Graphics 5300:
8.8 [X] HP Elitebook Folio 1020 G1 H9V72EA Intel Core M-5Y51 1.1GHz
HD Graphics 5300
fps
100%
HD Graphics (Braswell):
6.7 fps
494%
HD Graphics 5300:
33.1 fps
100%
HD Graphics (Braswell):
4.2 fps
595%
HD Graphics 5300:
25 fps
100%
HD Graphics (Braswell):
2.1 fps
762%
HD Graphics 5300:
16 fps
HD Graphics 5300:
20.3 60 ~ 40 fps
HD Graphics 5300:
48.1 fps
HD Graphics 5300:
21.4 fps
HD Graphics 5300:
10.3 fps
194%
HD Graphics 5300:
188 fps
227%
HD Graphics 5300:
52.3 fps
HD Graphics 5300:
21.8 fps
HD Graphics 5300:
39 43.6 ~ 41 fps
HD Graphics 5300:
12.6 31 ~ 22 fps
Average Gaming Intel HD Graphics (Braswell) → 100% Average Gaming 30-70 fps → 100%
Average Gaming Intel HD Graphics 615 → 266% Average Gaming 30-70 fps → 291%
Average Gaming Intel HD Graphics 5300 → 195% Average Gaming 30-70 fps → 246%
v1.28
log 21. 17:26:56
#0 ran 0s before starting gpusingle class +0s ... 0s
#1 checking url part for id 6273 +0s ... 0s
#2 checking url part for id 7441 +0s ... 0s
#3 checking url part for id 5939 +0s ... 0s
#4 redirected to Ajax server, took 1726932416s time from redirect:0 +0s ... 0s
#5 did not recreate cache, as it is less than 5 days old! Created at Thu, 19 Sep 2024 05:16:33 +0200 +0s ... 0s
#6 composed specs +0.007s ... 0.007s
#7 did output specs +0s ... 0.007s
#8 start showIntegratedCPUs +0s ... 0.007s
#9 getting avg benchmarks for device 6273 +0.031s ... 0.038s
#10 got single benchmarks 6273 +0.025s ... 0.063s
#11 getting avg benchmarks for device 7441 +0.005s ... 0.067s
#12 got single benchmarks 7441 +0.018s ... 0.085s
#13 getting avg benchmarks for device 5939 +0.004s ... 0.089s
#14 got single benchmarks 5939 +0.009s ... 0.098s
#15 got avg benchmarks for devices +0s ... 0.098s
#16 min, max, avg, median took s +0.042s ... 0.14s
#17 before gaming benchmark output +0s ... 0.14s
#18 Got 894 rows for game benchmarks. +0.043s ... 0.182s
#19 composed SQL query for gamebenchmarks +0s ... 0.182s
#20 got data and put it in $dataArray +0.005s ... 0.188s
#21 benchmarks composed for output. +0.035s ... 0.223s
#22 calculated avg scores. +0s ... 0.223s
#23 return log +0.001s ... 0.224s
Teilen Sie diesen Artikel, um uns zu unterstützen. Jeder Link hilft!
Autor: Klaus Hinum, 8.09.2017 (Update: 1.07.2023)
 Deutsch
 English
 Español
 Français
 Italiano
 Nederlands
 Polski
 Português
 Русский
 Türkçe
 Svenska
 Chinese
 Magyar