Notebookcheck Logo

Intel HD Graphics (Bay Trail) vs AMD Radeon R4 (Beema) vs Intel HD Graphics (Cherry Trail)

Intel HD Graphics (Bay Trail)

► remove from comparison Intel HD Graphics (Bay Trail)

Die Intel HD Graphics (Bay Trail) ist eine in den Tablet- (z.B. Z3770), Nettop- (z.B. J2850) und Notebook-SoCs (z.B. N3510) der Bay-Trail-Serie integrierte Grafikeinheit. Sie ist in verschiedenen Atom-, Celeron- und Pentium-Modellen zu finden und basiert auf der DirectX-11-tauglichen GPU der Ivy-Bridge-Generation. Taktrate und Einheitenzahl fallen allerdings deutlich niedriger aus, sodass sich die Performance nur im Low-End-Segment ansiedelt.

Im Vergleich zu Ivy Bridge, dessen Gen-7-GPU entweder 6 oder 16 Executions Units bietet, kommt die HD Graphics (Bay Trail) nur mit lediglich 4 EUs daher. Abhängig von Temperatur und Leistungsaufnahme kann die niedrige Basisfrequenz dynamisch bis auf den maximalen Turbo-Takt angehoben werden, der ja nach Modell bei bis zu 896 MHz liegt. Ebenfalls modellabhängig ist das Speicherinterface, welches im Single- oder Dual-Channel-Betrieb sowie mit verschiedene Speicherstandards (DDR3(L), DDR3L-RS, LPDDR3) arbeiten kann. Insbesondere Varianten mit einem nur 32 Bit breiten Interface (Atom Z3735G) verlieren teils erheblich an Performance.

Die schnellsten Notebook-Modelle erreichen knapp die Performance der HD Graphics (Sandy Bridge) sowie der Radeon HD 6310. Das reicht, um einige ältere und sehr anspruchslose Windows-Spiele wie World of Warcraft oder Half-Life 2 in niedrigen Einstellungen flüssig darzustellen. Für aktuelle Windows-Titel ist die GPU dagegen praktisch nicht geeignet.

Verglichen mit konkurrierenden ARM-SoCs ordnet sich die Grafikeinheit dagegen im unteren High-End-Segment ein und übertrifft knapp die Adreno 320, die in verschiedenen Qualcomm-SoCs wie dem Snapdragon 600 zu finden ist. Damit entspricht Grafik-Performance in etwa Nvidias Tegra 4. Auch sehr aufwändige Android-Spiele werden damit in hohen Auflösungen flüssig bewältigt (Stand 2013).

Der integrierte Videodecoder unterstützt alle gängigen Codecs wie MPEG2, H.264, VC1, MVC oder VP8 und ist für Auflösungen bis 4K (maximal 100 Mbit/s) geeignet. Das Bildsignal kann per HDMI 1.4 (max. 1.920 x 1.080) oder DisplayPort 1.2 (max. 2.560 x 1.600) an bis zu zwei Displays ausgegeben werden. Eine weitere Neuerung ist die Unterstützung von Wireless Display sowie Quick Sync, Intels schnellem und sparsamen H-264-Hardwareencoder. Einige dieser Features sind jedoch nicht bei allen Modellen verfügbar.

Je nach Modell liegt die Leistungsaufnahme des gesamten SoCs zwischen rund 2 und 10 Watt. Die besonders sparsamen Versionen sind damit auch für passiv gekühlte Tablets geeignet, andere werden in größeren (Sub-) Notebooks mit aktiver Kühlung eingesetzt.

AMD Radeon R4 (Beema)

► remove from comparison AMD Radeon R4 (Beema)

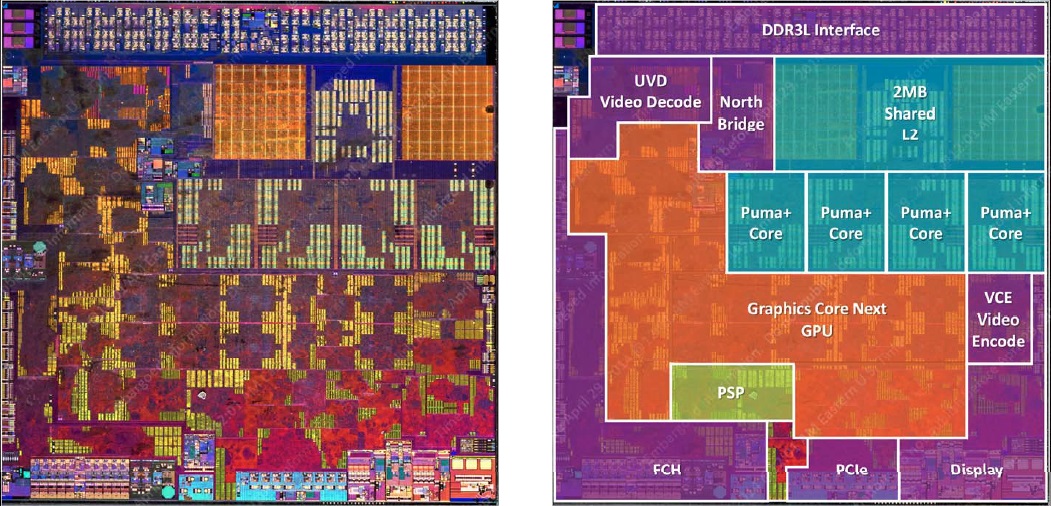
Die AMD Radeon R4 ist eine in den Beema-APUs (z.B. A6-6310) von AMD integrierte Grafikeinheit. Sie verfügt über 128 Shadereinheiten auf Basis der GCN-Architektur (zwei Compute Units), die mit bis zu 800 MHz takten und beherrscht DirectX 12 (FL 12_0). Die Grafikkarte besitzt keinen eigenen Speicher, sondern greift über den Controller der APU auf den Hauptspeicher zu (maximal Single-Channel DDR3L-1866).

Per UVD (Unified Video Decoder) kann die Radeon R4 den Prozessor beim Decodieren von Videos unterstützen, zudem wurde ein spezialisierter Video-Encoder (VCE 2.0) integriert. Das Bildsignal kann per VGA, DVI, HDMI 1.4a und DisplayPort 1.2 an bis zu zwei externe Monitore ausgegeben werden.

Die Performance der Radeon R4 liegt je nach Benchmark auf dem Niveau der Intel HD Graphics 4200. Dies entspricht in etwa einer dedizierten Radeon HD 7470M und reicht aus, ältere oder weniger anspruchsvolle Titel flüssig zu bewältigen; vorausgesetzt, die CPU limitiert nicht. Für aktuelle Spiele (Stand 2013/2014) ist die GPU dagegen nur bedingt geeignet.

Intel HD Graphics (Cherry Trail)

► remove from comparison Intel HD Graphics (Cherry Trail)

Die Intel HD Graphics (Cherry Trail) ist eine in den Tablet-SoCs der Cherry-Trail-Serie (z.B. Atom x7-Z8700) integrierte Grafikeinheit. Sie basiert auf der gleichen Architektur wie die GPU verschiedener Broadwell-Prozessoren (z.B. HD Graphics 5300), bietet allerdings deutlich weniger Shadereinheiten und geringere Taktraten. Die genauen Spezifikationen hängen vom jeweiligen SoC ab:

Die schnellste Variante mit 16 EUs und maximal 600 MHz schlägt die ältere HD Graphics (Bay Trail) um Faktor zwei, womit sich die GPU etwas oberhalb einer Qualcomm Adreno 330 oder PowerVR G6430, jedoch deutlich unter einer Adreno 420 oder GX6450 einordnet. Auch Nvidias Tegra-SoCs K1 und X1 rechnen weitaus schneller.

Unter Windows werden sich Anwender deshalb weiter auf sehr alte und anspruchslose Spiele beschränken müssen, wohingegen moderne Android-Games auch in hohen Auflösungen zumeist flüssig dargestellt werden sollten. Der x7-Z8700 war z.B. nur knapp in der Lage Team Fortress 2 in minimalen Details und 1280x720 flüssig wiederzugeben (11 - 69 fps).

Videos kann die GPU auch in 4K/H.265 flüssig wiedergeben (je nach Bitrate und Farbtiefe).

Die Intel HD Graphics Grafikkarte in den Cherry Trail SoCs unterstützt nach unseren Tests mit dem MS Surface 3 mit Atom x7-Z8700 nur DisplayPort 1.1 und damit lediglich 30 Hz bei 4K (3.840 x 2.160).

Intel HD Graphics (Bay Trail)AMD Radeon R4 (Beema)Intel HD Graphics (Cherry Trail)
HD Graphics Serie
HD Graphics P530 24 @ 0.35 - 1.05 GHz64/128 Bit
HD Graphics 5600 24 @ 0.3 - 1.05 GHz64/128 Bit
HD Graphics 6000 48 @ 0.3 - 1 GHz64/128 Bit
HD Graphics 4600 20 @ 0.2 - 1.35 GHz64/128 Bit
HD Graphics 5500 24 @ 0.3 - 0.95 GHz64/128 Bit
HD Graphics 5000 40 @ 0.2 - 1.1 GHz64/128 Bit
HD Graphics 4400 20 @ 0.2 - 1.1 GHz64/128 Bit
HD Graphics 5300 24 @ 0.1 - 0.9 GHz64/128 Bit
HD Graphics 4000 16 @ 0.35 - 1.35 GHz64/128 Bit
HD Graphics (Broadwell) 12 @ 0.1 - 0.85 GHz64/128 Bit
HD Graphics 4200 20 @ 0.2 - 0.85 GHz64/128 Bit
HD Graphics (Skylake) 12 @ 0.3 - 0.8 GHz64/128 Bit
HD Graphics 405 (Braswell) 16 @ 0.32 - 0.7 GHz64/128 Bit
HD Graphics (Braswell) 16 @ 0.32 - 0.7 GHz64/128 Bit
HD Graphics 400 (Braswell) 12 @ 0.32 - 0.64 GHz64/128 Bit
HD Graphics (Haswell) 10 @ 0.2 - 1 GHz64/128 Bit
HD Graphics (Cherry Trail) 16 @ 0.2 - 0.6 GHz64/128 Bit
HD Graphics 3000 12 @ 0.35 - 1.35 GHz64/128 Bit
HD Graphics 2500 6 @ 0.65 - 1.15 GHz64/128 Bit
HD Graphics (Ivy Bridge) 6 @ 0.35 - 1.1 GHz64/128 Bit
HD Graphics 2000 6 @ 0.85 - 1.35 GHz64/128 Bit
HD Graphics (Sandy Bridge) 6 @ 0.35 - 1.1 GHz64/128 Bit
HD Graphics (Bay Trail) 4 @ 0.31 - 0.9 GHz32/64/128 Bit
Radeon R5 (Beema/Carrizo-L) 128 @ 0.85 GHz64 Bit
Radeon R4 (Beema) 128 @ 0.8 GHz64 Bit
Radeon R3 (Mullins/Beema) 128 @ 0.35 - 0.69 GHz64 Bit
Radeon R2 (Mullins/Beema/Carrizo-L) 128 @ 0.3 - 0.6 GHz64 Bit
Radeon R6 (Mullins) 128 @ 0.5 GHz64 Bit
HD Graphics P530 24 @ 0.35 - 1.05 GHz64/128 Bit
HD Graphics 5600 24 @ 0.3 - 1.05 GHz64/128 Bit
HD Graphics 6000 48 @ 0.3 - 1 GHz64/128 Bit
HD Graphics 4600 20 @ 0.2 - 1.35 GHz64/128 Bit
HD Graphics 5500 24 @ 0.3 - 0.95 GHz64/128 Bit
HD Graphics 5000 40 @ 0.2 - 1.1 GHz64/128 Bit
HD Graphics 4400 20 @ 0.2 - 1.1 GHz64/128 Bit
HD Graphics 5300 24 @ 0.1 - 0.9 GHz64/128 Bit
HD Graphics 4000 16 @ 0.35 - 1.35 GHz64/128 Bit
HD Graphics (Broadwell) 12 @ 0.1 - 0.85 GHz64/128 Bit
HD Graphics 4200 20 @ 0.2 - 0.85 GHz64/128 Bit
HD Graphics (Skylake) 12 @ 0.3 - 0.8 GHz64/128 Bit
HD Graphics 405 (Braswell) 16 @ 0.32 - 0.7 GHz64/128 Bit
HD Graphics (Braswell) 16 @ 0.32 - 0.7 GHz64/128 Bit
HD Graphics 400 (Braswell) 12 @ 0.32 - 0.64 GHz64/128 Bit
HD Graphics (Haswell) 10 @ 0.2 - 1 GHz64/128 Bit
HD Graphics (Cherry Trail) 16 @ 0.2 - 0.6 GHz64/128 Bit
HD Graphics 3000 12 @ 0.35 - 1.35 GHz64/128 Bit
HD Graphics 2500 6 @ 0.65 - 1.15 GHz64/128 Bit
HD Graphics (Ivy Bridge) 6 @ 0.35 - 1.1 GHz64/128 Bit
HD Graphics 2000 6 @ 0.85 - 1.35 GHz64/128 Bit
HD Graphics (Sandy Bridge) 6 @ 0.35 - 1.1 GHz64/128 Bit
HD Graphics (Bay Trail) 4 @ 0.31 - 0.9 GHz32/64/128 Bit
CodenameBay TrailBeemaCherry Trail
ArchitekturGen. 7 Ivy BridgeGCN 1.1Gen. 8
Pipelines4 - unified128 - unified16 - unified
Kerntakt311 - 896 (Boost) MHz800 MHz200 - 600 (Boost) MHz
Speicherbandbreite32/64/128 Bit64 Bit64/128 Bit
Shared Memoryjajaja
APIDirectX 11, Shader 5.0, OpenGL 4.0, ES 3.0DirectX 12 (FL 12_0), Shader 5.0DirectX 12 (FL 11_1), Shader 5.0, OpenGL 4.3
Herstellungsprozess22 nm28 nm14 nm
Erscheinungsdatum11.09.2013 29.04.2014 02.03.2015
CPU in HD Graphics (Bay Trail)GPU Base SpeedGPU Boost / Turbo
Intel Pentium N35404 x 2160 MHz, 7.5 W313 MHz896 MHz
Intel Pentium J29004 x 2410 MHz, 10 W688 MHz896 MHz
Intel Pentium N35304 x 2160 MHz, 7.5 W313 MHz896 MHz
min. - max.311 - ? MHz400 - 896 MHz
CPU in Radeon R4 (Beema)GPU Base SpeedGPU Boost / Turbo
AMD A6-73104 x 2000 MHz, 15 W? MHz800 MHz
AMD A6-63104 x 1800 MHz, 15 W? MHz800 MHz
min. - max.? MHz400 - 896 MHz
CPU in HD Graphics (Cherry Trail)GPU Base SpeedGPU Boost / Turbo
Intel Atom x7-Z87004 x 1600 MHz200 MHz600 MHz
Intel Atom x5-Z85004 x 1440 MHz200 MHz600 MHz
Intel Atom x5-Z83504 x 1440 MHz200 MHz500 MHz
min. - max.200 - ? MHz? - 896 MHz

Benchmarks

Performance Rating - 3DMark 11 + Fire Strike + Time Spy - HD Graphics (Bay Trail)
0.1 pt (0%)
Performance Rating - 3DMark 11 + Fire Strike + Time Spy - Radeon R4 (Beema)
0.2 pt (1%)
Performance Rating - 3DMark 11 + Fire Strike + Time Spy - HD Graphics (Cherry Trail)
0.1 pt (0%)
29548 Points (3%)
3DMark - 3DMark Cloud Gate Score
min: 354     avg: 1182     median: 1188 (1%)     max: 1703 Points
min: 2459     avg: 2791     median: 2825 (3%)     max: 3037 Points
3DMark - 3DMark Cloud Gate Graphics
min: 362     avg: 1230     median: 1228.5 (0%)     max: 1670 Points
min: 3068     avg: 3275     median: 3309 (1%)     max: 3398 Points
3DMark - 3DMark Fire Strike Standard Score
min: 83     avg: 185     median: 147 (0%)     max: 495 Points
min: 442     avg: 471.7     median: 472 (1%)     max: 500 Points
min: 464     avg: 500     median: 497 (1%)     max: 531 Points
min: 193     avg: 233     median: 225 (0%)     max: 281 Points
3DMark - 3DMark Ice Storm Graphics
min: 5056     avg: 15391     median: 16047 (2%)     max: 21351 Points
min: 35441     avg: 36872     median: 35928 (4%)     max: 40855 Points
3DMark - 3DMark Sling Shot (ES 3.0) Unlimited
min: 1445     avg: 1525     median: 1525 (7%)     max: 1605 Points
3DMark - 3DMark Sling Shot (ES 3.0) Unlimited Graphics
min: 1598     avg: 1684     median: 1684 (4%)     max: 1770 Points
3DMark - 3DMark Sling Shot Extreme (ES 3.1) Unlimited
min: 1072     avg: 1215     median: 1159 (6%)     max: 1414 Points
3DMark - 3DMark Sling Shot Extreme (ES 3.1) Unlimited Graphics
min: 1058     avg: 1251     median: 1142 (3%)     max: 1554 Points
3DMark - 3DMark Sling Shot (ES 3.0)
0 Points (0%)
3DMark - 3DMark Sling Shot (ES 3.0) Graphics
min: 1300     avg: 1505     median: 1530 (9%)     max: 1732 Points
3DMark - 3DMark Sling Shot Extreme (ES 3.1)
0 Points (0%)
3DMark - 3DMark Sling Shot Extreme (ES 3.1) Graphics
min: 973     avg: 1102     median: 1054 (4%)     max: 1261 Points
3DMark 11 - 3DM11 Performance Score
min: 143     avg: 222.6     median: 216 (0%)     max: 280 Points
min: 753     avg: 793     median: 788 (1%)     max: 837 Points
min: 314     avg: 359.4     median: 343 (0%)     max: 562 Points
3DMark 11 - 3DM11 Performance GPU
min: 122     avg: 192.1     median: 186.5 (0%)     max: 237 Points
min: 681     avg: 721     median: 716 (1%)     max: 763 Points
min: 278     avg: 319.9     median: 298 (0%)     max: 494 Points
3DMark Vantage
3DM Vant. Perf. total + Intel HD Graphics (Bay Trail)
3DMark Vantage - 3DM Vant. Perf. total
min: 507     avg: 666     median: 637 (0%)     max: 846 Points
3DM Vant. Perf. total + AMD Radeon R4 (Beema)
2506 Points (1%)
3DM Vant. Perf. GPU no PhysX + Intel HD Graphics (Bay Trail)
3DM Vant. Perf. GPU no PhysX + AMD Radeon R4 (Beema)
2111 Points (1%)
3DMark 2001SE - 3DMark 2001 - Standard
7727 Points (8%)
3DMark 03 - 3DMark 03 - Standard
min: 4226     avg: 4997     median: 5220 (3%)     max: 5323 Points
10908 Points (6%)
3DMark 05 - 3DMark 05 - Standard
min: 2666     avg: 3195     median: 3331 (4%)     max: 3445 Points
6421 Points (7%)
3DMark 06 3DMark 06 - Score Unknown Settings + Intel HD Graphics (Bay Trail)
3DMark 06
2108 Points (3%)
3DMark 06 - Standard 1280x1024 + Intel HD Graphics (Bay Trail)
3DMark 06
min: 814     avg: 1785     median: 1866 (2%)     max: 2151 Points
3DMark 06 - Standard 1280x1024 + AMD Radeon R4 (Beema)
4046 Points (5%)
3DMark 06 - Standard 1280x1024 + Intel HD Graphics (Cherry Trail)
min: 2403     avg: 2833     median: 2595 (3%)     max: 3330 Points
3DMark 06 - Standard 1280x800 + Intel HD Graphics (Bay Trail)
3DMark 06
2087 Points (3%)
3DMark 06 - Standard 1024x768 + Intel HD Graphics (Cherry Trail)
3DMark 06
2877 Points (4%)
Unigine Valley 1.0 - Unigine Valley 1.0 DX
1.2 fps (0%)
Unigine Heaven 3.0 - Unigine Heaven 3.0 DX 11
3.6 fps (1%)
Unigine Heaven 2.1 - Heaven 2.1 high
min: 2.4     avg: 2.8     median: 2.8 (1%)     max: 3.4 fps
10.3 fps (2%)
Cinebench R10 Cinebench R10 Shading (32bit) + Intel HD Graphics (Bay Trail)
Cinebench R10 - Cinebench R10 Shading (32bit)
min: 898     avg: 2014     median: 1991.5 (1%)     max: 2889 Points
Cinebench R10 Shading (32bit) + AMD Radeon R4 (Beema)
min: 2657     avg: 3122     median: 3092.5 (2%)     max: 3674 Points
Cinebench R10 Shading (32bit) + Intel HD Graphics (Cherry Trail)
Cinebench R11.5 Cinebench R11.5 OpenGL 64 Bit + Intel HD Graphics (Bay Trail)
Cinebench R11.5 - Cinebench R11.5 OpenGL 64 Bit
min: 0.37     avg: 6.2     median: 6.4 (2%)     max: 7.69 fps
Cinebench R11.5 OpenGL 64 Bit + AMD Radeon R4 (Beema)
min: 13.64     avg: 14.8     median: 15 (5%)     max: 15.45 fps
Cinebench R11.5 OpenGL 64 Bit + Intel HD Graphics (Cherry Trail)
Cinebench R15
Cinebench R15 OpenGL 64 Bit + Intel HD Graphics (Bay Trail)
Cinebench R15 - Cinebench R15 OpenGL 64 Bit
min: 2.88     avg: 5     median: 5.5 (0%)     max: 6.55 fps
Cinebench R15 OpenGL 64 Bit + AMD Radeon R4 (Beema)
min: 14.04     avg: 15.7     median: 16 (1%)     max: 16.93 fps
Cinebench R15 OpenGL 64 Bit + Intel HD Graphics (Cherry Trail)
Cinebench R15 OpenGL Ref. Match 64 Bit + Intel HD Graphics (Bay Trail)
Cinebench R15 - Cinebench R15 OpenGL Ref. Match 64 Bit
min: 63     avg: 96.1     median: 97.8 (98%)     max: 97.8 %
Cinebench R15 OpenGL Ref. Match 64 Bit + AMD Radeon R4 (Beema)
Cinebench R15 OpenGL Ref. Match 64 Bit + Intel HD Graphics (Cherry Trail)
GFXBench 3.1 - GFXBench Manhattan ES 3.1 Offscreen
5.2 fps (0%)
GFXBench (DX / GLBenchmark) 2.7
GFXBench T-Rex HD Offscreen C24Z16 + Intel HD Graphics (Bay Trail)
GFXBench T-Rex HD Offscreen C24Z16 + Intel HD Graphics (Cherry Trail)
Basemark ES 2.0 - Basemark ES 2.0
min: 45.08     avg: 49.1     median: 49.1 (81%)     max: 53.1 fps
Basemark X 1.0 - Basemark X 1.0 Off-Screen
10.1 fps (48%)
Basemark X 1.1 - Basemark X 1.1 High Quality
min: 3008     avg: 6663     median: 8456 (19%)     max: 8524 Points
Basemark X 1.1 - Basemark X 1.1 Medium Quality
min: 4802     avg: 12880     median: 14509 (32%)     max: 17701 Points
NenaMark2 - NenaMark2 Score
min: 59     avg: 59.4     median: 59.4 (88%)     max: 59.7 fps
LuxMark v2.0 64Bit - LuxMark v2.0 Room GPU
min: 25     avg: 28.5     median: 27 (0%)     max: 35 Samples/s
min: 73     avg: 78     median: 78 (0%)     max: 83 Samples/s
min: 48     avg: 58.7     median: 59 (0%)     max: 69 Samples/s
LuxMark v2.0 64Bit - LuxMark v2.0 Sala GPU
min: 26     avg: 29     median: 29 (0%)     max: 34 Samples/s
min: 134     avg: 136.5     median: 136.5 (0%)     max: 139 Samples/s
min: 69     avg: 87.7     median: 89 (0%)     max: 105 Samples/s
ComputeMark v2.1 - ComputeMark v2.1 Result
min: 160     avg: 172.8     median: 174 (0%)     max: 192 Points
445 Points (0%)
277 Points (0%)
PassMark PerformanceTest Mobile V1 - PerformanceTest Mobile V1 2D Graphics Tests
min: 3822     avg: 4036     median: 3866 (1%)     max: 4588 Points
PassMark PerformanceTest Mobile V1 - PerformanceTest Mobile V1 3D Graphics Tests
min: 1058     avg: 1251     median: 1228 (2%)     max: 1488 Points

Average Benchmarks Intel HD Graphics (Bay Trail) → 100% n=17

Average Benchmarks AMD Radeon R4 (Beema) → 278% n=17

Average Benchmarks Intel HD Graphics (Cherry Trail) → 158% n=17

- Bereich der Benchmarkergebnisse für diese Grafikkarte
- Durchschnittliche Benchmarkergebnisse für diese Grafikkarte
* Smaller numbers mean a higher performance
1 This benchmark is not used for the average calculation

Spiele-Benchmarks

Die folgenden Benchmarks basieren auf unseren Spieletests mit Testnotebooks. Die Performance dieser Grafikkarte bei den gelisteten Spielen ist abhängig von der verwendeten CPU, Speicherausstattung, Treiber und auch Betriebssystem. Dadurch müssen die untenstehenden Werte nicht repräsentativ sein. Detaillierte Informationen über das verwendete System sehen Sie nach einem Klick auf den fps-Wert.

low 1280x720
100%
HD Graphics (Bay Trail):
26.7  fps
80%
HD Graphics (Cherry Trail):
21.4  fps
med. 1366x768
100%
HD Graphics (Bay Trail):
23.4  fps
Dirt 4

Dirt 4

2017
low 1280x720
100%
HD Graphics (Bay Trail):
6  fps
low 1280x720
100%
HD Graphics (Bay Trail):
12.6  fps
123%
HD Graphics (Cherry Trail):
15.5  fps
low 1280x720
HD Graphics (Cherry Trail):
22.6  fps
low 1024x768
Radeon R4 (Beema):
11.9  fps
med. 1366x768
Radeon R4 (Beema):
6.7  fps
low 1024x768
HD Graphics (Cherry Trail):
11.5  fps
med. 1366x768
HD Graphics (Cherry Trail):
7  fps
low 1024x768
HD Graphics (Cherry Trail):
8.8  fps
med. 1366x768
HD Graphics (Cherry Trail):
4.8  fps
low 1024x768
HD Graphics (Bay Trail):
0 (!)  fps
Anno 2205

Anno 2205

2015
low 1024x768
HD Graphics (Cherry Trail):
8.1  fps
med. 1366x768
HD Graphics (Cherry Trail):
3.9  fps
low 1366x768
100%
HD Graphics (Bay Trail):
12.1  fps
223%
Radeon R4 (Beema):
27  fps
124%
HD Graphics (Cherry Trail):
13.9 16.8 ~ 15 fps
med. 1366x768
Radeon R4 (Beema):
19.4  fps
low 1024x768
100%
HD Graphics (Bay Trail):
10.8  fps
243%
Radeon R4 (Beema):
26.2  fps
140%
HD Graphics (Cherry Trail):
15.1  fps
med. 1366x768
Radeon R4 (Beema):
17.3  fps
HD Graphics (Cherry Trail):
9.8  fps
Mad Max

Mad Max

2015
med. 1366x768
Radeon R4 (Beema):
9.2  fps
low 1280x720
100%
HD Graphics (Bay Trail):
24.7  fps
81%
HD Graphics (Cherry Trail):
20  fps
med. 1366x768
100%
HD Graphics (Bay Trail):
9.7  fps
157%
HD Graphics (Cherry Trail):
15.2  fps
high 1920x1080
100%
HD Graphics (Bay Trail):
5.5  fps
131%
HD Graphics (Cherry Trail):
7.2  fps
ultra 1920x1080
100%
HD Graphics (Bay Trail):
5.4  fps
low 1280x720
Radeon R4 (Beema):
4  fps
low 1024x768
Radeon R4 (Beema):
8.6  fps
med. 1366x768
Radeon R4 (Beema):
6.1  fps
low 1024x768
100%
HD Graphics (Bay Trail):
22 24.2 ~ 23 fps
227%
Radeon R4 (Beema):
52.3  fps
87%
HD Graphics (Cherry Trail):
20.1  fps
med. 1366x768
100%
HD Graphics (Bay Trail):
0 (!) 12.5 ~ 6 fps
260%
Radeon R4 (Beema):
15.6  fps
208%
HD Graphics (Cherry Trail):
12.5  fps
GTA V

GTA V

2015
low 1024x768
HD Graphics (Cherry Trail):
10.8 (!)  fps
low 1024x768
100%
HD Graphics (Bay Trail):
7.3  fps
296%
Radeon R4 (Beema):
21.6  fps
med. 1366x768
100%
HD Graphics (Bay Trail):
5.1  fps
286%
Radeon R4 (Beema):
14.6  fps
Evolve

Evolve

2015
low 1024x768
100%
HD Graphics (Bay Trail):
3.2  fps
347%
Radeon R4 (Beema):
11.1  fps
med. 1366x768
100%
HD Graphics (Bay Trail):
1.7  fps
441%
Radeon R4 (Beema):
7.5  fps
The Crew

The Crew

2014
low 1280x720
100%
HD Graphics (Bay Trail):
8.1  fps
191%
Radeon R4 (Beema):
15.5  fps
med. 1366x768
100%
HD Graphics (Bay Trail):
4.7  fps
232%
Radeon R4 (Beema):
10.9  fps
low 1024x768
100%
HD Graphics (Bay Trail):
7  fps
214%
Radeon R4 (Beema):
13.5 16.1 ~ 15 fps
136%
HD Graphics (Cherry Trail):
9.5  fps
med. 1366x768
100%
HD Graphics (Bay Trail):
4.6  fps
196%
Radeon R4 (Beema):
7.7 9.9 ~ 9 fps
124%
HD Graphics (Cherry Trail):
5.7  fps
Far Cry 4

Far Cry 4

2014
low 1024x768
100%
HD Graphics (Bay Trail):
5.6  fps
225%
Radeon R4 (Beema):
12.6  fps
med. 1366x768
100%
HD Graphics (Bay Trail):
3.8  fps
221%
Radeon R4 (Beema):
8.4  fps
low 1024x768
100%
HD Graphics (Bay Trail):
4.3  fps
165%
Radeon R4 (Beema):
7.1  fps
med. 1366x768
100%
HD Graphics (Bay Trail):
2.4  fps
192%
Radeon R4 (Beema):
4.6  fps
low 1024x768
100%
HD Graphics (Bay Trail):
9.6 11.5 ~ 11 fps
302%
Radeon R4 (Beema):
33.2  fps
147%
HD Graphics (Cherry Trail):
16.2  fps
med. 1366x768
100%
HD Graphics (Bay Trail):
4.3  fps
237%
Radeon R4 (Beema):
10.2  fps
142%
HD Graphics (Cherry Trail):
6.1  fps
F1 2014

F1 2014

2014
low 1024x768
100%
HD Graphics (Bay Trail):
12 14 ~ 13 fps
277%
Radeon R4 (Beema):
33 38 ~ 36 fps
123%
HD Graphics (Cherry Trail):
16  fps
med. 1366x768
100%
HD Graphics (Bay Trail):
12  fps
217%
Radeon R4 (Beema):
24 28 ~ 26 fps
100%
HD Graphics (Cherry Trail):
12  fps
high 1920x1080
Radeon R4 (Beema):
19  fps
ultra 1920x1080
Radeon R4 (Beema):
12  fps
low 1024x768
100%
HD Graphics (Bay Trail):
5.2  fps
188%
Radeon R4 (Beema):
9.8  fps
med. 1366x768
100%
HD Graphics (Bay Trail):
3.6  fps
222%
Radeon R4 (Beema):
8  fps
low 1024x768
100%
HD Graphics (Bay Trail):
3.7  fps
362%
Radeon R4 (Beema):
13.4  fps
med. 1366x768
100%
HD Graphics (Bay Trail):
2.5  fps
340%
Radeon R4 (Beema):
8.5  fps
low 1024x768
100%
HD Graphics (Bay Trail):
9.1  fps
241%
Radeon R4 (Beema):
21.9  fps
med. 1366x768
100%
HD Graphics (Bay Trail):
5.1  fps
284%
Radeon R4 (Beema):
14.5  fps
low 1280x720
100%
HD Graphics (Bay Trail):
8.5  fps
167%
Radeon R4 (Beema):
14.2  fps
med. 1344x756
100%
HD Graphics (Bay Trail):
6.1  fps
164%
Radeon R4 (Beema):
10  fps
Fifa 15

Fifa 15

2014
low 1280x720
100%
HD Graphics (Bay Trail):
12.4  fps
228%
Radeon R4 (Beema):
28.3  fps
126%
HD Graphics (Cherry Trail):
15.6  fps
high 1366x768
100%
HD Graphics (Bay Trail):
8.5  fps
245%
Radeon R4 (Beema):
20.8  fps
Sims 4

Sims 4

2014
low 1024x768
100%
HD Graphics (Bay Trail):
53.7 56 ~ 55 fps
109%
Radeon R4 (Beema):
60  fps
129%
HD Graphics (Cherry Trail):
65.6 66.6 81.4 ~ 71 fps
med. 1366x768
100%
HD Graphics (Bay Trail):
6.6 7 ~ 7 fps
327%
Radeon R4 (Beema):
22.9  fps
229%
HD Graphics (Cherry Trail):
9.4 16.9 21.2 ~ 16 fps
high 1920x1080
HD Graphics (Cherry Trail):
5.5 10 ~ 8 fps
low 1024x768
100%
HD Graphics (Bay Trail):
8.4  fps
196%
Radeon R4 (Beema):
16.5  fps
med. 1366x768
100%
HD Graphics (Bay Trail):
5.9  fps
183%
Radeon R4 (Beema):
10.8  fps
low 1024x768
100%
HD Graphics (Bay Trail):
31.6 41.8 ~ 37 fps
149%
Radeon R4 (Beema):
52.4 56.9 ~ 55 fps
68%
HD Graphics (Cherry Trail):
22 27.3 ~ 25 fps
med. 1366x768
100%
HD Graphics (Bay Trail):
12.5 12.5 ~ 13 fps
162%
Radeon R4 (Beema):
20.3 21.5 ~ 21 fps
100%
HD Graphics (Cherry Trail):
12.5 13.5 ~ 13 fps
low 1024x768
100%
HD Graphics (Bay Trail):
8.3  fps
129%
Radeon R4 (Beema):
10.7  fps
med. 1366x768
100%
HD Graphics (Bay Trail):
4.6  fps
150%
Radeon R4 (Beema):
6.9  fps
low 1280x720
100%
HD Graphics (Bay Trail):
11.1  fps
168%
Radeon R4 (Beema):
18.7  fps
med. 1280x720
100%
HD Graphics (Bay Trail):
9.6  fps
173%
Radeon R4 (Beema):
16.6  fps
high 1920x1080
Radeon R4 (Beema):
7.8  fps
low 1024x768
100%
HD Graphics (Bay Trail):
25.2  fps
med. 1366x768
100%
HD Graphics (Bay Trail):
9.2  fps
Thief

Thief

2014
low 1024x768
100%
HD Graphics (Bay Trail):
3.1 5.1 ~ 4 fps
223%
Radeon R4 (Beema):
8.9  fps
med. 1366x768
100%
HD Graphics (Bay Trail):
3.3  fps
173%
Radeon R4 (Beema):
5.7  fps
high 1366x768
Radeon R4 (Beema):
4.2  fps
ultra 1920x1080
Radeon R4 (Beema):
0.7  fps
low 1024x768
100%
HD Graphics (Bay Trail):
8.7  fps
175%
Radeon R4 (Beema):
15.2  fps
med. 1366x768
100%
HD Graphics (Bay Trail):
5.8  fps
203%
Radeon R4 (Beema):
11.8  fps
high 1366x768
Radeon R4 (Beema):
5.4  fps
low 1024x768
100%
HD Graphics (Bay Trail):
12.8  fps
166%
Radeon R4 (Beema):
21.3  fps
med. 1366x768
100%
HD Graphics (Bay Trail):
6  fps
185%
Radeon R4 (Beema):
11.1  fps
high 1366x768
Radeon R4 (Beema):
4.8  fps
ultra 1920x1080
Radeon R4 (Beema):
4.3  fps
low 1024x768
Radeon R4 (Beema):
12.3  fps
med. 1366x768
Radeon R4 (Beema):
7.7  fps
low 1024x768
100%
HD Graphics (Bay Trail):
7.3  fps
255%
Radeon R4 (Beema):
18.6  fps
182%
HD Graphics (Cherry Trail):
13.3  fps
med. 1366x768
Radeon R4 (Beema):
12.7  fps
high 1366x768
Radeon R4 (Beema):
8.8  fps
ultra 1920x1080
Radeon R4 (Beema):
3.3  fps
low 1024x768
100%
HD Graphics (Bay Trail):
14  fps
193%
Radeon R4 (Beema):
27  fps
med. 1366x768
100%
HD Graphics (Bay Trail):
8  fps
200%
Radeon R4 (Beema):
16  fps
high 1366x768
Radeon R4 (Beema):
9  fps
F1 2013

F1 2013

2013
low 1024x768
100%
HD Graphics (Bay Trail):
12  fps
233%
Radeon R4 (Beema):
28  fps
med. 1366x768
Radeon R4 (Beema):
19  fps
high 1366x768
Radeon R4 (Beema):
18  fps
ultra 1920x1080
Radeon R4 (Beema):
12  fps
Fifa 14

Fifa 14

2013
low 1024x768
100%
HD Graphics (Bay Trail):
12.6 18.7 19.9 29.8 33.6 60 ~ 29 fps
328%
Radeon R4 (Beema):
95.2  fps
med. 1366x768
100%
HD Graphics (Bay Trail):
10.5 19.5 33 ~ 21 fps
300%
Radeon R4 (Beema):
62.9  fps
high 1366x768
100%
HD Graphics (Bay Trail):
7.8 12.8 22 ~ 14 fps
362%
Radeon R4 (Beema):
50.7  fps
ultra 1920x1080
Radeon R4 (Beema):
26.5  fps
low 1024x768
100%
HD Graphics (Bay Trail):
7.7  fps
325%
Radeon R4 (Beema):
22.3 27.1 ~ 25 fps
med. 1366x768
Radeon R4 (Beema):
18 20.2 ~ 19 fps
high 1366x768
Radeon R4 (Beema):
15.1 16.2 ~ 16 fps
low 1280x720
100%
HD Graphics (Bay Trail):
6.3  fps
238%
Radeon R4 (Beema):
15  fps
med. 1366x768
Radeon R4 (Beema):
12.8  fps
high 1366x768
Radeon R4 (Beema):
7.4  fps
low 1024x768
100%
HD Graphics (Bay Trail):
10.2  fps
189%
Radeon R4 (Beema):
19.3  fps
med. 1366x768
100%
HD Graphics (Bay Trail):
6.1  fps
192%
Radeon R4 (Beema):
11.7  fps
high 1366x768
Radeon R4 (Beema):
8.3  fps
low 1024x768
100%
HD Graphics (Bay Trail):
11  fps
199%
Radeon R4 (Beema):
21.9  fps
med. 1366x768
100%
HD Graphics (Bay Trail):
7.8  fps
171%
Radeon R4 (Beema):
13.3  fps
high 1366x768
Radeon R4 (Beema):
5.9  fps
Asphalt 8: Airborne

Asphalt 8: Airborne

2013
low
HD Graphics (Cherry Trail):
58  fps
high
HD Graphics (Cherry Trail):
47  fps
Dota 2

Dota 2

2013
low 1024x768
100%
HD Graphics (Bay Trail):
18.2 20.8 28.4 31.9 ~ 25 fps
87%
Radeon R4 (Beema):
21.8  fps
119%
HD Graphics (Cherry Trail):
29.7  fps
med. 1366x768
100%
HD Graphics (Bay Trail):
9.5 10.4 13.7 19.4 ~ 13 fps
149%
Radeon R4 (Beema):
19.4  fps
127%
HD Graphics (Cherry Trail):
16.5  fps
ultra 1920x1080
Radeon R4 (Beema):
9.3  fps
low 1024x768
100%
HD Graphics (Bay Trail):
4.4  fps
223%
Radeon R4 (Beema):
9.8  fps
med. 1366x768
Radeon R4 (Beema):
6.7  fps
high 1366x768
Radeon R4 (Beema):
4.2  fps
ultra 1920x1080
Radeon R4 (Beema):
1.8  fps
GRID 2

GRID 2

2013
low 1024x768
100%
HD Graphics (Bay Trail):
14.1 16.2 17.9 20.4 23.2 ~ 18 fps
232%
Radeon R4 (Beema):
41.7  fps
133%
HD Graphics (Cherry Trail):
24  fps
med. 1366x768
100%
HD Graphics (Bay Trail):
12.5 12.6 ~ 13 fps
178%
Radeon R4 (Beema):
23.2  fps
104%
HD Graphics (Cherry Trail):
13.5  fps
high 1366x768
Radeon R4 (Beema):
17.8  fps
low 1024x768
100%
HD Graphics (Bay Trail):
5  fps
400%
Radeon R4 (Beema):
14.2 26.3 ~ 20 fps
med. 1366x768
Radeon R4 (Beema):
10.9 11.3 ~ 11 fps
high 1366x768
Radeon R4 (Beema):
6.3 8.2 ~ 7 fps
ultra 1920x1080
Radeon R4 (Beema):
3.2 4 ~ 4 fps
low 1280x720
100%
HD Graphics (Bay Trail):
8.4 8.4 10.9 11.4 12.2 13.3 14.2 14.7 15 ~ 12 fps
267%
Radeon R4 (Beema):
30.2 32.9 ~ 32 fps
158%
HD Graphics (Cherry Trail):
16 18 18.9 19.8 20.1 20.5 ~ 19 fps
med. 1366x768
100%
HD Graphics (Bay Trail):
3.5 5.3 5.6 5.7 6.3 6.8 6.9 7.1 ~ 6 fps
283%
Radeon R4 (Beema):
15.8 17.7 ~ 17 fps
150%
HD Graphics (Cherry Trail):
6.4 7.9 9.3 9.8 10 10 ~ 9 fps
high 1366x768
100%
HD Graphics (Bay Trail):
2.1 4.8 4.9 5.8 5.9 6.2 ~ 5 fps
280%
Radeon R4 (Beema):
13.1 15 ~ 14 fps
140%
HD Graphics (Cherry Trail):
5.6 5.7 6.7 7.6 7.9 8.4 ~ 7 fps
ultra 1920x1080
100%
HD Graphics (Bay Trail):
1.2  fps
417%
Radeon R4 (Beema):
4.2 5.1 ~ 5 fps
167%
HD Graphics (Cherry Trail):
2.4 2.6 ~ 2 fps
low 1024x768
100%
HD Graphics (Bay Trail):
39 56.2 69 ~ 55 fps
117%
Radeon R4 (Beema):
64.6  fps
med. 1366x768
100%
HD Graphics (Bay Trail):
12.3 12.8 14 ~ 13 fps
203%
Radeon R4 (Beema):
26.4  fps
high 1366x768
Radeon R4 (Beema):
15.4  fps
SimCity

SimCity

2013
low 1024x768
Radeon R4 (Beema):
27.6  fps
med. 1366x768
Radeon R4 (Beema):
12.6  fps
high 1366x768
Radeon R4 (Beema):
8.4  fps
ultra 1920x1080
Radeon R4 (Beema):
2  fps
low 1024x768
100%
HD Graphics (Bay Trail):
10 11.7 11.8 12 12.4 12.5 12.5 12.6 12.7 12.9 13.2 13.4 13.7 13.8 14 14.1 14.2 14.4 14.4 14.7 14.8 15 15.3 15.4 15.5 15.5 15.9 15.9 16 16.5 16.9 17.6 18 ~ 14 fps
236%
Radeon R4 (Beema):
31.2 31.7 31.7 31.7 33.1 34.6 35.7 ~ 33 fps
193%
HD Graphics (Cherry Trail):
19.7 25.7 27.8 30.2 33.6 ~ 27 fps
med. 1366x768
100%
HD Graphics (Bay Trail):
5.1 6.1 6.2 6.4 6.7 6.7 6.9 6.9 7 7 7.1 7.1 7.4 7.4 7.4 7.5 7.5 7.6 7.8 7.9 8 8 8.1 8.1 8.2 8.3 8.4 9.2 10.4 ~ 7 fps
257%
Radeon R4 (Beema):
15.9 16.6 17 17.8 18.7 18.7 22.5 ~ 18 fps
186%
HD Graphics (Cherry Trail):
10.5 12 13.2 13.5 14.8 ~ 13 fps
high 1366x768
100%
HD Graphics (Bay Trail):
3.1 4.5 4.6 4.8 4.8 4.8 4.8 4.9 4.9 5.2 5.2 5.4 5.4 6.1 7.3 ~ 5 fps
240%
Radeon R4 (Beema):
11.6 11.6 11.7 11.7 12.5 13.3 13.9 ~ 12 fps
160%
HD Graphics (Cherry Trail):
7 8.3 9 ~ 8 fps
ultra 1920x1080
100%
HD Graphics (Bay Trail):
0.3  fps
2000%
Radeon R4 (Beema):
5.1 6.2 ~ 6 fps
1333%
HD Graphics (Cherry Trail):
3.7 3.8 ~ 4 fps
Crysis 3

Crysis 3

2013
low 1024x768
Radeon R4 (Beema):
15.1  fps
med. 1366x768
Radeon R4 (Beema):
9.3  fps
high 1366x768
Radeon R4 (Beema):
6  fps
ultra 1920x1080
Radeon R4 (Beema):
1.9  fps
low 1024x768
100%
HD Graphics (Bay Trail):
15.1 23.6 ~ 19 fps
243%
Radeon R4 (Beema):
46.2  fps
med. 1366x768
100%
HD Graphics (Bay Trail):
5.2 9.7 ~ 7 fps
301%
Radeon R4 (Beema):
21.1  fps
high 1366x768
Radeon R4 (Beema):
16.5  fps
Temple Run 2

Temple Run 2

2013
high
HD Graphics (Cherry Trail):
34  fps
Far Cry 3

Far Cry 3

2012
low 1024x768
100%
HD Graphics (Bay Trail):
10.3  fps
med. 1366x768
100%
HD Graphics (Bay Trail):
6.2  fps
low 1024x768
100%
HD Graphics (Bay Trail):
10.1  fps
139%
Radeon R4 (Beema):
14  fps
med. 1366x768
100%
HD Graphics (Bay Trail):
6  fps
187%
Radeon R4 (Beema):
11.2  fps
high 1366x768
Radeon R4 (Beema):
5.7  fps
ultra 1920x1080
Radeon R4 (Beema):
3.3  fps
low 1024x768
100%
HD Graphics (Bay Trail):
12.4  fps
256%
Radeon R4 (Beema):
31.7  fps
med. 1366x768
100%
HD Graphics (Bay Trail):
7.3  fps
330%
Radeon R4 (Beema):
24.1  fps
high 1366x768
Radeon R4 (Beema):
10.5  fps
ultra 1920x1080
Radeon R4 (Beema):
6.7  fps
low 1024x768
100%
HD Graphics (Bay Trail):
12.5 14.3 ~ 13 fps
203%
Radeon R4 (Beema):
26.4  fps
117%
HD Graphics (Cherry Trail):
15.2  fps
med. 1366x768
100%
HD Graphics (Bay Trail):
9.8 11.2 ~ 11 fps
239%
Radeon R4 (Beema):
26.3  fps
105%
HD Graphics (Cherry Trail):
11.6  fps
high 1366x768
Radeon R4 (Beema):
19.2  fps
low 1024x768
Radeon R4 (Beema):
24.4  fps
HD Graphics (Cherry Trail):
0 (!)  fps
med. 1366x768
Radeon R4 (Beema):
18.2  fps
HD Graphics (Cherry Trail):
0 (!)  fps
high 1366x768
Radeon R4 (Beema):
13  fps
ultra 1920x1080
Radeon R4 (Beema):
7.9  fps
low 1024x768
100%
HD Graphics (Bay Trail):
42  fps
low 1024x768
100%
HD Graphics (Bay Trail):
26.1 46.6 ~ 36 fps
134%
Radeon R4 (Beema):
48.3  fps
72%
HD Graphics (Cherry Trail):
14.1 21.6 41.1 ~ 26 fps
med. 1366x768
100%
HD Graphics (Bay Trail):
20 23.9 ~ 22 fps
192%
Radeon R4 (Beema):
42.2  fps
91%
HD Graphics (Cherry Trail):
4.8 18.6 35.1 ~ 20 fps
high 1366x768
Radeon R4 (Beema):
30.6  fps
HD Graphics (Cherry Trail):
20.3  fps
ultra 1920x1080
Radeon R4 (Beema):
21.5  fps
HD Graphics (Cherry Trail):
11.4  fps
low 1024x768
100%
HD Graphics (Bay Trail):
12.9 13.2 ~ 13 fps
med. 1366x768
100%
HD Graphics (Bay Trail):
7.5 8.1 ~ 8 fps
low 1024x768
100%
HD Graphics (Bay Trail):
28  fps
104%
Radeon R4 (Beema):
29.2  fps
med. 1366x768
Radeon R4 (Beema):
21.1  fps
high 1366x768
Radeon R4 (Beema):
16.4  fps
low 1024x768
100%
HD Graphics (Bay Trail):
9.2 10.7 14.8 15.6 16.5 18.4 19.3 ~ 15 fps
266%
Radeon R4 (Beema):
39.9  fps
187%
HD Graphics (Cherry Trail):
24.3 31.9 ~ 28 fps
med. 1366x768
100%
HD Graphics (Bay Trail):
6 9.5 10.3 11.4 12 ~ 10 fps
262%
Radeon R4 (Beema):
26.2  fps
180%
HD Graphics (Cherry Trail):
16 19 ~ 18 fps
high 1366x768
100%
HD Graphics (Bay Trail):
7.9 9.6 ~ 9 fps
233%
Radeon R4 (Beema):
21  fps
ultra 1920x1080
100%
HD Graphics (Bay Trail):
5 5.9 ~ 5 fps
272%
Radeon R4 (Beema):
13.6  fps
low 1280x720
100%
HD Graphics (Bay Trail):
8.5 12.4 ~ 10 fps
239%
Radeon R4 (Beema):
23.9  fps
high 1366x768
100%
HD Graphics (Bay Trail):
8.1  fps
221%
Radeon R4 (Beema):
17.9  fps
Alan Wake

Alan Wake

2012
low 1024x768
100%
HD Graphics (Bay Trail):
5.8  fps
252%
Radeon R4 (Beema):
14.6  fps
med. 1366x768
100%
HD Graphics (Bay Trail):
2.3  fps
365%
Radeon R4 (Beema):
8.4  fps
Anno 2070

Anno 2070

2011
low 1024x768
100%
HD Graphics (Bay Trail):
11.8 14.6 15 15.1 15.3 16.1 16.5 16.8 16.8 17.4 17.4 18 18 18.2 19.7 22.8 ~ 17 fps
276%
Radeon R4 (Beema):
46.4 47.2 ~ 47 fps
153%
HD Graphics (Cherry Trail):
15.3 28.1 33.1 ~ 26 fps
med. 1366x768
100%
HD Graphics (Bay Trail):
6.3 6.4 6.4 6.8 6.9 7.2 7.5 7.5 7.6 8 8.1 9.3 ~ 7 fps
300%
Radeon R4 (Beema):
20.6 20.9 ~ 21 fps
186%
HD Graphics (Cherry Trail):
12.8 13.4 13.7 ~ 13 fps
high 1366x768
100%
HD Graphics (Bay Trail):
3.6 4 4 4.1 5.5 ~ 4 fps
300%
Radeon R4 (Beema):
11.3 13.2 ~ 12 fps
200%
HD Graphics (Cherry Trail):
8  fps
ultra 1920x1080
100%
HD Graphics (Bay Trail):
1.1  fps
455%
Radeon R4 (Beema):
5.1 5.6 ~ 5 fps
low 1280x720
100%
HD Graphics (Bay Trail):
11 11.8 ~ 11 fps
237%
Radeon R4 (Beema):
26.1  fps
155%
HD Graphics (Cherry Trail):
15.5 18.9 ~ 17 fps
med. 1366x768
100%
HD Graphics (Bay Trail):
10  fps
172%
Radeon R4 (Beema):
17.2  fps
80%
HD Graphics (Cherry Trail):
7.2 8.5 ~ 8 fps
high 1366x768
Radeon R4 (Beema):
11.8  fps
ultra 1920x1080
Radeon R4 (Beema):
5.5  fps
low 1024x768
100%
HD Graphics (Bay Trail):
8  fps
med. 1366x768
100%
HD Graphics (Bay Trail):
4.8  fps
low 1024x768
Radeon R4 (Beema):
31  fps
med. 1366x768
Radeon R4 (Beema):
25  fps
high 1366x768
Radeon R4 (Beema):
12  fps
low 1024x768
100%
HD Graphics (Bay Trail):
19.7  fps
204%
Radeon R4 (Beema):
40.1  fps
130%
HD Graphics (Cherry Trail):
25.6  fps
high 1366x768
Radeon R4 (Beema):
19.5  fps
HD Graphics (Cherry Trail):
12  fps
Dirt 3

Dirt 3

2011
low 800x600
100%
HD Graphics (Bay Trail):
24.1 36.9 ~ 31 fps
169%
Radeon R4 (Beema):
52.5  fps
91%
HD Graphics (Cherry Trail):
28.1  fps
med. 1024x768
100%
HD Graphics (Bay Trail):
12.9 13.3 ~ 13 fps
234%
Radeon R4 (Beema):
30.4  fps
96%
HD Graphics (Cherry Trail):
12.5  fps
high 1360x768
Radeon R4 (Beema):
22  fps
Civilization 5

Civilization 5

2010
low 1024x768
100%
HD Graphics (Bay Trail):
9.3  fps
201%
HD Graphics (Cherry Trail):
18.7  fps
Mafia 2

Mafia 2

2010
low 800x600
100%
HD Graphics (Bay Trail):
5 10.5 ~ 8 fps
med. 1024x768
100%
HD Graphics (Bay Trail):
5.6  fps
high 1360x768
100%
HD Graphics (Bay Trail):
3.7  fps
low 1024x768
100%
HD Graphics (Bay Trail):
32 48 49 53.3 ~ 46 fps
139%
HD Graphics (Cherry Trail):
63.2 64 ~ 64 fps
med. 1360x768
100%
HD Graphics (Bay Trail):
6 9 9 ~ 8 fps
225%
HD Graphics (Cherry Trail):
18 18.8 ~ 18 fps
high 1360x768
100%
HD Graphics (Bay Trail):
3  fps
467%
HD Graphics (Cherry Trail):
14  fps
ultra 1920x1080
HD Graphics (Cherry Trail):
7  fps
low 800x600
100%
HD Graphics (Bay Trail):
12  fps
med. 1360x768
100%
HD Graphics (Bay Trail):
9  fps
low 1024x768
100%
HD Graphics (Bay Trail):
12.8  fps
med. 1366x768
100%
HD Graphics (Bay Trail):
9  fps
Risen

Risen

2009
low 800x600
100%
HD Graphics (Bay Trail):
23.1 25 26.2 28.8 ~ 26 fps
med. 1024x768
100%
HD Graphics (Bay Trail):
8.7 9 10.4 11.1 ~ 10 fps
Resident Evil 5

Resident Evil 5

2009
low 800x600
100%
HD Graphics (Bay Trail):
17.1 26.1 26.2 26.3 ~ 24 fps
Trackmania Nations Forever

Trackmania Nations Forever

2008
low 640x480
100%
HD Graphics (Bay Trail):
42.9 69.8 69.8 71.6 72 72.7 75.1 75.5 76 76.7 77.1 80.9 83.1 83.9 84.3 84.8 85.6 86.9 90.2 ~ 77 fps
130%
HD Graphics (Cherry Trail):
77.3 92.6 96.1 97.8 99.7 105 128 ~ 100 fps
high 1024x768
100%
HD Graphics (Bay Trail):
10.3 14 17.7 18 18.1 18.1 18.7 18.8 19.3 19.4 19.4 19.8 19.8 20.5 20.5 20.6 21 21.5 23.6 ~ 19 fps
126%
HD Graphics (Cherry Trail):
18.2 21.3 22.9 24.4 24.7 25 29.2 ~ 24 fps
ultra 1920x1080
100%
HD Graphics (Bay Trail):
6.4 7.7 ~ 7 fps
200%
HD Graphics (Cherry Trail):
9.6 15.5 16.8 ~ 14 fps
Crysis - GPU Benchmark

Crysis - GPU Benchmark

2007
low 1024x768
100%
HD Graphics (Bay Trail):
18.9 19 ~ 19 fps
med. 1024x768
100%
HD Graphics (Bay Trail):
7.6 8.7 ~ 8 fps
World of Warcraft

World of Warcraft

2005
low 800x600
100%
HD Graphics (Bay Trail):
33 33 35 38 44 46.2 47 48 49 49 50 52 ~ 44 fps
107%
HD Graphics (Cherry Trail):
44 50.9 ~ 47 fps
med. 1024x768
100%
HD Graphics (Bay Trail):
9.6 11.5 20 22 23 25.3 26 26 28 34 ~ 23 fps
80%
HD Graphics (Cherry Trail):
18.3  fps
high 1280x1024
100%
HD Graphics (Bay Trail):
12 12 13.5 ~ 13 fps
ultra 1920x1080
100%
HD Graphics (Bay Trail):
5.6 7 ~ 6 fps
Quake 3 Arena - Timedemo

Quake 3 Arena - Timedemo

1999
high 1024x768
100%
HD Graphics (Bay Trail):
190  fps

Average Gaming Intel HD Graphics (Bay Trail) → 100%

Average Gaming 30-70 fps → 100%

Average Gaming AMD Radeon R4 (Beema) → 251%

Average Gaming 30-70 fps → 228%

Average Gaming Intel HD Graphics (Cherry Trail) → 165%

Average Gaming 30-70 fps → 123%

Intel HD Graphics (Bay Trail)lowmed.highultraQHD4K
Team Fortress 226.723.4
Dirt 46
Rocket League12.6
Call of Duty: Black Ops 30
World of Warships12.1
Metal Gear Solid V10.8
Dota 2 Reborn24.79.75.55.4
Dirt Rally236
Battlefield Hardline7.35.1
Evolve3.21.7
The Crew8.14.7
Dragon Age: Inquisition74.6
Far Cry 45.63.8
Assassin's Creed Unity4.32.4
Civilization: Beyond Earth114.3
F1 20141312
The Evil Within5.23.6
Ryse: Son of Rome3.72.5
Alien: Isolation9.15.1
Middle-earth: Shadow of Mordor8.56.1
Fifa 1512.48.5
Sims 4557
Risen 3: Titan Lords8.45.9
GRID: Autosport3713
Watch Dogs8.34.6
Wolfenstein: The New Order11.19.6
The Elder Scrolls Online25.29.2
Thief43.3
Assassin´s Creed IV: Black Flag8.75.8
X-Plane 10.2512.86
Battlefield 47.3
Batman: Arkham Origins148
F1 201312
Fifa 14292114
Total War: Rome II7.7
Saints Row IV6.3
The Bureau: XCOM Declassified10.26.1
Splinter Cell: Blacklist117.8
Dota 22513
Company of Heroes 24.4
GRID 21813
Metro: Last Light5
BioShock Infinite12651.2
StarCraft II: Heart of the Swarm5513
Tomb Raider14750.3
Dead Space 3197
Far Cry 310.36.2
Hitman: Absolution10.16
Call of Duty: Black Ops 212.47.3
Dishonored1311
Torchlight 242
Counter-Strike: GO3622
Sleeping Dogs138
Dirt Showdown28
Diablo III151095
Mass Effect 3108.1
Alan Wake5.82.3
Anno 207017741.1
The Elder Scrolls V: Skyrim1110
Battlefield 384.8
Deus Ex Human Revolution19.7
Dirt 33113
Civilization 59.3
Mafia 285.63.7
StarCraft 24683
Metro 2033129
Battlefield: Bad Company 212.89
Risen2610
Resident Evil 524
Trackmania Nations Forever77197
Crysis - GPU Benchmark198
World of Warcraft4423136
Quake 3 Arena - Timedemo190
< 30 fps
< 60 fps
< 120 fps
≥ 120 fps
62
8
1
53


12


1
7


Intel HD Graphics (Cherry Trail)lowmed.highultraQHD4K
Team Fortress 221.4
Rocket League15.5
Farming Simulator 1722.6
Rainbow Six Siege11.57
Star Wars Battlefront8.84.8
Anno 22058.13.9
World of Warships15
Metal Gear Solid V15.19.8
Dota 2 Reborn2015.27.2
Dirt Rally20.112.5
GTA V10.8
Dragon Age: Inquisition9.55.7
Civilization: Beyond Earth16.26.1
F1 20141612
Fifa 1515.6
Sims 471168
GRID: Autosport2513
Battlefield 413.3
Asphalt 8: Airborne5847
Dota 229.716.5
GRID 22413.5
BioShock Infinite19972
Tomb Raider271384
Temple Run 234
Dishonored15.211.6
Borderlands 200
Counter-Strike: GO262020.311.4
Diablo III2818
Anno 207026138
The Elder Scrolls V: Skyrim178
Deus Ex Human Revolution25.612
Dirt 328.112.5
Civilization 518.7
StarCraft 26418147
Trackmania Nations Forever1002414
World of Warcraft4718.3
< 30 fps
< 60 fps
< 120 fps
≥ 120 fps
29
2
3
23


9
2

5


AMD Radeon R4 (Beema)lowmed.highultraQHD4K
Rise of the Tomb Raider11.96.7
World of Warships2719.4
Metal Gear Solid V26.217.3
Mad Max9.2
Batman: Arkham Knight4
The Witcher 38.66.1
Dirt Rally52.315.6
Battlefield Hardline21.614.6
Evolve11.17.5
The Crew15.510.9
Dragon Age: Inquisition159
Far Cry 412.68.4
Assassin's Creed Unity7.14.6
Civilization: Beyond Earth33.210.2
F1 201436261912
The Evil Within9.88
Ryse: Son of Rome13.48.5
Alien: Isolation21.914.5
Middle-earth: Shadow of Mordor14.210
Fifa 1528.320.8
Sims 46022.9
Risen 3: Titan Lords16.510.8
GRID: Autosport5521
Watch Dogs10.76.9
Wolfenstein: The New Order18.716.67.8
Thief8.95.74.20.7
Assassin´s Creed IV: Black Flag15.211.85.4
X-Plane 10.2521.311.14.84.3
Call of Duty: Ghosts12.37.7
Battlefield 418.612.78.83.3
Batman: Arkham Origins27169
F1 201328191812
Fifa 1495.262.950.726.5
Total War: Rome II251916
Saints Row IV1512.87.4
The Bureau: XCOM Declassified19.311.78.3
Splinter Cell: Blacklist21.913.35.9
Dota 221.819.49.3
Company of Heroes 29.86.74.21.8
GRID 241.723.217.8
Metro: Last Light201174
BioShock Infinite3217145
StarCraft II: Heart of the Swarm64.626.415.4
SimCity27.612.68.42
Tomb Raider3318126
Crysis 315.19.361.9
Dead Space 346.221.116.5
Hitman: Absolution1411.25.73.3
Call of Duty: Black Ops 231.724.110.56.7
Dishonored26.426.319.2
Borderlands 224.418.2137.9
Counter-Strike: GO48.342.230.621.5
Dirt Showdown29.221.116.4
Diablo III39.926.22113.6
Mass Effect 323.917.9
Alan Wake14.68.4
Anno 20704721125
The Elder Scrolls V: Skyrim26.117.211.85.5
Batman: Arkham City312512
Deus Ex Human Revolution40.119.5
Dirt 352.530.422
< 30 fps
< 60 fps
< 120 fps
≥ 120 fps
42
15
3
54
2
1
34
2

20


Eine Liste mit weiteren Spielen und allen Grafikkarten finden Sie auf unserer Seite: Welches Spiel ist mit welcher Grafikkarte spielbar?

v1.28
log 24. 11:12:48

#0 ran 0s before starting gpusingle class +0s ... 0s

#1 checking url part for id 4922 +0s ... 0s

#2 checking url part for id 5496 +0s ... 0s

#3 checking url part for id 6197 +0s ... 0s

#4 redirected to Ajax server, took 1727169168s time from redirect:0 +0s ... 0s

#5 did not recreate cache, as it is less than 5 days old! Created at Sun, 22 Sep 2024 05:16:22 +0200 +0s ... 0s

#6 composed specs +0.011s ... 0.011s

#7 did output specs +0s ... 0.011s

#8 start showIntegratedCPUs +0s ... 0.011s

#9 getting avg benchmarks for device 4922 +0.027s ... 0.038s

#10 got single benchmarks 4922 +0.089s ... 0.127s

#11 getting avg benchmarks for device 5496 +0.004s ... 0.131s

#12 got single benchmarks 5496 +0.001s ... 0.132s

#13 getting avg benchmarks for device 6197 +0.003s ... 0.135s

#14 got single benchmarks 6197 +0.025s ... 0.16s

#15 got avg benchmarks for devices +0s ... 0.16s

#16 No cached benchmark found, getting uncached values +0.014s ... 0.173s

#17 No cached benchmark found, getting uncached values +0.001s ... 0.174s

#18 min, max, avg, median took s +0.034s ... 0.208s

#19 before gaming benchmark output +0s ... 0.208s

#20 Got 761 rows for game benchmarks. +0.066s ... 0.274s

#21 composed SQL query for gamebenchmarks +0s ... 0.274s

#22 got data and put it in $dataArray +0.004s ... 0.278s

#23 benchmarks composed for output. +0.03s ... 0.308s

#24 calculated avg scores. +0s ... 0.308s

#25 return log +0.001s ... 0.309s

Teilen Sie diesen Artikel, um uns zu unterstützen. Jeder Link hilft!
> Notebook Test, Laptop Test und News > Benchmarks / Technik > Benchmarks / Technik > Grafikkarten Vergleich - Head 2 Head
Autor: Klaus Hinum,  8.09.2017 (Update:  1.07.2023)