Notebookcheck Logo

Intel HD Graphics 5300 vs AMD Radeon 660M vs Intel HD Graphics (Bay Trail)

Intel HD Graphics 5300

► remove from comparison Intel HD Graphics 5300

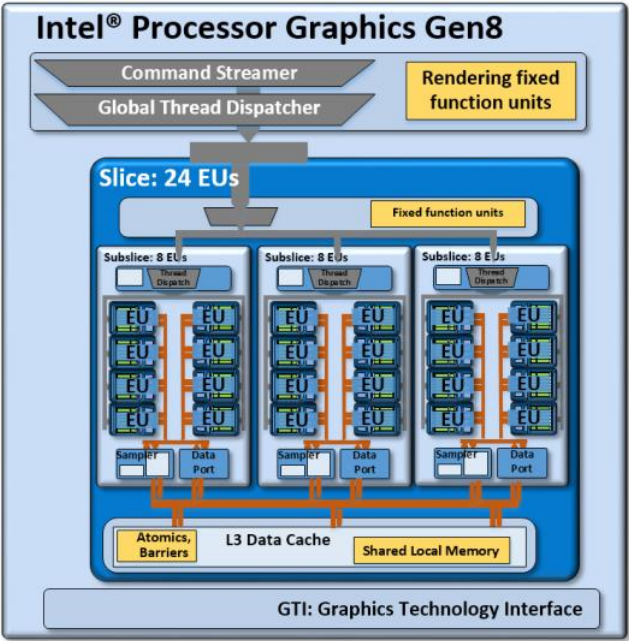
Die Intel HD Graphics 5300 (GT2) ist eine Prozessorgrafikkarte in den Ende 2014 vorgestellten Core-M-CPUs der Broadwell-Generation (z.B. Core M-5Y70). Zwar glänzt die GPU mit einer extrem niedrigen Leistungsaufnahme, allerdings siedelt sich die Performance nur im absoluten Low-End-Segment an und ist für neuere Spiele kaum ausreichend.

Architektur und Features

Broadwell integriert eine Grafikeinheit auf Basis der Intel-Gen8-Architektur, die gegenüber dem Vorgänger Intel Gen7.5 (Haswell) in verschiedenen Punkten weiterentwickelt wurde. So hat Intel unter anderem die "Subslice" genannten Shader-Arrays umorganisiert, die nun jeweils 8 Execution Units (EUs) beinhalten. Drei Subslices bilden wiederum einen Slice mit insgesamt 24 EUs. Hinzu kommen größere L1-Caches und Verbesserungen im Front-End, die die Leistung zusätzlich steigern sollen.

Die HD Graphics 5300 repräsentiert die mittlere, auch "GT2" bezeichnete Ausbaustufe mit einem Slice und 24 EUs. Daneben existieren auch eine teildeaktivierte GT1-Variante (12 EUs) sowie die GT3/GT3e (48 EUs) ohne/mit zusätzlichem eDRAM-Cache.

Alle Broadwell-GPUs unterstützen OpenCL 2.0 sowie DirectX 12 (FL 11_1). Zudem kann der Videodecoder nun auch den H.265-Codec verarbeiten, greift dafür allerdings nur teilweise auf besonders sparsame Fixed-Function-Einheiten zurück. Die Bildausgabe erfolgt über DP 1.2/eDP 1.3 (max. 3.840 x 2.160 @ 60 Hz) oder HDMI 1.4a (max. 3.840 x 2.160 @ 24 Hz), HDMI 2.0 steht dagegen nicht zur Verfügung. Es können maximal drei Displays parallel angesteuert werden.

Performance

Je nach Modell liegt der maximale GPU-Takt zwischen 800 und 900 MHz, der durch die niedrige TDP jedoch nicht dauerhaft gehalten wird. In längeren Benchmarks ist die HD 5300 darum kaum schneller als die ältere HD 4000 oder HD 4200, die bei gleicher Performance aber deutlich mehr Energie benötigen. Die TDP des Core M kann optional leicht abgesenkt oder angehoben werden, was spürbare Auswirkungen auf die Leistungsfähigkeit hat.

Insgesamt werden nur wenige Spiele aus 2014 (oder neuer) in niedrigen Einstellungen flüssig dargestellt, sodass man sich auf ältere und weniger anspruchsvolle Titel beschränken muss.

Leistungsaufnahme

Die TDP des gesamten Chips liegt standardmäßig bei zumeist 4,5 Watt, sodass viele Ultrabooks oder 2-in-1-Geräte mit einer rein passiven Kühlung auskommen. Teils kann die TDP auch auf niedrigere (3,5 Watt) oder höhere Werte (6 Watt) angepasst werden.

AMD Radeon 660M

► remove from comparison AMD Radeon 660M

Die AMD Radeon 660M (oder RX 660M) ist eine integrierte Grafikkarte (iGPU) für Notebooks. Sie befindet sich in den Einstiegs-Rembrandt-APUs (Ryzen 6000 Mobile) und bietet nur 6  (384 Shader) der 12 CUs. Sie nutzt die aktuelle RDNA 2 Architektur (wie die RX 6000M Serie). Die Taktrate ist abhängig vom CPU-Modell und rangiert beim Launch von 1,5 - 1,9 GHz (maximaler Boost-Takt). Die GPU hat keinen eigenen Grafikspeicher, sondern nutzt den gemeinsamen Hauptspeicher (bis zu LPDDR5 6400 MT/s oder DDR5 4800 MT/s). Als erste iGPU neben der 680M, unterstützt die 660M Raytracing in Hardware, ist jedoch bei aktuellen Spielen zu langsam um dieses Feature sinnvoll nutzen zu können.

Die Leistung der GPU ist abhängig von der CPU, dem konfiguriertem TDP (15 - 45W+), der Kühlung und dem verbautem Hauptspeicher. Die Performance sollte durch die geringere CU-Anzahl und geringere Taktung deutlich hinter der Radeon 680M liegen und wohl nur auf dem Level der alten Vega 7 iGPUs.

Der Stromverbrauch ist dank 6nm Prozess und ausgeklügelten Stromsparmechanismen relativ gering (laut AMD) und daher eignet sich die Grafikkarte auch für dünne und leichte Notebooks (vor allem die 15W Varianten).

Intel HD Graphics (Bay Trail)

► remove from comparison Intel HD Graphics (Bay Trail)

Die Intel HD Graphics (Bay Trail) ist eine in den Tablet- (z.B. Z3770), Nettop- (z.B. J2850) und Notebook-SoCs (z.B. N3510) der Bay-Trail-Serie integrierte Grafikeinheit. Sie ist in verschiedenen Atom-, Celeron- und Pentium-Modellen zu finden und basiert auf der DirectX-11-tauglichen GPU der Ivy-Bridge-Generation. Taktrate und Einheitenzahl fallen allerdings deutlich niedriger aus, sodass sich die Performance nur im Low-End-Segment ansiedelt.

Im Vergleich zu Ivy Bridge, dessen Gen-7-GPU entweder 6 oder 16 Executions Units bietet, kommt die HD Graphics (Bay Trail) nur mit lediglich 4 EUs daher. Abhängig von Temperatur und Leistungsaufnahme kann die niedrige Basisfrequenz dynamisch bis auf den maximalen Turbo-Takt angehoben werden, der ja nach Modell bei bis zu 896 MHz liegt. Ebenfalls modellabhängig ist das Speicherinterface, welches im Single- oder Dual-Channel-Betrieb sowie mit verschiedene Speicherstandards (DDR3(L), DDR3L-RS, LPDDR3) arbeiten kann. Insbesondere Varianten mit einem nur 32 Bit breiten Interface (Atom Z3735G) verlieren teils erheblich an Performance.

Die schnellsten Notebook-Modelle erreichen knapp die Performance der HD Graphics (Sandy Bridge) sowie der Radeon HD 6310. Das reicht, um einige ältere und sehr anspruchslose Windows-Spiele wie World of Warcraft oder Half-Life 2 in niedrigen Einstellungen flüssig darzustellen. Für aktuelle Windows-Titel ist die GPU dagegen praktisch nicht geeignet.

Verglichen mit konkurrierenden ARM-SoCs ordnet sich die Grafikeinheit dagegen im unteren High-End-Segment ein und übertrifft knapp die Adreno 320, die in verschiedenen Qualcomm-SoCs wie dem Snapdragon 600 zu finden ist. Damit entspricht Grafik-Performance in etwa Nvidias Tegra 4. Auch sehr aufwändige Android-Spiele werden damit in hohen Auflösungen flüssig bewältigt (Stand 2013).

Der integrierte Videodecoder unterstützt alle gängigen Codecs wie MPEG2, H.264, VC1, MVC oder VP8 und ist für Auflösungen bis 4K (maximal 100 Mbit/s) geeignet. Das Bildsignal kann per HDMI 1.4 (max. 1.920 x 1.080) oder DisplayPort 1.2 (max. 2.560 x 1.600) an bis zu zwei Displays ausgegeben werden. Eine weitere Neuerung ist die Unterstützung von Wireless Display sowie Quick Sync, Intels schnellem und sparsamen H-264-Hardwareencoder. Einige dieser Features sind jedoch nicht bei allen Modellen verfügbar.

Je nach Modell liegt die Leistungsaufnahme des gesamten SoCs zwischen rund 2 und 10 Watt. Die besonders sparsamen Versionen sind damit auch für passiv gekühlte Tablets geeignet, andere werden in größeren (Sub-) Notebooks mit aktiver Kühlung eingesetzt.

Intel HD Graphics 5300AMD Radeon 660MIntel HD Graphics (Bay Trail)
HD Graphics Serie
HD Graphics P530 24 @ 0.35 - 1.05 GHz64/128 Bit
HD Graphics 5600 24 @ 0.3 - 1.05 GHz64/128 Bit
HD Graphics 6000 48 @ 0.3 - 1 GHz64/128 Bit
HD Graphics 4600 20 @ 0.2 - 1.35 GHz64/128 Bit
HD Graphics 5500 24 @ 0.3 - 0.95 GHz64/128 Bit
HD Graphics 5000 40 @ 0.2 - 1.1 GHz64/128 Bit
HD Graphics 4400 20 @ 0.2 - 1.1 GHz64/128 Bit
HD Graphics 5300 24 @ 0.1 - 0.9 GHz64/128 Bit
HD Graphics 4000 16 @ 0.35 - 1.35 GHz64/128 Bit
HD Graphics (Broadwell) 12 @ 0.1 - 0.85 GHz64/128 Bit
HD Graphics 4200 20 @ 0.2 - 0.85 GHz64/128 Bit
HD Graphics (Skylake) 12 @ 0.3 - 0.8 GHz64/128 Bit
HD Graphics 405 (Braswell) 16 @ 0.32 - 0.7 GHz64/128 Bit
HD Graphics (Braswell) 16 @ 0.32 - 0.7 GHz64/128 Bit
HD Graphics 400 (Braswell) 12 @ 0.32 - 0.64 GHz64/128 Bit
HD Graphics (Haswell) 10 @ 0.2 - 1 GHz64/128 Bit
HD Graphics (Cherry Trail) 16 @ 0.2 - 0.6 GHz64/128 Bit
HD Graphics 3000 12 @ 0.35 - 1.35 GHz64/128 Bit
HD Graphics 2500 6 @ 0.65 - 1.15 GHz64/128 Bit
HD Graphics (Ivy Bridge) 6 @ 0.35 - 1.1 GHz64/128 Bit
HD Graphics 2000 6 @ 0.85 - 1.35 GHz64/128 Bit
HD Graphics (Sandy Bridge) 6 @ 0.35 - 1.1 GHz64/128 Bit
HD Graphics (Bay Trail) 4 @ 0.31 - 0.9 GHz32/64/128 Bit
Radeon 680M 768 @ 2.4 GHz
Radeon 660M 384 @ 1.9 GHz
Radeon Graphics (Ryzen 7000) 128 @ 2.2 GHz
Radeon 610M 128 @ 0.4 - 2.2 GHz
HD Graphics P530 24 @ 0.35 - 1.05 GHz64/128 Bit
HD Graphics 5600 24 @ 0.3 - 1.05 GHz64/128 Bit
HD Graphics 6000 48 @ 0.3 - 1 GHz64/128 Bit
HD Graphics 4600 20 @ 0.2 - 1.35 GHz64/128 Bit
HD Graphics 5500 24 @ 0.3 - 0.95 GHz64/128 Bit
HD Graphics 5000 40 @ 0.2 - 1.1 GHz64/128 Bit
HD Graphics 4400 20 @ 0.2 - 1.1 GHz64/128 Bit
HD Graphics 5300 24 @ 0.1 - 0.9 GHz64/128 Bit
HD Graphics 4000 16 @ 0.35 - 1.35 GHz64/128 Bit
HD Graphics (Broadwell) 12 @ 0.1 - 0.85 GHz64/128 Bit
HD Graphics 4200 20 @ 0.2 - 0.85 GHz64/128 Bit
HD Graphics (Skylake) 12 @ 0.3 - 0.8 GHz64/128 Bit
HD Graphics 405 (Braswell) 16 @ 0.32 - 0.7 GHz64/128 Bit
HD Graphics (Braswell) 16 @ 0.32 - 0.7 GHz64/128 Bit
HD Graphics 400 (Braswell) 12 @ 0.32 - 0.64 GHz64/128 Bit
HD Graphics (Haswell) 10 @ 0.2 - 1 GHz64/128 Bit
HD Graphics (Cherry Trail) 16 @ 0.2 - 0.6 GHz64/128 Bit
HD Graphics 3000 12 @ 0.35 - 1.35 GHz64/128 Bit
HD Graphics 2500 6 @ 0.65 - 1.15 GHz64/128 Bit
HD Graphics (Ivy Bridge) 6 @ 0.35 - 1.1 GHz64/128 Bit
HD Graphics 2000 6 @ 0.85 - 1.35 GHz64/128 Bit
HD Graphics (Sandy Bridge) 6 @ 0.35 - 1.1 GHz64/128 Bit
HD Graphics (Bay Trail) 4 @ 0.31 - 0.9 GHz32/64/128 Bit
CodenameBroadwell GT2RDNA 2 RembrandtBay Trail
ArchitekturGen. 8 BroadwellRDNA 2Gen. 7 Ivy Bridge
Pipelines24 - unified384 - unified4 - unified
Kerntakt100 - 900 (Boost) MHz1900 (Boost) MHz311 - 896 (Boost) MHz
Speicherbandbreite64/128 Bit32/64/128 Bit
Shared Memoryjaneinja
APIDirectX 12 (FL 11_1), OpenGL 4.3DirectX 12_1DirectX 11, Shader 5.0, OpenGL 4.0, ES 3.0
Transistors1.3 Billion
Herstellungsprozess14 nm6 nm22 nm
FeaturesQuickSyncTiled Rasterization, Shared Memory (up to Dual-Channel DDR4-3200)
Erscheinungsdatum05.09.2014 04.01.2022 11.09.2013
Stromverbrauch45 Watt
CPU in HD Graphics 5300GPU Base SpeedGPU Boost / Turbo
Intel Core M-5Y712 x 1200 MHz, 4.5 W300 MHz900 MHz
Intel Core M-5Y512 x 1100 MHz, 4.5 W300 MHz900 MHz
Intel Core M-5Y702 x 1100 MHz, 4.5 W100 MHz850 MHz
min. - max.100 - 300 MHz800 - 900 MHz
CPU in Radeon 660MGPU Base SpeedGPU Boost / Turbo
AMD Ryzen 5 PRO 6650H6 x 3300 MHz, 45 W? MHz1900 MHz
AMD Ryzen 5 6600H6 x 3300 MHz, 45 W? MHz1900 MHz
AMD Ryzen 5 PRO 6650HS6 x 3300 MHz, 35 W? MHz1900 MHz
min. - max.? - 300 MHz800 - 1900 MHz
CPU in HD Graphics (Bay Trail)GPU Base SpeedGPU Boost / Turbo
Intel Pentium N35404 x 2160 MHz, 7.5 W313 MHz896 MHz
Intel Pentium J29004 x 2410 MHz, 10 W688 MHz896 MHz
Intel Pentium N35304 x 2160 MHz, 7.5 W313 MHz896 MHz
min. - max.311 - ? MHz400 - 1900 MHz

Benchmarks

Performance Rating - 3DMark 11 + Fire Strike + Time Spy - HD Graphics 5300
0.2 pt (1%)
Performance Rating - 3DMark 11 + Fire Strike + Time Spy - Radeon 660M
2.2 pt (7%)
Performance Rating - 3DMark 11 + Fire Strike + Time Spy - HD Graphics (Bay Trail)
0.1 pt (0%)
3DMark - 3DMark Time Spy Score
min: 1153     avg: 1631     median: 1714.5 (5%)     max: 1793 Points
3DMark - 3DMark Time Spy Graphics
min: 1016     avg: 1442     median: 1544 (4%)     max: 1588 Points
3DMark - 3DMark Ice Storm Unlimited Graphics
min: 39138     avg: 55907     median: 59555 (6%)     max: 65380 Points
283076 Points (29%)
3DMark - 3DMark Ice Storm Extreme Graphics
min: 19630     avg: 24597     median: 24597 (3%)     max: 29564 Points
102211 Points (13%)
min: 18216     avg: 22289     median: 22811 (24%)     max: 24842 Points
min: 354     avg: 1182     median: 1188 (1%)     max: 1703 Points
min: 21857     avg: 30318     median: 31514.5 (8%)     max: 33949 Points
min: 362     avg: 1230     median: 1228.5 (0%)     max: 1670 Points
min: 3216     avg: 4184     median: 4472 (8%)     max: 4664 Points
min: 83     avg: 185     median: 147 (0%)     max: 495 Points
min: 3447     avg: 4521     median: 4848 (5%)     max: 4993 Points
min: 156497     avg: 205151     median: 195922 (23%)     max: 272265 Points
min: 5056     avg: 15391     median: 16047 (2%)     max: 21351 Points
3DMark - 3DMark Sling Shot (ES 3.0)
0 Points (0%)
3DMark - 3DMark Sling Shot Extreme (ES 3.1)
0 Points (0%)
3DMark 11 - 3DM11 Performance Score
min: 498     avg: 721     median: 731 (1%)     max: 973 Points
min: 4904     avg: 6712     median: 7067 (10%)     max: 7680 Points
min: 143     avg: 222.6     median: 216 (0%)     max: 280 Points
3DMark 11 - 3DM11 Performance GPU
min: 458     avg: 648     median: 647 (1%)     max: 885 Points
min: 4636     avg: 6332     median: 6743 (6%)     max: 7184 Points
min: 122     avg: 192.1     median: 186.5 (0%)     max: 237 Points
3DMark Vantage
3DM Vant. Perf. total + Intel HD Graphics 5300
3DMark Vantage - 3DM Vant. Perf. total
min: 2966     avg: 3104     median: 3104 (1%)     max: 3242 Points
3DM Vant. Perf. total + AMD Radeon 660M
min: 22854     avg: 23222     median: 23222 (7%)     max: 23590 Points
3DM Vant. Perf. total + Intel HD Graphics (Bay Trail)
3DM Vant. Perf. GPU no PhysX + Intel HD Graphics 5300
3DMark Vantage - 3DM Vant. Perf. GPU no PhysX
min: 2538     avg: 2914     median: 2913.5 (2%)     max: 3289 Points
3DM Vant. Perf. GPU no PhysX + AMD Radeon 660M
min: 20168     avg: 20571     median: 20570.5 (11%)     max: 20973 Points
3DM Vant. Perf. GPU no PhysX + Intel HD Graphics (Bay Trail)
3DMark 2001SE - 3DMark 2001 - Standard
7727 Points (8%)
3DMark 03 - 3DMark 03 - Standard
min: 4226     avg: 4997     median: 5220 (3%)     max: 5323 Points
3DMark 05 - 3DMark 05 - Standard
43616 Points (48%)
min: 2666     avg: 3195     median: 3331 (4%)     max: 3445 Points
3DMark 06 3DMark 06 - Standard 1280x1024 + Intel HD Graphics 5300
3DMark 06
min: 3951     avg: 5044     median: 4775 (6%)     max: 6754 Points
3DMark 06 - Standard 1280x1024 + AMD Radeon 660M
min: 27171     avg: 27876     median: 27876 (36%)     max: 28581 Points
3DMark 06 - Standard 1280x1024 + Intel HD Graphics (Bay Trail)
min: 814     avg: 1785     median: 1866 (2%)     max: 2151 Points
3DMark 06 - Score Unknown Settings + Intel HD Graphics (Bay Trail)
3DMark 06
2108 Points (3%)
3DMark 06 - Standard 1280x800 + Intel HD Graphics (Bay Trail)
3DMark 06
2087 Points (3%)
Unigine Valley 1.0 - Unigine Valley 1.0 DX
10.9 fps (3%)
Unigine Heaven 3.0 - Unigine Heaven 3.0 DX 11
7.6 fps (3%)
Unigine Heaven 2.1 - Heaven 2.1 high
min: 2.4     avg: 2.8     median: 2.8 (1%)     max: 3.4 fps
Blender - Blender 3.3 Classroom HIP *
min: 438     avg: 561     median: 548 (45%)     max: 755 Seconds
SPECviewperf 12
specvp12 sw-03 + Intel HD Graphics 5300
SPECviewperf 12 - specvp12 sw-03
min: 0.97     avg: 4.7     median: 4.7 (1%)     max: 8.44 fps
specvp12 sw-03 + AMD Radeon 660M
74.6 fps (19%)
specvp12 snx-02 + Intel HD Graphics 5300
SPECviewperf 12 - specvp12 snx-02
min: 1.07     avg: 1.2     median: 1.2 (0%)     max: 1.28 fps
specvp12 snx-02 + AMD Radeon 660M
42.4 fps (6%)
specvp12 showcase-01 + Intel HD Graphics 5300
SPECviewperf 12 - specvp12 showcase-01
min: 2.69     avg: 4.7     median: 4.7 (1%)     max: 6.69 fps
specvp12 showcase-01 + AMD Radeon 660M
22.8 fps (5%)
specvp12 mediacal-01 + Intel HD Graphics 5300
SPECviewperf 12 - specvp12 mediacal-01
min: 0.58     avg: 0.8     median: 0.8 (0%)     max: 1.1 fps
specvp12 mediacal-01 + AMD Radeon 660M
25.8 fps (7%)
specvp12 maya-04 + Intel HD Graphics 5300
SPECviewperf 12 - specvp12 maya-04
min: 2.13     avg: 4     median: 4 (1%)     max: 5.79 fps
specvp12 maya-04 + AMD Radeon 660M
44.4 fps (12%)
specvp12 energy-01 + Intel HD Graphics 5300
SPECviewperf 12 - specvp12 energy-01
min: 0.04     avg: 4.5     median: 4.5 (4%)     max: 9 fps
specvp12 energy-01 + AMD Radeon 660M
51.1 fps (46%)
specvp12 creo-01 + Intel HD Graphics 5300
SPECviewperf 12 - specvp12 creo-01
min: 0.91     avg: 2.8     median: 2.8 (1%)     max: 4.73 fps
specvp12 creo-01 + AMD Radeon 660M
39.3 fps (16%)
specvp12 catia-04 + Intel HD Graphics 5300
SPECviewperf 12 - specvp12 catia-04
5.5 fps (1%)
specvp12 catia-04 + AMD Radeon 660M
45 fps (7%)
specvp12 3dsmax-05 + AMD Radeon 660M
SPECviewperf 12 - specvp12 3dsmax-05
55.8 fps (10%)
SPECviewperf 13 specvp13 sw-04 + AMD Radeon 660M
SPECviewperf 13 - specvp13 sw-04
66.6 fps (18%)
specvp13 snx-03 + AMD Radeon 660M
SPECviewperf 13 - specvp13 snx-03
72.7 fps (8%)
specvp13 showcase-02 + AMD Radeon 660M
SPECviewperf 13 - specvp13 showcase-02
23.9 fps (5%)
specvp13 medical-02 + AMD Radeon 660M
SPECviewperf 13 - specvp13 medical-02
24.9 fps (5%)
specvp13 maya-05 + AMD Radeon 660M
SPECviewperf 13 - specvp13 maya-05
62.6 fps (7%)
specvp13 energy-02 + AMD Radeon 660M
SPECviewperf 13 - specvp13 energy-02
6.2 fps (2%)
specvp13 creo-02 + AMD Radeon 660M
SPECviewperf 13 - specvp13 creo-02
53.8 fps (8%)
specvp13 catia-05 + AMD Radeon 660M
SPECviewperf 13 - specvp13 catia-05
56.9 fps (6%)
specvp13 3dsmax-06 + AMD Radeon 660M
SPECviewperf 13 - specvp13 3dsmax-06
51.7 fps (9%)
SPECviewperf 2020 specvp2020 snx-04 4k + AMD Radeon 660M
SPECviewperf 2020 - specvp2020 snx-04 4k
42.1 fps (4%)
specvp2020 medical-03 4k + AMD Radeon 660M
SPECviewperf 2020 - specvp2020 medical-03 4k
5.2 fps (5%)
specvp2020 maya-06 4k + AMD Radeon 660M
SPECviewperf 2020 - specvp2020 maya-06 4k
27 fps (4%)
specvp2020 energy-03 4k + AMD Radeon 660M
SPECviewperf 2020 - specvp2020 energy-03 4k
4.7 fps (1%)
specvp2020 creo-03 4k + AMD Radeon 660M
SPECviewperf 2020 - specvp2020 creo-03 4k
19.8 fps (9%)
specvp2020 catia-06 4k + AMD Radeon 660M
SPECviewperf 2020 - specvp2020 catia-06 4k
14.2 fps (9%)
specvp2020 3dsmax-07 4k + AMD Radeon 660M
SPECviewperf 2020 - specvp2020 3dsmax-07 4k
10.8 fps (5%)
Cinebench R10 Cinebench R10 Shading (32bit) + Intel HD Graphics 5300
Cinebench R10 - Cinebench R10 Shading (32bit)
min: 2978     avg: 4412     median: 4018 (3%)     max: 6679 Points
Cinebench R10 Shading (32bit) + AMD Radeon 660M
min: 12942     avg: 13243     median: 13243 (9%)     max: 13544 Points
Cinebench R10 Shading (32bit) + Intel HD Graphics (Bay Trail)
min: 898     avg: 2014     median: 1991.5 (1%)     max: 2889 Points
Cinebench R11.5 Cinebench R11.5 OpenGL 64 Bit + Intel HD Graphics 5300
Cinebench R11.5 - Cinebench R11.5 OpenGL 64 Bit
min: 11.6     avg: 16.4     median: 15.9 (5%)     max: 23.2 fps
Cinebench R11.5 OpenGL 64 Bit + AMD Radeon 660M
114.4 fps (38%)
Cinebench R11.5 OpenGL 64 Bit + Intel HD Graphics (Bay Trail)
min: 0.37     avg: 6.2     median: 6.4 (2%)     max: 7.69 fps
Cinebench R15
Cinebench R15 OpenGL 64 Bit + Intel HD Graphics 5300
Cinebench R15 - Cinebench R15 OpenGL 64 Bit
min: 16.04     avg: 19     median: 18.4 (1%)     max: 23.64 fps
Cinebench R15 OpenGL 64 Bit + AMD Radeon 660M
min: 93.3     avg: 120.8     median: 121.3 (7%)     max: 154.4 fps
Cinebench R15 OpenGL 64 Bit + Intel HD Graphics (Bay Trail)
min: 2.88     avg: 5     median: 5.5 (0%)     max: 6.55 fps
Cinebench R15 OpenGL Ref. Match 64 Bit + Intel HD Graphics 5300
Cinebench R15 - Cinebench R15 OpenGL Ref. Match 64 Bit
min: 98     avg: 98.1     median: 98 (98%)     max: 99.3 %
Cinebench R15 OpenGL Ref. Match 64 Bit + AMD Radeon 660M
min: 97.9     avg: 97.9     median: 97.9 (98%)     max: 98 %
Cinebench R15 OpenGL Ref. Match 64 Bit + Intel HD Graphics (Bay Trail)
min: 63     avg: 96.1     median: 97.8 (98%)     max: 97.8 %
GFXBench - GFXBench 5.0 4K Aztec Ruins High Tier Offscreen
min: 10.6     avg: 14.7     median: 14.7 (6%)     max: 18.7 fps
GFXBench - GFXBench 5.0 Aztec Ruins High Tier Offscreen
min: 22.9     avg: 33.5     median: 33.5 (6%)     max: 44.1 fps
GFXBench - GFXBench 5.0 Aztec Ruins Normal Tier Offscreen
min: 63.9     avg: 86     median: 86 (6%)     max: 108.1 fps
GFXBench - GFXBench Car Chase Offscreen
69.4 fps (8%)
GFXBench 3.1 - GFXBench Manhattan ES 3.1 Offscreen
93.3 fps (2%)
GFXBench 3.0 - GFXBench 3.0 Manhattan Offscreen
min: 26.7     avg: 30.3     median: 30.1 (2%)     max: 34.1 fps
104.3 fps (6%)
GFXBench (DX / GLBenchmark) 2.7
GFXBench T-Rex HD Offscreen C24Z16 + Intel HD Graphics 5300
GFXBench (DX / GLBenchmark) 2.7 - GFXBench T-Rex HD Offscreen C24Z16
min: 39.4     avg: 54.4     median: 55 (0%)     max: 66.2 fps
GFXBench T-Rex HD Offscreen C24Z16 + AMD Radeon 660M
258.5 fps (2%)
GFXBench T-Rex HD Offscreen C24Z16 + Intel HD Graphics (Bay Trail)
Basemark ES 2.0 - Basemark ES 2.0
min: 45.08     avg: 49.1     median: 49.1 (81%)     max: 53.1 fps
Basemark X 1.0 - Basemark X 1.0 Off-Screen
10.1 fps (48%)
Basemark X 1.1 - Basemark X 1.1 High Quality
min: 3008     avg: 6663     median: 8456 (19%)     max: 8524 Points
Basemark X 1.1 - Basemark X 1.1 Medium Quality
min: 4802     avg: 12880     median: 14509 (32%)     max: 17701 Points
Basemark GPU 1.2 - Basemark GPU 1.2 Vulkan Official Medium Offscreen 1080
min: 104.6     avg: 128.2     median: 114.6 (1%)     max: 178.9 fps
Basemark GPU 1.2 - Basemark GPU 1.2 Vulkan Official High Offscreen 2160
3.6 fps (1%)
NenaMark2 - NenaMark2 Score
min: 59     avg: 59.4     median: 59.4 (88%)     max: 59.7 fps
Geekbench 6.2 - Geekbench 6.2 GPU OpenCL
min: 13189     avg: 14723     median: 15012 (4%)     max: 15678 Points
Geekbench 6.2 - Geekbench 6.2 GPU Vulkan
min: 14297     avg: 16531     median: 16743.5 (5%)     max: 18338 Points
LuxMark v2.0 64Bit - LuxMark v2.0 Room GPU
min: 93     avg: 116.7     median: 112 (1%)     max: 145 Samples/s
min: 187     avg: 270     median: 270 (1%)     max: 353 Samples/s
min: 25     avg: 28.5     median: 27 (0%)     max: 35 Samples/s
LuxMark v2.0 64Bit - LuxMark v2.0 Sala GPU
min: 180     avg: 228.7     median: 210 (0%)     max: 296 Samples/s
min: 785     avg: 822     median: 822 (1%)     max: 859 Samples/s
min: 26     avg: 29     median: 29 (0%)     max: 34 Samples/s
ComputeMark v2.1 - ComputeMark v2.1 Result
min: 460     avg: 519     median: 518.5 (1%)     max: 577 Points
min: 3416     avg: 3428     median: 3427.5 (4%)     max: 3439 Points
min: 160     avg: 172.8     median: 174 (0%)     max: 192 Points
PassMark PerformanceTest Mobile V1 - PerformanceTest Mobile V1 2D Graphics Tests
min: 3822     avg: 4036     median: 3866 (1%)     max: 4588 Points
PassMark PerformanceTest Mobile V1 - PerformanceTest Mobile V1 3D Graphics Tests
min: 1058     avg: 1251     median: 1228 (2%)     max: 1488 Points
Power Consumption - Furmark Stress Test Power Consumption - external Monitor *
min: 28.3     avg: 40.4     median: 40.7 (6%)     max: 54.7 Watt
Power Consumption - The Witcher 3 Power Consumption - external Monitor *
min: 24.8     avg: 37.5     median: 38.4 (5%)     max: 47.3 Watt
Power Consumption - Witcher 3 Power Consumption *
min: 27.6     avg: 38.3     median: 39.7 (9%)     max: 47.3 Watt
Power Consumption - Witcher 3 ultra Power Efficiency
min: 0.3575     avg: 0.4     median: 0.4 (34%)     max: 0.4565 fps per Watt
Power Consumption - Witcher 3 ultra Power Efficiency - external Monitor
min: 0.3158     avg: 0.4     median: 0.4 (32%)     max: 0.508 fps per Watt
Power Consumption - Cyberpunk 2077 Power Consumption 150cd *
min: 36.6     avg: 38.1     median: 38.1 (12%)     max: 39.6 Watt
Power Consumption - Cyberpunk 2077 Power Consumption - external Monitor *
min: 35.6     avg: 38     median: 38 (5%)     max: 40.4 Watt
Power Consumption - Cyberpunk 2077 ultra Power Efficiency
0.2 fps per Watt (28%)
Emissions Witcher 3 Fan Noise + AMD Radeon 660M
Emissions - Witcher 3 Fan Noise
min: 35     avg: 38.6     median: 38 (61%)     max: 48.5 dB(A)
Clock Speed - GPU Clock Witcher 3 ultra
1900 MHz (75%)

Average Benchmarks Intel HD Graphics 5300 → 100% n=21

Average Benchmarks AMD Radeon 660M → 630% n=21

Average Benchmarks Intel HD Graphics (Bay Trail) → 35% n=21

- Bereich der Benchmarkergebnisse für diese Grafikkarte
- Durchschnittliche Benchmarkergebnisse für diese Grafikkarte
* Smaller numbers mean a higher performance
1 This benchmark is not used for the average calculation

Spiele-Benchmarks

Die folgenden Benchmarks basieren auf unseren Spieletests mit Testnotebooks. Die Performance dieser Grafikkarte bei den gelisteten Spielen ist abhängig von der verwendeten CPU, Speicherausstattung, Treiber und auch Betriebssystem. Dadurch müssen die untenstehenden Werte nicht repräsentativ sein. Detaillierte Informationen über das verwendete System sehen Sie nach einem Klick auf den fps-Wert.

F1 24

F1 24

2024
low 1920x1080
Radeon 660M:
31.6 31.6 42.2 ~ 35 fps
med. 1920x1080
Radeon 660M:
26.8 26.8 35.5 ~ 30 fps
high 1920x1080
Radeon 660M:
19.8 25.6 ~ 23 fps
ultra 1920x1080
Radeon 660M:
5.6  fps
low 1920x1080
Radeon 660M:
14.9 22.9 24.3 ~ 21 fps
med. 1920x1080
Radeon 660M:
11.5 17.4 18.1 ~ 16 fps
high 1920x1080
Radeon 660M:
8.9 11 11.6 13.2 ~ 11 fps
ultra 1920x1080
Radeon 660M:
7.8 11.2 ~ 9 fps
low 1920x1080
Radeon 660M:
16.5 22 22.9 ~ 20 fps
med. 1920x1080
Radeon 660M:
12.8 14 15.1 ~ 14 fps
high 1920x1080
Radeon 660M:
10.3 13 13.3 ~ 12 fps
ultra 1920x1080
Radeon 660M:
10 12 12.6 ~ 12 fps
F1 23

F1 23

2023
low 1920x1080
Radeon 660M:
49.6  fps
med. 1920x1080
Radeon 660M:
42.7  fps
high 1920x1080
Radeon 660M:
29.2  fps
Diablo 4

Diablo 4

2023
low 1920x1080
Radeon 660M:
34.6  fps
med. 1920x1080
Radeon 660M:
27.6  fps
high 1920x1080
Radeon 660M:
26  fps
ultra 1920x1080
Radeon 660M:
23.9  fps
low 1920x1080
Radeon 660M:
11.5  fps
med. 1920x1080
Radeon 660M:
10.2  fps
low 1920x1080
Radeon 660M:
36.8  fps
med. 1920x1080
Radeon 660M:
30.1  fps
high 1920x1080
Radeon 660M:
22.3  fps
ultra 1920x1080
Radeon 660M:
14.6  fps
low 1920x1080
Radeon 660M:
17.7  fps
med. 1920x1080
Radeon 660M:
13.2  fps
high 1920x1080
Radeon 660M:
11.1  fps
low 1920x1080
Radeon 660M:
20.1  fps
med. 1920x1080
Radeon 660M:
14.7  fps
high 1920x1080
Radeon 660M:
0 (!)  fps
low 1920x1080
Radeon 660M:
23.7  fps
med. 1920x1080
Radeon 660M:
22  fps
high 1920x1080
Radeon 660M:
15.9  fps
low 1920x1080
Radeon 660M:
24.7  fps
med. 1920x1080
Radeon 660M:
16.7  fps
high 1920x1080
Radeon 660M:
15.3  fps
ultra 1920x1080
Radeon 660M:
14.8  fps
low 1920x1080
Radeon 660M:
29  fps
med. 1920x1080
Radeon 660M:
22.9  fps
high 1920x1080
Radeon 660M:
13  fps
ultra 1920x1080
Radeon 660M:
10.2  fps
Returnal

Returnal

2023
low 1920x1080
Radeon 660M:
16  fps
med. 1920x1080
Radeon 660M:
15  fps
high 1920x1080
Radeon 660M:
13  fps
low 1920x1080
Radeon 660M:
23.3  fps
med. 1920x1080
Radeon 660M:
17.2  fps
high 1920x1080
Radeon 660M:
12.8  fps
ultra 1920x1080
Radeon 660M:
10.3  fps
low 1920x1080
Radeon 660M:
31.8  fps
med. 1920x1080
Radeon 660M:
25.3  fps
high 1920x1080
Radeon 660M:
10.1  fps
low 1920x1080
Radeon 660M:
37.8  fps
med. 1920x1080
Radeon 660M:
23.3  fps
high 1920x1080
Radeon 660M:
19.2  fps
ultra 1920x1080
Radeon 660M:
14.5  fps
low 1920x1080
Radeon 660M:
26.7  fps
med. 1920x1080
Radeon 660M:
18.5  fps
high 1920x1080
Radeon 660M:
17.9  fps
ultra 1920x1080
Radeon 660M:
10.3  fps
low 1920x1080
Radeon 660M:
29.3  fps
med. 1920x1080
Radeon 660M:
24.1  fps
high 1920x1080
Radeon 660M:
18.6  fps
ultra 1920x1080
Radeon 660M:
17.6  fps
low 1920x1080
Radeon 660M:
27.3  fps
med. 1920x1080
Radeon 660M:
22.6  fps
high 1920x1080
Radeon 660M:
20.2  fps
low 1920x1080
Radeon 660M:
25 28 ~ 27 fps
med. 1920x1080
Radeon 660M:
21 26 ~ 24 fps
high 1920x1080
Radeon 660M:
15 19 ~ 17 fps
ultra 1920x1080
Radeon 660M:
14 17 ~ 16 fps
low 1920x1080
Radeon 660M:
12.3  fps
med. 1920x1080
Radeon 660M:
11.4  fps
high 1920x1080
Radeon 660M:
9.6  fps
low 1920x1080
Radeon 660M:
9.4  fps
med. 1920x1080
Radeon 660M:
7.8  fps
high 1920x1080
Radeon 660M:
6.7  fps
low 1920x1080
Radeon 660M:
24.5  fps
med. 1920x1080
Radeon 660M:
18  fps
high 1920x1080
Radeon 660M:
14.4  fps
F1 22

F1 22

2022
low 1920x1080
Radeon 660M:
42.4 44.7 48 58.3 ~ 48 fps
med. 1920x1080
Radeon 660M:
37 40.2 42 52.3 ~ 43 fps
high 1920x1080
Radeon 660M:
26.2 27.2 28 37.2 ~ 30 fps
ultra 1920x1080
Radeon 660M:
5.1 5.9 8.4 ~ 6 fps
low 1920x1080
Radeon 660M:
0 (!) 45.7 ~ 23 fps
med. 1920x1080
Radeon 660M:
0 (!) 24.6 ~ 12 fps
high 1920x1080
Radeon 660M:
0 (!) 24.4 ~ 12 fps
ultra 1920x1080
Radeon 660M:
22.4  fps
low 1920x1080
Radeon 660M:
16.1 25.9 ~ 21 fps
med. 1920x1080
Radeon 660M:
24  fps
high 1920x1080
Radeon 660M:
23.9  fps
low 1920x1080
Radeon 660M:
26.9 34.2 40 ~ 34 fps
med. 1920x1080
Radeon 660M:
19.7 27 31.3 ~ 26 fps
high 1920x1080
Radeon 660M:
12.6 17.6 20.5 ~ 17 fps
ultra 1920x1080
Radeon 660M:
9.6 15.6 ~ 13 fps
low 1920x1080
Radeon 660M:
20.3 27 ~ 24 fps
med. 1920x1080
Radeon 660M:
15 24 ~ 20 fps
high 1920x1080
Radeon 660M:
12.2 15 ~ 14 fps
Elex 2

Elex 2

2022
low 1920x1080
Radeon 660M:
22.5 33.5 ~ 28 fps
med. 1920x1080
Radeon 660M:
19.3 25.8 ~ 23 fps
high 1920x1080
Radeon 660M:
15.8 22.8 ~ 19 fps
low 1920x1080
Radeon 660M:
49.6 71 ~ 60 fps
med. 1920x1080
Radeon 660M:
36.5 53.4 ~ 45 fps
high 1920x1080
Radeon 660M:
27.4 40.4 ~ 34 fps
ultra 1920x1080
Radeon 660M:
19.5  fps
low 1920x1080
Radeon 660M:
39.6  fps
med. 1920x1080
Radeon 660M:
29.9  fps
high 1920x1080
Radeon 660M:
26.9  fps
low 1920x1080
Radeon 660M:
19.7  fps
med. 1920x1080
Radeon 660M:
15.4  fps
high 1920x1080
Radeon 660M:
12.4  fps
low 1920x1080
Radeon 660M:
45  fps
med. 1920x1080
Radeon 660M:
35  fps
high 1920x1080
Radeon 660M:
30  fps
low 1920x1080
Radeon 660M:
16 21.7 23.9 ~ 21 fps
med. 1920x1080
Radeon 660M:
12.6 17.5 18.9 ~ 16 fps
high 1920x1080
Radeon 660M:
10 12.6 16.1 ~ 13 fps
ultra 1920x1080
Radeon 660M:
10.8  fps
low 1280x720
Radeon 660M:
39.6  fps
med. 1920x1080
Radeon 660M:
20.3  fps
high 1920x1080
Radeon 660M:
17.1  fps
low 1280x720
Radeon 660M:
102  fps
med. 1920x1080
Radeon 660M:
57.1  fps
high 1920x1080
Radeon 660M:
38.9  fps
low 1280x720
Radeon 660M:
92  fps
med. 1920x1080
Radeon 660M:
39  fps
high 1920x1080
Radeon 660M:
32  fps
low 1280x720
Radeon 660M:
56  fps
med. 1920x1080
Radeon 660M:
30  fps
high 1920x1080
Radeon 660M:
23  fps
low 1280x720
Radeon 660M:
0 (!)  fps
med. 1920x1080
Radeon 660M:
0 (!)  fps
high 1920x1080
Radeon 660M:
0 (!)  fps
low 1280x720
Radeon 660M:
104.3  fps
med. 1920x1080
Radeon 660M:
40.4  fps
high 1920x1080
Radeon 660M:
34.3  fps
Far Cry 6

Far Cry 6

2021
low 1280x720
Radeon 660M:
50 58.5 ~ 54 fps
med. 1920x1080
Radeon 660M:
21 25.6 ~ 23 fps
high 1920x1080
Radeon 660M:
18 21.8 ~ 20 fps
ultra 1920x1080
Radeon 660M:
18.3  fps
low 1280x720
Radeon 660M:
53.6  fps
med. 1920x1080
Radeon 660M:
32.7  fps
high 1920x1080
Radeon 660M:
26.4  fps
Deathloop

Deathloop

2021
low 1280x720
Radeon 660M:
45.5  fps
med. 1920x1080
Radeon 660M:
23.3  fps
high 1920x1080
Radeon 660M:
18.1  fps
F1 2021

F1 2021

2021
low 1280x720
Radeon 660M:
103.8 109.5 ~ 107 fps
med. 1920x1080
Radeon 660M:
44.4 47.3 ~ 46 fps
high 1920x1080
Radeon 660M:
35.2 36 ~ 36 fps
ultra 1920x1080
Radeon 660M:
14.1 14.7 ~ 14 fps
Days Gone

Days Gone

2021
low 1280x720
Radeon 660M:
50  fps
med. 1920x1080
Radeon 660M:
25.3  fps
high 1920x1080
Radeon 660M:
22.2  fps
low 1280x720
Radeon 660M:
70  fps
ultra 1920x1080
Radeon 660M:
38.9  fps
low 1280x720
Radeon 660M:
75.3  fps
med. 1920x1080
Radeon 660M:
33.4  fps
high 1920x1080
Radeon 660M:
29.9  fps
Outriders

Outriders

2021
low 1280x720
Radeon 660M:
35.3  fps
med. 1920x1080
Radeon 660M:
30.4  fps
high 1920x1080
Radeon 660M:
27.9  fps
Hitman 3

Hitman 3

2021
low 1280x720
Radeon 660M:
91.1  fps
med. 1920x1080
Radeon 660M:
34.5  fps
high 1920x1080
Radeon 660M:
30.5  fps
low 1280x720
Radeon 660M:
64.7  fps
med. 1920x1080
Radeon 660M:
21.2  fps
high 1920x1080
Radeon 660M:
21.1  fps
low 1280x720
Radeon 660M:
52  fps
med. 1920x1080
Radeon 660M:
26  fps
high 1920x1080
Radeon 660M:
19  fps
Dirt 5

Dirt 5

2020
low 1280x720
Radeon 660M:
68.6  fps
med. 1920x1080
Radeon 660M:
24.2  fps
high 1920x1080
Radeon 660M:
17.8  fps
low 1280x720
Radeon 660M:
49  fps
med. 1920x1080
Radeon 660M:
26  fps
high 1920x1080
Radeon 660M:
22  fps
low 1280x720
Radeon 660M:
170.4  fps
med. 1920x1080
Radeon 660M:
66.6  fps
high 1920x1080
Radeon 660M:
57.4  fps
low 1280x720
Radeon 660M:
48.2  fps
med. 1920x1080
Radeon 660M:
20.7  fps
high 1920x1080
Radeon 660M:
19.1  fps
low 1280x720
Radeon 660M:
113  fps
med. 1920x1080
Radeon 660M:
29.2  fps
high 1920x1080
Radeon 660M:
24.1  fps
low 1280x720
Radeon 660M:
88.1  fps
med. 1920x1080
Radeon 660M:
39.2  fps
high 1920x1080
Radeon 660M:
10.9  fps
low 1280x720
Radeon 660M:
41.6  fps
med. 1920x1080
Radeon 660M:
14.2  fps
high 1920x1080
Radeon 660M:
10.4  fps
low 1280x720
Radeon 660M:
58.1  fps
med. 1920x1080
Radeon 660M:
30.6  fps
high 1920x1080
Radeon 660M:
29.1  fps
F1 2020

F1 2020

2020
low 1280x720
Radeon 660M:
102.1  fps
med. 1920x1080
Radeon 660M:
44.6  fps
high 1920x1080
Radeon 660M:
32.3  fps
ultra 1920x1080
Radeon 660M:
22.2  fps
low 1280x720
Radeon 660M:
132  fps
med. 1920x1080
Radeon 660M:
47.4  fps
high 1920x1080
Radeon 660M:
28.5  fps
low 1280x720
Radeon 660M:
86.9  fps
med. 1920x1080
Radeon 660M:
36.2  fps
high 1920x1080
Radeon 660M:
34.2  fps
low 1280x720
Radeon 660M:
70.8  fps
med. 1920x1080
Radeon 660M:
24.2  fps
high 1920x1080
Radeon 660M:
19.2  fps
low 1280x720
Radeon 660M:
49  fps
med. 1920x1080
Radeon 660M:
20.5  fps
high 1920x1080
Radeon 660M:
13.6  fps
ultra 1920x1080
Radeon 660M:
10.7  fps
low 1280x720
Radeon 660M:
58  fps
med. 1920x1080
Radeon 660M:
32  fps
high 1920x1080
Radeon 660M:
29  fps
ultra 1920x1080
Radeon 660M:
27  fps
low 1280x720
Radeon 660M:
48  fps
med. 1920x1080
Radeon 660M:
18.8  fps
high 1920x1080
Radeon 660M:
14.4  fps
ultra 1920x1080
Radeon 660M:
11.2  fps
low 1280x720
Radeon 660M:
69.3 77 ~ 73 fps
med. 1920x1080
Radeon 660M:
22.2 29 ~ 26 fps
high 1920x1080
Radeon 660M:
17.3 27 ~ 22 fps
ultra 1920x1080
Radeon 660M:
13.4 23 ~ 18 fps
Strange Brigade

Strange Brigade

2018
low 1280x720
Radeon 660M:
70.2 99.5 99.9 114.4 117.4 117.7 120.2 120.7 ~ 108 fps
med. 1920x1080
Radeon 660M:
26.8 37.8 38.6 40 43 43.3 43.3 44.5 ~ 40 fps
high 1920x1080
Radeon 660M:
21.4 29.5 31.5 32.7 33.9 35 35.3 35.9 ~ 32 fps
ultra 1920x1080
Radeon 660M:
18.4 24.3 25.5 26.7 28.6 29 29.6 29.7 ~ 26 fps
Far Cry 5

Far Cry 5

2018
low 1280x720
Radeon 660M:
38 55 61 62 63 71 ~ 58 fps
med. 1920x1080
Radeon 660M:
18 26 29 30 31 33 ~ 28 fps
high 1920x1080
Radeon 660M:
16 23 26 26 29 30 ~ 25 fps
ultra 1920x1080
Radeon 660M:
16 22 25 26 27 ~ 23 fps
low 1280x720
Radeon 660M:
34.8 36 38.4 38.5 48.2 49.1 49.2 50.6 51.8 ~ 44 fps
med. 1920x1080
Radeon 660M:
24.2 25 27.4 28.3 33.7 35.6 36.7 37.4 38.5 ~ 32 fps
high 1920x1080
Radeon 660M:
22.1 23 25.1 25.4 29.3 30.8 30.8 33.2 33.8 ~ 28 fps
low 1280x720
Radeon 660M:
33.1 33.6 40.9 43.8 44.9 45.5 48.3 51.6 53.4 ~ 44 fps
med. 1920x1080
Radeon 660M:
16 16.2 19.8 20.7 21.9 23.7 23.8 24.3 24.7 ~ 21 fps
high 1920x1080
Radeon 660M:
11.1 11.4 14.5 15 16 16.3 17.2 17.4 17.9 ~ 15 fps
low 1280x720
HD Graphics (Bay Trail):
26.7  fps
med. 1366x768
HD Graphics (Bay Trail):
23.4  fps
Dirt 4

Dirt 4

2017
low 1280x720
HD Graphics (Bay Trail):
6  fps
low 1280x720
HD Graphics (Bay Trail):
12.6  fps
low 1280x720
100%
HD Graphics 5300:
12.2  fps
med. 1366x768
100%
HD Graphics 5300:
6.9  fps
low 1280x720
100%
HD Graphics 5300:
9.1  fps
med. 1366x768
100%
HD Graphics 5300:
7.7  fps
low 1280x720
100%
HD Graphics 5300:
4.7  fps
med. 1366x768
100%
HD Graphics 5300:
2.1  fps
low 1280x720
100%
HD Graphics 5300:
10.8  fps
med. 1366x768
100%
HD Graphics 5300:
7.3  fps
low 1280x720
100%
HD Graphics 5300:
8  fps
med. 1920x1080
100%
HD Graphics 5300:
3  fps
XCOM 2

XCOM 2

2016
low 1280x720
100%
HD Graphics 5300:
5.7  fps
med. 1920x1080
100%
HD Graphics 5300:
2.4  fps
low 1024x768
100%
HD Graphics 5300:
6.6  fps
med. 1366x768
100%
HD Graphics 5300:
3.9  fps
low 1024x768
100%
HD Graphics 5300:
13.2  fps
med. 1366x768
100%
HD Graphics 5300:
8.5  fps
high 1920x1080
100%
HD Graphics 5300:
5  fps
low 1024x768
100%
HD Graphics 5300:
9.9  fps
med. 1366x768
100%
HD Graphics 5300:
7.7  fps
low 1024x768
100%
HD Graphics 5300:
13.8  fps
med. 1366x768
100%
HD Graphics 5300:
7.4  fps
low 1024x768
HD Graphics (Bay Trail):
0 (!)  fps
Anno 2205

Anno 2205

2015
low 1024x768
100%
HD Graphics 5300:
10.6  fps
med. 1366x768
100%
HD Graphics 5300:
6.1  fps
FIFA 16

FIFA 16

2015
low 1280x720
100%
HD Graphics 5300:
26.3  fps
high 1366x768
100%
HD Graphics 5300:
15.3  fps
low 1366x768
100%
HD Graphics 5300:
26  fps
47%
HD Graphics (Bay Trail):
12.1  fps
med. 1366x768
100%
HD Graphics 5300:
17.7  fps
high 1920x1080
100%
HD Graphics 5300:
8.4  fps
low 1024x768
100%
HD Graphics 5300:
20.6  fps
52%
HD Graphics (Bay Trail):
10.8  fps
med. 1366x768
100%
HD Graphics 5300:
12.4  fps
low 1280x720
Radeon 660M:
93.7 101 103.6 108.6 109.3 114.5 121.1 135.9 144.9 ~ 115 fps
HD Graphics (Bay Trail):
24.7  fps
med. 1366x768
Radeon 660M:
72.2 74.4 78.6 83.6 94.4 98.5 99.3 107.7 107.9 ~ 91 fps
HD Graphics (Bay Trail):
9.7  fps
high 1920x1080
Radeon 660M:
37.4 47.1 49.2 50.7 61 63.1 64.9 65.8 70 ~ 57 fps
HD Graphics (Bay Trail):
5.5  fps
ultra 1920x1080
Radeon 660M:
32.8 41.3 42.7 43.8 52.9 53.9 55.4 55.7 60.8 ~ 49 fps
HD Graphics (Bay Trail):
5.4  fps
low 1280x720
100%
HD Graphics 5300:
5  fps
med. 1366x768
100%
HD Graphics 5300:
4  fps
low 1024x768
100%
HD Graphics 5300:
6.2  fps
1355%
Radeon 660M:
61.7 76.8 82.2 86.7 90.5 93.2 98.2 ~ 84 fps
med. 1366x768
100%
HD Graphics 5300:
3.7  fps
1324%
Radeon 660M:
40.2 45.9 46.8 52.5 52.6 58.5 ~ 49 fps
high 1920x1080
Radeon 660M:
18.5 19.7 22.6 25.7 27.1 27.6 28.6 ~ 24 fps
ultra 1920x1080
Radeon 660M:
12.3 12.6 14.4 15.3 17.8 17.9 17.9 ~ 15 fps
low 1024x768
100%
HD Graphics 5300:
41  fps
56%
HD Graphics (Bay Trail):
22 24.2 ~ 23 fps
med. 1366x768
100%
HD Graphics 5300:
12.5  fps
48%
HD Graphics (Bay Trail):
0 (!) 12.5 ~ 6 fps
GTA V

GTA V

2015
low 1024x768
Radeon 660M:
92.6 93.8 118.8 128.8 128.9 132.5 133.9 142.9 ~ 122 fps
med. 1366x768
Radeon 660M:
80 83.6 99.7 103.2 116.1 118.5 120 124.9 ~ 106 fps
high 1920x1080
Radeon 660M:
23.1 23.6 31.2 33.9 36.4 40 40.5 40.7 ~ 34 fps
ultra 1920x1080
Radeon 660M:
9.7 10.3 14.1 14.2 14.5 17.2 18 18.9 ~ 15 fps
low 1024x768
100%
HD Graphics 5300:
15.3  fps
48%
HD Graphics (Bay Trail):
7.3  fps
med. 1366x768
100%
HD Graphics 5300:
11  fps
46%
HD Graphics (Bay Trail):
5.1  fps
high 1920x1080
100%
HD Graphics 5300:
5  fps
ultra 1920x1080
100%
HD Graphics 5300:
3.1  fps
Evolve

Evolve

2015
low 1024x768
100%
HD Graphics 5300:
7  fps
46%
HD Graphics (Bay Trail):
3.2  fps
med. 1366x768
100%
HD Graphics 5300:
5.1  fps
33%
HD Graphics (Bay Trail):
1.7  fps
high 1920x1080
100%
HD Graphics 5300:
2.8  fps
ultra 1920x1080
100%
HD Graphics 5300:
1.1  fps
The Crew

The Crew

2014
low 1280x720
HD Graphics (Bay Trail):
8.1  fps
med. 1366x768
HD Graphics (Bay Trail):
4.7  fps
low 1024x768
100%
HD Graphics 5300:
11 11.9 ~ 11 fps
64%
HD Graphics (Bay Trail):
7  fps
med. 1366x768
100%
HD Graphics 5300:
7.6 8.2 ~ 8 fps
58%
HD Graphics (Bay Trail):
4.6  fps
high 1920x1080
100%
HD Graphics 5300:
3 3.1 ~ 3 fps
ultra 1920x1080
100%
HD Graphics 5300:
1.6  fps
Far Cry 4

Far Cry 4

2014
low 1024x768
100%
HD Graphics 5300:
9.2  fps
61%
HD Graphics (Bay Trail):
5.6  fps
med. 1366x768
100%
HD Graphics 5300:
6.8  fps
56%
HD Graphics (Bay Trail):
3.8  fps
high 1920x1080
100%
HD Graphics 5300:
3.5  fps
ultra 1920x1080
100%
HD Graphics 5300:
1.7  fps
low 1024x768
HD Graphics (Bay Trail):
4.3  fps
med. 1366x768
HD Graphics (Bay Trail):
2.4  fps
low 1024x768
100%
HD Graphics 5300:
21.2  fps
52%
HD Graphics (Bay Trail):
9.6 11.5 ~ 11 fps
med. 1366x768
100%
HD Graphics 5300:
8.8  fps
49%
HD Graphics (Bay Trail):
4.3  fps
high 1920x1080
100%
HD Graphics 5300:
5.8  fps
ultra 1920x1080
100%
HD Graphics 5300:
4.5  fps
F1 2014

F1 2014

2014
low 1024x768
100%
HD Graphics 5300:
33 34 39 ~ 35 fps
37%
HD Graphics (Bay Trail):
12 14 ~ 13 fps
med. 1366x768
100%
HD Graphics 5300:
20 20 25 ~ 22 fps
55%
HD Graphics (Bay Trail):
12  fps
high 1920x1080
100%
HD Graphics 5300:
12 13 14 ~ 13 fps
ultra 1920x1080
100%
HD Graphics 5300:
12  fps
low 1024x768
100%
HD Graphics 5300:
8  fps
65%
HD Graphics (Bay Trail):
5.2  fps
med. 1366x768
100%
HD Graphics 5300:
6.5  fps
55%
HD Graphics (Bay Trail):
3.6  fps
low 1024x768
100%
HD Graphics 5300:
7.1  fps
52%
HD Graphics (Bay Trail):
3.7  fps
med. 1366x768
100%
HD Graphics 5300:
4.6  fps
54%
HD Graphics (Bay Trail):
2.5  fps
low 1024x768
100%
HD Graphics 5300:
17.8 20.1 23.9 ~ 21 fps
43%
HD Graphics (Bay Trail):
9.1  fps
med. 1366x768
100%
HD Graphics 5300:
11.6 13.9 15.9 ~ 14 fps
36%
HD Graphics (Bay Trail):
5.1  fps
high 1920x1080
100%
HD Graphics 5300:
6.6 7.6 8.5 ~ 8 fps
ultra 1920x1080
100%
HD Graphics 5300:
4.6  fps
low 1280x720
100%
HD Graphics 5300:
12.3 14.2 16.7 16.9 ~ 15 fps
57%
HD Graphics (Bay Trail):
8.5  fps
med. 1344x756
100%
HD Graphics 5300:
4.7 7.9 9.3 10 ~ 8 fps
76%
HD Graphics (Bay Trail):
6.1  fps
high 1920x1080
100%
HD Graphics 5300:
4.3 5 5.3 ~ 5 fps
Fifa 15

Fifa 15

2014
low 1280x720
100%
HD Graphics 5300:
19.1 21.1 28.2 ~ 23 fps
54%
HD Graphics (Bay Trail):
12.4  fps
high 1366x768
100%
HD Graphics 5300:
13.8 16.2 21.2 ~ 17 fps
50%
HD Graphics (Bay Trail):
8.5  fps
ultra 1920x1080
100%
HD Graphics 5300:
8.3  fps
Sims 4

Sims 4

2014
low 1024x768
100%
HD Graphics 5300:
91  fps
60%
HD Graphics (Bay Trail):
53.7 56 ~ 55 fps
med. 1366x768
100%
HD Graphics 5300:
17.6  fps
40%
HD Graphics (Bay Trail):
6.6 7 ~ 7 fps
high 1920x1080
100%
HD Graphics 5300:
8.5  fps
ultra 1920x1080
100%
HD Graphics 5300:
6.6  fps
low 1024x768
100%
HD Graphics 5300:
17.3  fps
49%
HD Graphics (Bay Trail):
8.4  fps
med. 1366x768
100%
HD Graphics 5300:
11.7  fps
50%
HD Graphics (Bay Trail):
5.9  fps
high 1920x1080
100%
HD Graphics 5300:
4.6  fps
low 1024x768
100%
HD Graphics 5300:
48.3 48.6 51.6 ~ 50 fps
74%
HD Graphics (Bay Trail):
31.6 41.8 ~ 37 fps
med. 1366x768
100%
HD Graphics 5300:
14 16.2 16.5 ~ 16 fps
81%
HD Graphics (Bay Trail):
12.5 12.5 ~ 13 fps
high 1920x1080
100%
HD Graphics 5300:
12.5 12.5 ~ 13 fps
ultra 1920x1080
100%
HD Graphics 5300:
12.5  fps
low 1024x768
HD Graphics (Bay Trail):
8.3  fps
med. 1366x768
HD Graphics (Bay Trail):
4.6  fps
low 1280x720
100%
HD Graphics 5300:
18.3  fps
61%
HD Graphics (Bay Trail):
11.1  fps
med. 1280x720
100%
HD Graphics 5300:
11.1  fps
86%
HD Graphics (Bay Trail):
9.6  fps
high 1920x1080
100%
HD Graphics 5300:
7.6  fps
low 1024x768
HD Graphics (Bay Trail):
25.2  fps
med. 1366x768
HD Graphics (Bay Trail):
9.2  fps
Thief

Thief

2014
low 1024x768
100%
HD Graphics 5300:
8.3 9.3 9.5 10.8 ~ 9 fps
44%
HD Graphics (Bay Trail):
3.1 5.1 ~ 4 fps
med. 1366x768
100%
HD Graphics 5300:
5.1 5.3 5.5 6.9 ~ 6 fps
55%
HD Graphics (Bay Trail):
3.3  fps
high 1366x768
100%
HD Graphics 5300:
4.3 4.3 4.4 4.6 ~ 4 fps
ultra 1920x1080
100%
HD Graphics 5300:
2 2.2 ~ 2 fps
low 1024x768
HD Graphics (Bay Trail):
8.7  fps
med. 1366x768
HD Graphics (Bay Trail):
5.8  fps
low 1024x768
100%
HD Graphics 5300:
26.7  fps
48%
HD Graphics (Bay Trail):
12.8  fps
med. 1366x768
100%
HD Graphics 5300:
10.7  fps
56%
HD Graphics (Bay Trail):
6  fps
high 1366x768
100%
HD Graphics 5300:
3.9  fps
ultra 1920x1080
100%
HD Graphics 5300:
3.4  fps
low 1024x768
100%
HD Graphics 5300:
15.2  fps
48%
HD Graphics (Bay Trail):
7.3  fps
med. 1366x768
100%
HD Graphics 5300:
11.6  fps
high 1366x768
100%
HD Graphics 5300:
7.5  fps
low 1024x768
HD Graphics (Bay Trail):
14  fps
med. 1366x768
HD Graphics (Bay Trail):
8  fps
F1 2013

F1 2013

2013
low 1024x768
HD Graphics (Bay Trail):
12  fps
Fifa 14

Fifa 14

2013
low 1024x768
100%
HD Graphics 5300:
91.4  fps
32%
HD Graphics (Bay Trail):
12.6 18.7 19.9 29.8 33.6 60 ~ 29 fps
med. 1366x768
100%
HD Graphics 5300:
48.8  fps
43%
HD Graphics (Bay Trail):
10.5 19.5 33 ~ 21 fps
high 1366x768
100%
HD Graphics 5300:
45.2  fps
31%
HD Graphics (Bay Trail):
7.8 12.8 22 ~ 14 fps
ultra 1920x1080
100%
HD Graphics 5300:
21.6  fps
low 1024x768
100%
HD Graphics 5300:
24.9  fps
31%
HD Graphics (Bay Trail):
7.7  fps
med. 1366x768
100%
HD Graphics 5300:
17.4  fps
high 1366x768
100%
HD Graphics 5300:
13  fps
ultra 1920x1080
100%
HD Graphics 5300:
3.6  fps
low 1280x720
HD Graphics (Bay Trail):
6.3  fps
low 1024x768
HD Graphics (Bay Trail):
10.2  fps
med. 1366x768
HD Graphics (Bay Trail):
6.1  fps
low 1024x768
100%
HD Graphics 5300:
18.2  fps
60%
HD Graphics (Bay Trail):
11  fps
med. 1366x768
100%
HD Graphics 5300:
11.7  fps
67%
HD Graphics (Bay Trail):
7.8  fps
Dota 2

Dota 2

2013
low 1024x768
100%
HD Graphics 5300:
33.1 48 50.9 51.2 53.6 ~ 47 fps
53%
HD Graphics (Bay Trail):
18.2 20.8 28.4 31.9 ~ 25 fps
med. 1366x768
100%
HD Graphics 5300:
21.4 23.2 26.7 28.6 29.7 ~ 26 fps
50%
HD Graphics (Bay Trail):
9.5 10.4 13.7 19.4 ~ 13 fps
ultra 1920x1080
100%
HD Graphics 5300:
9.8 12.2 14.9 15.4 ~ 13 fps
low 1024x768
100%
HD Graphics 5300:
8.3  fps
53%
HD Graphics (Bay Trail):
4.4  fps
GRID 2

GRID 2

2013
low 1024x768
100%
HD Graphics 5300:
41  fps
44%
HD Graphics (Bay Trail):
14.1 16.2 17.9 20.4 23.2 ~ 18 fps
med. 1366x768
100%
HD Graphics 5300:
21.3  fps
61%
HD Graphics (Bay Trail):
12.5 12.6 ~ 13 fps
high 1366x768
100%
HD Graphics 5300:
15  fps
low 1024x768
100%
HD Graphics 5300:
13.3  fps
38%
HD Graphics (Bay Trail):
5  fps
med. 1366x768
100%
HD Graphics 5300:
10.1  fps
high 1366x768
100%
HD Graphics 5300:
6.1  fps
ultra 1920x1080
100%
HD Graphics 5300:
3.2  fps
low 1280x720
100%
HD Graphics 5300:
22.5 24.7 27.1 27.4 27.8 28.2 30.8 33.8 ~ 28 fps
43%
HD Graphics (Bay Trail):
8.4 8.4 10.9 11.4 12.2 13.3 14.2 14.7 15 ~ 12 fps
med. 1366x768
100%
HD Graphics 5300:
12.2 12.3 14.3 14.4 14.6 14.8 15 15.6 18.8 ~ 15 fps
40%
HD Graphics (Bay Trail):
3.5 5.3 5.6 5.7 6.3 6.8 6.9 7.1 ~ 6 fps
high 1366x768
100%
HD Graphics 5300:
10.4 10.6 10.8 11.2 11.8 11.9 12.6 13 15.5 ~ 12 fps
42%
HD Graphics (Bay Trail):
2.1 4.8 4.9 5.8 5.9 6.2 ~ 5 fps
ultra 1920x1080
100%
HD Graphics 5300:
3.2 3.3 3.4 3.5 3.9 ~ 3 fps
40%
HD Graphics (Bay Trail):
1.2  fps
low 1024x768
100%
HD Graphics 5300:
99.5 143.4 ~ 121 fps
45%
HD Graphics (Bay Trail):
39 56.2 69 ~ 55 fps
med. 1366x768
100%
HD Graphics 5300:
28.3 35.7 ~ 32 fps
41%
HD Graphics (Bay Trail):
12.3 12.8 14 ~ 13 fps
high 1366x768
100%
HD Graphics 5300:
18 20.5 ~ 19 fps
ultra 1920x1080
100%
HD Graphics 5300:
6.5  fps
SimCity

SimCity

2013
low 1024x768
100%
HD Graphics 5300:
26  fps
med. 1366x768
100%
HD Graphics 5300:
12.4  fps
high 1366x768
100%
HD Graphics 5300:
8  fps
low 1024x768
100%
HD Graphics 5300:
23 24.5 27.1 28.9 31 31.3 31.5 35.9 37.4 37.5 39.9 40.3 40.8 49.1 ~ 34 fps
41%
HD Graphics (Bay Trail):
10 11.7 11.8 12 12.4 12.5 12.5 12.6 12.7 12.9 13.2 13.4 13.7 13.8 14 14.1 14.2 14.4 14.4 14.7 14.8 15 15.3 15.4 15.5 15.5 15.9 15.9 16 16.5 16.9 17.6 18 ~ 14 fps
med. 1366x768
100%
HD Graphics 5300:
13.7 14 15 15.4 15.7 16.2 16.3 18.1 18.8 18.8 19.8 20 20.5 25.2 ~ 18 fps
39%
HD Graphics (Bay Trail):
5.1 6.1 6.2 6.4 6.7 6.7 6.9 6.9 7 7 7.1 7.1 7.4 7.4 7.4 7.5 7.5 7.6 7.8 7.9 8 8 8.1 8.1 8.2 8.3 8.4 9.2 10.4 ~ 7 fps
high 1366x768
100%
HD Graphics 5300:
8.6 9.1 9.8 10.2 10.6 10.6 10.7 11.8 12.3 12.6 12.8 13.5 14.7 16.5 ~ 12 fps
42%
HD Graphics (Bay Trail):
3.1 4.5 4.6 4.8 4.8 4.8 4.8 4.9 4.9 5.2 5.2 5.4 5.4 6.1 7.3 ~ 5 fps
ultra 1920x1080
100%
HD Graphics 5300:
5.1 5.4 6.1 7.9 ~ 6 fps
5%
HD Graphics (Bay Trail):
0.3  fps
Crysis 3

Crysis 3

2013
low 1024x768
100%
HD Graphics 5300:
12.5  fps
med. 1366x768
100%
HD Graphics 5300:
7.5  fps
high 1366x768
100%
HD Graphics 5300:
4.2  fps
ultra 1920x1080
100%
HD Graphics 5300:
1.7  fps
low 1024x768
100%
HD Graphics 5300:
35.9  fps
53%
HD Graphics (Bay Trail):
15.1 23.6 ~ 19 fps
med. 1366x768
100%
HD Graphics 5300:
18.3  fps
38%
HD Graphics (Bay Trail):
5.2 9.7 ~ 7 fps
high 1366x768
100%
HD Graphics 5300:
13.9  fps
ultra 1920x1080
100%
HD Graphics 5300:
7.1  fps
Far Cry 3

Far Cry 3

2012
low 1024x768
100%
HD Graphics 5300:
19.4  fps
53%
HD Graphics (Bay Trail):
10.3  fps
med. 1366x768
100%
HD Graphics 5300:
12.6  fps
49%
HD Graphics (Bay Trail):
6.2  fps
high 1366x768
100%
HD Graphics 5300:
6.5  fps
low 1024x768
HD Graphics (Bay Trail):
10.1  fps
med. 1366x768
HD Graphics (Bay Trail):
6  fps
low 1024x768
100%
HD Graphics 5300:
33  fps
38%
HD Graphics (Bay Trail):
12.4  fps
med. 1366x768
100%
HD Graphics 5300:
24  fps
30%
HD Graphics (Bay Trail):
7.3  fps
high 1366x768
100%
HD Graphics 5300:
11.8  fps
low 1024x768
HD Graphics (Bay Trail):
12.5 14.3 ~ 13 fps
med. 1366x768
HD Graphics (Bay Trail):
9.8 11.2 ~ 11 fps
low 1024x768
100%
HD Graphics 5300:
20.2  fps
med. 1366x768
100%
HD Graphics 5300:
11.3  fps
high 1366x768
100%
HD Graphics 5300:
9.5  fps
ultra 1920x1080
100%
HD Graphics 5300:
4  fps
low 1024x768
HD Graphics (Bay Trail):
42  fps
low 1024x768
100%
HD Graphics 5300:
46.6  fps
high 1366x768
100%
HD Graphics 5300:
12.9  fps
ultra 1920x1080
100%
HD Graphics 5300:
5.6  fps
low 1024x768
100%
HD Graphics 5300:
53.5 62 73 ~ 63 fps
57%
HD Graphics (Bay Trail):
26.1 46.6 ~ 36 fps
med. 1366x768
100%
HD Graphics 5300:
37.7 49.7 51 ~ 46 fps
48%
HD Graphics (Bay Trail):
20 23.9 ~ 22 fps
high 1366x768
100%
HD Graphics 5300:
23.7 25.1 38 ~ 29 fps
ultra 1920x1080
100%
HD Graphics 5300:
11.8 19.8 23 ~ 18 fps
low 1024x768
100%
HD Graphics 5300:
20.2 21.3 ~ 21 fps
62%
HD Graphics (Bay Trail):
12.9 13.2 ~ 13 fps
med. 1366x768
100%
HD Graphics 5300:
14.1 17 ~ 16 fps
50%
HD Graphics (Bay Trail):
7.5 8.1 ~ 8 fps
high 1366x768
100%
HD Graphics 5300:
7.1 7.2 ~ 7 fps
low 1024x768
HD Graphics (Bay Trail):
28  fps
low 1024x768
100%
HD Graphics 5300:
21 28.5 57.1 ~ 36 fps
42%
HD Graphics (Bay Trail):
9.2 10.7 14.8 15.6 16.5 18.4 19.3 ~ 15 fps
med. 1366x768
100%
HD Graphics 5300:
17 21.3 31.1 ~ 23 fps
43%
HD Graphics (Bay Trail):
6 9.5 10.3 11.4 12 ~ 10 fps
high 1366x768
100%
HD Graphics 5300:
12 18 28.9 ~ 20 fps
45%
HD Graphics (Bay Trail):
7.9 9.6 ~ 9 fps
ultra 1920x1080
100%
HD Graphics 5300:
10.6 20 ~ 15 fps
33%
HD Graphics (Bay Trail):
5 5.9 ~ 5 fps
low 1280x720
HD Graphics (Bay Trail):
8.5 12.4 ~ 10 fps
high 1366x768
HD Graphics (Bay Trail):
8.1  fps
Alan Wake

Alan Wake

2012
low 1024x768
100%
HD Graphics 5300:
11.2  fps
52%
HD Graphics (Bay Trail):
5.8  fps
med. 1366x768
100%
HD Graphics 5300:
6.4  fps
36%
HD Graphics (Bay Trail):
2.3  fps
Anno 2070

Anno 2070

2011
low 1024x768
100%
HD Graphics 5300:
40.5 45 ~ 43 fps
40%
HD Graphics (Bay Trail):
11.8 14.6 15 15.1 15.3 16.1 16.5 16.8 16.8 17.4 17.4 18 18 18.2 19.7 22.8 ~ 17 fps
med. 1366x768
100%
HD Graphics 5300:
19.5 20.1 23 ~ 21 fps
33%
HD Graphics (Bay Trail):
6.3 6.4 6.4 6.8 6.9 7.2 7.5 7.5 7.6 8 8.1 9.3 ~ 7 fps
high 1366x768
100%
HD Graphics 5300:
10.6 11.6 13 ~ 12 fps
33%
HD Graphics (Bay Trail):
3.6 4 4 4.1 5.5 ~ 4 fps
ultra 1920x1080
100%
HD Graphics 5300:
4.8  fps
23%
HD Graphics (Bay Trail):
1.1  fps
low 1280x720
100%
HD Graphics 5300:
19.5  fps
56%
HD Graphics (Bay Trail):
11 11.8 ~ 11 fps
med. 1366x768
100%
HD Graphics 5300:
9.2  fps
109%
HD Graphics (Bay Trail):
10  fps
high 1366x768
100%
HD Graphics 5300:
5.8  fps
ultra 1920x1080
100%
HD Graphics 5300:
3.2  fps
low 1024x768
100%
HD Graphics 5300:
16.3  fps
49%
HD Graphics (Bay Trail):
8  fps
med. 1366x768
100%
HD Graphics 5300:
12.7  fps
38%
HD Graphics (Bay Trail):
4.8  fps
high 1366x768
100%
HD Graphics 5300:
9.7  fps
low 1024x768
100%
HD Graphics 5300:
40.9  fps
48%
HD Graphics (Bay Trail):
19.7  fps
high 1366x768
100%
HD Graphics 5300:
21.5  fps
Dirt 3

Dirt 3

2011
low 800x600
100%
HD Graphics 5300:
57.4  fps
54%
HD Graphics (Bay Trail):
24.1 36.9 ~ 31 fps
med. 1024x768
100%
HD Graphics 5300:
26.5  fps
49%
HD Graphics (Bay Trail):
12.9 13.3 ~ 13 fps
high 1360x768
100%
HD Graphics 5300:
16.7  fps
Civilization 5

Civilization 5

2010
low 1024x768
HD Graphics (Bay Trail):
9.3  fps
Mafia 2

Mafia 2

2010
low 800x600
100%
HD Graphics 5300:
18.9  fps
42%
HD Graphics (Bay Trail):
5 10.5 ~ 8 fps
med. 1024x768
100%
HD Graphics 5300:
15.4  fps
36%
HD Graphics (Bay Trail):
5.6  fps
high 1360x768
100%
HD Graphics 5300:
13.4  fps
28%
HD Graphics (Bay Trail):
3.7  fps
ultra 1920x1080
100%
HD Graphics 5300:
8.8  fps
low 1024x768
HD Graphics (Bay Trail):
32 48 49 53.3 ~ 46 fps
med. 1360x768
HD Graphics (Bay Trail):
6 9 9 ~ 8 fps
high 1360x768
HD Graphics (Bay Trail):
3  fps
low 800x600
100%
HD Graphics 5300:
16  fps
75%
HD Graphics (Bay Trail):
12  fps
med. 1360x768
100%
HD Graphics 5300:
8.1  fps
111%
HD Graphics (Bay Trail):
9  fps
high 1600x900
100%
HD Graphics 5300:
4.7  fps
low 1024x768
100%
HD Graphics 5300:
33.1  fps
39%
HD Graphics (Bay Trail):
12.8  fps
med. 1366x768
100%
HD Graphics 5300:
25  fps
36%
HD Graphics (Bay Trail):
9  fps
high 1366x768
100%
HD Graphics 5300:
16  fps
Risen

Risen

2009
low 800x600
100%
HD Graphics 5300:
20.3 60 ~ 40 fps
65%
HD Graphics (Bay Trail):
23.1 25 26.2 28.8 ~ 26 fps
med. 1024x768
100%
HD Graphics 5300:
14.5 22.7 ~ 19 fps
53%
HD Graphics (Bay Trail):
8.7 9 10.4 11.1 ~ 10 fps
high 1366x768
100%
HD Graphics 5300:
16  fps
Resident Evil 5

Resident Evil 5

2009
low 800x600
100%
HD Graphics 5300:
48.1  fps
50%
HD Graphics (Bay Trail):
17.1 26.1 26.2 26.3 ~ 24 fps
high 1360x768
100%
HD Graphics 5300:
21.4  fps
ultra 1920x1080
100%
HD Graphics 5300:
10.3  fps
Trackmania Nations Forever

Trackmania Nations Forever

2008
low 640x480
100%
HD Graphics 5300:
188  fps
41%
HD Graphics (Bay Trail):
42.9 69.8 69.8 71.6 72 72.7 75.1 75.5 76 76.7 77.1 80.9 83.1 83.9 84.3 84.8 85.6 86.9 90.2 ~ 77 fps
high 1024x768
100%
HD Graphics 5300:
52.3  fps
36%
HD Graphics (Bay Trail):
10.3 14 17.7 18 18.1 18.1 18.7 18.8 19.3 19.4 19.4 19.8 19.8 20.5 20.5 20.6 21 21.5 23.6 ~ 19 fps
ultra 1920x1080
100%
HD Graphics 5300:
21.8  fps
32%
HD Graphics (Bay Trail):
6.4 7.7 ~ 7 fps
Crysis - GPU Benchmark

Crysis - GPU Benchmark

2007
low 1024x768
HD Graphics (Bay Trail):
18.9 19 ~ 19 fps
med. 1024x768
HD Graphics (Bay Trail):
7.6 8.7 ~ 8 fps
World of Warcraft

World of Warcraft

2005
low 800x600
100%
HD Graphics 5300:
92  fps
48%
HD Graphics (Bay Trail):
33 33 35 38 44 46.2 47 48 49 49 50 52 ~ 44 fps
med. 1024x768
100%
HD Graphics 5300:
39 43.6 ~ 41 fps
56%
HD Graphics (Bay Trail):
9.6 11.5 20 22 23 25.3 26 26 28 34 ~ 23 fps
high 1280x1024
100%
HD Graphics 5300:
12.6 31 ~ 22 fps
59%
HD Graphics (Bay Trail):
12 12 13.5 ~ 13 fps
ultra 1920x1080
100%
HD Graphics 5300:
8  fps
75%
HD Graphics (Bay Trail):
5.6 7 ~ 6 fps
Quake 3 Arena - Timedemo

Quake 3 Arena - Timedemo

1999
high 1024x768
HD Graphics (Bay Trail):
190  fps

Average Gaming Intel HD Graphics 5300 → 100%

Average Gaming 30-70 fps → 100%

Average Gaming AMD Radeon 660M → 1340%

Average Gaming 30-70 fps → 1324%

Average Gaming Intel HD Graphics (Bay Trail) → 49%

Average Gaming 30-70 fps → 56%

AMD Radeon 660Mlowmed.highultraQHD4K
F1 243530235.6
Cyberpunk 2077 2.1 Phantom Liberty2116119
Baldur's Gate 320141212
F1 2349.642.729.2
Diablo 434.627.62623.9
Star Wars Jedi Survivor11.510.2
Dead Island 236.830.122.314.6
The Last of Us17.713.211.1
Resident Evil 4 Remake20.114.7
Company of Heroes 323.72215.9
Sons of the Forest24.716.715.314.8
Atomic Heart2922.91310.2
Returnal161513
Hogwarts Legacy23.317.212.810.3
The Witcher 3 v4.0031.825.310.1
High On Life37.823.319.214.5
The Callisto Protocol26.718.517.910.3
Need for Speed Unbound29.324.118.617.6
Spider-Man Miles Morales27.322.620.2
Call of Duty Modern Warfare 2 202227241716
Uncharted Legacy of Thieves Collection12.311.49.6
A Plague Tale Requiem9.437.836.74
The Quarry24.51814.4
F1 224843306
Vampire Bloodhunt23121222.4
Ghostwire Tokyo212423.9
Tiny Tina's Wonderlands34261713
Cyberpunk 2077 1.6242014
Elex 2282319
GRID Legends60453419.5
Elden Ring39.629.926.9
Dying Light 219.715.412.4
Rainbow Six Extraction453530
God of War21161310.8
Halo Infinite39.620.317.1
Farming Simulator 2210257.138.9
Forza Horizon 5923932
Riders Republic563023
Guardians of the Galaxy
Back 4 Blood104.340.434.3
Far Cry 654232018.3
Alan Wake Remastered53.632.726.4
Deathloop45.523.318.1
F1 2021107463614
Days Gone5025.322.2
Mass Effect Legendary Edition7038.9
Resident Evil Village75.333.429.9
Outriders35.330.427.9
Hitman 391.134.530.5
Yakuza Like a Dragon64.721.221.1
Assassin´s Creed Valhalla522619
Dirt 568.624.217.8
Watch Dogs Legion492622
Star Wars Squadrons170.466.657.4
Mafia Definitive Edition48.220.719.1
Serious Sam 411329.224.1
Crysis Remastered88.139.210.9
Flight Simulator 202041.614.210.4
Death Stranding58.130.629.1
F1 2020102.144.632.322.2
Gears Tactics13247.428.5
Doom Eternal86.936.234.2
Hunt Showdown70.824.219.2
Borderlands 34920.513.610.7
Far Cry New Dawn58322927
Metro Exodus4818.814.411.2
Shadow of the Tomb Raider73262218
Strange Brigade108403226
Far Cry 558282523
X-Plane 11.11443228
Final Fantasy XV Benchmark442115
Dota 2 Reborn115915749
The Witcher 384492415
GTA V1221063415
< 30 fps
< 60 fps
< 120 fps
≥ 120 fps
23
28
19
3
45
24
3
56
14

28
2


Intel HD Graphics (Bay Trail)lowmed.highultraQHD4K
Team Fortress 226.723.4
Dirt 46
Rocket League12.6
Call of Duty: Black Ops 30
World of Warships12.1
Metal Gear Solid V10.8
Dota 2 Reborn24.79.75.55.4
Dirt Rally236
Battlefield Hardline7.35.1
Evolve3.21.7
The Crew8.14.7
Dragon Age: Inquisition74.6
Far Cry 45.63.8
Assassin's Creed Unity4.32.4
Civilization: Beyond Earth114.3
F1 20141312
The Evil Within5.23.6
Ryse: Son of Rome3.72.5
Alien: Isolation9.15.1
Middle-earth: Shadow of Mordor8.56.1
Fifa 1512.48.5
Sims 4557
Risen 3: Titan Lords8.45.9
GRID: Autosport3713
Watch Dogs8.34.6
Wolfenstein: The New Order11.19.6
The Elder Scrolls Online25.29.2
Thief43.3
Assassin´s Creed IV: Black Flag8.75.8
X-Plane 10.2512.86
Battlefield 47.3
Batman: Arkham Origins148
F1 201312
Fifa 14292114
Total War: Rome II7.7
Saints Row IV6.3
The Bureau: XCOM Declassified10.26.1
Splinter Cell: Blacklist117.8
Dota 22513
Company of Heroes 24.4
GRID 21813
Metro: Last Light5
BioShock Infinite12651.2
StarCraft II: Heart of the Swarm5513
Tomb Raider14750.3
Dead Space 3197
Far Cry 310.36.2
Hitman: Absolution10.16
Call of Duty: Black Ops 212.47.3
Dishonored1311
Torchlight 242
Counter-Strike: GO3622
Sleeping Dogs138
Dirt Showdown28
Diablo III151095
Mass Effect 3108.1
Alan Wake5.82.3
Anno 207017741.1
The Elder Scrolls V: Skyrim1110
Battlefield 384.8
Deus Ex Human Revolution19.7
Dirt 33113
Civilization 59.3
Mafia 285.63.7
StarCraft 24683
Metro 2033129
Battlefield: Bad Company 212.89
Risen2610
Resident Evil 524
Trackmania Nations Forever77197
Crysis - GPU Benchmark198
World of Warcraft4423136
Quake 3 Arena - Timedemo190
< 30 fps
< 60 fps
< 120 fps
≥ 120 fps
62
8
1
53


12


1
7


Intel HD Graphics 5300lowmed.highultraQHD4K
Mirror's Edge Catalyst12.26.9
Need for Speed 20169.17.7
Hitman 20164.72.1
The Division10.87.3
Far Cry Primal83
XCOM 25.72.4
Rise of the Tomb Raider6.63.9
Rainbow Six Siege13.28.55
Just Cause 39.97.7
Star Wars Battlefront13.87.4
Anno 220510.66.1
FIFA 1626.315.3
World of Warships2617.78.4
Metal Gear Solid V20.612.4
Batman: Arkham Knight54
The Witcher 36.23.7
Dirt Rally4112.5
Battlefield Hardline15.31153.1
Evolve75.12.81.1
Dragon Age: Inquisition11831.6
Far Cry 49.26.83.51.7
Civilization: Beyond Earth21.28.85.84.5
F1 201435221312
The Evil Within86.5
Ryse: Son of Rome7.14.6
Alien: Isolation211484.63
Middle-earth: Shadow of Mordor1585
Fifa 1523178.3
Sims 49117.68.56.6
Risen 3: Titan Lords17.311.74.6
GRID: Autosport50161312.5
Wolfenstein: The New Order18.311.17.6
Thief9642
X-Plane 10.2526.710.73.93.4
Battlefield 415.211.67.5
Fifa 1491.448.845.221.6
Total War: Rome II24.917.4133.6
Splinter Cell: Blacklist18.211.7
Dota 2472613
Company of Heroes 28.3
GRID 24121.3415
Metro: Last Light13.310.16.13.2
BioShock Infinite2815123
StarCraft II: Heart of the Swarm12132196.5
SimCity2612.48
Tomb Raider3418126
Crysis 312.57.54.21.7
Dead Space 335.918.313.97.1
Far Cry 319.412.66.5
Call of Duty: Black Ops 2332411.8
Borderlands 220.211.39.54
Guild Wars 246.612.95.6
Counter-Strike: GO63462918
Sleeping Dogs21167
Diablo III36232015
Alan Wake11.26.4
Anno 20704321124.8
The Elder Scrolls V: Skyrim19.59.25.83.2
Battlefield 316.312.79.7
Deus Ex Human Revolution40.921.5
Dirt 357.426.516.7
Mafia 218.915.413.48.8
Metro 2033168.14.7
Battlefield: Bad Company 233.12516
Risen401916
Resident Evil 548.121.410.3
Trackmania Nations Forever18852.321.8
World of Warcraft9241228
< 30 fps
< 60 fps
< 120 fps
≥ 120 fps
46
16
4
2
57
4

46
2

31


Eine Liste mit weiteren Spielen und allen Grafikkarten finden Sie auf unserer Seite: Welches Spiel ist mit welcher Grafikkarte spielbar?

v1.28
log 18. 10:41:59

#0 ran 0s before starting gpusingle class +0s ... 0s

#1 checking url part for id 5939 +0s ... 0s

#2 checking url part for id 11126 +0s ... 0s

#3 checking url part for id 4922 +0s ... 0s

#4 redirected to Ajax server, took 1729240918s time from redirect:0 +0s ... 0s

#5 did not recreate cache, as it is less than 5 days old! Created at Wed, 16 Oct 2024 05:17:20 +0200 +0s ... 0s

#6 composed specs +0.006s ... 0.006s

#7 did output specs +0s ... 0.006s

#8 start showIntegratedCPUs +0s ... 0.006s

#9 getting avg benchmarks for device 5939 +0.002s ... 0.008s

#10 got single benchmarks 5939 +0.002s ... 0.011s

#11 getting avg benchmarks for device 11126 +0.001s ... 0.012s

#12 got single benchmarks 11126 +0.002s ... 0.013s

#13 getting avg benchmarks for device 4922 +0.001s ... 0.014s

#14 got single benchmarks 4922 +0.011s ... 0.025s

#15 got avg benchmarks for devices +0s ... 0.025s

#16 No cached benchmark found, getting uncached values +0.008s ... 0.033s

#17 No cached benchmark found, getting uncached values +0s ... 0.033s

#18 min, max, avg, median took s +0.038s ... 0.071s

#19 before gaming benchmark output +0s ... 0.071s

#20 Got 1471 rows for game benchmarks. +0.091s ... 0.162s

#21 composed SQL query for gamebenchmarks +0s ... 0.162s

#22 got data and put it in $dataArray +0.008s ... 0.171s

#23 benchmarks composed for output. +0.051s ... 0.222s

#24 calculated avg scores. +0s ... 0.222s

#25 return log +0.002s ... 0.224s

Teilen Sie diesen Artikel, um uns zu unterstützen. Jeder Link hilft!
> Notebook Test, Laptop Test und News > Benchmarks / Technik > Benchmarks / Technik > Grafikkarten Vergleich - Head 2 Head
Autor: Klaus Hinum,  8.09.2017 (Update:  1.07.2023)