Intel HD Graphics 5300 vs Intel Iris Plus Graphics 640 vs Intel HD Graphics (Cherry Trail)
Intel HD Graphics 5300 ► remove from comparison
Die Intel HD Graphics 5300 (GT2) ist eine Prozessorgrafikkarte in den Ende 2014 vorgestellten Core-M-CPUs Core M-5Y70 ). Zwar glänzt die GPU mit einer extrem niedrigen Leistungsaufnahme, allerdings siedelt sich die Performance nur im absoluten Low-End-Segment an und ist für neuere Spiele kaum ausreichend.
Architektur und Features
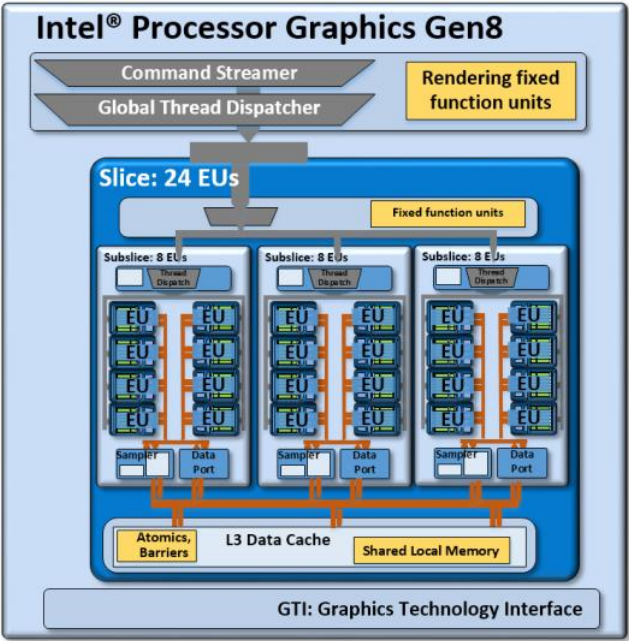
Broadwell integriert eine Grafikeinheit auf Basis der Intel-Gen8-Architektur, die gegenüber dem Vorgänger Intel Gen7.5 (Haswell) in verschiedenen Punkten weiterentwickelt wurde. So hat Intel unter anderem die "Subslice" genannten Shader-Arrays umorganisiert, die nun jeweils 8 Execution Units (EUs) beinhalten. Drei Subslices bilden wiederum einen Slice mit insgesamt 24 EUs. Hinzu kommen größere L1-Caches und Verbesserungen im Front-End, die die Leistung zusätzlich steigern sollen.
Die HD Graphics 5300 repräsentiert die mittlere, auch "GT2" bezeichnete Ausbaustufe mit einem Slice und 24 EUs. Daneben existieren auch eine teildeaktivierte GT1-Variante (12 EUs) sowie die GT3/GT3e (48 EUs) ohne/mit zusätzlichem eDRAM-Cache.
Alle Broadwell-GPUs unterstützen OpenCL 2.0 sowie DirectX 12 (FL 11_1) . Zudem kann der Videodecoder nun auch den H.265-Codec verarbeiten, greift dafür allerdings nur teilweise auf besonders sparsame Fixed-Function-Einheiten zurück. Die Bildausgabe erfolgt über DP 1.2/eDP 1.3 (max. 3.840 x 2.160 @ 60 Hz) oder HDMI 1.4a (max. 3.840 x 2.160 @ 24 Hz), HDMI 2.0 steht dagegen nicht zur Verfügung. Es können maximal drei Displays parallel angesteuert werden.
Performance
Je nach Modell liegt der maximale GPU-Takt zwischen 800 und 900 MHz, der durch die niedrige TDP jedoch nicht dauerhaft gehalten wird. In längeren Benchmarks ist die HD 5300 darum kaum schneller als die ältere HD 4000 oder HD 4200 , die bei gleicher Performance aber deutlich mehr Energie benötigen. Die TDP des Core M kann optional leicht abgesenkt oder angehoben werden, was spürbare Auswirkungen auf die Leistungsfähigkeit hat.
Insgesamt werden nur wenige Spiele aus 2014 (oder neuer) in niedrigen Einstellungen flüssig dargestellt, sodass man sich auf ältere und weniger anspruchsvolle Titel beschränken muss.
Leistungsaufnahme
Die TDP des gesamten Chips liegt standardmäßig bei zumeist 4,5 Watt, sodass viele Ultrabooks oder 2-in-1-Geräte mit einer rein passiven Kühlung auskommen. Teils kann die TDP auch auf niedrigere (3,5 Watt) oder höhere Werte (6 Watt) angepasst werden.
Intel Iris Plus Graphics 640 ► remove from comparison
Die Intel Iris Plus Graphics 640 (GT3e) ist eine Prozessorgrafikkarte der im Jänner 2017 vorgestellten Kaby-Lake-Modelle. Als Nachfolger der Iris Graphics 540 (Skylake) ist die Iris Plus Graphics 640 dabei in den ULV-Modellen der 15-Watt-Klasse zu finden und besitzt einen dedizierten eDRAM-Cache mit 64 MB Kapazität. Die sogenannte GT3e-Ausbaustufe der Kaby-Lake-GPU verfügt weiterhin über 48 Execution Units (EUs), die je nach Modell mit bis zu 1.050 MHz takten.
Neben dem eDRAM-Cache kann die Iris 640 auch über das Interface des Prozessors auf den Hauptspeicher zugreifen (2x 64 Bit DDR3L-1600/LPDDR3-1866/DDR4-2133).
Von der Iris Plus 650 der 28-Watt-Modelle unterscheidet sich die Iris 640 lediglich durch ihren etwas geringeren Maximaltakt sowie die geringere TDP, wodurch der Turbo-Boost-Spielraum weniger lang ausgenutzt werden kann.
Performance
Die exakte Leistung der Iris Plus Graphics 640 hängt vom jeweiligen CPU-Modell ab, da sich die Maximaltaktrate leicht unterscheiden kann. Zum anderen beeinflusst auch der verwendete Speicher (DDR3/DDR4) die Performance.
Die höchste Leistung erreichen hochtaktende Core-i7-Ableger wie der Core i7-7660U. Je nach Spiel ordnet sich die Iris 640 wahrscheinlich wie der Vorgänger zwischen einer dedizierten GeForce 920M und GeForce 940M ein und kann aktuelle Spiele meist nur in niedrigen Einstellungen flüssig darstellen.
Features
Die überarbeitete Videoeinheit dekodiert H.265-/HEVC-Videos vollständig in Hardware. Anders als Skylake kann Kaby Lake nun auch H.265/HEVC im Main10-Profil mit 10 Bit Farbtiefe sowie Googles VP9-Codec in Hardware dekodieren. Die Bildausgabe erfolgt über DP 1.2/eDP 1.3 (max. 3.840 x 2.160 @ 60 Hz), wohingegen HDMI nur in der älteren Version 1.4a angeboten wird. Ein HDMI-2.0-Anschluss kann aber mittels Konverter von DisplayPort ergänzt werden. Maximal lassen sich drei Displays parallel angesteuern.
Leistungsaufnahme
Die Iris Graphics 640 ist in ULV-Prozessoren der 15-Watt-Klasse zu finden und damit für schlanke Note- und Ultrabooks geeignet.
Intel HD Graphics (Cherry Trail) ► remove from comparison
Die Intel HD Graphics (Cherry Trail) ist eine in den Tablet-SoCs der Cherry-Trail-Serie (z.B. Atom x7-Z8700 ) integrierte Grafikeinheit. Sie basiert auf der gleichen Architektur wie die GPU verschiedener Broadwell-Prozessoren (z.B. HD Graphics 5300 ), bietet allerdings deutlich weniger Shadereinheiten und geringere Taktraten. Die genauen Spezifikationen hängen vom jeweiligen SoC ab:
Die schnellste Variante mit 16 EUs und maximal 600 MHz schlägt die ältere HD Graphics (Bay Trail) um Faktor zwei, womit sich die GPU etwas oberhalb einer Qualcomm Adreno 330 oder PowerVR G6430 , jedoch deutlich unter einer Adreno 420 oder GX6450 einordnet. Auch Nvidias Tegra-SoCs K1 und X1 rechnen weitaus schneller.
Unter Windows werden sich Anwender deshalb weiter auf sehr alte und anspruchslose Spiele beschränken müssen, wohingegen moderne Android-Games auch in hohen Auflösungen zumeist flüssig dargestellt werden sollten. Der x7-Z8700 war z.B. nur knapp in der Lage Team Fortress 2 in minimalen Details und 1280x720 flüssig wiederzugeben (11 - 69 fps).
Videos kann die GPU auch in 4K/H.265 flüssig wiedergeben (je nach Bitrate und Farbtiefe).
Die Intel HD Graphics Grafikkarte in den Cherry Trail SoCs unterstützt nach unseren Tests mit dem MS Surface 3 mit Atom x7-Z8700 nur DisplayPort 1.1 und damit lediglich 30 Hz bei 4K (3.840 x 2.160).
Intel HD Graphics 5300 Intel Iris Plus Graphics 640 Intel HD Graphics (Cherry Trail) HD Graphics Serie Codename Broadwell GT2 Kaby Lake GT3e Cherry Trail Architektur Gen. 8 Broadwell Gen. 9.5 Kaby Lake Gen. 8 Pipelines 24 - unified 48 - unified 16 - unified Kerntakt 100 - 900 (Boost) MHz 300 - 1050 (Boost) MHz 200 - 600 (Boost) MHz Speicherbandbreite 64/128 Bit 64/128 Bit 64/128 Bit Shared Memory ja ja ja API DirectX 12 (FL 11_1), OpenGL 4.3 DirectX 12_1, OpenGL 4.4 DirectX 12 (FL 11_1), Shader 5.0, OpenGL 4.3 Transistors 1.3 Billion Herstellungsprozess 14 nm 14 nm 14 nm Features QuickSync QuickSync Erscheinungsdatum 05.09.2014 03.01.2017 02.03.2015 Speichertyp DDR3/DDR4 Max. Speichergröße 64 MB
CPU in HD Graphics 5300 GPU Base Speed GPU Boost / Turbo Intel Core M-5Y71 2 x 1200 MHz, 4.5 W 300 MHz 900 MHz Intel Core M-5Y51 2 x 1100 MHz, 4.5 W 300 MHz 900 MHz Intel Core M-5Y70 2 x 1100 MHz, 4.5 W 100 MHz 850 MHz » show 4 more Intel Core M-5Y31 2 x 900 MHz, 4.5 W 300 MHz 850 MHz Intel Core M-5Y10c 2 x 800 MHz, 4.5 W 300 MHz 800 MHz Intel Core M-5Y10a 2 x 800 MHz, 4.5 W 100 MHz 800 MHz Intel Core M-5Y10 2 x 800 MHz, 4.5 W 100 MHz 800 MHz min. - max. 100 - 300 MHz 800 - 900 MHz
CPU in Iris Plus Graphics 640 GPU Base Speed GPU Boost / Turbo Intel Core i7-7660U 2 x 2500 MHz, 15 W 300 MHz 1050 MHz Intel Core i7-7560U 2 x 2400 MHz, 15 W 300 MHz 1050 MHz Intel Core i5-7360U 2 x 2300 MHz, 15 W 300 MHz 1000 MHz Intel Core i5-7260U 2 x 2200 MHz, 15 W 300 MHz 950 MHz min. - max. 100 - 300 MHz 800 - 1050 MHz
CPU in HD Graphics (Cherry Trail) GPU Base Speed GPU Boost / Turbo Intel Atom x7-Z8700 4 x 1600 MHz 200 MHz 600 MHz Intel Atom x5-Z8500 4 x 1440 MHz 200 MHz 600 MHz Intel Atom x5-Z8350 4 x 1440 MHz 200 MHz 500 MHz » show 2 more Intel Atom x5-Z8300 4 x 1440 MHz 200 MHz 500 MHz Intel Atom x5-E8000 4 x 1040 MHz, 5 W 320 MHz ? MHz min. - max. 100 - 320 MHz ? - 1050 MHz
Benchmarks Performance Rating - 3DMark 11 + Fire Strike + Time Spy - HD Graphics 5300
0.2 pt (1%)
...
...
max:
Performance Rating - 3DMark 11 + Fire Strike + Time Spy - HD Graphics (Cherry Trail)
0.1 pt (0%)
Intel HD Graphics (Cherry Trail)
...
max:
3DMark - 3DMark Time Spy Score
min: 467 avg: 499.8 median: 494.5 (1%) max: 543 Points
3DMark - 3DMark Time Spy Graphics
min: 413 avg: 442.5 median: 437 (1%) max: 483 Points
3DMark - 3DMark Ice Storm Unlimited Graphics
min: 39138 avg: 55907 median: 59555 (6%) max: 65380 Points
min: 142163 avg: 147298 median: 145481 (15%) max: 154251 Points
min: 18563 avg: 20873 median: 19303 (2%) max: 27537 Points
3DMark - 3DMark Ice Storm Extreme Graphics
min: 19630 avg: 24597 median: 24597 (3%) max: 29564 Points
3DMark - 3DMark Cloud Gate Score
min: 1361 avg: 3085 median: 3041 (3%) max: 4274 Points
min: 7558 avg: 8025 median: 8067 (9%) max: 8711 Points
min: 769 avg: 1454 median: 1488 (2%) max: 1905 Points
3DMark - 3DMark Cloud Gate Graphics
min: 2895 avg: 3862 median: 3720 (1%) max: 5512 Points
min: 10486 avg: 11119 median: 11248 (3%) max: 11495 Points
min: 1537 avg: 1851 median: 1783.5 (0%) max: 2272 Points
3DMark - 3DMark Fire Strike Standard Score
min: 327 avg: 413.8 median: 407 (1%) max: 620 Points
min: 1236 avg: 1349 median: 1310 (2%) max: 1509 Points
min: 174 avg: 390.4 median: 248 (0%) max: 1059 Points
3DMark - 3DMark Fire Strike Standard Graphics
min: 352 avg: 453.8 median: 439 (0%) max: 671 Points
min: 1315 avg: 1411 median: 1393.5 (2%) max: 1541 Points
min: 193 avg: 233 median: 225 (0%) max: 281 Points
3DMark - 3DMark Ice Storm Graphics
min: 27164 avg: 35716 median: 34405 (4%) max: 48901 Points
min: 7544 avg: 16078 median: 17063.5 (2%) max: 23395 Points
3DMark - 3DMark Sling Shot (ES 3.0) Unlimited
min: 1445 avg: 1525 median: 1525 (7%) max: 1605 Points
3DMark - 3DMark Sling Shot (ES 3.0) Unlimited Graphics
min: 1598 avg: 1684 median: 1684 (4%) max: 1770 Points
3DMark - 3DMark Sling Shot Extreme (ES 3.1) Unlimited
min: 1072 avg: 1215 median: 1159 (6%) max: 1414 Points
3DMark - 3DMark Sling Shot Extreme (ES 3.1) Unlimited Graphics
min: 1058 avg: 1251 median: 1142 (3%) max: 1554 Points
3DMark - 3DMark Sling Shot (ES 3.0)
min: 1353 avg: 1429 median: 1398 (12%) max: 1593 Points
3DMark - 3DMark Sling Shot (ES 3.0) Graphics
min: 1300 avg: 1505 median: 1530 (9%) max: 1732 Points
3DMark - 3DMark Sling Shot Extreme (ES 3.1)
min: 1037 avg: 1133 median: 1070 (5%) max: 1319 Points
3DMark - 3DMark Sling Shot Extreme (ES 3.1) Graphics
min: 973 avg: 1102 median: 1054 (4%) max: 1261 Points
3DMark 11 - 3DM11 Performance Score
min: 498 avg: 721 median: 731 (1%) max: 973 Points
min: 2136 avg: 2440 median: 2561 (4%) max: 2664 Points
min: 314 avg: 359.4 median: 343 (0%) max: 562 Points
3DMark 11 - 3DM11 Performance GPU
min: 458 avg: 648 median: 647 (1%) max: 885 Points
min: 1980 avg: 2275 median: 2379 (2%) max: 2493 Points
min: 278 avg: 319.9 median: 298 (0%) max: 494 Points
3DMark Vantage + Intel HD Graphics 5300 3DMark Vantage - 3DM Vant. Perf. total
min: 2966 avg: 3104 median: 3104 (1%) max: 3242 Points
3DM Vant. Perf. GPU no PhysX + Intel HD Graphics 5300 3DMark Vantage - 3DM Vant. Perf. GPU no PhysX
min: 2538 avg: 2914 median: 2913.5 (2%) max: 3289 Points
3DMark 06 3DMark 06 - Standard 1280x1024 + Intel HD Graphics 5300
min: 3951 avg: 5044 median: 4775 (6%) max: 6754 Points
3DMark 06 - Standard 1280x1024 + Intel Iris Plus Graphics 640
min: 13164 avg: 14118 median: 14117.5 (18%) max: 15071 Points
3DMark 06 - Standard 1280x1024 + Intel HD Graphics (Cherry Trail)
min: 2403 avg: 2833 median: 2595 (3%) max: 3330 Points
3DMark 06 - Standard 1024x768 + Intel HD Graphics (Cherry Trail)
2877 Points (4%)
Unigine Valley 1.0 - Unigine Valley 1.0 DX
6.5 fps (2%)
1.2 fps (0%)
Unigine Heaven 3.0 - Unigine Heaven 3.0 DX 11
7.6 fps (3%)
Unigine Heaven 2.1 - Heaven 2.1 high
5.7 fps (1%)
SPECviewperf 12 + Intel HD Graphics 5300 SPECviewperf 12 - specvp12 sw-03
min: 0.97 avg: 4.7 median: 4.7 (1%) max: 8.44 fps
specvp12 snx-02 + Intel HD Graphics 5300 SPECviewperf 12 - specvp12 snx-02
min: 1.07 avg: 1.2 median: 1.2 (0%) max: 1.28 fps
specvp12 showcase-01 + Intel HD Graphics 5300 SPECviewperf 12 - specvp12 showcase-01
min: 2.69 avg: 4.7 median: 4.7 (1%) max: 6.69 fps
specvp12 mediacal-01 + Intel HD Graphics 5300 SPECviewperf 12 - specvp12 mediacal-01
min: 0.58 avg: 0.8 median: 0.8 (0%) max: 1.1 fps
specvp12 maya-04 + Intel HD Graphics 5300 SPECviewperf 12 - specvp12 maya-04
min: 2.13 avg: 4 median: 4 (1%) max: 5.79 fps
specvp12 energy-01 + Intel HD Graphics 5300 SPECviewperf 12 - specvp12 energy-01
min: 0.04 avg: 4.5 median: 4.5 (4%) max: 9 fps
specvp12 creo-01 + Intel HD Graphics 5300 SPECviewperf 12 - specvp12 creo-01
min: 0.91 avg: 2.8 median: 2.8 (1%) max: 4.73 fps
specvp12 catia-04 + Intel HD Graphics 5300 SPECviewperf 12 - specvp12 catia-04
5.5 fps (1%)
Cinebench R10 Cinebench R10 Shading (32bit) + Intel HD Graphics 5300 Cinebench R10 - Cinebench R10 Shading (32bit)
min: 2978 avg: 4412 median: 4018 (3%) max: 6679 Points
Cinebench R10 Shading (32bit) + Intel Iris Plus Graphics 640
min: 8824 avg: 9678 median: 9703 (7%) max: 10506 Points
Cinebench R10 Shading (32bit) + Intel HD Graphics (Cherry Trail)
min: 1192 avg: 2009 median: 1973 (1%) max: 2551 Points
Cinebench R11.5 Cinebench R11.5 OpenGL 64 Bit + Intel HD Graphics 5300 Cinebench R11.5 - Cinebench R11.5 OpenGL 64 Bit
min: 11.6 avg: 16.4 median: 15.9 (5%) max: 23.2 fps
Cinebench R11.5 OpenGL 64 Bit + Intel Iris Plus Graphics 640
46.1 fps (15%)
Cinebench R11.5 OpenGL 64 Bit + Intel HD Graphics (Cherry Trail)
min: 4.01 avg: 8.8 median: 8.4 (3%) max: 11.71 fps
Cinebench R15 + Intel HD Graphics 5300 Cinebench R15 - Cinebench R15 OpenGL 64 Bit
min: 16.04 avg: 19 median: 18.4 (1%) max: 23.64 fps
Cinebench R15 OpenGL 64 Bit + Intel Iris Plus Graphics 640
min: 41.32 avg: 54 median: 56.2 (3%) max: 62.3 fps
Cinebench R15 OpenGL 64 Bit + Intel HD Graphics (Cherry Trail)
min: 6.64 avg: 10.3 median: 9.7 (1%) max: 15.52 fps
Cinebench R15 OpenGL Ref. Match 64 Bit + Intel HD Graphics 5300 Cinebench R15 - Cinebench R15 OpenGL Ref. Match 64 Bit
min: 98 avg: 98.1 median: 98 (98%) max: 99.3 %
Cinebench R15 OpenGL Ref. Match 64 Bit + Intel Iris Plus Graphics 640
min: 97.8 avg: 98.2 median: 97.8 (98%) max: 99.3 %
Cinebench R15 OpenGL Ref. Match 64 Bit + Intel HD Graphics (Cherry Trail)
min: 98 avg: 98 median: 98 (98%) max: 98.6 %
GFXBench - GFXBench Car Chase Offscreen
40.7 fps (5%)
min: 6.3 avg: 7.3 median: 7 (1%) max: 9 fps
GFXBench 3.1 - GFXBench Manhattan ES 3.1 Offscreen
56.1 fps (1%)
min: 9.2 avg: 10.8 median: 11 (0%) max: 13 fps
GFXBench 3.0 - GFXBench 3.0 Manhattan Offscreen
min: 26.7 avg: 30.3 median: 30.1 (2%) max: 34.1 fps
31.2 fps (2%)
min: 8.4 avg: 13.8 median: 13.5 (1%) max: 18 fps
GFXBench (DX / GLBenchmark) 2.7 + Intel HD Graphics 5300 GFXBench (DX / GLBenchmark) 2.7 - GFXBench T-Rex HD Offscreen C24Z16
min: 39.4 avg: 54.4 median: 55 (0%) max: 66.2 fps
GFXBench T-Rex HD Offscreen C24Z16 + Intel Iris Plus Graphics 640
171 fps (1%)
GFXBench T-Rex HD Offscreen C24Z16 + Intel HD Graphics (Cherry Trail) min: 22 avg: 30.5 median: 32 (0%) max: 38.5 fps
LuxMark v2.0 64Bit - LuxMark v2.0 Room GPU
min: 93 avg: 116.7 median: 112 (1%) max: 145 Samples/s
min: 315 avg: 325 median: 325 (1%) max: 335 Samples/s
min: 48 avg: 58.7 median: 59 (0%) max: 69 Samples/s
LuxMark v2.0 64Bit - LuxMark v2.0 Sala GPU
min: 180 avg: 228.7 median: 210 (0%) max: 296 Samples/s
min: 748 avg: 779 median: 778.5 (1%) max: 809 Samples/s
min: 69 avg: 87.7 median: 89 (0%) max: 105 Samples/s
ComputeMark v2.1 - ComputeMark v2.1 Result
min: 460 avg: 519 median: 518.5 (1%) max: 577 Points
min: 1575 avg: 1677 median: 1677 (2%) max: 1779 Points
277 Points (0%)
Power Consumption - Furmark Stress Test Power Consumption - external Monitor *
min: 30.8 avg: 33.6 median: 31.5 (4%) max: 38.5 Watt
Power Consumption - The Witcher 3 Power Consumption - external Monitor *
min: 28 avg: 33.5 median: 33.5 (5%) max: 38.9 Watt
Power Consumption - Witcher 3 Power Consumption *
min: 31.7 avg: 34.9 median: 34.9 (8%) max: 38.1 Watt
Power Consumption - Witcher 3 ultra Power Efficiency - external Monitor
0.1 fps per Watt (9%)
Emissions Witcher 3 Fan Noise + Intel Iris Plus Graphics 640 Emissions - Witcher 3 Fan Noise
33.4 dB(A) (53%)
Clock Speed - GPU Clock Witcher 3 ultra
min: 748 avg: 823 median: 823 (32%) max: 898 MHz
Clock Speed - GPU Clock Speed Furmark
min: 570 avg: 634 median: 634 (25%) max: 698 MHz
Average Benchmarks Intel HD Graphics 5300 → 100% n=17 Average Benchmarks Intel Iris Plus Graphics 640 → 282% n=17 Average Benchmarks Intel HD Graphics (Cherry Trail) → 53% n=17
- Bereich der Benchmarkergebnisse für diese Grafikkarte
- Durchschnittliche Benchmarkergebnisse für diese Grafikkarte
* Smaller numbers mean a higher performance
1 This benchmark is not used for the average calculation
Spiele-Benchmarks Die folgenden Benchmarks basieren auf unseren Spieletests mit Testnotebooks. Die Performance dieser Grafikkarte bei den gelisteten Spielen ist abhängig von der verwendeten CPU, Speicherausstattung, Treiber und auch Betriebssystem. Dadurch müssen die untenstehenden Werte nicht repräsentativ sein. Detaillierte Informationen über das verwendete System sehen Sie nach einem Klick auf den fps-Wert.
Iris Plus Graphics 640:
13.8 fps
Iris Plus Graphics 640:
28 fps
Iris Plus Graphics 640:
69.5 (!) [X] Microsoft Surface Laptop i7 Intel Core i7-7660U 2.5GHz
Iris Plus Graphics 640
min:
59 fps, max:
78 fps
fps
Iris Plus Graphics 640:
38.8 (!) [X] Microsoft Surface Laptop i7 Intel Core i7-7660U 2.5GHz
Iris Plus Graphics 640
min:
34 fps, max:
43 fps
fps
Iris Plus Graphics 640:
33 38 ~ 36 fps
Iris Plus Graphics 640:
15 15 ~ 15 fps
Iris Plus Graphics 640:
22.9 fps
HD Graphics (Cherry Trail):
21.4 fps
Iris Plus Graphics 640:
99 fps
Iris Plus Graphics 640:
48 fps
Iris Plus Graphics 640:
31.8 fps
HD Graphics (Cherry Trail):
15.5 fps
Iris Plus Graphics 640:
39.9 45.4 ~ 43 fps
Iris Plus Graphics 640:
17.9 18.1 ~ 18 fps
Iris Plus Graphics 640:
14.8 fps
Iris Plus Graphics 640:
33.8 fps
Iris Plus Graphics 640:
20.4 fps
Iris Plus Graphics 640:
16 16.6 ~ 16 fps
Iris Plus Graphics 640:
30.8 33.5 ~ 32 fps
Iris Plus Graphics 640:
11.8 12.7 ~ 12 fps
Iris Plus Graphics 640:
42.9 45 ~ 44 fps
Iris Plus Graphics 640:
31.4 fps
Iris Plus Graphics 640:
22.9 fps
Iris Plus Graphics 640:
121 fps
HD Graphics (Cherry Trail):
22.6 [X] Chuwi Hi12 Intel Atom x5-Z8300 1.4GHz
HD Graphics (Cherry Trail)
min:
21 fps, max:
27 fps
fps
Iris Plus Graphics 640:
91 fps
Iris Plus Graphics 640:
31.6 fps
Iris Plus Graphics 640:
17.8 fps
Iris Plus Graphics 640:
19.6 24.2 ~ 22 fps
Iris Plus Graphics 640:
9.2 11.1 ~ 10 fps
Iris Plus Graphics 640:
20.2 fps
100%
HD Graphics 5300:
12.2 fps
100%
HD Graphics 5300:
6.9 fps
Iris Plus Graphics 640:
19.5 fps
100%
HD Graphics 5300:
9.1 fps
100%
HD Graphics 5300:
7.7 fps
100%
HD Graphics 5300:
4.7 fps
100%
HD Graphics 5300:
2.1 fps
100%
HD Graphics 5300:
10.8 fps
231%
Iris Plus Graphics 640:
24.9 fps
100%
HD Graphics 5300:
7.3 fps
100%
HD Graphics 5300:
8 fps
350%
Iris Plus Graphics 640:
28 fps
100%
HD Graphics 5300:
3 fps
433%
Iris Plus Graphics 640:
13 fps
100%
HD Graphics 5300:
5.7 fps
100%
HD Graphics 5300:
2.4 fps
100%
HD Graphics 5300:
6.6 fps
379%
Iris Plus Graphics 640:
23.5 25.8 ~ 25 fps
100%
HD Graphics 5300:
3.9 fps
462%
Iris Plus Graphics 640:
16.7 19.4 ~ 18 fps
Iris Plus Graphics 640:
9.1 fps
100%
HD Graphics 5300:
13.2 fps
87%
HD Graphics (Cherry Trail):
11.5 fps
100%
HD Graphics 5300:
8.5 fps
82%
HD Graphics (Cherry Trail):
7 fps
100%
HD Graphics 5300:
5 fps
Iris Plus Graphics 640:
14.2 fps
100%
HD Graphics 5300:
9.9 fps
100%
HD Graphics 5300:
7.7 fps
100%
HD Graphics 5300:
13.8 fps
324%
Iris Plus Graphics 640:
44.7 fps
64%
HD Graphics (Cherry Trail):
8.8 fps
100%
HD Graphics 5300:
7.4 fps
354%
Iris Plus Graphics 640:
26.2 fps
65%
HD Graphics (Cherry Trail):
4.8 fps
Iris Plus Graphics 640:
12.9 fps
100%
HD Graphics 5300:
10.6 fps
76%
HD Graphics (Cherry Trail):
8.1 fps
100%
HD Graphics 5300:
6.1 fps
64%
HD Graphics (Cherry Trail):
3.9 fps
100%
HD Graphics 5300:
26.3 fps
100%
HD Graphics 5300:
15.3 fps
100%
HD Graphics 5300:
26 fps
58%
HD Graphics (Cherry Trail):
13.9 [X] Chuwi Hi12 Intel Atom x5-Z8300 1.4GHz
HD Graphics (Cherry Trail)
min:
7 fps, max:
19 fps
16.8 ~ 15 fps
100%
HD Graphics 5300:
17.7 fps
100%
HD Graphics 5300:
8.4 fps
100%
HD Graphics 5300:
20.6 fps
73%
HD Graphics (Cherry Trail):
15.1 fps
100%
HD Graphics 5300:
12.4 fps
79%
HD Graphics (Cherry Trail):
9.8 fps
Iris Plus Graphics 640:
68 92 ~ 80 fps
HD Graphics (Cherry Trail):
20 [X] Chuwi Hi12 Intel Atom x5-Z8300 1.4GHz
HD Graphics (Cherry Trail)
min:
18 fps
fps
Iris Plus Graphics 640:
55 63.7 ~ 59 fps
HD Graphics (Cherry Trail):
15.2 [X] Chuwi Hi12 Intel Atom x5-Z8300 1.4GHz
HD Graphics (Cherry Trail)
min:
13 fps
fps
Iris Plus Graphics 640:
27.6 29.5 ~ 29 fps
HD Graphics (Cherry Trail):
7.2 [X] Chuwi Hi12 Intel Atom x5-Z8300 1.4GHz
HD Graphics (Cherry Trail)
min:
6 fps
fps
Iris Plus Graphics 640:
19.8 23 ~ 21 fps
100%
HD Graphics 5300:
5 fps
100%
HD Graphics 5300:
4 fps
100%
HD Graphics 5300:
6.2 fps
100%
HD Graphics 5300:
3.7 fps
362%
Iris Plus Graphics 640:
13.4 fps
Iris Plus Graphics 640:
4 fps
100%
HD Graphics 5300:
41 fps
49%
HD Graphics (Cherry Trail):
20.1 fps
100%
HD Graphics 5300:
12.5 fps
100%
HD Graphics (Cherry Trail):
12.5 fps
Iris Plus Graphics 640:
56.7 fps
HD Graphics (Cherry Trail):
10.8 (!) [X] Microsoft Surface 3 Intel Atom x7-Z8700 1.6GHz
HD Graphics (Cherry Trail)
fps
Iris Plus Graphics 640:
28.9 fps
Iris Plus Graphics 640:
11.8 fps
100%
HD Graphics 5300:
15.3 fps
100%
HD Graphics 5300:
11 fps
100%
HD Graphics 5300:
5 fps
100%
HD Graphics 5300:
3.1 fps
100%
HD Graphics 5300:
7 fps
100%
HD Graphics 5300:
5.1 fps
100%
HD Graphics 5300:
2.8 fps
100%
HD Graphics 5300:
1.1 fps
100%
HD Graphics 5300:
11 11.9 ~ 11 fps
86%
HD Graphics (Cherry Trail):
9.5 fps
100%
HD Graphics 5300:
7.6 8.2 ~ 8 fps
71%
HD Graphics (Cherry Trail):
5.7 fps
100%
HD Graphics 5300:
3 3.1 ~ 3 fps
100%
HD Graphics 5300:
1.6 fps
100%
HD Graphics 5300:
9.2 fps
100%
HD Graphics 5300:
6.8 fps
100%
HD Graphics 5300:
3.5 fps
100%
HD Graphics 5300:
1.7 fps
100%
HD Graphics 5300:
21.2 fps
76%
HD Graphics (Cherry Trail):
16.2 fps
100%
HD Graphics 5300:
8.8 fps
69%
HD Graphics (Cherry Trail):
6.1 fps
100%
HD Graphics 5300:
5.8 fps
100%
HD Graphics 5300:
4.5 fps
100%
HD Graphics 5300:
33 34 39 ~ 35 fps
46%
HD Graphics (Cherry Trail):
16 fps
100%
HD Graphics 5300:
20 20 25 ~ 22 fps
55%
HD Graphics (Cherry Trail):
12 fps
100%
HD Graphics 5300:
12 13 14 ~ 13 fps
100%
HD Graphics 5300:
12 fps
100%
HD Graphics 5300:
8 fps
100%
HD Graphics 5300:
6.5 fps
100%
HD Graphics 5300:
7.1 fps
100%
HD Graphics 5300:
4.6 fps
100%
HD Graphics 5300:
4.6 fps
100%
HD Graphics 5300:
4.3 5 5.3 ~ 5 fps
68%
HD Graphics (Cherry Trail):
15.6 fps
100%
HD Graphics 5300:
8.3 fps
100%
HD Graphics 5300:
91 fps
100%
HD Graphics 5300:
17.6 fps
100%
HD Graphics 5300:
8.5 fps
336%
Iris Plus Graphics 640:
28.6 fps
94%
HD Graphics (Cherry Trail):
5.5 10 ~ 8 fps
100%
HD Graphics 5300:
6.6 fps
318%
Iris Plus Graphics 640:
20.2 20.8 ~ 21 fps
100%
HD Graphics 5300:
17.3 fps
100%
HD Graphics 5300:
11.7 fps
100%
HD Graphics 5300:
4.6 fps
50%
HD Graphics (Cherry Trail):
22 27.3 ~ 25 fps
81%
HD Graphics (Cherry Trail):
12.5 13.5 ~ 13 fps
100%
HD Graphics 5300:
12.5 12.5 ~ 13 fps
100%
HD Graphics 5300:
12.5 fps
100%
HD Graphics 5300:
18.3 fps
100%
HD Graphics 5300:
11.1 fps
100%
HD Graphics 5300:
7.6 fps
100%
HD Graphics 5300:
8.3 [X] HP Elitebook Folio 1020 G1 H9V72EA Intel Core M-5Y51 1.1GHz
HD Graphics 5300
9.3 9.5 10.8 ~ 9 fps
100%
HD Graphics 5300:
5.1 5.3 5.5 [X] HP Elitebook Folio 1020 G1 H9V72EA Intel Core M-5Y51 1.1GHz
HD Graphics 5300
6.9 ~ 6 fps
100%
HD Graphics 5300:
4.3 4.3 4.4 4.6 [X] HP Elitebook Folio 1020 G1 H9V72EA Intel Core M-5Y51 1.1GHz
HD Graphics 5300
~ 4 fps
100%
HD Graphics 5300:
2 [X] HP Elitebook Folio 1020 G1 H9V72EA Intel Core M-5Y51 1.1GHz
HD Graphics 5300
2.2 ~ 2 fps
100%
HD Graphics 5300:
26.7 fps
100%
HD Graphics 5300:
10.7 fps
100%
HD Graphics 5300:
3.9 fps
100%
HD Graphics 5300:
3.4 fps
100%
HD Graphics 5300:
15.2 fps
342%
Iris Plus Graphics 640:
43.1 60.3 ~ 52 fps
88%
HD Graphics (Cherry Trail):
13.3 fps
100%
HD Graphics 5300:
11.6 fps
310%
Iris Plus Graphics 640:
29.7 42 ~ 36 fps
100%
HD Graphics 5300:
7.5 fps
360%
Iris Plus Graphics 640:
23.2 30.7 ~ 27 fps
Iris Plus Graphics 640:
8.2 9.9 ~ 9 fps
100%
HD Graphics 5300:
91.4 fps
100%
HD Graphics 5300:
48.8 fps
100%
HD Graphics 5300:
45.2 fps
100%
HD Graphics 5300:
21.6 fps
100%
HD Graphics 5300:
24.9 fps
100%
HD Graphics 5300:
17.4 fps
100%
HD Graphics 5300:
13 fps
100%
HD Graphics 5300:
3.6 fps
100%
HD Graphics 5300:
18.2 fps
100%
HD Graphics 5300:
11.7 fps
HD Graphics (Cherry Trail):
58 fps
HD Graphics (Cherry Trail):
47 fps
100%
HD Graphics 5300:
33.1 48 50.9 51.2 [X] HP Elitebook Folio 1020 G1 H9V72EA Intel Core M-5Y51 1.1GHz
HD Graphics 5300
53.6 ~ 47 fps
63%
HD Graphics (Cherry Trail):
29.7 fps
100%
HD Graphics 5300:
21.4 23.2 26.7 28.6 29.7 [X] HP Elitebook Folio 1020 G1 H9V72EA Intel Core M-5Y51 1.1GHz
HD Graphics 5300
~ 26 fps
63%
HD Graphics (Cherry Trail):
16.5 fps
100%
HD Graphics 5300:
9.8 12.2 14.9 15.4 [X] HP Elitebook Folio 1020 G1 H9V72EA Intel Core M-5Y51 1.1GHz
HD Graphics 5300
~ 13 fps
100%
HD Graphics 5300:
8.3 fps
100%
HD Graphics 5300:
41 fps
59%
HD Graphics (Cherry Trail):
24 fps
100%
HD Graphics 5300:
21.3 fps
63%
HD Graphics (Cherry Trail):
13.5 fps
100%
HD Graphics 5300:
15 fps
100%
HD Graphics 5300:
13.3 fps
100%
HD Graphics 5300:
10.1 fps
100%
HD Graphics 5300:
6.1 fps
100%
HD Graphics 5300:
3.2 fps
232%
Iris Plus Graphics 640:
61 68.2 ~ 65 fps
287%
Iris Plus Graphics 640:
40.2 45.1 ~ 43 fps
300%
Iris Plus Graphics 640:
33.5 38.3 ~ 36 fps
400%
Iris Plus Graphics 640:
10.7 12.5 ~ 12 fps
67%
HD Graphics (Cherry Trail):
2.4 2.6 ~ 2 fps
100%
HD Graphics 5300:
28.3 35.7 ~ 32 fps
100%
HD Graphics 5300:
18 20.5 ~ 19 fps
100%
HD Graphics 5300:
6.5 fps
100%
HD Graphics 5300:
26 fps
100%
HD Graphics 5300:
12.4 fps
100%
HD Graphics 5300:
8 fps
347%
Iris Plus Graphics 640:
103 132.6 ~ 118 fps
339%
Iris Plus Graphics 640:
54.1 68.7 ~ 61 fps
350%
Iris Plus Graphics 640:
37 47.1 ~ 42 fps
67%
HD Graphics (Cherry Trail):
7 8.3 9 ~ 8 fps
317%
Iris Plus Graphics 640:
17.2 21.6 ~ 19 fps
67%
HD Graphics (Cherry Trail):
3.7 3.8 ~ 4 fps
100%
HD Graphics 5300:
12.5 fps
100%
HD Graphics 5300:
7.5 fps
100%
HD Graphics 5300:
4.2 fps
100%
HD Graphics 5300:
1.7 fps
100%
HD Graphics 5300:
35.9 fps
100%
HD Graphics 5300:
18.3 fps
100%
HD Graphics 5300:
13.9 fps
100%
HD Graphics 5300:
7.1 fps
HD Graphics (Cherry Trail):
34 fps
100%
HD Graphics 5300:
19.4 fps
100%
HD Graphics 5300:
12.6 fps
100%
HD Graphics 5300:
6.5 fps
100%
HD Graphics 5300:
33 fps
100%
HD Graphics 5300:
24 fps
100%
HD Graphics 5300:
11.8 fps
HD Graphics (Cherry Trail):
15.2 fps
HD Graphics (Cherry Trail):
11.6 fps
100%
HD Graphics 5300:
20.2 fps
0%
HD Graphics (Cherry Trail):
0 (!) [X] Microsoft Surface 3 Intel Atom x7-Z8700 1.6GHz
HD Graphics (Cherry Trail)
fps
100%
HD Graphics 5300:
11.3 fps
0%
HD Graphics (Cherry Trail):
0 (!) [X] Microsoft Surface 3 Intel Atom x7-Z8700 1.6GHz
HD Graphics (Cherry Trail)
fps
100%
HD Graphics 5300:
9.5 fps
100%
HD Graphics 5300:
4 fps
100%
HD Graphics 5300:
46.6 fps
100%
HD Graphics 5300:
12.9 fps
100%
HD Graphics 5300:
5.6 fps
100%
HD Graphics 5300:
53.5 62 73 ~ 63 fps
70%
HD Graphics (Cherry Trail):
20.3 fps
63%
HD Graphics (Cherry Trail):
11.4 fps
100%
HD Graphics 5300:
20.2 21.3 ~ 21 fps
100%
HD Graphics 5300:
14.1 17 ~ 16 fps
100%
HD Graphics 5300:
7.1 7.2 ~ 7 fps
78%
HD Graphics (Cherry Trail):
24.3 [X] Chuwi Hi12 Intel Atom x5-Z8300 1.4GHz
HD Graphics (Cherry Trail)
min:
20 fps, max:
29 fps
31.9 ~ 28 fps
78%
HD Graphics (Cherry Trail):
16 [X] Chuwi Hi12 Intel Atom x5-Z8300 1.4GHz
HD Graphics (Cherry Trail)
min:
13 fps, max:
19 fps
19 ~ 18 fps
100%
HD Graphics 5300:
12 18 28.9 ~ 20 fps
100%
HD Graphics 5300:
10.6 20 ~ 15 fps
235%
Iris Plus Graphics 640:
35.2 fps
100%
HD Graphics 5300:
11.2 fps
100%
HD Graphics 5300:
6.4 fps
100%
HD Graphics 5300:
40.5 45 ~ 43 fps
67%
HD Graphics (Cherry Trail):
8 fps
100%
HD Graphics 5300:
4.8 fps
100%
HD Graphics 5300:
19.5 fps
87%
HD Graphics (Cherry Trail):
15.5 18.9 ~ 17 fps
100%
HD Graphics 5300:
9.2 fps
87%
HD Graphics (Cherry Trail):
7.2 8.5 ~ 8 fps
100%
HD Graphics 5300:
5.8 fps
100%
HD Graphics 5300:
3.2 fps
100%
HD Graphics 5300:
16.3 fps
100%
HD Graphics 5300:
12.7 fps
100%
HD Graphics 5300:
9.7 fps
100%
HD Graphics 5300:
40.9 fps
63%
HD Graphics (Cherry Trail):
25.6 fps
100%
HD Graphics 5300:
21.5 fps
56%
HD Graphics (Cherry Trail):
12 fps
100%
HD Graphics 5300:
57.4 fps
49%
HD Graphics (Cherry Trail):
28.1 fps
100%
HD Graphics 5300:
26.5 fps
47%
HD Graphics (Cherry Trail):
12.5 fps
100%
HD Graphics 5300:
16.7 fps
HD Graphics (Cherry Trail):
18.7 fps
100%
HD Graphics 5300:
18.9 [X] HP Elitebook Folio 1020 G1 H9V72EA Intel Core M-5Y51 1.1GHz
HD Graphics 5300
fps
100%
HD Graphics 5300:
15.4 [X] HP Elitebook Folio 1020 G1 H9V72EA Intel Core M-5Y51 1.1GHz
HD Graphics 5300
fps
100%
HD Graphics 5300:
13.4 [X] HP Elitebook Folio 1020 G1 H9V72EA Intel Core M-5Y51 1.1GHz
HD Graphics 5300
fps
100%
HD Graphics 5300:
8.8 [X] HP Elitebook Folio 1020 G1 H9V72EA Intel Core M-5Y51 1.1GHz
HD Graphics 5300
fps
HD Graphics (Cherry Trail):
63.2 64 ~ 64 fps
HD Graphics (Cherry Trail):
18 18.8 ~ 18 fps
HD Graphics (Cherry Trail):
14 fps
HD Graphics (Cherry Trail):
7 fps
100%
HD Graphics 5300:
16 fps
100%
HD Graphics 5300:
8.1 fps
100%
HD Graphics 5300:
4.7 fps
100%
HD Graphics 5300:
33.1 fps
100%
HD Graphics 5300:
25 fps
100%
HD Graphics 5300:
16 fps
100%
HD Graphics 5300:
20.3 60 ~ 40 fps
100%
HD Graphics 5300:
14.5 22.7 ~ 19 fps
100%
HD Graphics 5300:
16 fps
100%
HD Graphics 5300:
48.1 fps
100%
HD Graphics 5300:
21.4 fps
100%
HD Graphics 5300:
10.3 fps
100%
HD Graphics 5300:
188 fps
100%
HD Graphics 5300:
52.3 fps
100%
HD Graphics 5300:
21.8 fps
100%
HD Graphics 5300:
92 fps
51%
HD Graphics (Cherry Trail):
44 50.9 [X] Chuwi Hi12 Intel Atom x5-Z8300 1.4GHz
HD Graphics (Cherry Trail)
min:
40 fps, max:
60 fps
~ 47 fps
100%
HD Graphics 5300:
39 43.6 ~ 41 fps
45%
HD Graphics (Cherry Trail):
18.3 [X] Chuwi Hi12 Intel Atom x5-Z8300 1.4GHz
HD Graphics (Cherry Trail)
min:
13 fps, max:
29 fps
fps
100%
HD Graphics 5300:
12.6 31 ~ 22 fps
130%
Iris Plus Graphics 640:
28.5 fps
100%
HD Graphics 5300:
8 fps
Average Gaming Intel HD Graphics 5300 → 100% Average Gaming 30-70 fps → 100%
Average Gaming Intel Iris Plus Graphics 640 → 330% Average Gaming 30-70 fps → 316%
Average Gaming Intel HD Graphics (Cherry Trail) → 65% Average Gaming 30-70 fps → 51%
v1.28
log 21. 17:39:15
#0 ran 0s before starting gpusingle class +0s ... 0s
#1 checking url part for id 5939 +0s ... 0s
#2 checking url part for id 7656 +0s ... 0s
#3 checking url part for id 6197 +0s ... 0s
#4 redirected to Ajax server, took 1726933155s time from redirect:0 +0s ... 0s
#5 did not recreate cache, as it is less than 5 days old! Created at Thu, 19 Sep 2024 05:16:33 +0200 +0s ... 0s
#6 composed specs +0.007s ... 0.007s
#7 did output specs +0s ... 0.007s
#8 start showIntegratedCPUs +0s ... 0.007s
#9 getting avg benchmarks for device 5939 +0.002s ... 0.009s
#10 got single benchmarks 5939 +0.003s ... 0.012s
#11 getting avg benchmarks for device 7656 +0s ... 0.012s
#12 got single benchmarks 7656 +0.001s ... 0.013s
#13 getting avg benchmarks for device 6197 +0.001s ... 0.014s
#14 got single benchmarks 6197 +0.003s ... 0.017s
#15 got avg benchmarks for devices +0s ... 0.017s
#16 min, max, avg, median took s +0.026s ... 0.043s
#17 before gaming benchmark output +0s ... 0.043s
#18 Got 834 rows for game benchmarks. +0.04s ... 0.083s
#19 composed SQL query for gamebenchmarks +0s ... 0.083s
#20 got data and put it in $dataArray +0.005s ... 0.088s
#21 benchmarks composed for output. +0.028s ... 0.116s
#22 calculated avg scores. +0s ... 0.116s
#23 return log +0.001s ... 0.118s
Teilen Sie diesen Artikel, um uns zu unterstützen. Jeder Link hilft!
Autor: Klaus Hinum, 8.09.2017 (Update: 1.07.2023)
 Deutsch
 English
 Español
 Français
 Italiano
 Nederlands
 Polski
 Português
 Русский
 Türkçe
 Svenska
 Chinese
 Magyar