Intel HD Graphics 4200 vs Intel HD Graphics 615 vs Intel HD Graphics (Cherry Trail)
Intel HD Graphics 4200 ► remove from comparison
Die Intel HD Graphics 4200 (GT2) ist eine Low-End Prozessorgrafikkarte in einigen besonders sparsamen ULV-CPUs der Haswell- Generation.
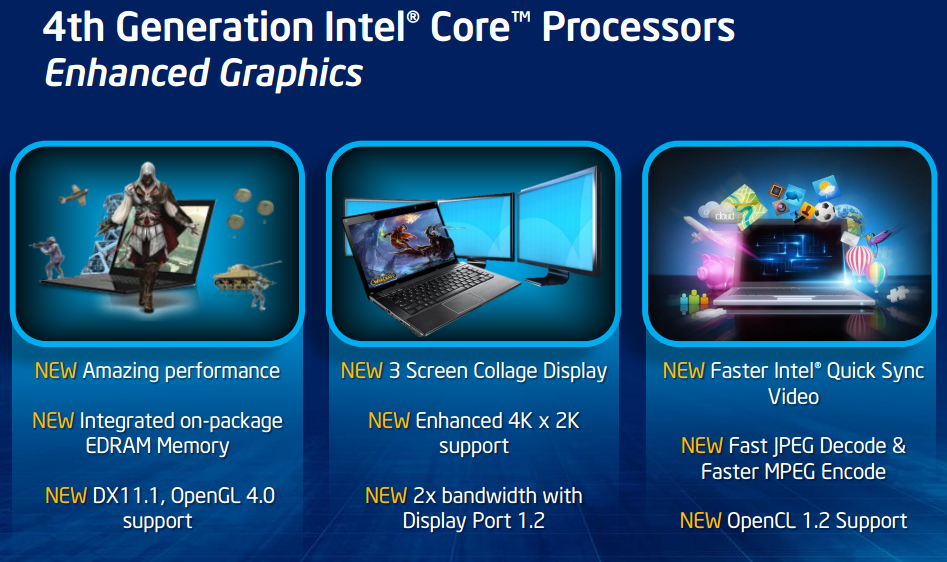
Der Grafikkern wurde im Vergleich zum Intel HD Graphics 4000 der Ivy-Bridge-Generation in verschiedenen Punkten weiterentwickelt. So unterstützt die GPU nun mit DirectX 11.1, OpenCL 1.2 und OpenGL 4.0 alle wichtigen aktuellen Standards. Auch ein verbesserter Decoder für 4K-Videos sowie ein überarbeiteter Quick-Sync-Encoder sind mit an Bord.
Die Performance der HD Graphics 4200 liegt im Schnitt noch deutlich unter der HD 4600 und HD 4400 , da die GPU für ULV-Modelle der Y-Serie (11,5 Watt TDP) mit sehr niedriger Taktrate vorgesehen ist. Insgesamt entspricht die Leistung trotz der geringeren Kernfrequenz in etwa der HD 4000 der Ivy-Bridge-Generation. Neben architektonischen Verbesserungen wird dies vor allem über eine gesteigerte Zahl an Ausführungseinheiten erreicht: Die GT2-Ausbaustufe integriert nun 20 (HD 4000: 16) der sogenannten EUs.
In einfachen Spielen wie Anno 2070 oder Counter Strike: Global Offensive genügt die Performance, um niedrige Einstellungen und 1.024 x 768 Pixel zu bewältigen. Viele aktuelle Titel wie Battlefield 4 sind hingegen selbst bei minimaler grafischer Qualität nicht flüssig spielbar. Detaillierte Benchmarks können sie weiter unten auf dieser Seite finden.
Der Stromverbrauch ist dank des 22-Nanometer-Prozesses mit Tri-Gate-Transistoren relativ gering und wird dynamisch vom TDP-Budget des gesamten Chips abgezweigt. Zusätzlich zur TDP von 11,5 Watt gibt Intel auch eine durchschnittliche Leistungsaufnahme (SDP) an, die je nach Modell bei 4,5 oder 6 Watt liegt.
Weitere Details zur Grafikkartenarchitektur der Haswell Generation finden Sie in unserem Artikel zur Haswell-Architektur sowie dem Bericht vom IDF 2012 .
Intel HD Graphics 615 ► remove from comparison
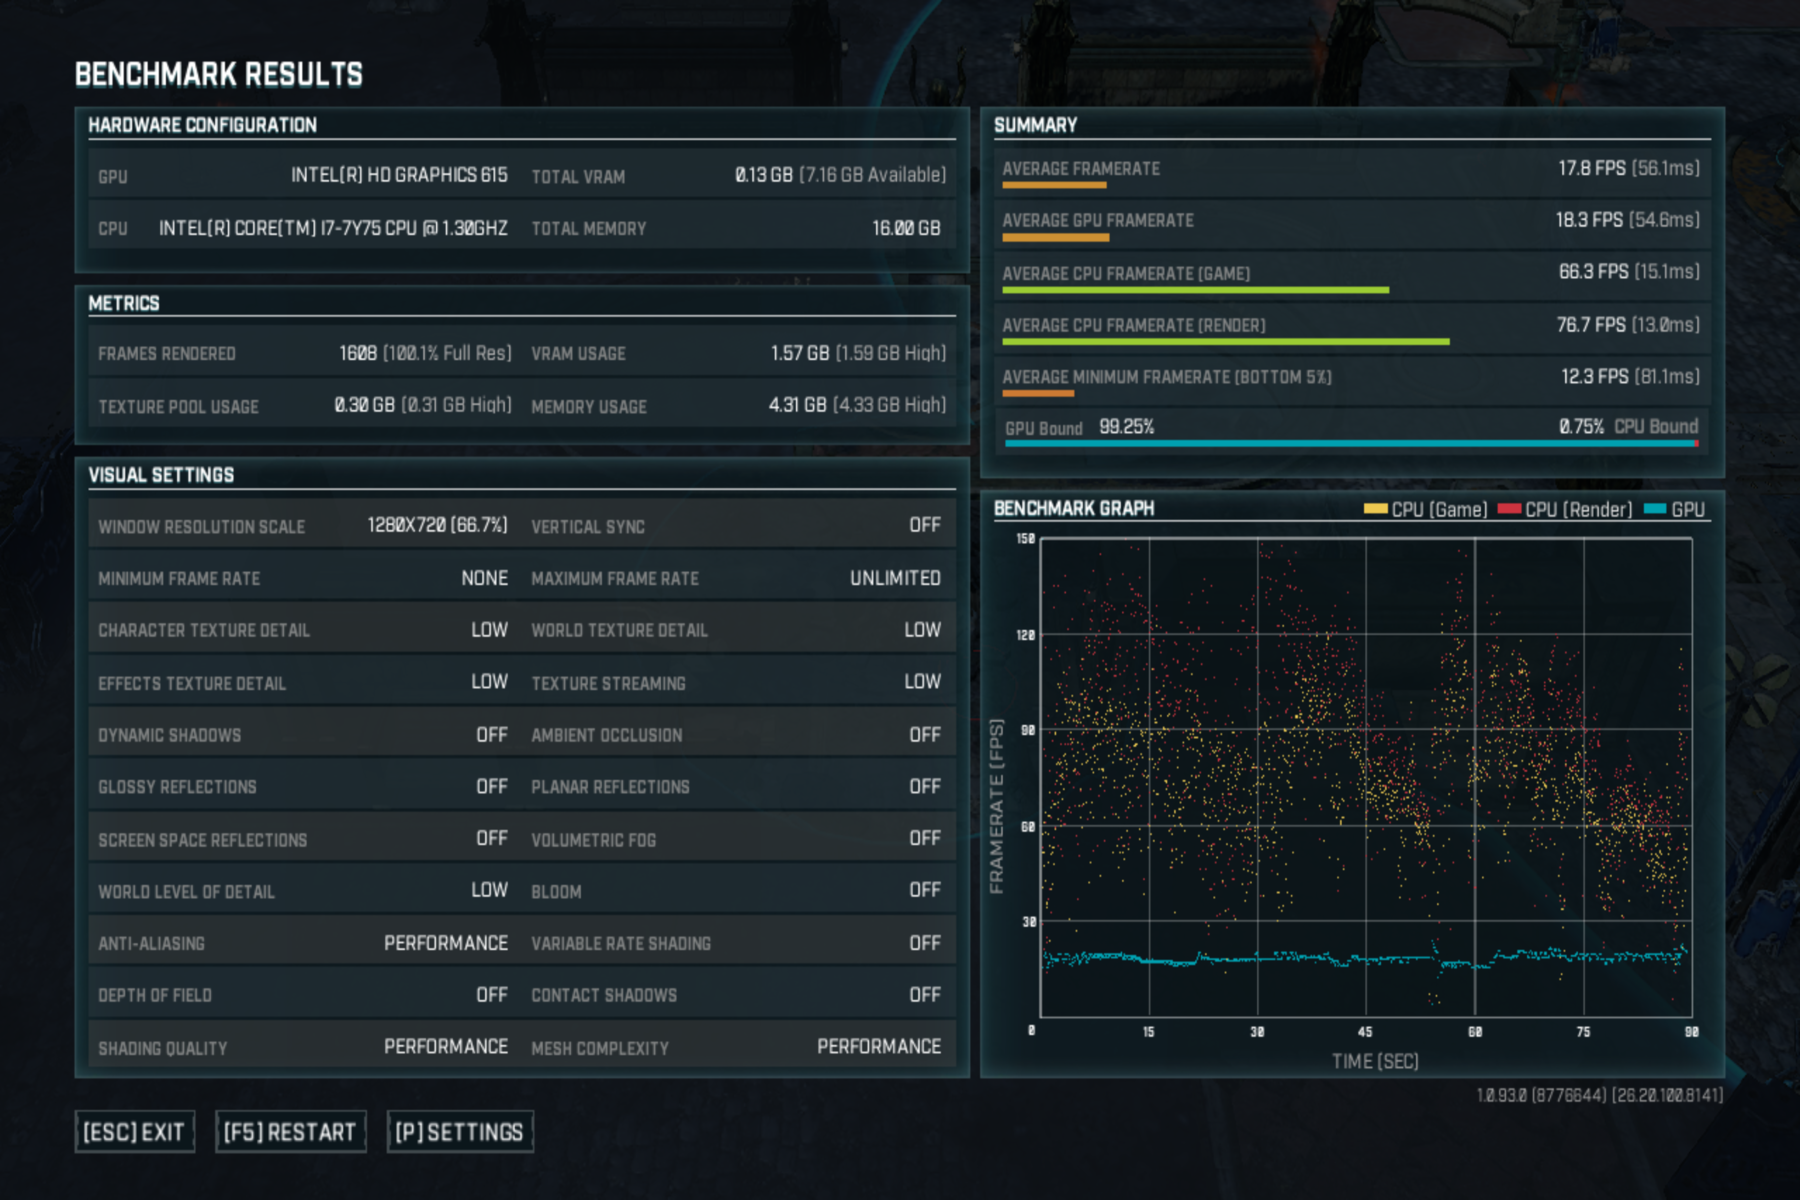
Die Intel HD Graphics 615 (GT2) ist eine Prozessorgrafikkarte der im Sommer 2016 vorgestellten Kaby-Lake-Generation. Als Nachfolger der Intel HD Graphics 515 (Skylake) ist die HD 615 dabei in der besonders sparsamen Y-Serie mit 4,5 Watt TDP zu finden. Die sogenannte GT2-Ausbaustufe der Kaby-Lake-GPU verfügt über 24 Ausführungseinheiten (EUs) und taktet je nach Modell mit bis zu 1.050 MHz.
Mangels eigenem Grafikspeicher oder eDRAM-Cache greift die HD Graphics 615 über das Interface des Prozessors auf den System-RAM zu (2x 64 Bit DDR3L/LPDDR3).
Performance
Die exakte Leistung der HD Graphics 615 hängt stark vom jeweiligen CPU-Modell sowie dem konkreten Endgerät ab, da sich Maximaltaktrate sowie TDP-Konfiguration/Kühlung erheblich unterscheiden können. Zum anderen bestimmt auch der verwendete Speicher (DDR3L/LPDDR3) die Performance. Insgesamt dürfte die HD 615 etwa 20 bis 30 Prozent schneller als ihr Vorgänger HD Graphics 515 rechnen und im Optimalfall in etwa das Niveau der HD Graphics 520 erreichen. Einige Spiele des Jahres 2016 können so in niedrig(st)en Einstellungen flüssig dargestellt werden.
Anders als Skylake kann Kaby Lake nun auch H.265/HEVC im Main10-Profil mit 10 Bit Farbtiefe sowie Googles VP9-Codec in Hardware decodieren. Die ersten ausgelieferten Kaby-Lake CPUs unterstützen allerdings noch kein HDCP 2.2, was beispielsweise für die Ausgabe von Netflix-Videos in 4K benötigt wird. Dies wurde erst ab 2017 mit den neuen CPUs und ab April mit den alten CPUs (neue Kennung) ermöglicht. HDMI 2.0 unterstützt die HD Graphics 615 jedoch weiterhin nur per Wandler (LSPCon) über den DisplayPort.
Leistungsaufnahme
Die HD Graphics 615 ist in ULV-Prozessoren der 4,5-Watt-Klasse zu finden (TDP kann vom Gerätehersteller angepasst werden) und damit für passiv gekühlte Tablets und Ultrabooks geeignet.
Intel HD Graphics (Cherry Trail) ► remove from comparison
Die Intel HD Graphics (Cherry Trail) ist eine in den Tablet-SoCs der Cherry-Trail-Serie (z.B. Atom x7-Z8700 ) integrierte Grafikeinheit. Sie basiert auf der gleichen Architektur wie die GPU verschiedener Broadwell-Prozessoren (z.B. HD Graphics 5300 ), bietet allerdings deutlich weniger Shadereinheiten und geringere Taktraten. Die genauen Spezifikationen hängen vom jeweiligen SoC ab:
Die schnellste Variante mit 16 EUs und maximal 600 MHz schlägt die ältere HD Graphics (Bay Trail) um Faktor zwei, womit sich die GPU etwas oberhalb einer Qualcomm Adreno 330 oder PowerVR G6430 , jedoch deutlich unter einer Adreno 420 oder GX6450 einordnet. Auch Nvidias Tegra-SoCs K1 und X1 rechnen weitaus schneller.
Unter Windows werden sich Anwender deshalb weiter auf sehr alte und anspruchslose Spiele beschränken müssen, wohingegen moderne Android-Games auch in hohen Auflösungen zumeist flüssig dargestellt werden sollten. Der x7-Z8700 war z.B. nur knapp in der Lage Team Fortress 2 in minimalen Details und 1280x720 flüssig wiederzugeben (11 - 69 fps).
Videos kann die GPU auch in 4K/H.265 flüssig wiedergeben (je nach Bitrate und Farbtiefe).
Die Intel HD Graphics Grafikkarte in den Cherry Trail SoCs unterstützt nach unseren Tests mit dem MS Surface 3 mit Atom x7-Z8700 nur DisplayPort 1.1 und damit lediglich 30 Hz bei 4K (3.840 x 2.160).
Intel HD Graphics 4200 Intel HD Graphics 615 Intel HD Graphics (Cherry Trail) HD Graphics Serie Codename Haswell GT2 Kaby-Lake GT2 Cherry Trail Architektur Gen. 7.5 Haswell Gen. 9 Kaby Lake Gen. 8 Pipelines 20 - unified 24 - unified 16 - unified Kerntakt 200 - 850 (Boost) MHz 300 - 1050 (Boost) MHz 200 - 600 (Boost) MHz Speicherbandbreite 64/128 Bit 64/128 Bit 64/128 Bit Shared Memory ja ja ja API DirectX 11.1, Shader 5.0, OpenGL 4.0 DirectX 12_1, OpenGL 4.4 DirectX 12 (FL 11_1), Shader 5.0, OpenGL 4.3 Herstellungsprozess 22 nm 14 nm 14 nm Features QuickSync QuickSync Erscheinungsdatum 05.06.2013 30.08.2016 02.03.2015 Speichertyp DDR3L/LPDDR3
CPU in HD Graphics 4200 GPU Base Speed GPU Boost / Turbo Intel Core i7-4610Y 2 x 1700 MHz, 11.5 W 200 MHz 850 MHz Intel Core i5-4300Y 2 x 1600 MHz, 11.5 W 200 MHz 850 MHz Intel Core i5-4302Y 2 x 1600 MHz, 11.5 W 200 MHz 850 MHz » show 8 more Intel Core i5-4202Y 2 x 1600 MHz, 11.5 W 200 MHz 850 MHz Intel Core i5-4220Y 2 x 1600 MHz, 11.5 W 200 MHz 850 MHz Intel Core i5-4210Y 2 x 1500 MHz, 11.5 W 200 MHz 850 MHz Intel Core i5-4200Y 2 x 1400 MHz, 11.5 W 200 MHz 850 MHz Intel Core i3-4030Y 2 x 1600 MHz, 11.5 W 200 MHz 850 MHz Intel Core i3-4020Y 2 x 1500 MHz, 11.5 W 200 MHz 850 MHz Intel Core i3-4012Y 2 x 1500 MHz, 11.5 W 200 MHz 850 MHz Intel Core i3-4010Y 2 x 1300 MHz, 11.5 W 200 MHz 850 MHz min. - max. 200 MHz 850 MHz
CPU in HD Graphics 615 GPU Base Speed GPU Boost / Turbo Intel Core i7-7Y75 2 x 1300 MHz, 4.5 W 300 MHz 1050 MHz Intel Core i5-7Y57 2 x 1200 MHz, 4.5 W 300 MHz 950 MHz Intel Core i5-7Y54 2 x 1200 MHz, 4.5 W 300 MHz 950 MHz » show 5 more Intel Core m3-7Y32 2 x 1000 MHz, 4.5 W 300 MHz 900 MHz Intel Core m3-7Y30 2 x 1000 MHz, 4.5 W 300 MHz 900 MHz Intel Pentium Gold 4415Y 2 x 1600 MHz, 6 W 300 MHz 850 MHz Intel Pentium Gold 4410Y 2 x 1500 MHz, 6 W 300 MHz 850 MHz Intel Celeron 3965Y 2 x 1500 MHz, 6 W 300 MHz 850 MHz min. - max. 200 - 300 MHz 850 - 1050 MHz
CPU in HD Graphics (Cherry Trail) GPU Base Speed GPU Boost / Turbo Intel Atom x7-Z8700 4 x 1600 MHz 200 MHz 600 MHz Intel Atom x5-Z8500 4 x 1440 MHz 200 MHz 600 MHz Intel Atom x5-Z8350 4 x 1440 MHz 200 MHz 500 MHz » show 2 more Intel Atom x5-Z8300 4 x 1440 MHz 200 MHz 500 MHz Intel Atom x5-E8000 4 x 1040 MHz, 5 W 320 MHz ? MHz min. - max. 200 - 320 MHz ? - 1050 MHz
Benchmarks Performance Rating - 3DMark 11 + Fire Strike + Time Spy - HD Graphics 4200
0.2 pt (1%)
...
...
max:
Performance Rating - 3DMark 11 + Fire Strike + Time Spy - HD Graphics 615
0.4 pt (1%)
...
...
max:
Performance Rating - 3DMark 11 + Fire Strike + Time Spy - HD Graphics (Cherry Trail)
0.1 pt (0%)
Intel HD Graphics (Cherry Trail)
...
max:
3DMark - 3DMark Time Spy Score
min: 180 avg: 277.2 median: 296.5 (1%) max: 327 Points
3DMark - 3DMark Time Spy Graphics
min: 157 avg: 243.7 median: 261 (1%) max: 288 Points
3DMark - 3DMark Ice Storm Unlimited Graphics
41579 Points (4%)
min: 55271 avg: 69892 median: 70743 (7%) max: 79719 Points
min: 18563 avg: 20873 median: 19303 (2%) max: 27537 Points
3DMark - 3DMark Ice Storm Extreme Graphics
min: 28302 avg: 34366 median: 33200.5 (4%) max: 42163 Points
3DMark - 3DMark Cloud Gate Score
min: 1716 avg: 2853 median: 3027 (3%) max: 3754 Points
min: 4050 avg: 4904 median: 4893 (5%) max: 5828 Points
min: 769 avg: 1454 median: 1488 (2%) max: 1905 Points
3DMark - 3DMark Cloud Gate Graphics
min: 2101 avg: 3793 median: 3807 (1%) max: 5239 Points
min: 5478 avg: 6502 median: 6387 (2%) max: 7839 Points
min: 1537 avg: 1851 median: 1783.5 (0%) max: 2272 Points
3DMark - 3DMark Fire Strike Standard Score
min: 199 avg: 369.6 median: 394.5 (1%) max: 512 Points
min: 582 avg: 750 median: 762 (1%) max: 861 Points
min: 174 avg: 390.4 median: 248 (0%) max: 1059 Points
3DMark - 3DMark Fire Strike Standard Graphics
min: 218 avg: 410.6 median: 431.5 (0%) max: 578 Points
min: 647 avg: 830 median: 853 (1%) max: 965 Points
min: 193 avg: 233 median: 225 (0%) max: 281 Points
3DMark - 3DMark Ice Storm Graphics
min: 17834 avg: 32317 median: 34087 (4%) max: 46175 Points
min: 45589 avg: 54672 median: 50760 (6%) max: 69035 Points
min: 7544 avg: 16078 median: 17063.5 (2%) max: 23395 Points
3DMark - 3DMark Sling Shot (ES 3.0) Unlimited
min: 1445 avg: 1525 median: 1525 (7%) max: 1605 Points
3DMark - 3DMark Sling Shot (ES 3.0) Unlimited Graphics
min: 1598 avg: 1684 median: 1684 (4%) max: 1770 Points
3DMark - 3DMark Sling Shot Extreme (ES 3.1) Unlimited
min: 1072 avg: 1215 median: 1159 (6%) max: 1414 Points
3DMark - 3DMark Sling Shot Extreme (ES 3.1) Unlimited Graphics
min: 1058 avg: 1251 median: 1142 (3%) max: 1554 Points
3DMark - 3DMark Sling Shot (ES 3.0)
3735 Points (33%)
min: 1353 avg: 1429 median: 1398 (12%) max: 1593 Points
3DMark - 3DMark Sling Shot (ES 3.0) Graphics
4380 Points (26%)
min: 1300 avg: 1505 median: 1530 (9%) max: 1732 Points
3DMark - 3DMark Sling Shot Extreme (ES 3.1)
min: 1037 avg: 1133 median: 1070 (5%) max: 1319 Points
3DMark - 3DMark Sling Shot Extreme (ES 3.1) Graphics
min: 973 avg: 1102 median: 1054 (4%) max: 1261 Points
3DMark - 3DMark Night Raid
2461 Points (2%)
3DMark - 3DMark Night Raid Graphics Score
2800 Points (1%)
3DMark 11 - 3DM11 Performance Score
min: 367 avg: 660 median: 712 (1%) max: 828 Points
min: 1141 avg: 1350 median: 1362.5 (2%) max: 1514 Points
min: 314 avg: 359.4 median: 343 (0%) max: 562 Points
3DMark 11 - 3DM11 Performance GPU
min: 329 avg: 624 median: 638 (1%) max: 1060 Points
min: 1032 avg: 1233 median: 1242.5 (1%) max: 1384 Points
min: 278 avg: 319.9 median: 298 (0%) max: 494 Points
3DMark Vantage + Intel HD Graphics 4200 3DMark Vantage - 3DM Vant. Perf. total
min: 2165 avg: 2538 median: 2537.5 (1%) max: 2910 Points
3DM Vant. Perf. total + Intel HD Graphics 615
min: 4081 avg: 4102 median: 4102 (1%) max: 4123 Points
3DM Vant. Perf. GPU no PhysX + Intel HD Graphics 4200 3DMark Vantage - 3DM Vant. Perf. GPU no PhysX
min: 1678 avg: 1985 median: 1807 (1%) max: 2471 Points
3DM Vant. Perf. GPU no PhysX + Intel HD Graphics 615
min: 3514 avg: 3538 median: 3537.5 (2%) max: 3561 Points
3DMark 2001SE - 3DMark 2001 - Standard
19381 Points (20%)
3DMark 03 - 3DMark 03 - Standard
16620 Points (9%)
3DMark 05 - 3DMark 05 - Standard
8649 Points (9%)
3DMark 06 3DMark 06 - Standard 1280x1024 + Intel HD Graphics 4200
min: 2060 avg: 3529 median: 3383 (4%) max: 5020 Points
3DMark 06 - Standard 1280x1024 + Intel HD Graphics 615
min: 6299 avg: 7294 median: 7399 (10%) max: 7991 Points
3DMark 06 - Standard 1280x1024 + Intel HD Graphics (Cherry Trail)
min: 2403 avg: 2833 median: 2595 (3%) max: 3330 Points
3DMark 06 - Standard 1280x768 + Intel HD Graphics 615
6524 Points (9%)
3DMark 06 - Standard 1024x768 + Intel HD Graphics (Cherry Trail)
2877 Points (4%)
Unigine Valley 1.0 - Unigine Valley 1.0 DX
1.2 fps (0%)
Unigine Heaven 2.1 - Heaven 2.1 high
17.4 fps (3%)
5.7 fps (1%)
Cinebench R10 Cinebench R10 Shading (32bit) + Intel HD Graphics 4200 Cinebench R10 - Cinebench R10 Shading (32bit)
min: 1991 avg: 4602 median: 4514 (3%) max: 6367 Points
Cinebench R10 Shading (32bit) + Intel HD Graphics 615
min: 5363 avg: 6543 median: 6470 (5%) max: 7323 Points
Cinebench R10 Shading (32bit) + Intel HD Graphics (Cherry Trail)
min: 1192 avg: 2009 median: 1973 (1%) max: 2551 Points
Cinebench R11.5 Cinebench R11.5 OpenGL 64 Bit + Intel HD Graphics 4200 Cinebench R11.5 - Cinebench R11.5 OpenGL 64 Bit
min: 7.65 avg: 14.1 median: 14.9 (5%) max: 19.67 fps
Cinebench R11.5 OpenGL 64 Bit + Intel HD Graphics 615
min: 23.45 avg: 28.6 median: 27.8 (9%) max: 32.97 fps
Cinebench R11.5 OpenGL 64 Bit + Intel HD Graphics (Cherry Trail)
min: 4.01 avg: 8.8 median: 8.4 (3%) max: 11.71 fps
Cinebench R15 + Intel HD Graphics 4200 Cinebench R15 - Cinebench R15 OpenGL 64 Bit
min: 8.82 avg: 15.6 median: 17 (1%) max: 19.99 fps
Cinebench R15 OpenGL 64 Bit + Intel HD Graphics 615
min: 24.79 avg: 33.1 median: 35 (2%) max: 37.62 fps
Cinebench R15 OpenGL 64 Bit + Intel HD Graphics (Cherry Trail)
min: 6.64 avg: 10.3 median: 9.7 (1%) max: 15.52 fps
Cinebench R15 OpenGL Ref. Match 64 Bit + Intel HD Graphics 4200 Cinebench R15 - Cinebench R15 OpenGL Ref. Match 64 Bit
min: 63.3 avg: 87.8 median: 98 (98%) max: 99.6 %
Cinebench R15 OpenGL Ref. Match 64 Bit + Intel HD Graphics 615
min: 97.7 avg: 97.9 median: 97.8 (98%) max: 99.3 %
Cinebench R15 OpenGL Ref. Match 64 Bit + Intel HD Graphics (Cherry Trail)
min: 98 avg: 98 median: 98 (98%) max: 98.6 %
GFXBench - GFXBench Car Chase Offscreen
min: 6.3 avg: 7.3 median: 7 (1%) max: 9 fps
GFXBench 3.1 - GFXBench Manhattan ES 3.1 Offscreen
42.7 fps (1%)
min: 9.2 avg: 10.8 median: 11 (0%) max: 13 fps
GFXBench 3.0 - GFXBench 3.0 Manhattan Offscreen
min: 8.4 avg: 13.8 median: 13.5 (1%) max: 18 fps
GFXBench (DX / GLBenchmark) 2.7 + Intel HD Graphics 4200 GFXBench (DX / GLBenchmark) 2.7 - GFXBench T-Rex HD Offscreen C24Z16
min: 21 avg: 35.8 median: 37.5 (0%) max: 47 fps
GFXBench T-Rex HD Offscreen C24Z16 + Intel HD Graphics 615
76.3 fps (1%)
GFXBench T-Rex HD Offscreen C24Z16 + Intel HD Graphics (Cherry Trail) min: 22 avg: 30.5 median: 32 (0%) max: 38.5 fps
Basemark ES 2.0 - Basemark ES 2.0
59.8 fps (99%)
Basemark X 1.1 - Basemark X 1.1 High Quality
33662 Points (76%)
Basemark X 1.1 - Basemark X 1.1 Medium Quality
42892 Points (95%)
Basemark GPU 1.2 - Basemark GPU 1.2 Vulkan Official Medium Offscreen 1080
38.3 fps (0%)
Basemark GPU 1.2 - Basemark GPU 1.2 Vulkan Official High Offscreen 2160
3.4 fps (1%)
LuxMark v2.0 64Bit - LuxMark v2.0 Room GPU
min: 102 avg: 113.5 median: 113.5 (1%) max: 125 Samples/s
min: 145 avg: 181 median: 185 (1%) max: 213 Samples/s
min: 48 avg: 58.7 median: 59 (0%) max: 69 Samples/s
LuxMark v2.0 64Bit - LuxMark v2.0 Sala GPU
min: 162 avg: 176.5 median: 176.5 (0%) max: 191 Samples/s
min: 281 avg: 365.3 median: 369 (1%) max: 446 Samples/s
min: 69 avg: 87.7 median: 89 (0%) max: 105 Samples/s
ComputeMark v2.1 - ComputeMark v2.1 Result
min: 469 avg: 486 median: 486 (1%) max: 503 Points
min: 447 avg: 654 median: 693 (1%) max: 783 Points
277 Points (0%)
PassMark PerformanceTest Mobile V1 - PerformanceTest Mobile V1 2D Graphics Tests
18536 Points (6%)
PassMark PerformanceTest Mobile V1 - PerformanceTest Mobile V1 3D Graphics Tests
2667 Points (4%)
Power Consumption - Furmark Stress Test Power Consumption - external Monitor *
17.8 Watt (3%)
Clock Speed - GPU Clock Speed Furmark
630 MHz (25%)
Average Benchmarks Intel HD Graphics 4200 → 100% n=17 Average Benchmarks Intel HD Graphics 615 → 176% n=17 Average Benchmarks Intel HD Graphics (Cherry Trail) → 58% n=17
- Bereich der Benchmarkergebnisse für diese Grafikkarte
- Durchschnittliche Benchmarkergebnisse für diese Grafikkarte
* Smaller numbers mean a higher performance
1 This benchmark is not used for the average calculation
Spiele-Benchmarks Die folgenden Benchmarks basieren auf unseren Spieletests mit Testnotebooks. Die Performance dieser Grafikkarte bei den gelisteten Spielen ist abhängig von der verwendeten CPU, Speicherausstattung, Treiber und auch Betriebssystem. Dadurch müssen die untenstehenden Werte nicht repräsentativ sein. Detaillierte Informationen über das verwendete System sehen Sie nach einem Klick auf den fps-Wert.
HD Graphics 615:
12.4 [X] Eve-Tech Eve V i7 Intel Core i7-7Y75 1.3GHz
HD Graphics 615
min:
1.279 fps, P0.1:
1.412 fps, P1:
4.02 fps, max:
38.7 fps
fps
HD Graphics 615:
34.2 [X] Eve-Tech Eve V i7 Intel Core i7-7Y75 1.3GHz
HD Graphics 615
min:
3.05 fps, P0.1:
13.5 fps, P1:
20.4 fps, max:
121 fps
fps
HD Graphics 615:
15.8 [X] Eve-Tech Eve V i7 Intel Core i7-7Y75 1.3GHz
HD Graphics 615
min:
8.65 fps, P0.1:
8.9 fps, P1:
10.7 fps, max:
34.6 fps
fps
HD Graphics 615:
0 (!) [X] Eve-Tech Eve V i7 Intel Core i7-7Y75 1.3GHz
HD Graphics 615
fps
HD Graphics 615:
0 (!) [X] Eve-Tech Eve V i7 Intel Core i7-7Y75 1.3GHz
HD Graphics 615
fps
HD Graphics 615:
18.2 [X] Eve-Tech Eve V i7 1.47.22.14 D3D12
Intel Core i7-7Y75 1.3GHz
HD Graphics 615
min:
5 fps, P1:
7.54 fps, max:
165 fps
fps
HD Graphics 615:
8 [X] Eve-Tech Eve V i7 1.47.22.14 D3D12
Intel Core i7-7Y75 1.3GHz
HD Graphics 615
min:
5 fps, P1:
5 fps, max:
116 fps
fps
HD Graphics 615:
8.8 [X] Eve-Tech Eve V i7 1.47.22.14 D3D12
Intel Core i7-7Y75 1.3GHz
HD Graphics 615
min:
5 fps, P1:
5 fps, max:
126 fps
fps
HD Graphics 615:
12.1 [X] Eve-Tech Eve V i7 1.47.22.14 D3D12
Intel Core i7-7Y75 1.3GHz
HD Graphics 615
min:
5 fps, P1:
5 fps, max:
108 fps
fps
HD Graphics (Cherry Trail):
21.4 fps
HD Graphics (Cherry Trail):
15.5 fps
HD Graphics (Cherry Trail):
22.6 [X] Chuwi Hi12 Intel Atom x5-Z8300 1.4GHz
HD Graphics (Cherry Trail)
min:
21 fps, max:
27 fps
fps
HD Graphics 615:
36.8 (!) [X] Acer Spin 7 SP714-51-M09D Intel Core i5-7Y54 1.2GHz
HD Graphics 615
fps
100%
HD Graphics 4200:
9.8 fps
100%
HD Graphics 4200:
11.2 fps
100%
HD Graphics 4200:
6.4 fps
100%
HD Graphics 4200:
17.2 fps
143%
HD Graphics 615:
24.6 fps
67%
HD Graphics (Cherry Trail):
11.5 fps
100%
HD Graphics 4200:
10.7 fps
151%
HD Graphics 615:
16.2 fps
65%
HD Graphics (Cherry Trail):
7 fps
100%
HD Graphics 4200:
12 fps
100%
HD Graphics 4200:
11.3 fps
100%
HD Graphics 4200:
19.2 fps
103%
HD Graphics 615:
19.8 fps
46%
HD Graphics (Cherry Trail):
8.8 fps
100%
HD Graphics 4200:
11.5 fps
100%
HD Graphics 615:
11.5 fps
42%
HD Graphics (Cherry Trail):
4.8 fps
100%
HD Graphics 4200:
14.9 fps
100%
HD Graphics 4200:
9.3 fps
100%
HD Graphics 4200:
18 fps
88%
HD Graphics 615:
15.9 fps
45%
HD Graphics (Cherry Trail):
8.1 fps
100%
HD Graphics 4200:
7.7 fps
132%
HD Graphics 615:
10.2 fps
51%
HD Graphics (Cherry Trail):
3.9 fps
100%
HD Graphics 4200:
37.7 fps
132%
HD Graphics 615:
49.9 fps
40%
HD Graphics (Cherry Trail):
13.9 [X] Chuwi Hi12 Intel Atom x5-Z8300 1.4GHz
HD Graphics (Cherry Trail)
min:
7 fps, max:
19 fps
16.8 ~ 15 fps
100%
HD Graphics 4200:
24.8 fps
122%
HD Graphics 615:
30.2 fps
100%
HD Graphics 4200:
30.7 fps
76%
HD Graphics 615:
23.4 fps
49%
HD Graphics (Cherry Trail):
15.1 fps
100%
HD Graphics 4200:
20.5 fps
101%
HD Graphics 615:
20.8 fps
48%
HD Graphics (Cherry Trail):
9.8 fps
HD Graphics (Cherry Trail):
20 [X] Chuwi Hi12 Intel Atom x5-Z8300 1.4GHz
HD Graphics (Cherry Trail)
min:
18 fps
fps
HD Graphics (Cherry Trail):
15.2 [X] Chuwi Hi12 Intel Atom x5-Z8300 1.4GHz
HD Graphics (Cherry Trail)
min:
13 fps
fps
HD Graphics (Cherry Trail):
7.2 [X] Chuwi Hi12 Intel Atom x5-Z8300 1.4GHz
HD Graphics (Cherry Trail)
min:
6 fps
fps
100%
HD Graphics 4200:
8.8 fps
135%
HD Graphics 615:
11.9 fps
100%
HD Graphics 4200:
5.1 fps
100%
HD Graphics 4200:
67.9 fps
105%
HD Graphics 615:
71.6 fps
30%
HD Graphics (Cherry Trail):
20.1 fps
100%
HD Graphics 4200:
15.6 fps
104%
HD Graphics 615:
16.3 fps
80%
HD Graphics (Cherry Trail):
12.5 fps
HD Graphics 615:
19.9 24.2 [X] Eve-Tech Eve V i7 Intel Core i7-7Y75 1.3GHz
HD Graphics 615
min:
0.569 fps, P1:
8.13 fps, max:
41.3 fps
~ 22 fps
HD Graphics (Cherry Trail):
10.8 (!) [X] Microsoft Surface 3 Intel Atom x7-Z8700 1.6GHz
HD Graphics (Cherry Trail)
fps
HD Graphics 615:
6.1 [X] Eve-Tech Eve V i7 Intel Core i7-7Y75 1.3GHz
HD Graphics 615
min:
1.81 fps, P1:
4.13 fps, max:
23.5 fps
fps
100%
HD Graphics 4200:
7.8 fps
100%
HD Graphics 4200:
8.5 18.5 ~ 14 fps
126%
HD Graphics 615:
17.6 fps
68%
HD Graphics (Cherry Trail):
9.5 fps
100%
HD Graphics 4200:
5.7 11.8 ~ 9 fps
136%
HD Graphics 615:
12.2 fps
63%
HD Graphics (Cherry Trail):
5.7 fps
100%
HD Graphics 4200:
6.1 fps
100%
HD Graphics 4200:
3.3 fps
100%
HD Graphics 4200:
7.3 fps
222%
HD Graphics (Cherry Trail):
16.2 fps
100%
HD Graphics 4200:
4.2 fps
145%
HD Graphics (Cherry Trail):
6.1 fps
100%
HD Graphics 4200:
16 fps
344%
HD Graphics 615:
55 fps
100%
HD Graphics (Cherry Trail):
16 fps
100%
HD Graphics 4200:
12 fps
283%
HD Graphics 615:
34 fps
100%
HD Graphics (Cherry Trail):
12 fps
100%
HD Graphics 4200:
12 fps
100%
HD Graphics 4200:
6.6 fps
100%
HD Graphics 4200:
6.2 fps
100%
HD Graphics 4200:
4.2 fps
100%
HD Graphics 4200:
12.9 fps
204%
HD Graphics 615:
26.3 fps
100%
HD Graphics 4200:
9 fps
211%
HD Graphics 615:
19 fps
100%
HD Graphics 4200:
5.1 fps
190%
HD Graphics 615:
9.7 fps
100%
HD Graphics 4200:
9.7 15.1 ~ 12 fps
196%
HD Graphics 615:
23.5 fps
100%
HD Graphics 4200:
8.4 fps
163%
HD Graphics 615:
13.7 fps
100%
HD Graphics 4200:
3.4 4 ~ 4 fps
170%
HD Graphics 615:
6.8 fps
100%
HD Graphics 4200:
15.3 fps
102%
HD Graphics (Cherry Trail):
15.6 fps
100%
HD Graphics 4200:
10.9 fps
100%
HD Graphics 4200:
89.1 fps
100%
HD Graphics 4200:
24.4 fps
377%
HD Graphics 615:
90 94.2 ~ 92 fps
HD Graphics (Cherry Trail):
5.5 10 ~ 8 fps
100%
HD Graphics 4200:
19.9 fps
100%
HD Graphics 4200:
11.7 fps
100%
HD Graphics 4200:
57.5 fps
130%
HD Graphics 615:
74.9 fps
43%
HD Graphics (Cherry Trail):
22 27.3 ~ 25 fps
100%
HD Graphics 4200:
18.9 fps
130%
HD Graphics 615:
24.6 fps
69%
HD Graphics (Cherry Trail):
12.5 13.5 ~ 13 fps
100%
HD Graphics 4200:
9.7 fps
100%
HD Graphics 4200:
6.5 fps
100%
HD Graphics 4200:
27.2 fps
100%
HD Graphics 4200:
21.9 fps
100%
HD Graphics 4200:
43.1 fps
100%
HD Graphics 4200:
23.4 fps
100%
HD Graphics 4200:
15 fps
100%
HD Graphics 4200:
11 14 ~ 13 fps
107%
HD Graphics 615:
13.9 fps
100%
HD Graphics 4200:
5.3 7.1 ~ 6 fps
153%
HD Graphics 615:
9.2 fps
100%
HD Graphics 4200:
5.8 fps
100%
HD Graphics 4200:
13 fps
100%
HD Graphics 4200:
9.8 fps
100%
HD Graphics 4200:
26.2 fps
100%
HD Graphics 4200:
13.9 fps
100%
HD Graphics 4200:
14.1 fps
100%
HD Graphics 4200:
18.4 fps
100%
HD Graphics 4200:
12.7 fps
100%
HD Graphics 4200:
4.2 fps
100%
HD Graphics 4200:
15.9 fps
84%
HD Graphics (Cherry Trail):
13.3 fps
100%
HD Graphics 4200:
10.1 fps
100%
HD Graphics 4200:
6.6 fps
100%
HD Graphics 4200:
2.5 fps
256%
HD Graphics 615:
6.4 fps
100%
HD Graphics 4200:
24 fps
100%
HD Graphics 4200:
14 fps
100%
HD Graphics 4200:
7 fps
100%
HD Graphics 4200:
31 fps
100%
HD Graphics 4200:
21 fps
100%
HD Graphics 4200:
16 fps
100%
HD Graphics 4200:
12 fps
100%
HD Graphics 4200:
90.8 fps
100%
HD Graphics 4200:
59.7 fps
100%
HD Graphics 4200:
33.3 fps
100%
HD Graphics 4200:
22.3 fps
100%
HD Graphics 4200:
27.7 fps
100%
HD Graphics 4200:
18.4 fps
100%
HD Graphics 4200:
13.3 fps
100%
HD Graphics 4200:
4.7 fps
100%
HD Graphics 4200:
11.3 fps
100%
HD Graphics 4200:
8.8 fps
100%
HD Graphics 4200:
5.2 fps
100%
HD Graphics 4200:
3.5 fps
100%
HD Graphics 4200:
11.9 fps
100%
HD Graphics 4200:
8.2 fps
100%
HD Graphics 4200:
6.6 fps
100%
HD Graphics 4200:
17.8 fps
100%
HD Graphics 4200:
10.4 fps
100%
HD Graphics 4200:
5.8 fps
HD Graphics (Cherry Trail):
58 fps
HD Graphics (Cherry Trail):
47 fps
80%
HD Graphics (Cherry Trail):
29.7 fps
83%
HD Graphics (Cherry Trail):
16.5 fps
100%
HD Graphics 4200:
9.8 11.5 ~ 11 fps
100%
HD Graphics 4200:
8.3 fps
100%
HD Graphics 4200:
7 fps
100%
HD Graphics 4200:
4.3 fps
100%
HD Graphics 4200:
51.1 fps
47%
HD Graphics (Cherry Trail):
24 fps
100%
HD Graphics 4200:
25.7 fps
53%
HD Graphics (Cherry Trail):
13.5 fps
100%
HD Graphics 4200:
17.9 fps
100%
HD Graphics 4200:
12.7 fps
159%
HD Graphics 615:
20.2 fps
100%
HD Graphics 4200:
9.1 fps
100%
HD Graphics 4200:
5.3 fps
100%
HD Graphics 4200:
3 fps
100%
HD Graphics 4200:
10.6 11.2 ~ 11 fps
100%
HD Graphics 4200:
2.8 fps
71%
HD Graphics (Cherry Trail):
2.4 2.6 ~ 2 fps
100%
HD Graphics 4200:
95 109.2 ~ 102 fps
100%
HD Graphics 4200:
31 38.8 ~ 35 fps
100%
HD Graphics 4200:
20 22.7 ~ 21 fps
100%
HD Graphics 4200:
7 fps
100%
HD Graphics 4200:
18.8 fps
100%
HD Graphics 4200:
10.1 fps
100%
HD Graphics 4200:
6.8 fps
170%
HD Graphics 615:
16 18.4 ~ 17 fps
80%
HD Graphics (Cherry Trail):
7 8.3 9 ~ 8 fps
100%
HD Graphics 4200:
4.3 fps
93%
HD Graphics (Cherry Trail):
3.7 3.8 ~ 4 fps
100%
HD Graphics 4200:
11.4 fps
184%
HD Graphics 615:
21 fps
100%
HD Graphics 4200:
7.2 fps
176%
HD Graphics 615:
12.7 fps
100%
HD Graphics 4200:
4.9 fps
100%
HD Graphics 4200:
47.6 fps
100%
HD Graphics 4200:
20.9 fps
100%
HD Graphics 4200:
14.2 fps
100%
HD Graphics 4200:
7.2 fps
HD Graphics (Cherry Trail):
34 fps
100%
HD Graphics 4200:
26.2 fps
100%
HD Graphics 4200:
16.5 fps
100%
HD Graphics 4200:
16.7 fps
131%
HD Graphics 615:
21.9 fps
100%
HD Graphics 4200:
11.4 fps
123%
HD Graphics 615:
14 fps
100%
HD Graphics 4200:
3.8 fps
200%
HD Graphics 615:
7.6 fps
100%
HD Graphics 4200:
27.2 fps
100%
HD Graphics 4200:
19.1 fps
100%
HD Graphics 4200:
8.9 fps
100%
HD Graphics 4200:
22.9 fps
100%
HD Graphics 4200:
15.1 fps
100%
HD Graphics 4200:
17.8 fps
85%
HD Graphics (Cherry Trail):
15.2 fps
100%
HD Graphics 4200:
14.5 fps
80%
HD Graphics (Cherry Trail):
11.6 fps
100%
HD Graphics 4200:
13.9 fps
100%
HD Graphics 4200:
8.5 fps
100%
HD Graphics 4200:
104.8 fps
100%
HD Graphics 4200:
55.6 fps
100%
HD Graphics 4200:
49.2 fps
100%
HD Graphics 4200:
31.7 fps
100%
HD Graphics 4200:
20 fps
0%
HD Graphics (Cherry Trail):
0 (!) [X] Microsoft Surface 3 Intel Atom x7-Z8700 1.6GHz
HD Graphics (Cherry Trail)
fps
100%
HD Graphics 4200:
15.5 fps
0%
HD Graphics (Cherry Trail):
0 (!) [X] Microsoft Surface 3 Intel Atom x7-Z8700 1.6GHz
HD Graphics (Cherry Trail)
fps
100%
HD Graphics 4200:
9.3 fps
100%
HD Graphics 4200:
41 fps
100%
HD Graphics 4200:
10 fps
100%
HD Graphics 4200:
4 fps
100%
HD Graphics 4200:
70.7 fps
141%
HD Graphics 615:
99.9 fps
100%
HD Graphics 4200:
35.5 fps
161%
HD Graphics 615:
57.3 fps
100%
HD Graphics 4200:
18.9 fps
209%
HD Graphics 615:
39.5 fps
107%
HD Graphics (Cherry Trail):
20.3 fps
100%
HD Graphics 4200:
12.5 fps
175%
HD Graphics 615:
21.9 fps
91%
HD Graphics (Cherry Trail):
11.4 fps
100%
HD Graphics 4200:
22.7 fps
100%
HD Graphics 4200:
16.5 fps
100%
HD Graphics 4200:
8.2 fps
100%
HD Graphics 4200:
5.5 fps
100%
HD Graphics 4200:
34.5 fps
100%
HD Graphics 4200:
18.9 fps
100%
HD Graphics 4200:
12.6 fps
100%
HD Graphics 4200:
4.9 fps
100%
HD Graphics 4200:
32.5 38.7 ~ 36 fps
155%
HD Graphics 615:
55.8 fps
78%
HD Graphics (Cherry Trail):
24.3 [X] Chuwi Hi12 Intel Atom x5-Z8300 1.4GHz
HD Graphics (Cherry Trail)
min:
20 fps, max:
29 fps
31.9 ~ 28 fps
100%
HD Graphics 4200:
21.8 23.3 ~ 23 fps
158%
HD Graphics 615:
36.3 fps
78%
HD Graphics (Cherry Trail):
16 [X] Chuwi Hi12 Intel Atom x5-Z8300 1.4GHz
HD Graphics (Cherry Trail)
min:
13 fps, max:
19 fps
19 ~ 18 fps
100%
HD Graphics 4200:
16.9 19 ~ 18 fps
167%
HD Graphics 615:
30.1 fps
100%
HD Graphics 4200:
9.8 fps
182%
HD Graphics 615:
17.8 fps
100%
HD Graphics 4200:
28.2 fps
100%
HD Graphics 4200:
19.5 fps
100%
HD Graphics 4200:
11.1 fps
100%
HD Graphics 4200:
8.4 fps
100%
HD Graphics 4200:
6.1 fps
100%
HD Graphics 4200:
10.3 12.3 ~ 11 fps
73%
HD Graphics (Cherry Trail):
8 fps
100%
HD Graphics 4200:
5.4 fps
100%
HD Graphics 4200:
24.4 fps
144%
HD Graphics 615:
35.1 fps
70%
HD Graphics (Cherry Trail):
15.5 18.9 ~ 17 fps
100%
HD Graphics 4200:
10.2 fps
176%
HD Graphics 615:
18 fps
78%
HD Graphics (Cherry Trail):
7.2 8.5 ~ 8 fps
100%
HD Graphics 4200:
5.7 fps
139%
HD Graphics 615:
7.9 fps
100%
HD Graphics 4200:
2.9 fps
100%
HD Graphics 4200:
13.9 fps
100%
HD Graphics 4200:
9.9 fps
100%
HD Graphics 4200:
5.4 fps
100%
HD Graphics 4200:
27.5 42.6 ~ 35 fps
73%
HD Graphics (Cherry Trail):
25.6 fps
100%
HD Graphics 4200:
15.4 19 ~ 17 fps
71%
HD Graphics (Cherry Trail):
12 fps
100%
HD Graphics 4200:
8.9 fps
100%
HD Graphics 4200:
24.4 67.8 ~ 46 fps
61%
HD Graphics (Cherry Trail):
28.1 fps
100%
HD Graphics 4200:
12 34.1 ~ 23 fps
54%
HD Graphics (Cherry Trail):
12.5 fps
100%
HD Graphics 4200:
20.4 fps
100%
HD Graphics 4200:
54.8 fps
HD Graphics (Cherry Trail):
18.7 fps
HD Graphics (Cherry Trail):
63.2 64 ~ 64 fps
HD Graphics (Cherry Trail):
18 18.8 ~ 18 fps
HD Graphics (Cherry Trail):
14 fps
HD Graphics (Cherry Trail):
7 fps
100%
HD Graphics 4200:
32.2 fps
100%
HD Graphics 4200:
24.5 fps
100%
HD Graphics 4200:
15.6 fps
100%
HD Graphics 4200:
37.5 fps
100%
HD Graphics 4200:
19.5 fps
100%
HD Graphics 4200:
14 fps
100%
HD Graphics 4200:
56.5 fps
100%
HD Graphics 4200:
22.8 fps
100%
HD Graphics 4200:
121 [X] Panasonic ToughPad FZ-M1 Intel Core i5-4302Y 1.6GHz
HD Graphics 4200
130 ~ 126 fps
100%
HD Graphics 4200:
43.9 46.9 [X] Panasonic ToughPad FZ-M1 Intel Core i5-4302Y 1.6GHz
HD Graphics 4200
~ 45 fps
100%
HD Graphics 4200:
64.6 fps
138%
HD Graphics 615:
88.9 fps
73%
HD Graphics (Cherry Trail):
44 50.9 [X] Chuwi Hi12 Intel Atom x5-Z8300 1.4GHz
HD Graphics (Cherry Trail)
min:
40 fps, max:
60 fps
~ 47 fps
100%
HD Graphics 4200:
53.4 fps
156%
HD Graphics 615:
83.2 fps
34%
HD Graphics (Cherry Trail):
18.3 [X] Chuwi Hi12 Intel Atom x5-Z8300 1.4GHz
HD Graphics (Cherry Trail)
min:
13 fps, max:
29 fps
fps
Average Gaming Intel HD Graphics 4200 → 100% Average Gaming 30-70 fps → 100%
Average Gaming Intel HD Graphics 615 → 164% Average Gaming 30-70 fps → 188%
Average Gaming Intel HD Graphics (Cherry Trail) → 71% Average Gaming 30-70 fps → 73%
v1.28
log 21. 16:35:37
#0 ran 0s before starting gpusingle class +0s ... 0s
#1 checking url part for id 4576 +0s ... 0s
#2 checking url part for id 7441 +0s ... 0s
#3 checking url part for id 6197 +0s ... 0s
#4 redirected to Ajax server, took 1726929337s time from redirect:0 +0s ... 0s
#5 did not recreate cache, as it is less than 5 days old! Created at Thu, 19 Sep 2024 05:16:33 +0200 +0s ... 0s
#6 composed specs +0.009s ... 0.009s
#7 did output specs +0s ... 0.009s
#8 start showIntegratedCPUs +0s ... 0.009s
#9 getting avg benchmarks for device 4576 +0.023s ... 0.032s
#10 got single benchmarks 4576 +0.015s ... 0.047s
#11 getting avg benchmarks for device 7441 +0.001s ... 0.048s
#12 got single benchmarks 7441 +0.002s ... 0.05s
#13 getting avg benchmarks for device 6197 +0.003s ... 0.053s
#14 got single benchmarks 6197 +0.024s ... 0.077s
#15 got avg benchmarks for devices +0s ... 0.077s
#16 min, max, avg, median took s +0.047s ... 0.124s
#17 before gaming benchmark output +0s ... 0.124s
#18 Got 633 rows for game benchmarks. +0.044s ... 0.168s
#19 composed SQL query for gamebenchmarks +0s ... 0.168s
#20 got data and put it in $dataArray +0.008s ... 0.177s
#21 benchmarks composed for output. +0.044s ... 0.22s
#22 calculated avg scores. +0s ... 0.22s
#23 return log +0.001s ... 0.221s
Teilen Sie diesen Artikel, um uns zu unterstützen. Jeder Link hilft!
Autor: Klaus Hinum, 8.09.2017 (Update: 1.07.2023)
 Deutsch
 English
 Español
 Français
 Italiano
 Nederlands
 Polski
 Português
 Русский
 Türkçe
 Svenska
 Chinese
 Magyar