Notebookcheck Logo

Intel HD Graphics 400 (Braswell) vs Intel HD Graphics P630 vs Intel HD Graphics 5000

Intel HD Graphics 400 (Braswell)

► remove from comparison Intel HD Graphics 400 (Braswell)

Die Intel HD Graphics 400 ist eine in den Low-End-SoCs der Braswell-Serie (z.B. Celeron Serie in 2016) integrierte Grafikeinheit. Sie basiert auf der gleichen Architektur wie die GPU verschiedener Broadwell-Prozessoren (z.B. HD Graphics 5300), bietet allerdings deutlich weniger Shadereinheiten und geringere Taktraten. Die genauen Spezifikationen hängen vom jeweiligen SoC ab: Die schnellste Variante bietet derzeit 12 EUs und maximal 640 MHz.

Anfangs wurde die GPU nur Intel HD Graphics benannt, später als Intel HD Graphics 400 (12 EU Version) und Intel HD Graphics 405 (16 EU Version) bezeichnet.

Anwender müssen sich deshalb insbesondere bei den Celeron-Modellen, die zusätzlich durch die Beschneidung auf nur zwei CPU-Kerne ausgebremst werden, auf ältere und anspruchslose Spiele beschränken. Videos werden dagegen auch in 4K/H.265 flüssig wiedergeben.

Für mehr Benchmarks besuchen sie auch die Seite der Intel HD Graphics (Braswell) GPU, welche Benchmarks der älteren baugleichen 12 und 16 EU Versionen beinhaltet.

Intel HD Graphics P630

► remove from comparison Intel HD Graphics P630

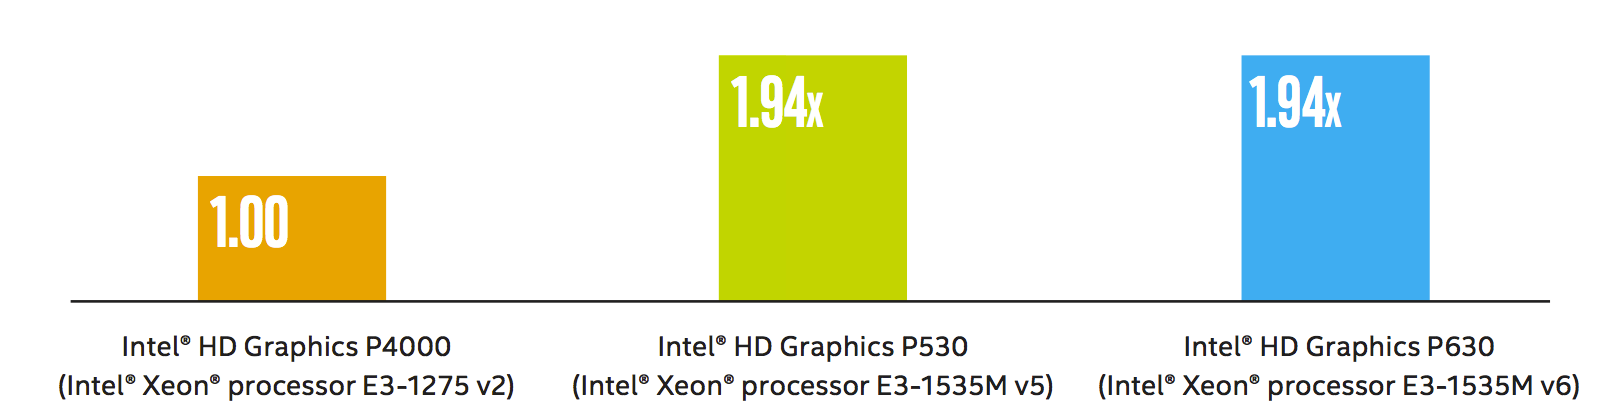
Die Intel HD Graphics P630 (GT2) ist eine integrierte Workstation-Grafikeinheit, die in verschiedenen Desktop- und Notebook-Prozessoren der 2017 vorgestellten Kaby-Lake-Generation zu finden ist (Xeon E3-1200 v6 und e3-1500M v6 Serien). Sie ist identisch mit der Intel HD Graphics 630, jedoch sind die Treiber für professionelle Software optimiert. Daher unterscheidet sie sich auch nicht von der Intel HD Graphics P530 und erreicht laut Intel auch die selbe Leistung im SPEC Viewperf12 (1.94x der alten Intel HD Graphics P4000). Die Grafikkarte ist derzeit für 15 CAD- und Workstation-Anwendungen zertifiziert.

Features

Neu bei der Kaby-Lake Generation ist die verbesserte Videoengine, welche nun auch H.265/HEVC im Main10-profil mit 10 Bit Farbtiefe sowie Googles VP9-Codec in Hardware dekodieren kann. Die Chips mit HD Graphics 530 sollten auch bereits HDCP 2.2 unterstützen und somit z.B. Netflix-Videos unter Windows 10 in 4K ausgeben können (im Gegensatz zu den ersten Kaby-Lake Dual-Core Chips mit Intel HD Graphics 620).

Leistungsaufnahme

Die HD Graphics P630 ist in Desktop- und Notebook-Prozessoren verschiedener TDP-Klassen zu finden. Die Quad-Core CPUs sind jedoch meistens in größeren und schwereren Notebooks verbaut. Der verbesserte 14nm+ Prozess verspricht jedoch eine etwas geringere Leistungsaufnahme im Vergleich zur Intel HD Graphics P530.

Quelle: http://www.intel.com/content/dam/www/public/us/en/documents/guides/hd-graphics-performance-guide.pdf

Intel HD Graphics 5000

► remove from comparison Intel HD Graphics 5000

Die Intel HD Graphics 5000 (GT3) ist eine Prozessorgrafikkarte in den CPUs der Haswell-Generation. Zunächst wird die GPU in einigen ULV-Modellen mit 15 Watt TDP eingesetzt (z.B. Core i5-4250U). Sie stellt die maximale Ausbaustufe der integrierten Grafikeinheit dar (40 Execution Units), muss im Gegensatz zur Iris Pro (GT3e) aber auf den zusätzlichen eDRAM-Cache verzichten. Abhängig von der Taktrate (diese fällt bei den 15-Watt-Modellen relativ niedrig aus) sowie der Hauptspeicheranbindung kann sich die Performance von Modell zu Modell leicht unterscheiden.

Der Grafikkern wurde im Vergleich zum Intel HD Graphics 4000 der Ivy-Bridge-Generation in verschiedenen Punkten weiterentwickelt. So unterstützt die GPU nun mit DirectX 11.1, OpenCL 1.2 und OpenGL 4.0 alle wichtigen aktuellen Standards. Auch ein verbesserter Decoder für 4K-Videos sowie ein überarbeiteter Quick-Sync-Encoder sind mit an Bord.

Die Performance der HD Graphics 5000 liegt im 3DMark 11 um etwa 50 Prozent oberhalb der HD 4000 der Vorgängergeneration. In Spielen fällt die Mehrleistung dagegen deutlich geringer aus: Bei gleichzeitiger Belastung der CPU kann die Grafikeinheit ihren starken Turbo-Boost nur sehr eingeschränkt ausschöpfen, da die niedrige TDP der ULV-Modelle (15 Watt) zu limitieren beginnt. Obwohl die HD 5000 mit 40 Execution Units (EUs) doppelt so viele Ausführungseinheiten wie die HD Graphics 4600 besitzt (HD 4000: 16 EUs), ist die Grafikleistung darum dennoch etwas schwächer. Unterm Strich liegt die HD 5000 damit knapp hinter AMDs Radeon HD 7660G und auf dem Niveau einer dedizierte Radeon HD 7650M. Aktuelle 3D-Spiele (Stand 2013) können in niedrigen, seltener auch mittleren Einstellungen flüssig dargestellt werden.

Der Stromverbrauch ist dank des 22-Nanometer-Prozesses mit Tri-Gate-Transistoren relativ gering und wird dynamisch vom TDP-Budget des gesamten Chips abgezweigt. Die HD 5000 wird zunächst in einigen Dual-Core-Modellen der 15-Watt-Klasse (ULV) eingesetzt, beispielsweise dem Core i7-4650U.

Weitere Details zur Grafikkartenarchitektur der Haswell Generation finden Sie in unserem Artikel zur Vorstellung der Haswell-Generation.

Intel HD Graphics 400 (Braswell)Intel HD Graphics P630Intel HD Graphics 5000
HD Graphics Serie
HD Graphics P530 24 @ 0.35 - 1.05 GHz64/128 Bit
HD Graphics 5600 24 @ 0.3 - 1.05 GHz64/128 Bit
HD Graphics 6000 48 @ 0.3 - 1 GHz64/128 Bit
HD Graphics 4600 20 @ 0.2 - 1.35 GHz64/128 Bit
HD Graphics 5500 24 @ 0.3 - 0.95 GHz64/128 Bit
HD Graphics 5000 40 @ 0.2 - 1.1 GHz64/128 Bit
HD Graphics 4400 20 @ 0.2 - 1.1 GHz64/128 Bit
HD Graphics 5300 24 @ 0.1 - 0.9 GHz64/128 Bit
HD Graphics 4000 16 @ 0.35 - 1.35 GHz64/128 Bit
HD Graphics (Broadwell) 12 @ 0.1 - 0.85 GHz64/128 Bit
HD Graphics 4200 20 @ 0.2 - 0.85 GHz64/128 Bit
HD Graphics (Skylake) 12 @ 0.3 - 0.8 GHz64/128 Bit
HD Graphics 405 (Braswell) 16 @ 0.32 - 0.7 GHz64/128 Bit
HD Graphics (Braswell) 16 @ 0.32 - 0.7 GHz64/128 Bit
HD Graphics 400 (Braswell) 12 @ 0.32 - 0.64 GHz64/128 Bit
HD Graphics (Haswell) 10 @ 0.2 - 1 GHz64/128 Bit
HD Graphics (Cherry Trail) 16 @ 0.2 - 0.6 GHz64/128 Bit
HD Graphics 3000 12 @ 0.35 - 1.35 GHz64/128 Bit
HD Graphics 2500 6 @ 0.65 - 1.15 GHz64/128 Bit
HD Graphics (Ivy Bridge) 6 @ 0.35 - 1.1 GHz64/128 Bit
HD Graphics 2000 6 @ 0.85 - 1.35 GHz64/128 Bit
HD Graphics (Sandy Bridge) 6 @ 0.35 - 1.1 GHz64/128 Bit
HD Graphics (Bay Trail) 4 @ 0.31 - 0.9 GHz32/64/128 Bit
Iris Plus Graphics 655 48 @ 0.3 - 1.2 GHz
Iris Plus Graphics 650 48 @ 0.3 - 1.1 GHz64/128 Bit
Iris Plus Graphics 645 48 @ 0.3 - 1.15 GHz
Iris Plus Graphics 640 48 @ 0.3 - 1.05 GHz64/128 Bit
UHD Graphics 630 24 @ 0.3 - 1.15 GHz64/128 Bit
UHD Graphics P630 24 @ 0.3 - 1.2 GHz64/128 Bit
HD Graphics 630 24 @ 0.3 - 1.15 GHz64/128 Bit
HD Graphics P630 24 64/128 Bit
UHD Graphics 620 24 @ 0.3 - 1.15 GHz
HD Graphics 620 24 @ 0.3 - 1.05 GHz64/128 Bit
UHD Graphics 617 24 @ 0.3 - 1.15 GHz64/128 Bit
UHD Graphics 615 24 @ 0.3 - 1 GHz64/128 Bit
HD Graphics 615 24 @ 0.3 - 1.05 GHz64/128 Bit
HD Graphics P530 24 @ 0.35 - 1.05 GHz64/128 Bit
HD Graphics 5600 24 @ 0.3 - 1.05 GHz64/128 Bit
HD Graphics 6000 48 @ 0.3 - 1 GHz64/128 Bit
HD Graphics 4600 20 @ 0.2 - 1.35 GHz64/128 Bit
HD Graphics 5500 24 @ 0.3 - 0.95 GHz64/128 Bit
HD Graphics 5000 40 @ 0.2 - 1.1 GHz64/128 Bit
HD Graphics 4400 20 @ 0.2 - 1.1 GHz64/128 Bit
HD Graphics 5300 24 @ 0.1 - 0.9 GHz64/128 Bit
HD Graphics 4000 16 @ 0.35 - 1.35 GHz64/128 Bit
HD Graphics (Broadwell) 12 @ 0.1 - 0.85 GHz64/128 Bit
HD Graphics 4200 20 @ 0.2 - 0.85 GHz64/128 Bit
HD Graphics (Skylake) 12 @ 0.3 - 0.8 GHz64/128 Bit
HD Graphics 405 (Braswell) 16 @ 0.32 - 0.7 GHz64/128 Bit
HD Graphics (Braswell) 16 @ 0.32 - 0.7 GHz64/128 Bit
HD Graphics 400 (Braswell) 12 @ 0.32 - 0.64 GHz64/128 Bit
HD Graphics (Haswell) 10 @ 0.2 - 1 GHz64/128 Bit
HD Graphics (Cherry Trail) 16 @ 0.2 - 0.6 GHz64/128 Bit
HD Graphics 3000 12 @ 0.35 - 1.35 GHz64/128 Bit
HD Graphics 2500 6 @ 0.65 - 1.15 GHz64/128 Bit
HD Graphics (Ivy Bridge) 6 @ 0.35 - 1.1 GHz64/128 Bit
HD Graphics 2000 6 @ 0.85 - 1.35 GHz64/128 Bit
HD Graphics (Sandy Bridge) 6 @ 0.35 - 1.1 GHz64/128 Bit
HD Graphics (Bay Trail) 4 @ 0.31 - 0.9 GHz32/64/128 Bit
CodenameBraswellKaby-Lake-H-GT2Haswell GT3
ArchitekturGen. 8Gen. 9.5 Kaby LakeGen. 7.5 Haswell
Pipelines12 - unified24 - unified40 - unified
Kerntakt320 - 640 (Boost) MHz200 - 1100 (Boost) MHz
Speicherbandbreite64/128 Bit64/128 Bit64/128 Bit
Shared Memoryjajaja
APIDirectX 11.2, Shader 5.0DirectX 12_1, OpenGL 4.4DirectX 11.1, Shader 5.0, OpenGL 4.0
Herstellungsprozess14 nm14 nm22 nm
Erscheinungsdatum01.04.2016 05.08.2015 05.06.2013
FeaturesQuickSyncQuickSync
CPU in HD Graphics 400 (Braswell)GPU Base SpeedGPU Boost / Turbo
Intel Atom x5-Z85504 x 1440 MHz200 MHz600 MHz
Intel Celeron N30602 x 1600 MHz, 6 W320 MHz700 MHz
min. - max.200 - 320 MHz600 - 700 MHz
CPU in HD Graphics P630GPU Base SpeedGPU Boost / Turbo
Intel Xeon E3-1535M v64 x 3100 MHz, 45 W300 MHz1150 MHz
Intel Xeon E3-1505M v64 x 3000 MHz, 45 W300 MHz1150 MHz
min. - max.200 - 320 MHz600 - 1150 MHz
CPU in HD Graphics 5000GPU Base SpeedGPU Boost / Turbo
Intel Core i7-4650U2 x 1700 MHz, 15 W200 MHz1100 MHz
Intel Core i7-4550U2 x 1500 MHz, 15 W200 MHz1100 MHz
Intel Core i5-4360U2 x 1500 MHz, 15 W200 MHz1100 MHz
min. - max.200 - 320 MHz600 - 1150 MHz

Benchmarks

Performance Rating - 3DMark 11 + Fire Strike + Time Spy - HD Graphics 400 (Braswell)
0.1 pt (0%)
Performance Rating - 3DMark 11 + Fire Strike + Time Spy - HD Graphics 5000
0.3 pt (1%)
3DMark - 3DMark Time Spy Score
400 Points (1%)
3DMark - 3DMark Ice Storm Unlimited Graphics
min: 17968     avg: 20459     median: 20277 (2%)     max: 23161 Points
65904 Points (7%)
3DMark - 3DMark Ice Storm Extreme Graphics
14334 Points (2%)
37346 Points (5%)
3DMark - 3DMark Cloud Gate Score
min: 1350     avg: 1553     median: 1457 (2%)     max: 2087 Points
8280 Points (9%)
3DMark - 3DMark Cloud Gate Graphics
min: 1519     avg: 1865     median: 1841 (0%)     max: 2455 Points
3DMark - 3DMark Fire Strike Standard Score
min: 176     avg: 188     median: 188 (0%)     max: 200 Points
1040 Points (2%)
3DMark - 3DMark Fire Strike Standard Graphics
min: 202     avg: 218     median: 218 (0%)     max: 234 Points
3DMark - 3DMark Ice Storm Graphics
min: 13689     avg: 18517     median: 18516.5 (2%)     max: 23344 Points
3DMark - 3DMark Sling Shot (ES 3.0) Unlimited
min: 1502     avg: 1926     median: 1925.5 (8%)     max: 2349 Points
3DMark - 3DMark Sling Shot (ES 3.0) Unlimited Graphics
min: 1452     avg: 2046     median: 2046 (4%)     max: 2640 Points
3DMark - 3DMark Sling Shot Extreme (ES 3.1) Unlimited
1180 Points (6%)
3DMark - 3DMark Sling Shot Extreme (ES 3.1) Unlimited Graphics
977 Points (3%)
3DMark - 3DMark Sling Shot (ES 3.0)
min: 1473     avg: 1871     median: 1870.5 (17%)     max: 2268 Points
3DMark - 3DMark Sling Shot (ES 3.0) Graphics
min: 1431     avg: 2005     median: 2005 (12%)     max: 2579 Points
3DMark - 3DMark Sling Shot Extreme (ES 3.1)
1050 Points (5%)
3DMark - 3DMark Sling Shot Extreme (ES 3.1) Graphics
967 Points (3%)
3DMark Vantage
3DM Vant. Perf. total + Intel HD Graphics 5000
3DMark Vantage - 3DM Vant. Perf. total
min: 3418     avg: 4231     median: 4276.5 (1%)     max: 4734 Points
3DM Vant. Perf. GPU no PhysX + Intel HD Graphics 5000
3DMark Vantage - 3DM Vant. Perf. GPU no PhysX
min: 2917     avg: 3639     median: 3665 (2%)     max: 4108 Points
3DMark 03 - 3DMark 03 - Standard
min: 15752     avg: 18768     median: 18768 (10%)     max: 21784 Points
3DMark 05 - 3DMark 05 - Standard
min: 9623     avg: 9763     median: 9763 (11%)     max: 9903 Points
3DMark 06 3DMark 06 - Standard 1280x1024 + Intel HD Graphics 400 (Braswell)
3DMark 06
2474 Points (3%)
3DMark 06 - Standard 1280x1024 + Intel HD Graphics 5000
min: 4751     avg: 5775     median: 5940 (8%)     max: 6160 Points
3DMark 06 - Standard 1280x800 + Intel HD Graphics 5000
3DMark 06
6675 Points (9%)
Unigine Heaven 3.0 - Unigine Heaven 3.0 DX 11
12.1 fps (4%)
Unigine Heaven 3.0 - Unigine Heaven 3.0 OpenGL
12.1 fps (5%)
Unigine Heaven 2.1 - Heaven 2.1 high
min: 12.3     avg: 13     median: 13.1 (2%)     max: 13.5 fps
SPECviewperf 11
specvp11 snx-01 + Intel HD Graphics 5000
SPECviewperf 11 - specvp11 snx-01
min: 1.26     avg: 1.5     median: 1.5 (1%)     max: 1.64 fps
specvp11 tcvis-02 + Intel HD Graphics 5000
SPECviewperf 11 - specvp11 tcvis-02
min: 1.77     avg: 2.1     median: 2.1 (1%)     max: 2.51 fps
specvp11 sw-02 + Intel HD Graphics 5000
SPECviewperf 11 - specvp11 sw-02
min: 7.95     avg: 9.9     median: 9.9 (8%)     max: 11.8 fps
specvp11 proe-05 + Intel HD Graphics 5000
SPECviewperf 11 - specvp11 proe-05
min: 1.42     avg: 1.6     median: 1.6 (2%)     max: 1.78 fps
specvp11 maya-03 + Intel HD Graphics 5000
SPECviewperf 11 - specvp11 maya-03
min: 12.95     avg: 14.2     median: 14.2 (11%)     max: 15.43 fps
specvp11 lightwave-01 + Intel HD Graphics 5000
SPECviewperf 11 - specvp11 lightwave-01
min: 13.34     avg: 14.5     median: 14.5 (16%)     max: 15.62 fps
specvp11 ensight-04 + Intel HD Graphics 5000
SPECviewperf 11 - specvp11 ensight-04
min: 2.06     avg: 2.1     median: 2.1 (1%)     max: 2.11 fps
specvp11 catia-03 + Intel HD Graphics 5000
SPECviewperf 11 - specvp11 catia-03
4.5 fps (2%)
Windows 7 Experience Index - Win7 Gaming graphics
min: 6.5     avg: 6.6     median: 6.6 (84%)     max: 6.7 Points
Windows 7 Experience Index - Win7 Graphics
min: 5.8     avg: 5.9     median: 5.9 (74%)     max: 5.9 Points
Cinebench R10 Cinebench R10 Shading (32bit) + Intel HD Graphics 400 (Braswell)
Cinebench R10 - Cinebench R10 Shading (32bit)
min: 1627     avg: 2057     median: 2052.5 (1%)     max: 2510 Points
Cinebench R10 Shading (32bit) + Intel HD Graphics 5000
Cinebench R11.5 Cinebench R11.5 OpenGL 64 Bit + Intel HD Graphics 400 (Braswell)
Cinebench R11.5 - Cinebench R11.5 OpenGL 64 Bit
min: 9.97     avg: 10.1     median: 10 (3%)     max: 10.12 fps
Cinebench R11.5 OpenGL 64 Bit + Intel HD Graphics 5000
Cinebench R15
Cinebench R15 OpenGL 64 Bit + Intel HD Graphics 400 (Braswell)
Cinebench R15 OpenGL 64 Bit + Intel HD Graphics 5000
min: 24.15     avg: 27.4     median: 27.4 (2%)     max: 30.64 fps
Cinebench R15 OpenGL Ref. Match 64 Bit + Intel HD Graphics 400 (Braswell)
Cinebench R15 OpenGL Ref. Match 64 Bit + Intel HD Graphics 5000
min: 63.3     avg: 81.1     median: 80.7 (81%)     max: 99.6 %
GFXBench - GFXBench 5.0 Aztec Ruins High Tier Offscreen
3.3 fps (1%)
GFXBench - GFXBench 5.0 Aztec Ruins Normal Tier Offscreen
9.3 fps (1%)
GFXBench 3.1 - GFXBench Manhattan ES 3.1 Offscreen
min: 7.2     avg: 10.6     median: 10.6 (0%)     max: 14 fps
GFXBench 3.0 - GFXBench 3.0 Manhattan Offscreen
min: 14     avg: 16     median: 16 (1%)     max: 18 fps
22.5 fps (1%)
GFXBench (DX / GLBenchmark) 2.7
GFXBench T-Rex HD Offscreen C24Z16 + Intel HD Graphics 400 (Braswell)
GFXBench (DX / GLBenchmark) 2.7 - GFXBench T-Rex HD Offscreen C24Z16
min: 27     avg: 29     median: 29 (0%)     max: 31 fps
GFXBench T-Rex HD Offscreen C24Z16 + Intel HD Graphics 5000
min: 62     avg: 72.5     median: 72.5 (1%)     max: 83 fps
LuxMark v2.0 64Bit - LuxMark v2.0 Room GPU
min: 139     avg: 187     median: 201 (1%)     max: 221 Samples/s
LuxMark v2.0 64Bit - LuxMark v2.0 Sala GPU
min: 286     avg: 305.3     median: 306 (1%)     max: 324 Samples/s
ComputeMark v2.1 - ComputeMark v2.1 Result
min: 775     avg: 817     median: 816.5 (1%)     max: 858 Points

Average Benchmarks Intel HD Graphics 400 (Braswell) → 100% n=2

Average Benchmarks Intel HD Graphics P630 → 561% n=2

Average Benchmarks Intel HD Graphics 5000 → 327% n=2

- Bereich der Benchmarkergebnisse für diese Grafikkarte
- Durchschnittliche Benchmarkergebnisse für diese Grafikkarte
* Smaller numbers mean a higher performance
1 This benchmark is not used for the average calculation

Spiele-Benchmarks

Die folgenden Benchmarks basieren auf unseren Spieletests mit Testnotebooks. Die Performance dieser Grafikkarte bei den gelisteten Spielen ist abhängig von der verwendeten CPU, Speicherausstattung, Treiber und auch Betriebssystem. Dadurch müssen die untenstehenden Werte nicht repräsentativ sein. Detaillierte Informationen über das verwendete System sehen Sie nach einem Klick auf den fps-Wert.

low 1280x720
100%
HD Graphics 400 (Braswell):
14.1  fps
low 1280x720
100%
HD Graphics 400 (Braswell):
18.5  fps
med. 1366x768
100%
HD Graphics 400 (Braswell):
16  fps
low 1280x720
100%
HD Graphics 400 (Braswell):
12.7  fps
Prey

Prey

2017
low 1280x720
100%
HD Graphics 400 (Braswell):
6.8  fps
low 1280x720
100%
HD Graphics 400 (Braswell):
10.7  fps
low 1280x720
100%
HD Graphics 400 (Braswell):
20.9  fps
med. 1366x768
100%
HD Graphics 400 (Braswell):
5.8  fps
low 1024x768
100%
HD Graphics 400 (Braswell):
9.7  fps
Overwatch

Overwatch

2016
low 1280x720
100%
HD Graphics 400 (Braswell):
15 15.1 ~ 15 fps
med. 1366x768
100%
HD Graphics 400 (Braswell):
9.5 9.7 ~ 10 fps
low 1024x768
100%
HD Graphics 400 (Braswell):
5.3  fps
low 1024x768
100%
HD Graphics 400 (Braswell):
7.3  fps
med. 1366x768
100%
HD Graphics 400 (Braswell):
3.2  fps
FIFA 16

FIFA 16

2015
low 1280x720
100%
HD Graphics 400 (Braswell):
36.5  fps
high 1366x768
100%
HD Graphics 400 (Braswell):
14.2  fps
ultra 1920x1080
100%
HD Graphics 400 (Braswell):
9  fps
low 1366x768
100%
HD Graphics 400 (Braswell):
13  fps
med. 1366x768
100%
HD Graphics 400 (Braswell):
8  fps
low 1024x768
100%
HD Graphics 400 (Braswell):
13.3  fps
low 1280x720
100%
HD Graphics 400 (Braswell):
21.3  fps
med. 1366x768
100%
HD Graphics 400 (Braswell):
11.4  fps
low 1024x768
100%
HD Graphics 400 (Braswell):
8.5  fps
med. 1366x768
100%
HD Graphics 400 (Braswell):
5.6  fps
low 1024x768
100%
HD Graphics 400 (Braswell):
40.1  fps
med. 1366x768
100%
HD Graphics 400 (Braswell):
11.7  fps
GTA V

GTA V

2015
low 1024x768
100%
HD Graphics 400 (Braswell):
14.3  fps
134%
HD Graphics 5000:
19.2  fps
med. 1366x768
HD Graphics 5000:
16  fps
high 1920x1080
HD Graphics 5000:
4.4  fps
ultra 1920x1080
HD Graphics 5000:
2.6  fps
low 1024x768
HD Graphics 5000:
20.8  fps
med. 1366x768
HD Graphics 5000:
15.1  fps
high 1920x1080
HD Graphics 5000:
7  fps
ultra 1920x1080
HD Graphics 5000:
4.3  fps
Evolve

Evolve

2015
low 1024x768
HD Graphics 5000:
12.7  fps
med. 1366x768
HD Graphics 5000:
9.6  fps
high 1920x1080
HD Graphics 5000:
5.5  fps
ultra 1920x1080
HD Graphics 5000:
2.9  fps
The Crew

The Crew

2014
low 1280x720
HD Graphics 5000:
15.8  fps
med. 1366x768
HD Graphics 5000:
10.6  fps
low 1024x768
100%
HD Graphics 400 (Braswell):
5.4  fps
322%
HD Graphics 5000:
17.4  fps
med. 1366x768
100%
HD Graphics 400 (Braswell):
2.9  fps
414%
HD Graphics 5000:
12  fps
high 1920x1080
HD Graphics 5000:
4.5  fps
ultra 1920x1080
HD Graphics 5000:
2.1  fps
Far Cry 4

Far Cry 4

2014
low 1024x768
HD Graphics 5000:
14.3  fps
med. 1366x768
HD Graphics 5000:
10.6  fps
low 1024x768
HD Graphics 5000:
5.4  fps
low 1024x768
HD Graphics 5000:
25.4  fps
med. 1366x768
HD Graphics 5000:
16.2  fps
high 1920x1080
HD Graphics 5000:
9.7  fps
low 1024x768
HD Graphics 5000:
15.5  fps
med. 1366x768
HD Graphics 5000:
12.2  fps
F1 2014

F1 2014

2014
low 1024x768
100%
HD Graphics 400 (Braswell):
27  fps
189%
HD Graphics 5000:
51  fps
med. 1366x768
100%
HD Graphics 400 (Braswell):
16  fps
219%
HD Graphics 5000:
35  fps
high 1920x1080
HD Graphics 5000:
20  fps
ultra 1920x1080
HD Graphics 5000:
13  fps
low 1024x768
HD Graphics 5000:
14.2  fps
med. 1366x768
HD Graphics 5000:
10.6  fps
low 1024x768
HD Graphics 5000:
14.7  fps
med. 1366x768
HD Graphics 5000:
9.2  fps
low 1024x768
100%
HD Graphics 400 (Braswell):
11.5 11.9 ~ 12 fps
241%
HD Graphics 5000:
28.9  fps
med. 1366x768
100%
HD Graphics 400 (Braswell):
7  fps
299%
HD Graphics 5000:
20.9  fps
high 1920x1080
HD Graphics 5000:
11.4  fps
low 1280x720
HD Graphics 5000:
20.1  fps
med. 1344x756
HD Graphics 5000:
13  fps
high 1920x1080
HD Graphics 5000:
7.2  fps
Fifa 15

Fifa 15

2014
low 1280x720
HD Graphics 5000:
36.2  fps
high 1366x768
HD Graphics 5000:
28.1  fps
ultra 1920x1080
HD Graphics 5000:
17.4  fps
Sims 4

Sims 4

2014
low 1024x768
100%
HD Graphics 400 (Braswell):
37  fps
455%
HD Graphics 5000:
168.3  fps
med. 1366x768
100%
HD Graphics 400 (Braswell):
7.6  fps
432%
HD Graphics 5000:
32.8  fps
high 1920x1080
HD Graphics 5000:
14.2  fps
ultra 1920x1080
HD Graphics 5000:
10  fps
low 1024x768
100%
HD Graphics 400 (Braswell):
6.5  fps
442%
HD Graphics 5000:
28.7  fps
med. 1366x768
100%
HD Graphics 400 (Braswell):
4.8  fps
367%
HD Graphics 5000:
17.6  fps
high 1920x1080
HD Graphics 5000:
6.6  fps
ultra 1920x1080
HD Graphics 5000:
5.2  fps
low 1024x768
100%
HD Graphics 400 (Braswell):
28.9  fps
297%
HD Graphics 5000:
85.7  fps
med. 1366x768
100%
HD Graphics 400 (Braswell):
12.5  fps
242%
HD Graphics 5000:
30.2  fps
high 1920x1080
HD Graphics 5000:
14.9  fps
ultra 1920x1080
HD Graphics 5000:
12.5  fps
low 1024x768
HD Graphics 5000:
17 18.1 ~ 18 fps
med. 1366x768
HD Graphics 5000:
10.9 11.6 ~ 11 fps
low 1280x720
HD Graphics 5000:
27.2  fps
med. 1280x720
HD Graphics 5000:
22.1  fps
high 1920x1080
HD Graphics 5000:
10.7  fps
Titanfall

Titanfall

2014
low 1024x768
HD Graphics 5000:
33.2  fps
med. 1366x768
HD Graphics 5000:
20.2  fps
high 1366x768
HD Graphics 5000:
13.2  fps
Thief

Thief

2014
low 1024x768
HD Graphics 5000:
11.9 14.8 ~ 13 fps
med. 1366x768
HD Graphics 5000:
8.4 9.7 ~ 9 fps
high 1366x768
HD Graphics 5000:
7.6  fps
ultra 1920x1080
HD Graphics 5000:
3.9  fps
low 1024x768
100%
HD Graphics 400 (Braswell):
11.8  fps
low 1024x768
HD Graphics 5000:
24  fps
med. 1366x768
HD Graphics 5000:
20.5  fps
high 1366x768
HD Graphics 5000:
6.2  fps
low 1024x768
100%
HD Graphics 400 (Braswell):
16.2  fps
177%
HD Graphics 5000:
28.6  fps
med. 1366x768
100%
HD Graphics 400 (Braswell):
12.3  fps
162%
HD Graphics 5000:
19.9  fps
high 1366x768
100%
HD Graphics 400 (Braswell):
7.9  fps
168%
HD Graphics 5000:
13.3  fps
Dead Trigger 2

Dead Trigger 2

2013
high
100%
HD Graphics 400 (Braswell):
30  fps
F1 2013

F1 2013

2013
low 1024x768
100%
HD Graphics 400 (Braswell):
28  fps
182%
HD Graphics 5000:
51  fps
med. 1366x768
100%
HD Graphics 400 (Braswell):
17  fps
200%
HD Graphics 5000:
34  fps
high 1366x768
HD Graphics 5000:
28  fps
ultra 1920x1080
HD Graphics 5000:
12  fps
Fifa 14

Fifa 14

2013
low 1024x768
HD Graphics 5000:
165.1  fps
med. 1366x768
HD Graphics 5000:
100.2  fps
high 1366x768
HD Graphics 5000:
71.4  fps
ultra 1920x1080
HD Graphics 5000:
39.3  fps
low 1024x768
HD Graphics 5000:
39.8  fps
med. 1366x768
HD Graphics 5000:
29.4  fps
high 1366x768
HD Graphics 5000:
21.6  fps
ultra 1920x1080
HD Graphics 5000:
6.6  fps
Asphalt 8: Airborne

Asphalt 8: Airborne

2013
low
100%
HD Graphics 400 (Braswell):
30  fps
high
100%
HD Graphics 400 (Braswell):
30  fps
Dota 2

Dota 2

2013
low 1024x768
HD Graphics 5000:
59.6 69.8 ~ 65 fps
med. 1366x768
HD Graphics 5000:
31.5 36.8 ~ 34 fps
ultra 1920x1080
HD Graphics 5000:
14.4 15.5 ~ 15 fps
low 1024x768
HD Graphics 5000:
13.3  fps
med. 1366x768
HD Graphics 5000:
10.4  fps
high 1366x768
HD Graphics 5000:
6  fps
GRID 2

GRID 2

2013
low 1024x768
100%
HD Graphics 400 (Braswell):
19.9  fps
294%
HD Graphics 5000:
58.6  fps
med. 1366x768
100%
HD Graphics 400 (Braswell):
12.5  fps
250%
HD Graphics 5000:
31.3  fps
high 1366x768
HD Graphics 5000:
22.7  fps
ultra 1920x1080
HD Graphics 5000:
12.5  fps
low 1024x768
HD Graphics 5000:
18.8 18.9 ~ 19 fps
med. 1366x768
HD Graphics 5000:
13.9 13.9 ~ 14 fps
high 1366x768
HD Graphics 5000:
8.6 10.4 ~ 10 fps
low 1280x720
100%
HD Graphics 400 (Braswell):
16.2 16.5 16.9 18.1 18.5 18.7 18.8 19.5 ~ 18 fps
194%
HD Graphics 5000:
32 34.3 34.3 38.3 ~ 35 fps
med. 1366x768
100%
HD Graphics 400 (Braswell):
7.2 7.8 8.5 8.8 8.9 9.1 9.6 ~ 9 fps
222%
HD Graphics 5000:
17 20.1 20.9 22.5 ~ 20 fps
high 1366x768
100%
HD Graphics 400 (Braswell):
6.2  fps
257%
HD Graphics 5000:
14 14.2 16.6 18.2 ~ 16 fps
ultra 1920x1080
100%
HD Graphics 400 (Braswell):
1.8  fps
428%
HD Graphics 5000:
7.7  fps
low 1024x768
100%
HD Graphics 400 (Braswell):
24.8  fps
214%
HD Graphics 5000:
44 52.5 53.9 54.3 55.3 56 ~ 53 fps
med. 1366x768
100%
HD Graphics 400 (Braswell):
10.2 (!)  fps
255%
HD Graphics 5000:
23 25 26 27.5 28.3 28.6 ~ 26 fps
high 1366x768
HD Graphics 5000:
14 14.9 15 15.8 17.4 17.5 ~ 16 fps
ultra 1920x1080
HD Graphics 5000:
7.9 8 9.5 ~ 8 fps
Crysis 3

Crysis 3

2013
low 1024x768
HD Graphics 5000:
20.9  fps
med. 1366x768
HD Graphics 5000:
13  fps
high 1366x768
HD Graphics 5000:
9.4  fps
low 1024x768
100%
HD Graphics 400 (Braswell):
21.1  fps
med. 1366x768
100%
HD Graphics 400 (Braswell):
10.8  fps
high 1366x768
100%
HD Graphics 400 (Braswell):
8.7  fps
Far Cry 3

Far Cry 3

2012
low 1024x768
HD Graphics 5000:
28.6  fps
med. 1366x768
HD Graphics 5000:
19.2  fps
high 1366x768
HD Graphics 5000:
7.1  fps
med. 1366x768
HD Graphics 5000:
16.6  fps
high 1366x768
HD Graphics 5000:
11.2  fps
low 1024x768
HD Graphics 5000:
22.3  fps
med. 1366x768
HD Graphics 5000:
15.7  fps
high 1366x768
HD Graphics 5000:
7.3  fps
low 1024x768
HD Graphics 5000:
40.5  fps
med. 1366x768
HD Graphics 5000:
28  fps
high 1366x768
HD Graphics 5000:
14.1  fps
low 1024x768
HD Graphics 5000:
83  fps
med. 1366x768
HD Graphics 5000:
46  fps
ultra 1920x1080
HD Graphics 5000:
28  fps
low 1024x768
100%
HD Graphics 400 (Braswell):
10.5  fps
low 1024x768
100%
HD Graphics 400 (Braswell):
18.3  fps
311%
HD Graphics 5000:
54 58 59 ~ 57 fps
med. 1366x768
HD Graphics 5000:
38 42 ~ 40 fps
high 1366x768
HD Graphics 5000:
31 32 ~ 32 fps
ultra 1920x1080
HD Graphics 5000:
13 19 21 ~ 18 fps
Anno 2070

Anno 2070

2011
low 1024x768
100%
HD Graphics 400 (Braswell):
27.7  fps
213%
HD Graphics 5000:
57.8 59.2 61 ~ 59 fps
med. 1366x768
HD Graphics 5000:
30 32.2 32.8 ~ 32 fps
high 1366x768
HD Graphics 5000:
16.2 18 20.1 ~ 18 fps
ultra 1920x1080
HD Graphics 5000:
9  fps
low 1280x720
100%
HD Graphics 400 (Braswell):
19.8  fps
149%
HD Graphics 5000:
29.5  fps
med. 1366x768
100%
HD Graphics 400 (Braswell):
9.5  fps
194%
HD Graphics 5000:
18.4  fps
high 1366x768
HD Graphics 5000:
11.6  fps
low 1024x768
100%
HD Graphics 400 (Braswell):
18.4  fps
high 1366x768
100%
HD Graphics 400 (Braswell):
11.3  fps
Dirt 3

Dirt 3

2011
low 800x600
100%
HD Graphics 400 (Braswell):
29.4  fps
med. 1024x768
100%
HD Graphics 400 (Braswell):
14.3  fps
high 1360x768
100%
HD Graphics 400 (Braswell):
12.5  fps
Total War: Shogun 2

Total War: Shogun 2

2011
low 1024x768
HD Graphics 5000:
88.8  fps
low 1024x768
100%
HD Graphics 400 (Braswell):
34.5  fps
429%
HD Graphics 5000:
126 169 ~ 148 fps
med. 1360x768
100%
HD Graphics 400 (Braswell):
8.8  fps
466%
HD Graphics 5000:
38 43 ~ 41 fps
high 1360x768
100%
HD Graphics 400 (Braswell):
5.6  fps
446%
HD Graphics 5000:
24 26 ~ 25 fps
ultra 1920x1080
HD Graphics 5000:
10 16 ~ 13 fps
Anno 1404

Anno 1404

2009
low 1024x768
HD Graphics 5000:
122  fps
ultra 1280x1024
HD Graphics 5000:
18  fps
Trackmania Nations Forever

Trackmania Nations Forever

2008
low 640x480
100%
HD Graphics 400 (Braswell):
60 88.5 ~ 74 fps
high 1024x768
100%
HD Graphics 400 (Braswell):
22.6 25.2 ~ 24 fps
ultra 1920x1080
100%
HD Graphics 400 (Braswell):
9.9  fps
World of Warcraft

World of Warcraft

2005
low 800x600
HD Graphics 5000:
162  fps
med. 1024x768
HD Graphics 5000:
78  fps
high 1280x1024
HD Graphics 5000:
31  fps
ultra 1920x1080
HD Graphics 5000:
9  fps

Average Gaming Intel HD Graphics 400 (Braswell) → 100%

Average Gaming 30-70 fps → 100%

Average Gaming Intel HD Graphics 5000 → 281%

Average Gaming 30-70 fps → 262%

Intel HD Graphics 400 (Braswell)lowmed.highultraQHD4K
Farming Simulator 1914.1
Team Fortress 218.516
Rocket League12.7
Prey6.8
Resident Evil 710.7
Farming Simulator 1720.95.8
Civilization VI9.7
Overwatch1510
Rise of the Tomb Raider5.3
Rainbow Six Siege7.33.2
FIFA 1636.514.29
World of Warships138
Metal Gear Solid V13.3
Dota 2 Reborn21.311.4
The Witcher 38.55.6
Dirt Rally40.111.7
GTA V14.3
Dragon Age: Inquisition5.42.9
F1 20142716
Alien: Isolation127
Sims 4377.6
Risen 3: Titan Lords6.54.8
GRID: Autosport28.912.5
X-Plane 10.2511.8
Battlefield 416.212.37.9
Dead Trigger 230
F1 20132817
Asphalt 8: Airborne3030
GRID 219.912.5
BioShock Infinite1896.231.8
Tomb Raider24.810.2
Dead Space 321.110.88.7
Counter-Strike: GO10.5
Diablo III18.3
Anno 207027.7
The Elder Scrolls V: Skyrim19.89.5
Deus Ex Human Revolution18.411.3
Dirt 329.414.312.5
StarCraft 234.58.85.6
Trackmania Nations Forever74249.9
< 30 fps
< 60 fps
< 120 fps
≥ 120 fps
33
5
1
23


8
2

3


Intel HD Graphics 5000lowmed.highultraQHD4K
GTA V19.2164.42.6
Battlefield Hardline20.815.174.3
Evolve12.79.65.52.9
The Crew15.810.6
Dragon Age: Inquisition17.4124.52.1
Far Cry 414.310.6
Assassin's Creed Unity5.4
Call of Duty: Advanced Warfare25.416.29.7
Civilization: Beyond Earth15.512.2
F1 201451352013
The Evil Within14.210.6
Ryse: Son of Rome14.79.2
Alien: Isolation28.920.911.4
Middle-earth: Shadow of Mordor20.1137.2
Fifa 1536.228.117.4
Sims 4168.332.814.210
Risen 3: Titan Lords28.717.66.65.2
GRID: Autosport85.730.214.912.5
Watch Dogs1811
Wolfenstein: The New Order27.222.110.7
Titanfall33.220.213.2
Thief1397.63.9
Call of Duty: Ghosts2420.56.2
Battlefield 428.619.913.3
F1 201351342812
Fifa 14165.1100.271.439.3
Total War: Rome II39.829.421.66.6
Dota 2653415
Company of Heroes 213.310.46
GRID 258.631.322.712.5
Metro: Last Light191410
BioShock Infinite3520167.7
Tomb Raider5326168
Crysis 320.8912.989.44
Far Cry 328.5819.187.07
Assassin´s Creed III16.5611.23
Hitman: Absolution22.315.77.3
Call of Duty: Black Ops 240.52814.1
Torchlight 2834628
Diablo III57403218
Anno 20705932189
The Elder Scrolls V: Skyrim29.518.411.6
Total War: Shogun 288.8
StarCraft 2148412513
Anno 140412218
World of Warcraft16278319
< 30 fps
< 60 fps
< 120 fps
≥ 120 fps
25
11
4
5
30
10
2
32
2
1
22
1


Eine Liste mit weiteren Spielen und allen Grafikkarten finden Sie auf unserer Seite: Welches Spiel ist mit welcher Grafikkarte spielbar?

v1.28
log 21. 16:04:38

#0 ran 0s before starting gpusingle class +0s ... 0s

#1 checking url part for id 7349 +0s ... 0s

#2 checking url part for id 7657 +0s ... 0s

#3 checking url part for id 4574 +0s ... 0s

#4 redirected to Ajax server, took 1726927477s time from redirect:0 +0s ... 0s

#5 did not recreate cache, as it is less than 5 days old! Created at Thu, 19 Sep 2024 05:16:33 +0200 +0s ... 0s

#6 composed specs +0.067s ... 0.067s

#7 did output specs +0s ... 0.067s

#8 start showIntegratedCPUs +0s ... 0.067s

#9 getting avg benchmarks for device 7349 +0.033s ... 0.1s

#10 got single benchmarks 7349 +0.024s ... 0.124s

#11 getting avg benchmarks for device 7657 +0s ... 0.124s

#12 got single benchmarks 7657 +0.003s ... 0.127s

#13 getting avg benchmarks for device 4574 +0.005s ... 0.132s

#14 got single benchmarks 4574 +0.011s ... 0.143s

#15 got avg benchmarks for devices +0s ... 0.143s

#16 min, max, avg, median took s +0.041s ... 0.184s

#17 before gaming benchmark output +0s ... 0.184s

#18 Got 290 rows for game benchmarks. +0.016s ... 0.2s

#19 composed SQL query for gamebenchmarks +0s ... 0.2s

#20 got data and put it in $dataArray +0.007s ... 0.207s

#21 benchmarks composed for output. +0.028s ... 0.235s

#22 calculated avg scores. +0s ... 0.235s

#23 return log +0.001s ... 0.236s

Teilen Sie diesen Artikel, um uns zu unterstützen. Jeder Link hilft!
> Notebook Test, Laptop Test und News > Benchmarks / Technik > Benchmarks / Technik > Grafikkarten Vergleich - Head 2 Head
Autor: Klaus Hinum,  8.09.2017 (Update:  1.07.2023)