

Intel Graphics 4-Cores iGPU (Arc) vs Intel UHD Graphics 617 vs Intel Arc 8-Core iGPU
Intel Graphics 4-Cores iGPU (Arc)
► remove from comparison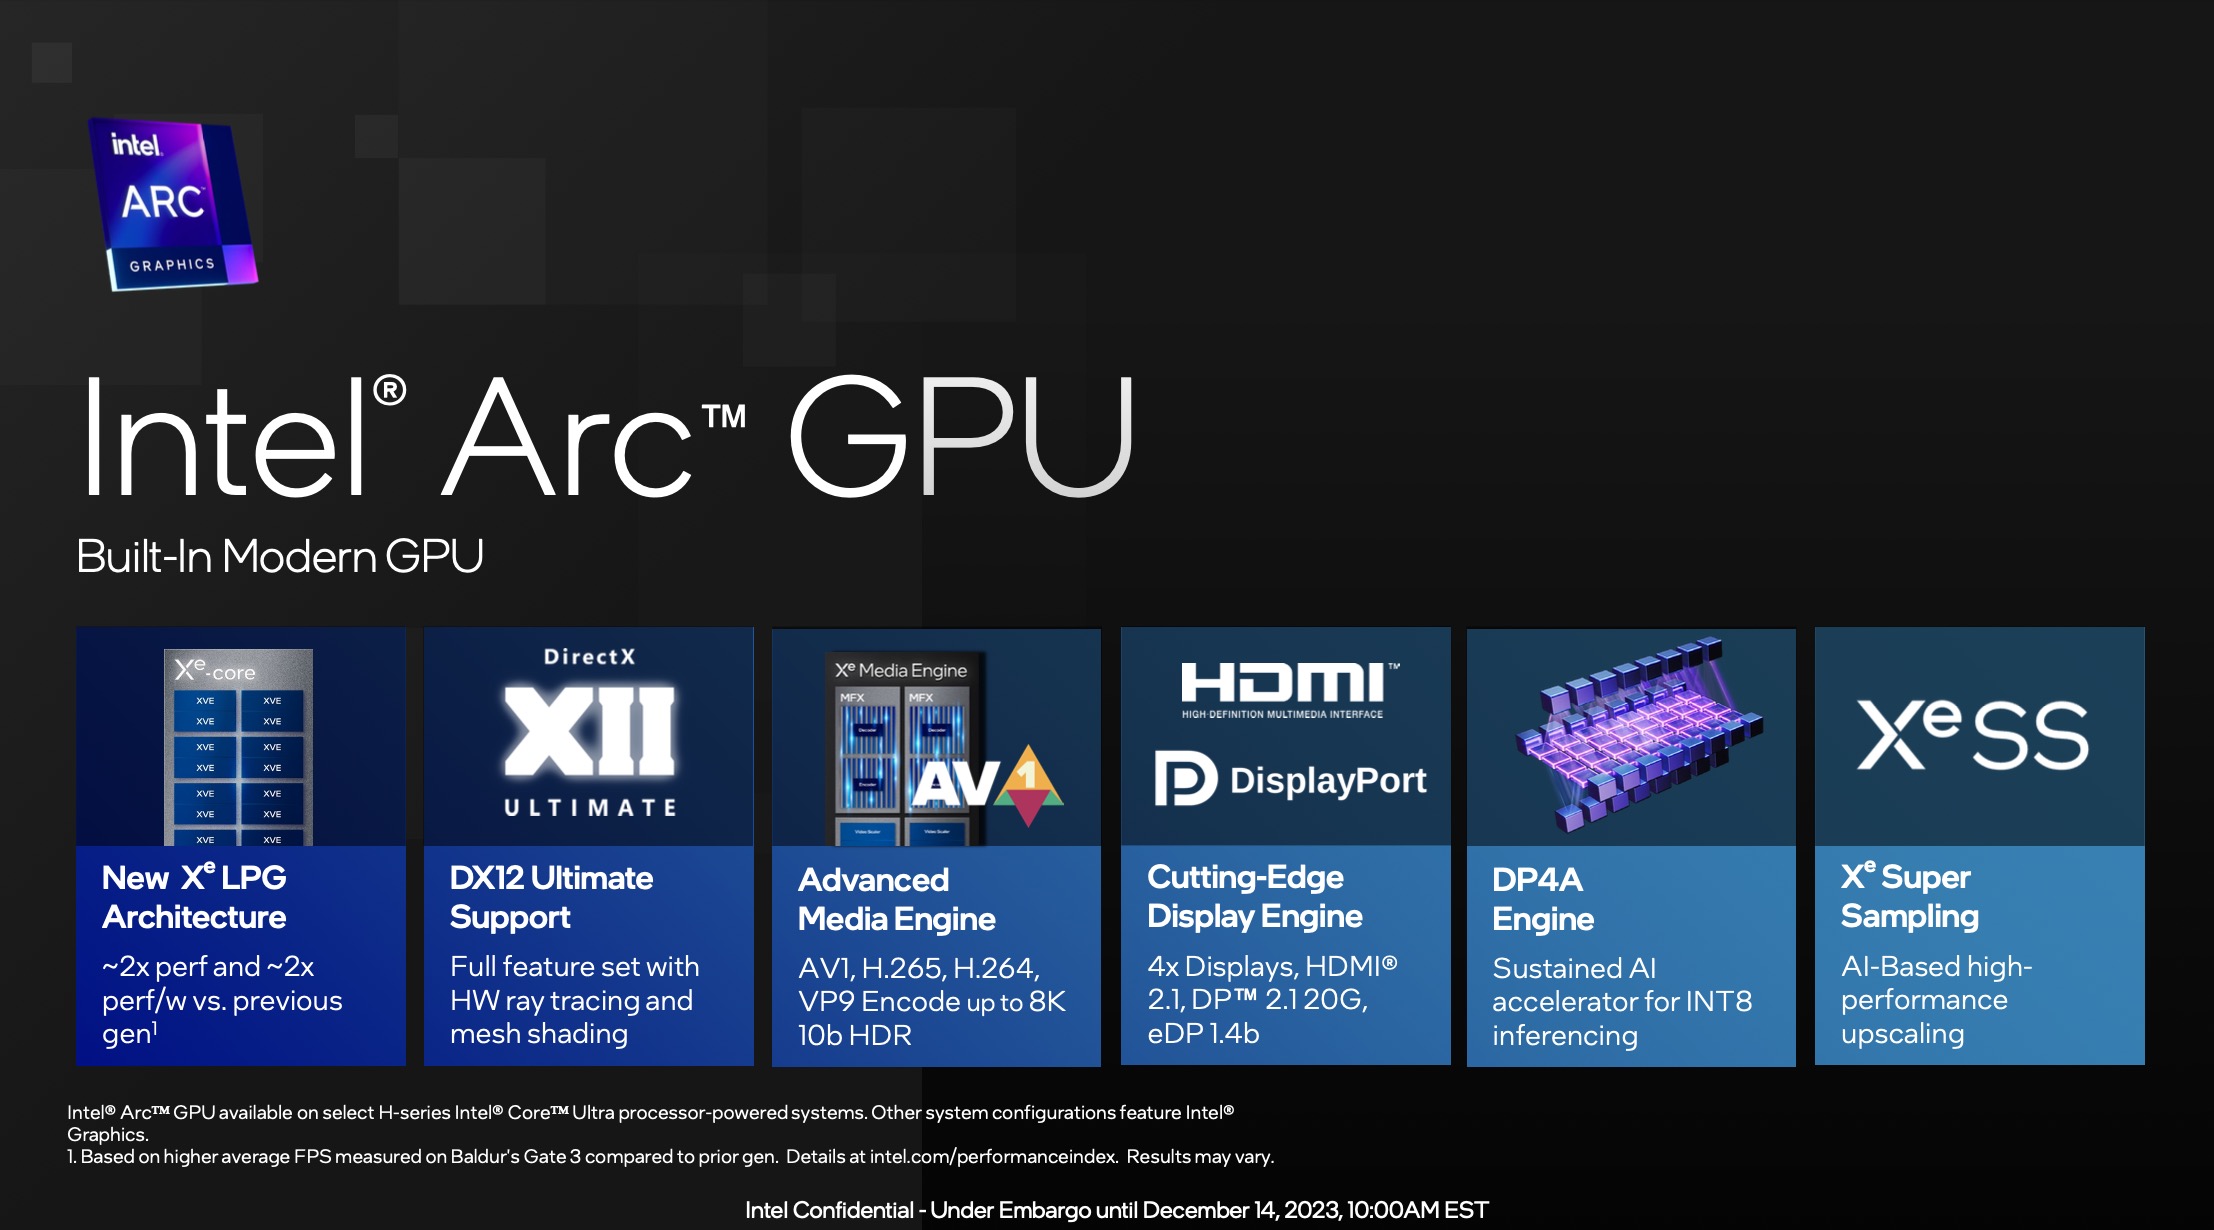
Die Intel Graphics iGPU mit 4 Kernen ist eine integrierte Grafikkarte basierend auf die Xe LPG Architektur (ähnlich zu den dedizierten Arc GPUs, jedoch mit Fokus auf Effizienz). Sie bietet 4 Xe Kerne (64 Xe Vector Engines), 4 Raytracing Einheiten, 4 Sampler und 2 Pixel Backends.
Im Gegensatz zu der stärkeren Variante mit 8 Kernen in den H Meteor Lake CPUs, darf die kleine Variante nicht den Arc Namen nutzen.
Die iGPU unterstützt DirectX 12 Ultimate (wahrscheinlich DX 12_2 wie die Desktop Arc GPUs). Weiters unterstützt die Grafikeinheit XeSS AI Super Sampling.
Die Media Engine ist bei Meteor Lake im SOC Tile und unterstützt bis zu 8k60 10-bit HDR Encode und Deccode von MPEG2, AVC, VP9, HEVC und AV1. Die Display Engine ist ebenfalls im SoC Tile und unterstützt HDMI 2.1 und DisplayPort 2.1 20G mit bis zu 8K60 HDR.
Der GPU Tile des Meteor Lake Chips wird bei TSMC in 5nm (5N Prozess) gefertigt.
Intel UHD Graphics 617
► remove from comparisonDie Intel UHD Graphics 617 (GT2) ist eine Prozessorgrafikkarte der im Sommer 2018 vorgestellten Amber-Lake-Generation. Als Nachfolger der Intel HD Graphics 615 (Kaby-Lake-Y) ist die UHD 615 und 617 dabei in der besonders sparsamen Y-Serie mit 5-7 Watt TDP zu finden. Die sogenannte GT2-Ausbaustufe der GPU verfügt über 24 Ausführungseinheiten (EUs) und taktet je nach Modell mit bis zu 1.050 MHz. Technisch gibt es keine Unterschiede zur alten HD Graphics 615, nur die Taktraten wurden leicht abgeändert und durch den verbesserten 14nm++ Prozess könnte der Turbo etwas länger gehalten werden. Im Vergleich zur UHD Graphics 615 in anderen Amber Lake Modellen, bietet die 617 einen höheren Boost-Takt und 7 Watt TDP.
Mangels eigenem Grafikspeicher oder eDRAM-Cache greift die UHD Graphics 617 über das Interface des Prozessors auf den System-RAM zu (2x 64 Bit DDR3L/LPDDR3).
Performance
Die exakte Leistung der UHD Graphics 617 hängt stark vom jeweiligen CPU-Modell sowie dem konkreten Endgerät ab, da sich Maximaltaktrate sowie TDP-Konfiguration/Kühlung erheblich unterscheiden können. Zum anderen bestimmt auch der verwendete Speicher (DDR3L/LPDDR3) die Performance. Insgesamt dürfte die UHD 617 etwa das Niveau der alten Kaby-Lake HD Graphics 615 erreichen. Einige aktuelle anspruchslose Spiele wie Farming Simulator 17 oder Rocket League können so in niedrigsten Einstellungen flüssig dargestellt werden. Mit gelegentlichen Rucklern muss man jedoch immer rechnen. Detaillierte Benchmarks und viele Spieletests der gleich schnellen HD Graphics 615 finden sie hier.
Anders als Skylake kann Kaby Lake und damit auch Amber Lake nun auch H.265/HEVC im Main10-Profil mit 10 Bit Farbtiefe sowie Googles VP9-Codec in Hardware decodieren. HDCP 2.2 sollte unterstützt werden, was beispielsweise für die Ausgabe von Netflix-Videos in 4K benötigt wird. HDMI 2.0 unterstützt die UHD Graphics 615 jedoch weiterhin nur per Wandler (LSPCon) über den DisplayPort.
Leistungsaufnahme
Die UHD Graphics 617 ist in ULV-Prozessoren der 7-Watt-Klasse zu finden (TDP kann vom Gerätehersteller angepasst werden) und damit für passiv gekühlte Subnotebooks wie das MacBook Air geeignet.
Intel Arc 8-Core iGPU
► remove from comparison
Die Intel Arc iGPU mit 8 Kernen (ID 7D55) ist eine integrierte Grafikkarte in Meteor Lake SoCs basierend auf die Xe LPG Architektur (ähnlich zu den dedizierten Arc GPUs, jedoch mit Fokus auf Effizienz). Sie bietet alle 8 Xe Kerne (128 Xe Vector Engines), 8 Raytracing Einheiten, 8 Sampler und 4 Pixel Backends.
Der Arc Name darf nur genutzt werden, wenn mindestens 16 GB RAM im Dual Channel Modus verwendet werden. Sonst heisst die nur iGPU "Intel Graphics" und ist ebenfalls deutlich langsamer.
Laut Intel konnte die Performance im Vergleich zur Vorgängergeneration (wahrscheinlich noch in Alder Lake) verdoppelt werden.
Die iGPU unterstützt DirectX 12 Ultimate (wahrscheinlich DX 12_2 wie die Desktop Arc GPUs). Weiters unterstützt die Grafikeinheit XeSS AI Super Sampling.
Die Media Engine ist bei Meteor Lake im SOC Tile und unterstützt bis zu 8k60 10-bit HDR Encode und Deccode von MPEG2, AVC, VP9, HEVC und AV1. Die Display Engine ist ebenfalls im SoC Tile und unterstützt HDMI 2.1 und DisplayPort 2.1 20G mit bis zu 8K60 HDR.
Der GPU Tile des Meteor Lake Chips wird bei TSMC in 5nm (5N Prozess) gefertigt.
| Intel Graphics 4-Cores iGPU (Arc) | Intel UHD Graphics 617 | Intel Arc 8-Core iGPU | ||||||||||||||||||||||||||||||||||||||||||||||||||||||||||
| Arc LPG Serie |
|
|
| |||||||||||||||||||||||||||||||||||||||||||||||||||||||||
| Codename | Meteor Lake iGPU | Kaby-Lake GT2 | Meteor Lake iGPU | |||||||||||||||||||||||||||||||||||||||||||||||||||||||||
| Architektur | Xe LPG | Gen. 9 Amber Lake | Xe LPG | |||||||||||||||||||||||||||||||||||||||||||||||||||||||||
| Pipelines | 4 - unified | 24 - unified | 8 - unified | |||||||||||||||||||||||||||||||||||||||||||||||||||||||||
| Raytracing Cores | 4 | 8 | ||||||||||||||||||||||||||||||||||||||||||||||||||||||||||
| Kerntakt | 1950 (Boost) MHz | 300 - 1150 (Boost) MHz | 2300 (Boost) MHz | |||||||||||||||||||||||||||||||||||||||||||||||||||||||||
| Cache | L1: 768 KB | L1: 1.5 MB | ||||||||||||||||||||||||||||||||||||||||||||||||||||||||||
| Shared Memory | nein | ja | ja | |||||||||||||||||||||||||||||||||||||||||||||||||||||||||
| API | DirectX 12_2, OpenGL 4.6, Vulkan 1.3 | DirectX 12_1, OpenGL 4.4 | DirectX 12_2, OpenGL 4.6, Vulkan 1.3 | |||||||||||||||||||||||||||||||||||||||||||||||||||||||||
| Herstellungsprozess | 5 nm | 14 nm | 5 nm | |||||||||||||||||||||||||||||||||||||||||||||||||||||||||
| Displays | HDMI 2.1, DisplayPort 2.1 20G | HDMI 2.1b, DisplayPort 2.0 20G | ||||||||||||||||||||||||||||||||||||||||||||||||||||||||||
| Erscheinungsdatum | 14.12.2023 | 30.10.2018 | 14.12.2023 | |||||||||||||||||||||||||||||||||||||||||||||||||||||||||
| Speicherbandbreite | 64/128 Bit | |||||||||||||||||||||||||||||||||||||||||||||||||||||||||||
| Speichertyp | DDR3L/LPDDR3 | |||||||||||||||||||||||||||||||||||||||||||||||||||||||||||
| Features | QuickSync |
|
|
| ||||||||||||||||||||||||||||||||||||||||||||||||||||||||||||||||||||||||||||||||||||||||||||||||||||||||
Benchmarks
| Modell | CPU | GPU | RAM | Wert |
|---|---|---|---|---|
| Apple MacBook Air 2018 | i5-8210Y | UHD Graphics 617 1050 MHz | 8 GB | 322 |
| Apple Macbook Air 2019 | i5-8210Y | UHD Graphics 617 | 8 GB | 337 |
| One-Mix3 Pro | i7-10510Y | UHD Graphics 617 | 16 GB | 356 |
| Modell | CPU | GPU | RAM | Wert |
|---|---|---|---|---|
| Apple MacBook Air 2018 | i5-8210Y | UHD Graphics 617 1050 MHz | 8 GB | 286 |
| Apple Macbook Air 2019 | i5-8210Y | UHD Graphics 617 | 8 GB | 300 |
| One-Mix3 Pro | i7-10510Y | UHD Graphics 617 | 16 GB | 311 |
| Modell | CPU | GPU | RAM | Wert |
|---|---|---|---|---|
| HP Envy x360 2-in-1 14-fc0078TU | Ultra 5 125U 29 W / 23 W | Graphics 4-Core | 16 GB | 295187 |
| Dell Latitude 7450 2-in-1 | Ultra 7 165U 44 W / 38 W | Graphics 4-Core | 32 GB | 308872 |
| Modell | CPU | GPU | RAM | Wert |
|---|---|---|---|---|
| Apple MacBook Air 2018 | i5-8210Y | UHD Graphics 617 1050 MHz | 8 GB | 77156 |
| Modell | CPU | GPU | RAM | Wert |
|---|---|---|---|---|
| Minisforum AtomMan X7 Ti | Ultra 9 185H 65 W / 65 W | Arc 8-Core 2350 MHz | 32 GB | 397122 |
| Khadas Mind 2 | Ultra 7 155H 64 W / 35 W | Arc 8-Core 2250 MHz | 32 GB | 397940 |
| Geekom GT1 Mega | Ultra 9 185H 70 W / 45 W | Arc 8-Core 2350 MHz | 32 GB | 418181 |
| Asus NUC 14 Pro+ | Ultra 9 185H 115 W / 115 W | Arc 8-Core 2350 MHz | 32 GB | 427906 |
| Modell | CPU | GPU | RAM | Wert |
|---|---|---|---|---|
| HP Envy x360 2-in-1 14-fc0078TU | Ultra 5 125U 29 W / 23 W | Graphics 4-Core | 16 GB | 75102 |
| Dell Latitude 7450 2-in-1 | Ultra 7 165U 44 W / 38 W | Graphics 4-Core | 32 GB | 120447 |
| Modell | CPU | GPU | RAM | Wert |
|---|---|---|---|---|
| Minisforum AtomMan X7 Ti | Ultra 9 185H 65 W / 65 W | Arc 8-Core 2350 MHz | 32 GB | 78589 |
| Asus NUC 14 Pro+ | Ultra 9 185H 115 W / 115 W | Arc 8-Core 2350 MHz | 32 GB | 152637 |
| Khadas Mind 2 | Ultra 7 155H 64 W / 35 W | Arc 8-Core 2250 MHz | 32 GB | 159691 |
| Acemagic F2A | Ultra 7 155H 90 W / 65 W | Arc 8-Core | 32 GB | 159748 |
| Geekom GT1 Mega | Ultra 9 185H 70 W / 45 W | Arc 8-Core 2350 MHz | 32 GB | 163878 |
| Modell | CPU | GPU | RAM | Wert |
|---|---|---|---|---|
| Apple MacBook Air 2018 | i5-8210Y | UHD Graphics 617 1050 MHz | 8 GB | 4841 |
| Modell | CPU | GPU | RAM | Wert |
|---|---|---|---|---|
| Apple MacBook Air 2018 | i5-8210Y | UHD Graphics 617 1050 MHz | 8 GB | 7231 |
| Modell | CPU | GPU | RAM | Wert |
|---|---|---|---|---|
| Apple MacBook Air 2018 | i5-8210Y | UHD Graphics 617 1050 MHz | 8 GB | 845 |
| Apple Macbook Air 2019 | i5-8210Y | UHD Graphics 617 | 8 GB | 934 |
| Modell | CPU | GPU | RAM | Wert |
|---|---|---|---|---|
| Apple MacBook Air 2018 | i5-8210Y | UHD Graphics 617 1050 MHz | 8 GB | 947 |
| Apple Macbook Air 2019 | i5-8210Y | UHD Graphics 617 | 8 GB | 1047 |
| Modell | CPU | GPU | RAM | Wert |
|---|---|---|---|---|
| HP Envy x360 2-in-1 14-fc0078TU | Ultra 5 125U 29 W / 23 W | Graphics 4-Core | 16 GB | 89439 |
| Dell Latitude 7450 2-in-1 | Ultra 7 165U 44 W / 38 W | Graphics 4-Core | 32 GB | 158290 |
| Modell | CPU | GPU | RAM | Wert |
|---|---|---|---|---|
| Minisforum AtomMan X7 Ti | Ultra 9 185H 65 W / 65 W | Arc 8-Core 2350 MHz | 32 GB | 88046 |
| LG gram Pro 2-in-1 16T90SP | Ultra 7 155H | Arc 8-Core | 16 GB | 152779 |
| Acer Swift Go 14 SFG14-72 | Ultra 7 155H 55 W / 45 W | Arc 8-Core | 32 GB | 160401 |
| Acemagic F2A | Ultra 7 155H 90 W / 65 W | Arc 8-Core | 32 GB | 173445 |
| Asus NUC 14 Pro+ | Ultra 9 185H 115 W / 115 W | Arc 8-Core 2350 MHz | 32 GB | 184023 |
| Khadas Mind 2 | Ultra 7 155H 64 W / 35 W | Arc 8-Core 2250 MHz | 32 GB | 196127 |
| Geekom GT1 Mega | Ultra 9 185H 70 W / 45 W | Arc 8-Core 2350 MHz | 32 GB | 198989 |
Asus Vivobook S16 S5606M  | Ultra 7 155H 65 W / 54 W | Arc 8-Core 0.1 GB | 16 GB | 201715 |
| Acer Swift Go 14 SFG14-72 | Ultra 7 155H 55 W / 45 W | Arc 8-Core | 32 GB | 207714 |
| Lenovo Yoga Pro 7 14IMH9 | Ultra 7 155H 64 W / 55 W | Arc 8-Core 0.1 GB | 32 GB | 215292 |
| Modell | CPU | GPU | RAM | Wert |
|---|---|---|---|---|
| Dell Latitude 7450 2-in-1 | Ultra 7 165U 44 W / 38 W | Graphics 4-Core | 32 GB | 14464 |
| Modell | CPU | GPU | RAM | Wert |
|---|---|---|---|---|
| Dell Latitude 7450 2-in-1 | Ultra 7 165U 44 W / 38 W | Graphics 4-Core | 32 GB | 3438 |
| Lenovo ThinkPad X1 2in1 G9 21KE004AGE | Ultra 7 165U 40 W / 30 W | Graphics 4-Core 2000 MHz | 32 GB | 3681 |
| Modell | CPU | GPU | RAM | Wert |
|---|---|---|---|---|
| Samsung Galaxy Book4 Pro 14 | Ultra 7 155H 64 W / 20 W | Arc 8-Core 2250 MHz | 16 GB | 4294 |
| MSI Claw | Ultra 7 155H 45 W / 43 W | Arc 8-Core 2250 / 3200 MHz | 16 GB | 5351 |
| HP Spectre x360 14-eu0078ng | Ultra 7 155H 64 W / 24 W | Arc 8-Core | 32 GB | 5633 |
| Samsung Galaxy Book4 Pro 16 | Ultra 7 155H 64 W / 28 W | Arc 8-Core | 16 GB | 5780 |
| Dell XPS 13 9340 Core Ultra 7 | Ultra 7 155H 45 W / 24 W | Arc 8-Core 2250 MHz | 32 GB | 5828 |
| Acer Swift Go 14 SFG14-72 | Ultra 7 155H 55 W / 45 W | Arc 8-Core | 32 GB | 5869 |
| Huawei MateBook X Pro 2024 | Ultra 9 185H 80 W / 45 W | Arc 8-Core 2350 MHz | 32 GB | 6363 |
| Honor MagicBook Art 14 | Ultra 7 155H 43 W / 28 W | Arc 8-Core 2250 MHz | 32 GB | 6413 |
| Intel OEM Reference System | Ultra 7 155H 0 W / 32 W | Arc 8-Core | 32 GB | 6442 |
| Xiaomi RedmiBook Pro 16 2024 | Ultra 7 155H 90 W / 45 W | Arc 8-Core 2250 MHz | 32 GB | 6486 |
| Xiaomi RedmiBook Pro 14 2024 | Ultra 7 155H 100 W / 45 W | Arc 8-Core 2250 MHz | 32 GB | 6529 |
| Asus ZenBook 14 UX3405MA | Ultra 7 155H 64 W / 20 W | Arc 8-Core | 32 GB | 6558 |
| Lenovo IdeaPad Pro 5 16IMH G9 | Ultra 7 155H 70 W / 50 W | Arc 8-Core 2250 MHz | 32 GB | 6686 |
| Modell | CPU | GPU | RAM | Wert |
|---|---|---|---|---|
| HP Envy x360 2-in-1 14-fc0078TU | Ultra 5 125U 29 W / 23 W | Graphics 4-Core | 16 GB | 18070 |
| Dell Latitude 7450 2-in-1 | Ultra 7 165U 44 W / 38 W | Graphics 4-Core | 32 GB | 20000 |
| Modell | CPU | GPU | RAM | Wert |
|---|---|---|---|---|
| Apple Macbook Air 2019 | i5-8210Y | UHD Graphics 617 | 8 GB | 3711 |
| Modell | CPU | GPU | RAM | Wert |
|---|---|---|---|---|
| LG Gram 17 17Z90S-G.AA79G | Ultra 7 155H 44 W / 22 W | Arc 8-Core | 16 GB | 13461 |
| Acer Swift Go 14 SFG14-72 | Ultra 7 155H 55 W / 45 W | Arc 8-Core | 32 GB | 24522 |
| LG Gram 17 17Z90S-G.AA79G | Ultra 7 155H 44 W / 22 W | Arc 8-Core | 16 GB | 25035 |
| Khadas Mind 2 | Ultra 7 155H 64 W / 35 W | Arc 8-Core 2250 MHz | 32 GB | 26874 |
| Acemagic F2A | Ultra 7 155H 90 W / 65 W | Arc 8-Core | 32 GB | 27353 |
| Geekom GT1 Mega | Ultra 9 185H 70 W / 45 W | Arc 8-Core 2350 MHz | 32 GB | 27447 |
| Asus Vivobook S16 S5606M | Ultra 7 155H 65 W / 54 W | Arc 8-Core 0.1 GB | 16 GB | 27761 |
| AcePC Wizbox AI | Ultra 7 155H | Arc 8-Core | 32 GB | 28237 |
| Huawei MateBook 14 FLMH-W7611T | Ultra 7 155H 64 W / 42 W | Arc 8-Core 0.1 GB | 16 GB | 28337 |
| Asus NUC 14 Pro+ | Ultra 9 185H 115 W / 115 W | Arc 8-Core 2350 MHz | 32 GB | 29487 |
| Modell | CPU | GPU | RAM | Wert |
|---|---|---|---|---|
| HP Envy x360 2-in-1 14-fc0078TU | Ultra 5 125U 29 W / 23 W | Graphics 4-Core | 16 GB | 21828 |
| Dell Latitude 7450 2-in-1 | Ultra 7 165U 44 W / 38 W | Graphics 4-Core | 32 GB | 23544 |
| Modell | CPU | GPU | RAM | Wert |
|---|---|---|---|---|
| Apple Macbook Air 2019 | i5-8210Y | UHD Graphics 617 | 8 GB | 4496 |
| Modell | CPU | GPU | RAM | Wert |
|---|---|---|---|---|
| LG Gram 17 17Z90S-G.AA79G | Ultra 7 155H 44 W / 22 W | Arc 8-Core | 16 GB | 25821 |
| Acer Swift Go 14 SFG14-72 | Ultra 7 155H 55 W / 45 W | Arc 8-Core | 32 GB | 29912 |
| Acemagic F2A | Ultra 7 155H 90 W / 65 W | Arc 8-Core | 32 GB | 32273 |
| LG Gram 17 17Z90S-G.AA79G | Ultra 7 155H 44 W / 22 W | Arc 8-Core | 16 GB | 32492 |
| AcePC Wizbox AI | Ultra 7 155H | Arc 8-Core | 32 GB | 33783 |
| Khadas Mind 2 | Ultra 7 155H 64 W / 35 W | Arc 8-Core 2250 MHz | 32 GB | 34614 |
| Asus NUC 14 Pro+ | Ultra 9 185H 115 W / 115 W | Arc 8-Core 2350 MHz | 32 GB | 34791 |
| Huawei MateBook 14 FLMH-W7611T | Ultra 7 155H 64 W / 42 W | Arc 8-Core 0.1 GB | 16 GB | 35338 |
| Asus Vivobook S16 S5606M | Ultra 7 155H 65 W / 54 W | Arc 8-Core 0.1 GB | 16 GB | 35385 |
| Geekom GT1 Mega | Ultra 9 185H 70 W / 45 W | Arc 8-Core 2350 MHz | 32 GB | 36983 |
| Modell | CPU | GPU | RAM | Wert |
|---|---|---|---|---|
| Apple Macbook Air 2019 | i5-8210Y | UHD Graphics 617 | 8 GB | 1632 |
| Apple MacBook Air 2018 | i5-8210Y | UHD Graphics 617 1050 MHz | 8 GB | 1711 |
| Modell | CPU | GPU | RAM | Wert |
|---|---|---|---|---|
| Apple Macbook Air 2019 | i5-8210Y | UHD Graphics 617 | 8 GB | 1509 |
| Apple MacBook Air 2018 | i5-8210Y | UHD Graphics 617 1050 MHz | 8 GB | 1572 |
3DM Vant. Perf. total + Intel Arc 8-Core iGPU
| Modell | CPU | GPU | RAM | Wert |
|---|---|---|---|---|
| Minisforum AtomMan X7 Ti | Ultra 9 185H 65 W / 65 W | Arc 8-Core 2350 MHz | 32 GB | 38739 |
| Acemagic F2A | Ultra 7 155H 90 W / 65 W | Arc 8-Core | 32 GB | 38877 |
| Khadas Mind 2 | Ultra 7 155H 64 W / 35 W | Arc 8-Core 2250 MHz | 32 GB | 39816 |
| Asus NUC 14 Pro+ | Ultra 9 185H 115 W / 115 W | Arc 8-Core 2350 MHz | 32 GB | 42630 |
| Acer Swift Go 14 SFG14-72 | Ultra 7 155H 55 W / 45 W | Arc 8-Core | 32 GB | 43185 |
| Geekom GT1 Mega | Ultra 9 185H 70 W / 45 W | Arc 8-Core 2350 MHz | 32 GB | 43259 |
| Modell | CPU | GPU | RAM | Wert |
|---|---|---|---|---|
| Minisforum AtomMan X7 Ti | Ultra 9 185H 65 W / 65 W | Arc 8-Core 2350 MHz | 32 GB | 33028 |
| Acemagic F2A | Ultra 7 155H 90 W / 65 W | Arc 8-Core | 32 GB | 33524 |
| Khadas Mind 2 | Ultra 7 155H 64 W / 35 W | Arc 8-Core 2250 MHz | 32 GB | 35670 |
| Asus NUC 14 Pro+ | Ultra 9 185H 115 W / 115 W | Arc 8-Core 2350 MHz | 32 GB | 37422 |
| Geekom GT1 Mega | Ultra 9 185H 70 W / 45 W | Arc 8-Core 2350 MHz | 32 GB | 37995 |
| Acer Swift Go 14 SFG14-72 | Ultra 7 155H 55 W / 45 W | Arc 8-Core | 32 GB | 39184 |
| Modell | CPU | GPU | RAM | Wert |
|---|---|---|---|---|
| Acemagic F2A | Ultra 7 155H 90 W / 65 W | Arc 8-Core | 32 GB | 42967 |
| Minisforum AtomMan X7 Ti | Ultra 9 185H 65 W / 65 W | Arc 8-Core 2350 MHz | 32 GB | 45122 |
| Khadas Mind 2 | Ultra 7 155H 64 W / 35 W | Arc 8-Core 2250 MHz | 32 GB | 47115 |
| Asus NUC 14 Pro+ | Ultra 9 185H 115 W / 115 W | Arc 8-Core 2350 MHz | 32 GB | 50932 |
| Geekom GT1 Mega | Ultra 9 185H 70 W / 45 W | Arc 8-Core 2350 MHz | 32 GB | 53214 |
| Modell | CPU | GPU | RAM | Wert | |
|---|---|---|---|---|---|
| 3DMark 06 - Standard 1280x1024 | |||||
| Apple MacBook Air 2018 (3DMark 06 - Standard 1280x1024) | i5-8210Y | UHD Graphics 617 1050 MHz | 8 GB | 8662 | |
| Modell | CPU | GPU | RAM | Wert | |
|---|---|---|---|---|---|
| 3DMark 06 - Standard 1280x1024 | |||||
| Acer Swift Go 14 SFG14-72 (3DMark 06 - Standard 1280x1024) | Ultra 7 155H 55 W / 45 W | Arc 8-Core | 32 GB | ||
| Medion S17431-MD62640 (3DMark 06 - Standard 1280x1024) | Ultra 7 155H 60 W / 45 W | Arc 8-Core 2250 MHz | 16 GB | 34184 | |
| Asus NUC 14 Pro+ (3DMark 06 - Standard 1280x1024) | Ultra 9 185H 115 W / 115 W | Arc 8-Core 2350 MHz | 32 GB | 36407 | |
| Khadas Mind 2 (3DMark 06 - Standard 1280x1024) | Ultra 7 155H 64 W / 35 W | Arc 8-Core 2250 MHz | 32 GB | 36442 | |
| Acemagic F2A (3DMark 06 - Standard 1280x1024) | Ultra 7 155H 90 W / 65 W | Arc 8-Core | 32 GB | 36831 | |
| Geekom GT1 Mega (3DMark 06 - Standard 1280x1024) | Ultra 9 185H 70 W / 45 W | Arc 8-Core 2350 MHz | 32 GB | 38204 | |
| Minisforum AtomMan X7 Ti (3DMark 06 - Standard 1280x1024) | Ultra 9 185H 65 W / 65 W | Arc 8-Core 2350 MHz | 32 GB | 38214 | |
| Modell | CPU | GPU | RAM | Wert |
|---|---|---|---|---|
| Acemagic F2A | Ultra 7 155H 90 W / 65 W | Arc 8-Core | 32 GB | 17.1 |
| Minisforum AtomMan X7 Ti | Ultra 9 185H 65 W / 65 W | Arc 8-Core 2350 MHz | 32 GB | 18.5 |
| Asus NUC 14 Pro+ | Ultra 9 185H 115 W / 115 W | Arc 8-Core 2350 MHz | 32 GB | 19.5 |
| Khadas Mind 2 | Ultra 7 155H 64 W / 35 W | Arc 8-Core 2250 MHz | 32 GB | 19.7 |
| Geekom GT1 Mega | Ultra 9 185H 70 W / 45 W | Arc 8-Core 2350 MHz | 32 GB | 20.1 |
specvp12 sw-03 + Intel Arc 8-Core iGPU
| Modell | CPU | GPU | RAM | Wert |
|---|---|---|---|---|
| Acemagic F2A | Ultra 7 155H 90 W / 65 W | Arc 8-Core | 32 GB | 42.7 |
| Minisforum AtomMan X7 Ti | Ultra 9 185H 65 W / 65 W | Arc 8-Core 2350 MHz | 32 GB | 43 |
| Modell | CPU | GPU | RAM | Wert |
|---|---|---|---|---|
| Acemagic F2A | Ultra 7 155H 90 W / 65 W | Arc 8-Core | 32 GB | 3.29 |
| Minisforum AtomMan X7 Ti | Ultra 9 185H 65 W / 65 W | Arc 8-Core 2350 MHz | 32 GB | 3.56 |
| Modell | CPU | GPU | RAM | Wert |
|---|---|---|---|---|
| Acemagic F2A | Ultra 7 155H 90 W / 65 W | Arc 8-Core | 32 GB | 18.2 |
| Minisforum AtomMan X7 Ti | Ultra 9 185H 65 W / 65 W | Arc 8-Core 2350 MHz | 32 GB | 19.9 |
| Modell | CPU | GPU | RAM | Wert |
|---|---|---|---|---|
| Minisforum AtomMan X7 Ti | Ultra 9 185H 65 W / 65 W | Arc 8-Core 2350 MHz | 32 GB | 15.9 |
| Acemagic F2A | Ultra 7 155H 90 W / 65 W | Arc 8-Core | 32 GB | 16.9 |
| Modell | CPU | GPU | RAM | Wert |
|---|---|---|---|---|
| Acemagic F2A | Ultra 7 155H 90 W / 65 W | Arc 8-Core | 32 GB | 54.9 |
| Minisforum AtomMan X7 Ti | Ultra 9 185H 65 W / 65 W | Arc 8-Core 2350 MHz | 32 GB | 58 |
| Modell | CPU | GPU | RAM | Wert |
|---|---|---|---|---|
| Minisforum AtomMan X7 Ti | Ultra 9 185H 65 W / 65 W | Arc 8-Core 2350 MHz | 32 GB | 0.67 |
| Acemagic F2A | Ultra 7 155H 90 W / 65 W | Arc 8-Core | 32 GB | 0.91 |
| Modell | CPU | GPU | RAM | Wert |
|---|---|---|---|---|
| Minisforum AtomMan X7 Ti | Ultra 9 185H 65 W / 65 W | Arc 8-Core 2350 MHz | 32 GB | 22.7 |
| Acemagic F2A | Ultra 7 155H 90 W / 65 W | Arc 8-Core | 32 GB | 23.1 |
| Modell | CPU | GPU | RAM | Wert |
|---|---|---|---|---|
| Acemagic F2A | Ultra 7 155H 90 W / 65 W | Arc 8-Core | 32 GB | 48.2 |
| Minisforum AtomMan X7 Ti | Ultra 9 185H 65 W / 65 W | Arc 8-Core 2350 MHz | 32 GB | 51.3 |
| Modell | CPU | GPU | RAM | Wert |
|---|---|---|---|---|
| Minisforum AtomMan X7 Ti | Ultra 9 185H 65 W / 65 W | Arc 8-Core 2350 MHz | 32 GB | 49.7 |
| Acemagic F2A | Ultra 7 155H 90 W / 65 W | Arc 8-Core | 32 GB | 49.8 |
| Modell | CPU | GPU | RAM | Wert |
|---|---|---|---|---|
| Acemagic F2A | Ultra 7 155H 90 W / 65 W | Arc 8-Core | 32 GB | 44.8 |
| Minisforum AtomMan X7 Ti | Ultra 9 185H 65 W / 65 W | Arc 8-Core 2350 MHz | 32 GB | 45.6 |
| Modell | CPU | GPU | RAM | Wert |
|---|---|---|---|---|
| Acemagic F2A | Ultra 7 155H 90 W / 65 W | Arc 8-Core | 32 GB | 5.9 |
| Minisforum AtomMan X7 Ti | Ultra 9 185H 65 W / 65 W | Arc 8-Core 2350 MHz | 32 GB | 6.43 |
| Modell | CPU | GPU | RAM | Wert |
|---|---|---|---|---|
| Acemagic F2A | Ultra 7 155H 90 W / 65 W | Arc 8-Core | 32 GB | 18.2 |
| Minisforum AtomMan X7 Ti | Ultra 9 185H 65 W / 65 W | Arc 8-Core 2350 MHz | 32 GB | 19.9 |
| Modell | CPU | GPU | RAM | Wert |
|---|---|---|---|---|
| Minisforum AtomMan X7 Ti | Ultra 9 185H 65 W / 65 W | Arc 8-Core 2350 MHz | 32 GB | 25 |
| Acemagic F2A | Ultra 7 155H 90 W / 65 W | Arc 8-Core | 32 GB | 29.7 |
| Modell | CPU | GPU | RAM | Wert |
|---|---|---|---|---|
| Acemagic F2A | Ultra 7 155H 90 W / 65 W | Arc 8-Core | 32 GB | 59.5 |
| Minisforum AtomMan X7 Ti | Ultra 9 185H 65 W / 65 W | Arc 8-Core 2350 MHz | 32 GB | 62.5 |
| Modell | CPU | GPU | RAM | Wert |
|---|---|---|---|---|
| Minisforum AtomMan X7 Ti | Ultra 9 185H 65 W / 65 W | Arc 8-Core 2350 MHz | 32 GB | 5.27 |
| Acemagic F2A | Ultra 7 155H 90 W / 65 W | Arc 8-Core | 32 GB | 5.69 |
| Modell | CPU | GPU | RAM | Wert |
|---|---|---|---|---|
| Minisforum AtomMan X7 Ti | Ultra 9 185H 65 W / 65 W | Arc 8-Core 2350 MHz | 32 GB | 29.3 |
| Acemagic F2A | Ultra 7 155H 90 W / 65 W | Arc 8-Core | 32 GB | 29.6 |
| Modell | CPU | GPU | RAM | Wert |
|---|---|---|---|---|
| Acemagic F2A | Ultra 7 155H 90 W / 65 W | Arc 8-Core | 32 GB | 71.6 |
| Minisforum AtomMan X7 Ti | Ultra 9 185H 65 W / 65 W | Arc 8-Core 2350 MHz | 32 GB | 76.8 |
| Modell | CPU | GPU | RAM | Wert |
|---|---|---|---|---|
| Acemagic F2A | Ultra 7 155H 90 W / 65 W | Arc 8-Core | 32 GB | 46.4 |
| Minisforum AtomMan X7 Ti | Ultra 9 185H 65 W / 65 W | Arc 8-Core 2350 MHz | 32 GB | 48.5 |
| Modell | CPU | GPU | RAM | Wert |
|---|---|---|---|---|
| Asus NUC 14 Pro+ | Ultra 9 185H 115 W / 115 W | Arc 8-Core 2350 MHz | 32 GB | 5.56 |
| Khadas Mind 2 | Ultra 7 155H 64 W / 35 W | Arc 8-Core 2250 MHz | 32 GB | 5.8 |
| Geekom GT1 Mega | Ultra 9 185H 70 W / 45 W | Arc 8-Core 2350 MHz | 32 GB | 5.94 |
| Modell | CPU | GPU | RAM | Wert |
|---|---|---|---|---|
| Khadas Mind 2 | Ultra 7 155H 64 W / 35 W | Arc 8-Core 2250 MHz | 32 GB | 14.7 |
| Asus NUC 14 Pro+ | Ultra 9 185H 115 W / 115 W | Arc 8-Core 2350 MHz | 32 GB | 17.6 |
| Geekom GT1 Mega | Ultra 9 185H 70 W / 45 W | Arc 8-Core 2350 MHz | 32 GB | 17.8 |
| Modell | CPU | GPU | RAM | Wert |
|---|---|---|---|---|
| Asus NUC 14 Pro+ | Ultra 9 185H 115 W / 115 W | Arc 8-Core 2350 MHz | 32 GB | 86.9 |
| Khadas Mind 2 | Ultra 7 155H 64 W / 35 W | Arc 8-Core 2250 MHz | 32 GB | 87.6 |
| Geekom GT1 Mega | Ultra 9 185H 70 W / 45 W | Arc 8-Core 2350 MHz | 32 GB | 89.9 |
| Modell | CPU | GPU | RAM | Wert |
|---|---|---|---|---|
| Khadas Mind 2 | Ultra 7 155H 64 W / 35 W | Arc 8-Core 2250 MHz | 32 GB | 5.5 |
| Geekom GT1 Mega | Ultra 9 185H 70 W / 45 W | Arc 8-Core 2350 MHz | 32 GB | 6.33 |
| Asus NUC 14 Pro+ | Ultra 9 185H 115 W / 115 W | Arc 8-Core 2350 MHz | 32 GB | 6.4 |
| Modell | CPU | GPU | RAM | Wert |
|---|---|---|---|---|
| Khadas Mind 2 | Ultra 7 155H 64 W / 35 W | Arc 8-Core 2250 MHz | 32 GB | 24.5 |
| Asus NUC 14 Pro+ | Ultra 9 185H 115 W / 115 W | Arc 8-Core 2350 MHz | 32 GB | 26 |
| Geekom GT1 Mega | Ultra 9 185H 70 W / 45 W | Arc 8-Core 2350 MHz | 32 GB | 27.6 |
| Modell | CPU | GPU | RAM | Wert |
|---|---|---|---|---|
| Khadas Mind 2 | Ultra 7 155H 64 W / 35 W | Arc 8-Core 2250 MHz | 32 GB | 17.7 |
| Asus NUC 14 Pro+ | Ultra 9 185H 115 W / 115 W | Arc 8-Core 2350 MHz | 32 GB | 18.1 |
| Geekom GT1 Mega | Ultra 9 185H 70 W / 45 W | Arc 8-Core 2350 MHz | 32 GB | 19.5 |
| Modell | CPU | GPU | RAM | Wert |
|---|---|---|---|---|
| Asus NUC 14 Pro+ | Ultra 9 185H 115 W / 115 W | Arc 8-Core 2350 MHz | 32 GB | 21.6 |
| Khadas Mind 2 | Ultra 7 155H 64 W / 35 W | Arc 8-Core 2250 MHz | 32 GB | 22.6 |
| Geekom GT1 Mega | Ultra 9 185H 70 W / 45 W | Arc 8-Core 2350 MHz | 32 GB | 26.1 |
| Modell | CPU | GPU | RAM | Wert |
|---|---|---|---|---|
| Acemagic F2A | Ultra 7 155H 90 W / 65 W | Arc 8-Core | 32 GB | 11 |
| Minisforum AtomMan X7 Ti | Ultra 9 185H 65 W / 65 W | Arc 8-Core 2350 MHz | 32 GB | 12.1 |
| Modell | CPU | GPU | RAM | Wert |
|---|---|---|---|---|
| Asus NUC 14 Pro+ | Ultra 9 185H 115 W / 115 W | Arc 8-Core 2350 MHz | 32 GB | 5.37 |
| Khadas Mind 2 | Ultra 7 155H 64 W / 35 W | Arc 8-Core 2250 MHz | 32 GB | 5.57 |
| Geekom GT1 Mega | Ultra 9 185H 70 W / 45 W | Arc 8-Core 2350 MHz | 32 GB | 5.68 |
| Acemagic F2A | Ultra 7 155H 90 W / 65 W | Arc 8-Core | 32 GB | 5.7 |
| Minisforum AtomMan X7 Ti | Ultra 9 185H 65 W / 65 W | Arc 8-Core 2350 MHz | 32 GB | 6.24 |
| Modell | CPU | GPU | RAM | Wert |
|---|---|---|---|---|
| Minisforum AtomMan X7 Ti | Ultra 9 185H 65 W / 65 W | Arc 8-Core 2350 MHz | 32 GB | 4.23 |
| Acemagic F2A | Ultra 7 155H 90 W / 65 W | Arc 8-Core | 32 GB | 5.05 |
| Khadas Mind 2 | Ultra 7 155H 64 W / 35 W | Arc 8-Core 2250 MHz | 32 GB | 5.71 |
| Asus NUC 14 Pro+ | Ultra 9 185H 115 W / 115 W | Arc 8-Core 2350 MHz | 32 GB | 6.99 |
| Geekom GT1 Mega | Ultra 9 185H 70 W / 45 W | Arc 8-Core 2350 MHz | 32 GB | 7.07 |
| Modell | CPU | GPU | RAM | Wert |
|---|---|---|---|---|
| Acemagic F2A | Ultra 7 155H 90 W / 65 W | Arc 8-Core | 32 GB | 35.4 |
| Asus NUC 14 Pro+ | Ultra 9 185H 115 W / 115 W | Arc 8-Core 2350 MHz | 32 GB | 37.2 |
| Minisforum AtomMan X7 Ti | Ultra 9 185H 65 W / 65 W | Arc 8-Core 2350 MHz | 32 GB | 37.7 |
| Geekom GT1 Mega | Ultra 9 185H 70 W / 45 W | Arc 8-Core 2350 MHz | 32 GB | 38.8 |
| Khadas Mind 2 | Ultra 7 155H 64 W / 35 W | Arc 8-Core 2250 MHz | 32 GB | 41 |
| Modell | CPU | GPU | RAM | Wert |
|---|---|---|---|---|
| Khadas Mind 2 | Ultra 7 155H 64 W / 35 W | Arc 8-Core 2250 MHz | 32 GB | 4.25 |
| Acemagic F2A | Ultra 7 155H 90 W / 65 W | Arc 8-Core | 32 GB | 4.61 |
| Asus NUC 14 Pro+ | Ultra 9 185H 115 W / 115 W | Arc 8-Core 2350 MHz | 32 GB | 4.94 |
| Geekom GT1 Mega | Ultra 9 185H 70 W / 45 W | Arc 8-Core 2350 MHz | 32 GB | 5 |
| Minisforum AtomMan X7 Ti | Ultra 9 185H 65 W / 65 W | Arc 8-Core 2350 MHz | 32 GB | 6.03 |
| Modell | CPU | GPU | RAM | Wert |
|---|---|---|---|---|
| Acemagic F2A | Ultra 7 155H 90 W / 65 W | Arc 8-Core | 32 GB | 17.9 |
| Khadas Mind 2 | Ultra 7 155H 64 W / 35 W | Arc 8-Core 2250 MHz | 32 GB | 18.1 |
| Minisforum AtomMan X7 Ti | Ultra 9 185H 65 W / 65 W | Arc 8-Core 2350 MHz | 32 GB | 18.5 |
| Asus NUC 14 Pro+ | Ultra 9 185H 115 W / 115 W | Arc 8-Core 2350 MHz | 32 GB | 18.9 |
| Geekom GT1 Mega | Ultra 9 185H 70 W / 45 W | Arc 8-Core 2350 MHz | 32 GB | 19.8 |
| Modell | CPU | GPU | RAM | Wert |
|---|---|---|---|---|
| Acemagic F2A | Ultra 7 155H 90 W / 65 W | Arc 8-Core | 32 GB | 10 |
| Minisforum AtomMan X7 Ti | Ultra 9 185H 65 W / 65 W | Arc 8-Core 2350 MHz | 32 GB | 11.1 |
| Asus NUC 14 Pro+ | Ultra 9 185H 115 W / 115 W | Arc 8-Core 2350 MHz | 32 GB | 11.2 |
| Khadas Mind 2 | Ultra 7 155H 64 W / 35 W | Arc 8-Core 2250 MHz | 32 GB | 11.3 |
| Geekom GT1 Mega | Ultra 9 185H 70 W / 45 W | Arc 8-Core 2350 MHz | 32 GB | 11.7 |
| Modell | CPU | GPU | RAM | Wert |
|---|---|---|---|---|
| Acemagic F2A | Ultra 7 155H 90 W / 65 W | Arc 8-Core | 32 GB | 12.9 |
| Khadas Mind 2 | Ultra 7 155H 64 W / 35 W | Arc 8-Core 2250 MHz | 32 GB | 13.9 |
| Asus NUC 14 Pro+ | Ultra 9 185H 115 W / 115 W | Arc 8-Core 2350 MHz | 32 GB | 14.8 |
| Minisforum AtomMan X7 Ti | Ultra 9 185H 65 W / 65 W | Arc 8-Core 2350 MHz | 32 GB | 14.9 |
| Geekom GT1 Mega | Ultra 9 185H 70 W / 45 W | Arc 8-Core 2350 MHz | 32 GB | 15.5 |
| Modell | CPU | GPU | RAM | Wert |
|---|---|---|---|---|
| Khadas Mind 2 | Ultra 7 155H 64 W / 35 W | Arc 8-Core 2250 MHz | 32 GB | 15690 |
| Acer Swift Go 14 SFG14-72 | Ultra 7 155H 55 W / 45 W | Arc 8-Core | 32 GB | 17440 |
| Asus NUC 14 Pro+ | Ultra 9 185H 115 W / 115 W | Arc 8-Core 2350 MHz | 32 GB | 18259 |
| Acemagic F2A | Ultra 7 155H 90 W / 65 W | Arc 8-Core | 32 GB | 18429 |
| Minisforum AtomMan X7 Ti | Ultra 9 185H 65 W / 65 W | Arc 8-Core 2350 MHz | 32 GB | 18495 |
| Geekom GT1 Mega | Ultra 9 185H 70 W / 45 W | Arc 8-Core 2350 MHz | 32 GB | 19892 |
| Modell | CPU | GPU | RAM | Wert |
|---|---|---|---|---|
| Khadas Mind 2 | Ultra 7 155H 64 W / 35 W | Arc 8-Core 2250 MHz | 32 GB | 97.07 |
| Acer Swift Go 14 SFG14-72 | Ultra 7 155H 55 W / 45 W | Arc 8-Core | 32 GB | 101.92 |
| Minisforum AtomMan X7 Ti | Ultra 9 185H 65 W / 65 W | Arc 8-Core 2350 MHz | 32 GB | 107.11 |
| Acemagic F2A | Ultra 7 155H 90 W / 65 W | Arc 8-Core | 32 GB | 108.87 |
| Geekom GT1 Mega | Ultra 9 185H 70 W / 45 W | Arc 8-Core 2350 MHz | 32 GB | 111.5 |
| Asus NUC 14 Pro+ | Ultra 9 185H 115 W / 115 W | Arc 8-Core 2350 MHz | 32 GB | 115.68 |
Cinebench R15 OpenGL 64 Bit + Intel Graphics 4-Cores iGPU (Arc)
| Modell | CPU | GPU | RAM | Wert |
|---|---|---|---|---|
| Apple MacBook Air 2018 | i5-8210Y | UHD Graphics 617 1050 MHz macOS | 8 GB | 34.7 |
| Apple Macbook Air 2019 | i5-8210Y | UHD Graphics 617 | 8 GB | 43.5 |
| Modell | CPU | GPU | RAM | Wert |
|---|---|---|---|---|
| Apple Macbook Air 2019 | i5-8210Y | UHD Graphics 617 | 8 GB | 97.8 |
| Apple MacBook Air 2018 | i5-8210Y | UHD Graphics 617 1050 MHz macOS | 8 GB | 99.3 |
| Modell | CPU | GPU | RAM | Wert |
|---|---|---|---|---|
| Lenovo ThinkPad T14 G5 21ML005JGE | Ultra 7 155U 40 W / 22.5 W | Graphics 4-Core | 16 GB | 16.8173 |
| Lenovo ThinkPad T14s Gen 5 21LS001PGE | Ultra 5 125U 40 W / 25 W | Graphics 4-Core | 16 GB | 20.7 |
| Lenovo ThinkPad T16 Gen 3 21MN005XGE | Ultra 5 125U | Graphics 4-Core | 32 GB | 20.8 |
| Modell | CPU | GPU | RAM | Wert |
|---|---|---|---|---|
| Acer Swift Go 14 SFG14-72 | Ultra 7 155H 55 W / 45 W | Arc 8-Core | 32 GB | 36.6 |
| Asus ZenBook 14 UX3405MA | Ultra 7 155H | Arc 8-Core | 32 GB | 40.5 |
| Xiaomi RedmiBook Pro 14 2024 | Ultra 7 155H 100 W / 45 W | Arc 8-Core 2250 MHz | 32 GB | 41.6 |
| Modell | CPU | GPU | RAM | Wert |
|---|---|---|---|---|
| Lenovo ThinkPad T14 G5 21ML005JGE | Ultra 7 155U 40 W / 22.5 W | Graphics 4-Core | 16 GB | 37.3169 |
| Lenovo ThinkPad T16 Gen 3 21MN005XGE | Ultra 5 125U | Graphics 4-Core | 32 GB | 48.8 |
| Lenovo ThinkPad T14s Gen 5 21LS001PGE | Ultra 5 125U 40 W / 25 W | Graphics 4-Core | 16 GB | 49.1 |
| Modell | CPU | GPU | RAM | Wert |
|---|---|---|---|---|
| Acer Swift Go 14 SFG14-72 | Ultra 7 155H 55 W / 45 W | Arc 8-Core | 32 GB | 83.4 |
| Xiaomi RedmiBook Pro 14 2024 | Ultra 7 155H 100 W / 45 W | Arc 8-Core 2250 MHz | 32 GB | 91.5 |
| Modell | CPU | GPU | RAM | Wert |
|---|---|---|---|---|
| Lenovo ThinkPad T14 G5 21ML005JGE | Ultra 7 155U 40 W / 22.5 W | Graphics 4-Core | 16 GB | 91.8253 |
| Lenovo ThinkPad T16 Gen 3 21MN005XGE | Ultra 5 125U | Graphics 4-Core | 32 GB | 129.2 |
| Lenovo ThinkPad T14s Gen 5 21LS001PGE | Ultra 5 125U 40 W / 25 W | Graphics 4-Core | 16 GB | 129.5 |
| Modell | CPU | GPU | RAM | Wert |
|---|---|---|---|---|
| Xiaomi RedmiBook Pro 14 2024 | Ultra 7 155H 100 W / 45 W | Arc 8-Core 2250 MHz | 32 GB | 206.4 |
| Acer Swift Go 14 SFG14-72 | Ultra 7 155H 55 W / 45 W | Arc 8-Core | 32 GB | 210 |
| Asus ZenBook 14 UX3405MA | Ultra 7 155H | Arc 8-Core | 32 GB | 233.2 |
| Modell | CPU | GPU | RAM | Wert |
|---|---|---|---|---|
| Lenovo ThinkPad T14 G5 21ML005JGE | Ultra 7 155U 40 W / 22.5 W | Graphics 4-Core | 16 GB | 75.6254 |
| Lenovo ThinkPad T14s Gen 5 21LS001PGE | Ultra 5 125U 40 W / 25 W | Graphics 4-Core | 16 GB | 89.5 |
| Lenovo ThinkPad T16 Gen 3 21MN005XGE | Ultra 5 125U | Graphics 4-Core | 32 GB | 91.5 |
| Modell | CPU | GPU | RAM | Wert |
|---|---|---|---|---|
| Acer Swift Go 14 SFG14-72 | Ultra 7 155H 55 W / 45 W | Arc 8-Core | 32 GB | 167.07 |
| Modell | CPU | GPU | RAM | Wert |
|---|---|---|---|---|
| Lenovo ThinkPad T14 G5 21ML005JGE | Ultra 7 155U 40 W / 22.5 W | Graphics 4-Core | 16 GB | 117.479 |
| Lenovo ThinkPad T16 Gen 3 21MN005XGE | Ultra 5 125U | Graphics 4-Core | 32 GB | 160.1 |
| Lenovo ThinkPad T14s Gen 5 21LS001PGE | Ultra 5 125U 40 W / 25 W | Graphics 4-Core | 16 GB | 161.9 |
| Modell | CPU | GPU | RAM | Wert |
|---|---|---|---|---|
| Lenovo ThinkPad T14 G5 21ML005JGE | Ultra 7 155U 40 W / 22.5 W | Graphics 4-Core | 16 GB | 173.822 |
| Lenovo ThinkPad T16 Gen 3 21MN005XGE | Ultra 5 125U | Graphics 4-Core | 32 GB | 246.1 |
| Lenovo ThinkPad T14s Gen 5 21LS001PGE | Ultra 5 125U 40 W / 25 W | Graphics 4-Core | 16 GB | 256.6 |
GFXBench T-Rex HD Offscreen C24Z16 + Intel Graphics 4-Cores iGPU (Arc)
| Modell | CPU | GPU | RAM | Wert |
|---|---|---|---|---|
| Lenovo ThinkPad T14 G5 21ML005JGE | Ultra 7 155U 40 W / 22.5 W | Graphics 4-Core | 16 GB | 370.774 |
| Lenovo ThinkPad T14s Gen 5 21LS001PGE | Ultra 5 125U 40 W / 25 W | Graphics 4-Core | 16 GB | 466.5 |
| Lenovo ThinkPad T16 Gen 3 21MN005XGE | Ultra 5 125U | Graphics 4-Core | 32 GB | 467 |
| Modell | CPU | GPU | RAM | Wert |
|---|---|---|---|---|
| Acer Swift Go 14 SFG14-72 | Ultra 7 155H 55 W / 45 W | Arc 8-Core | 32 GB | 817.4 |
| Modell | CPU | GPU | RAM | Wert |
|---|---|---|---|---|
| Dell Latitude 9450 2-in-1 | Ultra 7 165U 38 W / 21 W | Graphics 4-Core 2000 MHz bc7 | 32 GB | 3.64 |
| Lenovo Yoga Book 9 13IMU9 | Ultra 7 155U 36 W / 24 W | Graphics 4-Core 1950 MHz bc7 | 16 GB | 3.64 |
| Lenovo Yoga 7 2-in-1 16IML9 | Ultra 5 125U 41 W / 29 W | Graphics 4-Core 1850 MHz bc7 | 16 GB | 3.64 |
| Lenovo ThinkBook 14 2-in-1 G4 IML | Ultra 5 125U 49 W / 25 W | Graphics 4-Core 1850 MHz bc7 | 16 GB | 3.64 |
| Dell Latitude 13 7350 | Ultra 5 135U 59 W / 18 W | Graphics 4-Core 1900 MHz bc7 | 32 GB | 3.64 |
| Lenovo Yoga 7 2-in-1 14IML9 | Ultra 5 125U 42 W / 23 W | Graphics 4-Core 1850 MHz bc7 | 16 GB | 3.64 |
| Dell Latitude 7350 Detachable | Ultra 7 164U 31 W / 16 W | Graphics 4-Core 1800 MHz bc7 | 32 GB | 3.64 |
| Lenovo ThinkPad E14 G6 | Ultra 7 155U 59 W / 36 W | Graphics 4-Core 1950 MHz bc7 | 16 GB | 3.64 |
| Lenovo ThinkBook 16 G7 IML | Ultra 5 125U 50 W / 30 W | Graphics 4-Core 1850 MHz bc7 | 16 GB | 3.64 |
| Modell | CPU | GPU | RAM | Wert |
|---|---|---|---|---|
| Acemagic F2A | Ultra 7 155H 90 W / 65 W | Arc 8-Core | 32 GB | 549 |
| Minisforum AtomMan X7 Ti | Ultra 9 185H 65 W / 65 W | Arc 8-Core 2350 MHz | 32 GB | 640 |
| Geekom GT1 Mega | Ultra 9 185H 70 W / 45 W | Arc 8-Core 2350 MHz | 32 GB | 656 |
| Khadas Mind 2 | Ultra 7 155H 64 W / 35 W | Arc 8-Core 2250 MHz | 32 GB | 711 |
| Acer Swift Go 14 SFG14-72 | Ultra 7 155H 55 W / 45 W | Arc 8-Core | 32 GB | 714 |
| Asus NUC 14 Pro+ | Ultra 9 185H 115 W / 115 W | Arc 8-Core 2350 MHz | 32 GB | 747 |
| Modell | CPU | GPU | RAM | Wert |
|---|---|---|---|---|
| Acemagic F2A | Ultra 7 155H 90 W / 65 W | Arc 8-Core | 32 GB | 2319 |
| Khadas Mind 2 | Ultra 7 155H 64 W / 35 W | Arc 8-Core 2250 MHz | 32 GB | 2515 |
| Acer Swift Go 14 SFG14-72 | Ultra 7 155H 55 W / 45 W | Arc 8-Core | 32 GB | 2611 |
| Minisforum AtomMan X7 Ti | Ultra 9 185H 65 W / 65 W | Arc 8-Core 2350 MHz | 32 GB | 2732 |
| Geekom GT1 Mega | Ultra 9 185H 70 W / 45 W | Arc 8-Core 2350 MHz | 32 GB | 2888 |
| Asus NUC 14 Pro+ | Ultra 9 185H 115 W / 115 W | Arc 8-Core 2350 MHz | 32 GB | 2927 |
| Modell | CPU | GPU | RAM | Wert |
|---|---|---|---|---|
| Minisforum AtomMan X7 Ti | Ultra 9 185H 65 W / 65 W | Arc 8-Core 2350 MHz | 32 GB | 6270 |
| Khadas Mind 2 | Ultra 7 155H 64 W / 35 W | Arc 8-Core 2250 MHz | 32 GB | 6309 |
| Acemagic F2A | Ultra 7 155H 90 W / 65 W | Arc 8-Core | 32 GB | 7480 |
| Asus NUC 14 Pro+ | Ultra 9 185H 115 W / 115 W | Arc 8-Core 2350 MHz | 32 GB | 7594 |
| Acer Swift Go 14 SFG14-72 | Ultra 7 155H 55 W / 45 W | Arc 8-Core | 32 GB | 7627 |
| Geekom GT1 Mega | Ultra 9 185H 70 W / 45 W | Arc 8-Core 2350 MHz | 32 GB | 7963 |
| Modell | CPU | GPU | RAM | Wert |
|---|---|---|---|---|
| Lenovo ThinkBook 14 2-in-1 G4 IML | Ultra 5 125U 49 W / 25 W | Graphics 4-Core 1850 MHz | 16 GB | 24.4 |
| HP Envy x360 2-in-1 14-fc0078TU | Ultra 5 125U 29 W / 23 W | Graphics 4-Core | 16 GB | 24.7 |
| Dell Latitude 13 7350 | Ultra 5 135U 59 W / 18 W | Graphics 4-Core 1900 MHz | 32 GB | 26.8 |
| Lenovo ThinkPad X1 2in1 G9 21KE004AGE | Ultra 7 165U 40 W / 30 W | Graphics 4-Core 2000 MHz | 32 GB | 30.2 |
| Dell Latitude 9450 2-in-1 | Ultra 7 165U 38 W / 21 W | Graphics 4-Core 2000 MHz | 32 GB | 32.2 |
| Modell | CPU | GPU | RAM | Wert |
|---|---|---|---|---|
| Lenovo ThinkBook 14 2-in-1 G4 IML | Ultra 5 125U 49 W / 25 W | Graphics 4-Core 1850 MHz | 16 GB | 27.4 |
| HP Envy x360 2-in-1 14-fc0078TU | Ultra 5 125U 29 W / 23 W | Graphics 4-Core | 16 GB | 27.4 |
| Dell Latitude 13 7350 | Ultra 5 135U 59 W / 18 W | Graphics 4-Core 1900 MHz | 32 GB | 28.5 |
| Lenovo Yoga 7 2-in-1 16IML9 | Ultra 5 125U 41 W / 29 W | Graphics 4-Core 1850 MHz | 16 GB | 30.7 |
| Lenovo ThinkPad X1 2in1 G9 21KE004AGE | Ultra 7 165U 40 W / 30 W | Graphics 4-Core 2000 MHz | 32 GB | 35.2 |
| Dell Latitude 9450 2-in-1 | Ultra 7 165U 38 W / 21 W | Graphics 4-Core 2000 MHz | 32 GB | 35.5 |
| Lenovo Yoga Book 9 13IMU9 | Ultra 7 155U 36 W / 24 W | Graphics 4-Core 1950 MHz | 16 GB | 41.5 |
| Modell | CPU | GPU | RAM | Wert |
|---|---|---|---|---|
| Lenovo Yoga Book 9 13IMU9 | Ultra 7 155U 36 W / 24 W | Graphics 4-Core 1950 MHz | 16 GB | 0.4313 |
| Lenovo ThinkBook 14 2-in-1 G4 IML | Ultra 5 125U 49 W / 25 W | Graphics 4-Core 1850 MHz | 16 GB | 0.4343 |
| Lenovo ThinkPad X1 2in1 G9 21KE004AGE | Ultra 7 165U 40 W / 30 W | Graphics 4-Core 2000 MHz | 32 GB | 0.4631 |
| Lenovo Yoga 7 2-in-1 16IML9 | Ultra 5 125U 41 W / 29 W | Graphics 4-Core 1850 MHz | 16 GB | 0.4886 |
| Dell Latitude 9450 2-in-1 | Ultra 7 165U 38 W / 21 W | Graphics 4-Core 2000 MHz | 32 GB | 0.504 |
| HP Envy x360 2-in-1 14-fc0078TU | Ultra 5 125U 29 W / 23 W | Graphics 4-Core | 16 GB | 0.544 |
| Modell | CPU | GPU | RAM | Wert |
|---|---|---|---|---|
| Lenovo ThinkBook 14 2-in-1 G4 IML | Ultra 5 125U 49 W / 25 W | Graphics 4-Core 1850 MHz | 16 GB | 0.4877 |
| Lenovo ThinkPad X1 2in1 G9 21KE004AGE | Ultra 7 165U 40 W / 30 W | Graphics 4-Core 2000 MHz | 32 GB | 0.54 |
| Dell Latitude 9450 2-in-1 | Ultra 7 165U 38 W / 21 W | Graphics 4-Core 2000 MHz | 32 GB | 0.556 |
| HP Envy x360 2-in-1 14-fc0078TU | Ultra 5 125U 29 W / 23 W | Graphics 4-Core | 16 GB | 0.603 |
| Modell | CPU | GPU | RAM | Wert |
|---|---|---|---|---|
| Lenovo ThinkPad X12 Detachable G2 | Ultra 5 134U | Graphics 4-Core | 32 GB | 22.2 |
| Lenovo ThinkPad X13 2-in-1 Gen 5 | Ultra 7 165U 45 W / 35 W | Graphics 4-Core 2 GB | 32 GB | 25.2 |
| Dell Latitude 7450 2-in-1 | Ultra 7 165U 44 W / 38 W | Graphics 4-Core | 32 GB | 29.5 |
| Dell Latitude 7350 Detachable | Ultra 7 164U 31 W / 16 W | Graphics 4-Core 1800 MHz | 32 GB | 37 |
| Lenovo ThinkPad T14s Gen 5 21LS001PGE | Ultra 5 125U 40 W / 25 W | Graphics 4-Core | 16 GB | 37.8 |
| Lenovo ThinkPad T14 G5 21ML005JGE | Ultra 7 155U 40 W / 22.5 W | Graphics 4-Core | 16 GB | 37.8 |
| Lenovo ThinkBook 16 G7 IML | Ultra 5 125U 50 W / 30 W | Graphics 4-Core 1850 MHz | 16 GB | 39.4 |
| Lenovo Yoga 7 2-in-1 14IML9 | Ultra 5 125U 42 W / 23 W | Graphics 4-Core 1850 MHz | 16 GB | 40.5 |
| Lenovo ThinkPad T16 Gen 3 21MN005XGE | Ultra 5 125U | Graphics 4-Core | 32 GB | 40.6 |
| Lenovo ThinkPad E14 G6 | Ultra 7 155U 59 W / 36 W | Graphics 4-Core 1950 MHz | 16 GB | 50.1 |
| Modell | CPU | GPU | RAM | Wert |
|---|---|---|---|---|
| Honor MagicBook Art 14 | Ultra 7 155H 43 W / 28 W | Arc 8-Core 2250 MHz | 32 GB | 38.8 |
| Medion S10 OLED | Ultra 7 155H 60 W / 45 W | Arc 8-Core 2250 MHz | 16 GB | 53.2 |
| Medion S17431-MD62640 | Ultra 7 155H 60 W / 45 W | Arc 8-Core 2250 MHz | 16 GB | 53.8 |
| MSI Claw | Ultra 7 155H 45 W / 43 W | Arc 8-Core 2250 / 3200 MHz | 16 GB | 54.4 |
| Framework Laptop 13.5 Core Ultra 7 155H | Ultra 7 155H 44 W / 31 W | Arc 8-Core 2250 MHz | 32 GB | 54.5 |
| HP EliteBook x360 1040 G11 | Ultra 7 165H 66 W / 41 W | Arc 8-Core 2300 MHz | 16 GB | 56.5 |
| Lenovo ThinkBook Plus Gen5 Hybrid | Ultra 7 155H 65 W / 31 W | Arc 8-Core 2250 MHz | 32 GB | 61.5 |
| Dell Inspiron 16 7640 2-in-1 | Ultra 7 155H 88 W / 45 W | Arc 8-Core 2250 MHz | 16 GB | 67 |
| Xiaomi RedmiBook Pro 14 2024 | Ultra 7 155H 100 W / 45 W | Arc 8-Core 2250 MHz | 32 GB | 71.5 |
| SCHENKER XMG Evo 15 (M24) | Ultra 7 155H 45 W / 45 W | Arc 8-Core ? / 2250 MHz | 32 GB | 76.7 |
| Modell | CPU | GPU | RAM | Wert |
|---|---|---|---|---|
| Lenovo ThinkPad X12 Detachable G2 | Ultra 5 134U | Graphics 4-Core | 32 GB | 23.7 |
| Dell Latitude 7350 Detachable | Ultra 7 164U 31 W / 16 W | Graphics 4-Core 1800 MHz | 32 GB | 31.8 |
| Dell Latitude 7450 2-in-1 | Ultra 7 165U 44 W / 38 W | Graphics 4-Core | 32 GB | 34.6 |
| Lenovo ThinkBook 16 G7 IML | Ultra 5 125U 50 W / 30 W | Graphics 4-Core 1850 MHz | 16 GB | 35.2 |
| Lenovo ThinkPad T14 G5 21ML005JGE | Ultra 7 155U 40 W / 22.5 W | Graphics 4-Core | 16 GB | 36.6 |
| Lenovo ThinkPad T16 Gen 3 21MN005XGE | Ultra 5 125U | Graphics 4-Core | 32 GB | 36.7 |
| Lenovo Yoga 7 2-in-1 14IML9 | Ultra 5 125U 42 W / 23 W | Graphics 4-Core 1850 MHz | 16 GB | 38.2 |
| Lenovo ThinkPad X13 2-in-1 Gen 5 | Ultra 7 165U 45 W / 35 W | Graphics 4-Core 2 GB | 32 GB | 38.5 |
| Lenovo ThinkPad T14s Gen 5 21LS001PGE | Ultra 5 125U 40 W / 25 W | Graphics 4-Core | 16 GB | 41.4 |
| Lenovo ThinkPad E14 G6 | Ultra 7 155U 59 W / 36 W | Graphics 4-Core 1950 MHz | 16 GB | 47.1 |
| Modell | CPU | GPU | RAM | Wert |
|---|---|---|---|---|
| Honor MagicBook Art 14 | Ultra 7 155H 43 W / 28 W | Arc 8-Core 2250 MHz | 32 GB | 40.7 |
| Medion S17431-MD62640 | Ultra 7 155H 60 W / 45 W | Arc 8-Core 2250 MHz | 16 GB | 46.9 |
| Medion S10 OLED | Ultra 7 155H 60 W / 45 W | Arc 8-Core 2250 MHz | 16 GB | 49.2 |
| Khadas Mind 2 | Ultra 7 155H 64 W / 35 W | Arc 8-Core 2250 MHz | 32 GB | 51.3 |
| Framework Laptop 13.5 Core Ultra 7 155H | Ultra 7 155H 44 W / 31 W | Arc 8-Core 2250 MHz | 32 GB | 52.4 |
| HP EliteBook x360 1040 G11 | Ultra 7 165H 66 W / 41 W | Arc 8-Core 2300 MHz | 16 GB | 54.6 |
| Lenovo ThinkBook Plus Gen5 Hybrid | Ultra 7 155H 65 W / 31 W | Arc 8-Core 2250 MHz | 32 GB | 57.9 |
| Dell Inspiron 16 7640 2-in-1 | Ultra 7 155H 88 W / 45 W | Arc 8-Core 2250 MHz | 16 GB | 64.6 |
| Geekom GT1 Mega | Ultra 9 185H 70 W / 45 W | Arc 8-Core 2350 MHz | 32 GB | 69.4 |
| Xiaomi RedmiBook Pro 14 2024 | Ultra 7 155H 100 W / 45 W | Arc 8-Core 2250 MHz | 32 GB | 71.9 |
| SCHENKER XMG Evo 15 (M24) | Ultra 7 155H 45 W / 45 W | Arc 8-Core ? / 2250 MHz | 32 GB | 72.7 |
| Asus NUC 14 Pro+ | Ultra 9 185H 115 W / 115 W | Arc 8-Core 2350 MHz | 32 GB | 74.1 |
| Modell | CPU | GPU | RAM | Wert |
|---|---|---|---|---|
| Lenovo ThinkPad T16 Gen 3 21MN005XGE | Ultra 5 125U | Graphics 4-Core | 32 GB | 0.2169 |
| Lenovo ThinkPad X13 2-in-1 Gen 5 | Ultra 7 165U 45 W / 35 W | Graphics 4-Core 2 GB | 32 GB | 0.2247 |
| Lenovo ThinkBook 16 G7 IML | Ultra 5 125U 50 W / 30 W | Graphics 4-Core 1850 MHz | 16 GB | 0.2815 |
| Dell Latitude 7350 Detachable | Ultra 7 164U 31 W / 16 W | Graphics 4-Core 1800 MHz | 32 GB | 0.3648 |
| Lenovo ThinkPad X12 Detachable G2 | Ultra 5 134U | Graphics 4-Core | 32 GB | 0.4181 |
| Modell | CPU | GPU | RAM | Wert |
|---|---|---|---|---|
| Khadas Mind 2 | Ultra 7 155H 64 W / 35 W | Arc 8-Core 2250 MHz | 32 GB | 0.1867 |
| Geekom GT1 Mega | Ultra 9 185H 70 W / 45 W | Arc 8-Core 2350 MHz | 32 GB | 0.2075 |
| Asus NUC 14 Pro+ | Ultra 9 185H 115 W / 115 W | Arc 8-Core 2350 MHz | 32 GB | 0.274 |
| Honor MagicBook Art 14 | Ultra 7 155H 43 W / 28 W | Arc 8-Core 2250 MHz | 32 GB | 0.4816 |
| Modell | CPU | GPU | RAM | Wert |
|---|---|---|---|---|
| Lenovo Yoga Book 9 13IMU9 | Ultra 7 155U 36 W / 24 W | Graphics 4-Core 1950 MHz | 16 GB | 27.3 |
| Lenovo Yoga 7 2-in-1 16IML9 | Ultra 5 125U 41 W / 29 W | Graphics 4-Core 1850 MHz | 16 GB | 31 |
| Dell Latitude 13 7350 | Ultra 5 135U 59 W / 18 W | Graphics 4-Core 1900 MHz | 32 GB | 34.8 |
| HP Envy x360 2-in-1 14-fc0078TU | Ultra 5 125U 29 W / 23 W | Graphics 4-Core | 16 GB | 37 |
| Lenovo ThinkPad X1 2in1 G9 21KE004AGE | Ultra 7 165U 40 W / 30 W | Graphics 4-Core 2000 MHz | 32 GB | 41.7 |
| Dell Latitude 9450 2-in-1 | Ultra 7 165U 38 W / 21 W | Graphics 4-Core 2000 MHz | 32 GB | 44.7 |
| Lenovo ThinkBook 14 2-in-1 G4 IML | Ultra 5 125U 49 W / 25 W | Graphics 4-Core 1850 MHz | 16 GB | 44.9 |
Average Benchmarks Intel Graphics 4-Cores iGPU (Arc) → 100% n=13
Average Benchmarks Intel UHD Graphics 617 → 28% n=13
Average Benchmarks Intel Arc 8-Core iGPU → 154% n=13
* Smaller numbers mean a higher performance
1 This benchmark is not used for the average calculation
Spiele-Benchmarks
Die folgenden Benchmarks basieren auf unseren Spieletests mit Testnotebooks. Die Performance dieser Grafikkarte bei den gelisteten Spielen ist abhängig von der verwendeten CPU, Speicherausstattung, Treiber und auch Betriebssystem. Dadurch müssen die untenstehenden Werte nicht repräsentativ sein. Detaillierte Informationen über das verwendete System sehen Sie nach einem Klick auf den fps-Wert.

Until Dawn
2024Intel Core Ultra 7 155H 3.8GHz
Arc 8-Core
min: 26.3 fps, P0.1: 30.1 fps, P1: 32.3 fps, max: 81.7 fps
Intel Core Ultra 7 155H 3.8GHz
Arc 8-Core
min: 17.5 fps, P0.1: 19 fps, P1: 22.7 fps, max: 81.4 fps
Intel Core Ultra 7 155H 3.8GHz
Arc 8-Core
min: 4.73 fps, P0.1: 5.38 fps, P1: 9.3 fps, max: 86.6 fps

EA Sports FC 25
2024Intel Core Ultra 7 155H 3.8GHz
Arc 8-Core
min: 48.7 fps, P0.1: 51.3 fps, P1: 58.1 fps, max: 144.6 fps
Intel Core Ultra 7 155H 3.8GHz
Arc 8-Core
min: 29 fps, P0.1: 30.5 fps, P1: 42.9 fps, max: 104.3 fps
Intel Core Ultra 7 155H 3.8GHz
Arc 8-Core
min: 16.2 fps, P0.1: 19.2 fps, P1: 28.5 fps, max: 118.5 fps

God of War Ragnarök
2024Intel Core Ultra 7 155H 3.8GHz
Arc 8-Core
min: 7.47 fps, P0.1: 7.47 fps, P1: 7.7 fps, max: 13.6 fps
Intel Core Ultra 7 155H 3.8GHz
Arc 8-Core
min: 7.69 fps, P0.1: 7.76 fps, P1: 7.86 fps, max: 13.7 fps
Intel Core Ultra 7 155H 3.8GHz
Arc 8-Core
min: 7.34 fps, P0.1: 7.4 fps, P1: 7.53 fps, max: 13.8 fps

Final Fantasy XVI
2024Intel Core Ultra 7 155H 3.8GHz
Arc 8-Core
min: 12.9 fps, P0.1: 13 fps, P1: 14.2 fps, max: 45.6 fps
Intel Core Ultra 7 155H 3.8GHz
Arc 8-Core
min: 10.7 fps, P0.1: 11.2 fps, P1: 12.7 fps, max: 47.4 fps
Intel Core Ultra 7 155H 3.8GHz
Arc 8-Core
min: 11.2 fps, P0.1: 11.2 fps, P1: 11.6 fps, max: 53.4 fps

Space Marine 2
2024Intel Core Ultra 7 155H 3.8GHz
Arc 8-Core
min: 15.4 fps, P0.1: 15.8 fps, P1: 16.8 fps, max: 24 fps
Intel Core Ultra 7 155H 3.8GHz
Arc 8-Core
min: 8.23 fps, P0.1: 9.14 fps, P1: 13.3 fps, max: 20.5 fps
Intel Core Ultra 7 155H 3.8GHz
Arc 8-Core
min: 3.14 fps, P0.1: 4.43 fps, P1: 9.38 fps, max: 20.3 fps

Star Wars Outlaws
2024Intel Core Ultra 7 155H 3.8GHz
Arc 8-Core
min: 11.4 fps, P0.1: 12.7 fps, P1: 14.2 fps, max: 23.3 fps
Intel Core Ultra 7 155H 3.8GHz
Arc 8-Core
min: 8.96 fps, P0.1: 10.8 fps, P1: 12.9 fps, max: 22.1 fps
Intel Core Ultra 7 155H 3.8GHz
Arc 8-Core
min: 6.32 fps, P0.1: 6.68 fps, P1: 10.4 fps, max: 18.4 fps

Black Myth: Wukong
2024
Once Human
2024Intel Core Ultra 9 185H 3.8GHz
Arc 8-Core
min: 5.9 fps, P0.1: 19.5 fps, P1: 29.8 fps, max: 196.7 fps
Intel Core Ultra 7 155H 3.8GHz
Arc 8-Core
min: 25.7 fps, P0.1: 34.2 fps, P1: 37.6 fps, max: 173.5 fps
Intel Core Ultra 9 185H 3.8GHz
Arc 8-Core
min: 3.48 fps, P0.1: 5.18 fps, P1: 17.6 fps, max: 139.4 fps
Intel Core Ultra 7 155H 3.8GHz
Arc 8-Core
min: 6.13 fps, P0.1: 7.11 fps, P1: 19.7 fps, max: 149.5 fps
Intel Core Ultra 9 185H 3.8GHz
Arc 8-Core
min: 5.84 fps, P0.1: 6.71 fps, P1: 15 fps, max: 139.5 fps
Intel Core Ultra 7 155H 3.8GHz
Arc 8-Core
min: 9.48 fps, P0.1: 9.78 fps, P1: 17 fps, max: 138.8 fps
Intel Core Ultra 9 185H 3.8GHz
Arc 8-Core
min: 7.92 fps, P0.1: 10.1 fps, P1: 14 fps, max: 113.7 fps
Intel Core Ultra 7 155H 3.8GHz
Arc 8-Core
min: 3.07 fps, P0.1: 4.66 fps, P1: 6.22 fps, max: 166 fps

The First Descendant
2024Intel Core Ultra 9 185H 3.8GHz
Arc 8-Core
min: 32.5 fps, P0.1: 33 fps, P1: 34.9 fps, max: 52 fps
Intel Core Ultra 7 155H 3.8GHz
Arc 8-Core
min: 39.6 fps, P0.1: 41.2 fps, P1: 42.6 fps, max: 65.8 fps
Intel Core Ultra 9 185H 3.8GHz
Arc 8-Core
min: 11.5 fps, P0.1: 11.8 fps, P1: 15.6 fps, max: 163 fps
Intel Core Ultra 7 155H 3.8GHz
Arc 8-Core
min: 28.3 fps, P0.1: 28.3 fps, P1: 29.2 fps, max: 41.8 fps
Intel Core Ultra 9 185H 3.8GHz
Arc 8-Core
min: 5.02 fps, P0.1: 5.12 fps, P1: 6.5 fps, max: 155.4 fps
Intel Core Ultra 7 155H 3.8GHz
Arc 8-Core
min: 14.9 fps, P0.1: 17.6 fps, P1: 23.8 fps, max: 89 fps
Intel Core Ultra 9 185H 3.8GHz
Arc 8-Core
min: 4.95 fps, P0.1: 7.36 fps, P1: 16.1 fps, max: 124.1 fps
Intel Core Ultra 7 155H 3.8GHz
Arc 8-Core
min: 19.7 fps, P0.1: 19.8 fps, P1: 20.6 fps, max: 30 fps

F1 24
20241140008
Intel Core Ultra 7 155U 3.8GHz
Graphics 4-Core
min: 30 fps, P1: 29 fps, max: 42 fps
1131675
Intel Core Ultra 5 125U 3.6GHz
Graphics 4-Core
min: 29 fps, P1: 27 fps, max: 45 fps
1174923
Intel Core Ultra 5 125U 3.6GHz
Graphics 4-Core
min: 34 fps, P1: 31 fps, max: 47 fps
1131675
Intel Core Ultra 7 155H 3.8GHz
Arc 8-Core
min: 40 fps, P1: 38 fps, max: 79 fps
1149023
Intel Core Ultra 7 155H 3.8GHz
Arc 8-Core
min: 50 fps, P1: 48 fps, max: 77 fps
1174923
Intel Core Ultra 9 185H 3.8GHz
Arc 8-Core
min: 59 fps, P1: 46 fps, max: 83 fps
1149023
Intel Core Ultra 7 155H 3.8GHz
Arc 8-Core
min: 64 fps, P1: 61 fps, max: 85 fps
1162663
Intel Core Ultra 9 185H 3.8GHz
Arc 8-Core
min: 70 fps, P1: 66 fps, max: 97 fps
1140008
Intel Core Ultra 7 155U 3.8GHz
Graphics 4-Core
min: 27 fps, P1: 25 fps, max: 36 fps
1131675
Intel Core Ultra 5 125U 3.6GHz
Graphics 4-Core
min: 23 fps, P1: 24 fps, max: 39 fps
1174923
Intel Core Ultra 5 125U 3.6GHz
Graphics 4-Core
min: 31 fps, P1: 28 fps, max: 42 fps
1149023
Intel Core Ultra 7 155H 3.8GHz
Arc 8-Core
min: 34 fps, P1: 42 fps, max: 68 fps
1149023
Intel Core Ultra 7 155H 3.8GHz
Arc 8-Core
min: 2 fps, P1: 24 fps, max: 69 fps
1131675
Intel Core Ultra 7 155H 3.8GHz
Arc 8-Core
min: 36 fps, P1: 33 fps, max: 72 fps
1174923
Intel Core Ultra 9 185H 3.8GHz
Arc 8-Core
min: 52 fps, P1: 41 fps, max: 75 fps
1149023
Intel Core Ultra 7 155H 3.8GHz
Arc 8-Core
min: 52 fps, P1: 52 fps, max: 77 fps
1162663
Intel Core Ultra 9 185H 3.8GHz
Arc 8-Core
min: 61 fps, P1: 59 fps, max: 88 fps
1174923
Intel Core Ultra 5 125U 3.6GHz
Graphics 4-Core
min: 22 fps, P1: 20 fps, max: 31 fps
1131675
Intel Core Ultra 7 155H 3.8GHz
Arc 8-Core
min: 28 fps, P1: 26 fps, max: 52 fps
1149023
Intel Core Ultra 7 155H 3.8GHz
Arc 8-Core
min: 31 fps, P1: 31 fps, max: 52 fps
1174923
Intel Core Ultra 9 185H 3.8GHz
Arc 8-Core
min: 40 fps, P1: 36 fps, max: 56 fps
1149023
Intel Core Ultra 7 155H 3.8GHz
Arc 8-Core
min: 41 fps, P1: 39 fps, max: 56 fps
1162663
Intel Core Ultra 9 185H 3.8GHz
Arc 8-Core
min: 43 fps, P1: 45 fps, max: 64 fps
1174923
Intel Core Ultra 5 125U 3.6GHz
Graphics 4-Core
min: 5 fps, P1: 5 fps, max: 9 fps

Intel Core Ultra 7 155H 3.8GHz
Arc 8-Core
min: 14.3 fps, P0.1: 14.4 fps, P1: 15.5 fps, max: 24.4 fps
Intel Core Ultra 7 155H 3.8GHz
Arc 8-Core
min: 11.5 fps, P0.1: 11.8 fps, P1: 13.1 fps, max: 20.8 fps

Ghost of Tsushima
2024Intel Core Ultra 7 155H 3.8GHz
Arc 8-Core
min: 26.7 fps, P0.1: 26.8 fps, P1: 28.7 fps, max: 43.8 fps
Intel Core Ultra 7 155H 3.8GHz
Arc 8-Core
min: 22.5 fps, P0.1: 23.3 fps, P1: 24.1 fps, max: 35.6 fps
Intel Core Ultra 7 155H 3.8GHz
Arc 8-Core
min: 20.9 fps, P0.1: 20.9 fps, P1: 21.9 fps, max: 31 fps

Dragon's Dogma 2
2024
Intel Core Ultra 7 155H 3.8GHz
Arc 8-Core
Problem during benchmarking occured: Spiel startete nicht
Intel Core Ultra 7 155H 3.8GHz
Arc 8-Core
min: 24 fps, P0.1: 24 fps, P1: 24.5 fps, max: 44.3 fps
Intel Core Ultra 7 155H 3.8GHz
Arc 8-Core
min: 20.1 fps, P0.1: 20.3 fps, P1: 21.6 fps, max: 41.7 fps
Intel Core Ultra 7 155H 3.8GHz
Arc 8-Core
min: 13.2 fps, P0.1: 13.4 fps, P1: 14.9 fps, max: 23.3 fps

Alone in the Dark
2024
Last Epoch
2024Intel Core Ultra 7 155H 3.8GHz
Arc 8-Core
min: 14.5 fps, P0.1: 37.2 fps, P1: 38.5 fps, max: 92.5 fps
Intel Core Ultra 7 155H 3.8GHz
Arc 8-Core
min: 15.2 fps, P0.1: 19 fps, P1: 60 fps, max: 193 fps
Intel Core Ultra 7 155H 3.8GHz
Arc 8-Core
min: 13.6 fps, P0.1: 30.9 fps, P1: 33.7 fps, max: 100.7 fps
Intel Core Ultra 7 155H 3.8GHz
Arc 8-Core
min: 15.7 fps, P0.1: 30 fps, P1: 39.1 fps, max: 149.5 fps
Intel Core Ultra 7 155H 3.8GHz
Arc 8-Core
min: 10.5 fps, P0.1: 22.8 fps, P1: 29.4 fps, max: 108.3 fps
Intel Core Ultra 7 155H 3.8GHz
Arc 8-Core
min: 16 fps, P0.1: 33.4 fps, P1: 44.8 fps, max: 150.8 fps
Intel Core Ultra 7 155H 3.8GHz
Arc 8-Core
min: 13.3 fps, P0.1: 18.8 fps, P1: 24.3 fps, max: 102.3 fps
Intel Core Ultra 7 155H 3.8GHz
Arc 8-Core
min: 15.7 fps, P0.1: 24.8 fps, P1: 34.7 fps, max: 169.4 fps

Skull & Bones
2024
Helldivers 2
2024Intel Core Ultra 7 155H 3.8GHz
Arc 8-Core
min: 22 fps, P0.1: 22.4 fps, P1: 32.7 fps, max: 79.6 fps
Intel Core Ultra 7 155H 3.8GHz
Arc 8-Core
min: 25.2 fps, P0.1: 25.3 fps, P1: 27.8 fps, max: 35.1 fps
Intel Core Ultra 7 155H 3.8GHz
Arc 8-Core
min: 22.6 fps, P0.1: 23.1 fps, P1: 25.5 fps, max: 33 fps
Intel Core Ultra 7 155H 3.8GHz
Arc 8-Core
min: 22.2 fps, P0.1: 22.4 fps, P1: 22.9 fps, max: 35.4 fps

Enshrouded
2024Intel Core Ultra 7 155H 3.8GHz
Arc 8-Core
min: 7.68 fps, P0.1: 7.98 fps, P1: 9.37 fps, max: 357 fps
Intel Core Ultra 7 155H 3.8GHz
Arc 8-Core
min: 6.26 fps, P0.1: 6.38 fps, P1: 8.24 fps, max: 276 fps
Intel Core Ultra 7 155H 3.8GHz
Arc 8-Core
min: 4.99 fps, P0.1: 5.11 fps, P1: 5.45 fps, max: 34014 fps
Intel Core Ultra 7 155H 3.8GHz
Arc 8-Core
Problem during benchmarking occured: Spiel startete nicht crash

Palworld
2024Intel Core Ultra 7 155H 3.8GHz
Arc 8-Core
min: 9.67 fps, P0.1: 14.9 fps, P1: 29.5 fps, max: 82.9 fps
Intel Core Ultra 7 155H 3.8GHz
Arc 8-Core
min: 6.65 fps, P0.1: 12.5 fps, P1: 27.1 fps, max: 93.1 fps
Intel Core Ultra 7 155H 3.8GHz
Arc 8-Core
min: 16.1 fps, P0.1: 17.2 fps, P1: 21.8 fps, max: 82.5 fps
Intel Core Ultra 7 155H 3.8GHz
Arc 8-Core
min: 11.7 fps, P0.1: 13 fps, P1: 17.1 fps, max: 84 fps

Intel Core Ultra 9 185H 3.8GHz
Arc 8-Core
min: 12 fps, P0.1: 63.1 fps, P1: 101 fps, max: 349 fps
Intel Core Ultra 7 155H 3.8GHz
Arc 8-Core
min: 19.6 fps, P0.1: 45.2 fps, P1: 128.5 fps, max: 834 fps
Intel Core Ultra 7 155H 3.8GHz
Arc 8-Core
min: 18 fps, P0.1: 45.6 fps, P1: 119 fps, max: 450 fps
Intel Core Ultra 9 185H 3.8GHz
Arc 8-Core
min: 12.6 fps, P0.1: 32.5 fps, P1: 79.6 fps, max: 693 fps
Intel Core Ultra 7 155H 3.8GHz
Arc 8-Core
min: 17.2 fps, P0.1: 40.4 fps, P1: 90.9 fps, max: 415 fps
Intel Core Ultra 7 155H 3.8GHz
Arc 8-Core
min: 15.7 fps, P0.1: 57 fps, P1: 95.6 fps, max: 353 fps
Intel Core Ultra 9 185H 3.8GHz
Arc 8-Core
min: 10.4 fps, P0.1: 35.2 fps, P1: 76 fps, max: 283 fps
Intel Core Ultra 7 155H 3.8GHz
Arc 8-Core
min: 18 fps, P0.1: 32.4 fps, P1: 93.7 fps, max: 461 fps
Intel Core Ultra 7 155H 3.8GHz
Arc 8-Core
min: 16.9 fps, P0.1: 55.2 fps, P1: 87.9 fps, max: 344 fps

Ready or Not
2023Intel Core Ultra 7 155H 3.8GHz
Arc 8-Core
min: 10.8 fps, P0.1: 14.1 fps, P1: 23.9 fps, max: 339 fps
Intel Core Ultra 7 155H 3.8GHz
Arc 8-Core
min: 14.1 fps, P0.1: 20.8 fps, P1: 26.6 fps, max: 231 fps
Intel Core Ultra 7 155H 3.8GHz
Arc 8-Core
min: 19.7 fps, P0.1: 24.8 fps, P1: 26 fps, max: 223 fps
Intel Core Ultra 7 155H 3.8GHz
Arc 8-Core
min: 13.7 fps, P0.1: 14.9 fps, P1: 17.7 fps, max: 183.6 fps

The Finals
2023Intel Core Ultra 7 155H 3.8GHz
Arc 8-Core
min: 5.36 fps, P0.1: 51.2 fps, P1: 70.6 fps, max: 201 fps
Intel Core Ultra 7 155H 3.8GHz
Arc 8-Core
min: 16.2 fps, P0.1: 45.5 fps, P1: 48.6 fps, max: 113.2 fps
Intel Core Ultra 7 155H 3.8GHz
Arc 8-Core
min: 13.1 fps, P0.1: 19.8 fps, P1: 44.2 fps, max: 139.1 fps
Intel Core Ultra 7 155H 3.8GHz
Arc 8-Core
min: 4.45 fps, P0.1: 16.4 fps, P1: 32.9 fps, max: 118 fps


EA Sports WRC
2023
Lords of the Fallen
2023Intel Core Ultra 7 155H 3.8GHz
Arc 8-Core
min: 3.21 fps, P0.1: 3.22 fps, P1: 5.34 fps, max: 115.4 fps
Intel Core Ultra 7 155H 3.8GHz
Arc 8-Core
min: 1.669 fps, P0.1: 1.856 fps, P1: 3.84 fps, max: 96.1 fps
Intel Core Ultra 7 155H 3.8GHz
Arc 8-Core
min: 1.033 fps, P0.1: 1.329 fps, P1: 2.54 fps, max: 79.3 fps
Intel Core Ultra 7 155H 3.8GHz
Arc 8-Core
min: 2.43 fps, P0.1: 2.47 fps, P1: 4.27 fps, max: 65.1 fps

Total War Pharaoh
2023

Counter-Strike 2
2023Intel Core Ultra 7 155H 3.8GHz
Arc 8-Core
min: 35.6 fps, P0.1: 43.3 fps, P1: 56.7 fps, max: 308 fps
Intel Core Ultra 7 155H 3.8GHz
Arc 8-Core
min: 32.6 fps, P0.1: 33.6 fps, P1: 56.3 fps, max: 237 fps
Intel Core Ultra 7 155H 3.8GHz
Arc 8-Core
min: 17.6 fps, P0.1: 18.5 fps, P1: 35.6 fps, max: 123.8 fps
Intel Core Ultra 7 155H 3.8GHz
Arc 8-Core
min: 8.63 fps, P0.1: 10.9 fps, P1: 24.2 fps, max: 64.8 fps

2.12
Intel Core Ultra 7 155U 3.8GHz
Graphics 4-Core
min: 13.3 fps, max: 26.2 fps
2.12
Intel Core Ultra 5 134U 3.6GHz
Graphics 4-Core
min: 14.8 fps, max: 20.8 fps
2.12
Intel Core Ultra 7 165U 3.8GHz
Graphics 4-Core
min: 14.2 fps, max: 21.6 fps
2.12
Intel Core Ultra 7 164U 3.8GHz
Graphics 4-Core
min: 12.9 fps, max: 27.1 fps
2.12
Intel Core Ultra 5 135U 3.6GHz
Graphics 4-Core
min: 13.6 fps, max: 30.1 fps
2.02
Intel Core Ultra 5 125U 3.6GHz
Graphics 4-Core
min: 6.99 fps, max: 32.4 fps
2.12
Intel Core Ultra 5 125U 3.6GHz
Graphics 4-Core
min: 16.1 fps, max: 21.9 fps
2.12
Intel Core Ultra 5 125U 3.6GHz
Graphics 4-Core
min: 10.8 fps, max: 30.3 fps
2.12
Intel Core Ultra 5 125U 3.6GHz
Graphics 4-Core
min: 16.1 fps, max: 23.4 fps
2.11
Intel Core Ultra 7 165U 3.8GHz
Graphics 4-Core
min: 13.3 fps, max: 34.3 fps
2.12
Intel Core Ultra 5 125U 3.6GHz
Graphics 4-Core
min: 12.9 fps, max: 28.6 fps
2.12
Intel Core Ultra 5 125U 3.6GHz
Graphics 4-Core
min: 14.8 fps, max: 31.6 fps
2.02
Intel Core Ultra 7 165U 3.8GHz
Graphics 4-Core
min: 12.7 fps, max: 26.1 fps
2.12
Intel Core Ultra 7 155U 3.8GHz
Graphics 4-Core
min: 17.5 fps, max: 24 fps
2.02
Intel Core Ultra 5 125U 3.6GHz
Graphics 4-Core
min: 8.34 fps, max: 34.5 fps
2.02
Intel Core Ultra 7 155U 3.8GHz
Graphics 4-Core
min: 16.7 fps, max: 28.2 fps
2.01
Intel Core Ultra 7 155H 3.8GHz
Arc 8-Core
min: 0.4882 fps, max: 68 fps
2.11
Intel Core Ultra 7 155H 3.8GHz
Arc 8-Core
min: 7.58 fps, max: 38.3 fps
2.01
Intel Core Ultra 7 155H 3.8GHz
Arc 8-Core
min: 4.25 fps, max: 79.7 fps
2.01
Intel Core Ultra 7 155H 3.8GHz
Arc 8-Core
min: 4.15 fps, max: 68.2 fps
2.12
Intel Core Ultra 7 155H 3.8GHz
Arc 8-Core
min: 16.6 fps, max: 37.5 fps
2.11
Intel Core Ultra 7 155H 3.8GHz
Arc 8-Core
min: 20.7 fps, max: 36.5 fps
2.01
Intel Core Ultra 7 155H 3.8GHz
Arc 8-Core
min: 9.02 fps, max: 50.4 fps
2.12
Intel Core Ultra 7 155H 3.8GHz
Arc 8-Core
min: 24.3 fps, max: 34.7 fps
2.12
Intel Core Ultra 7 155H 3.8GHz
Arc 8-Core
min: 25.1 fps, max: 34.6 fps
2.1
Intel Core Ultra 7 155H 3.8GHz
Arc 8-Core
min: 3.56 fps, max: 49.1 fps
2.12
Intel Core Ultra 7 155H 3.8GHz
Arc 8-Core
min: 25.4 fps, max: 40.9 fps
2.02
Intel Core Ultra 7 155H 3.8GHz
Arc 8-Core
min: 4.72 fps, max: 64.2 fps
2.12
Intel Core Ultra 7 165H 3.8GHz
Arc 8-Core
min: 26.7 fps, max: 37.1 fps
2.02
Intel Core Ultra 7 155H 3.8GHz
Arc 8-Core
min: 25.5 fps, max: 44.6 fps
2.12
Intel Core Ultra 7 155H 3.8GHz
Arc 8-Core
min: 28.1 fps, max: 37.5 fps
2.02
Intel Core Ultra 7 155H 3.8GHz
Arc 8-Core
min: 5.77 fps, max: 72.5 fps
2.02
Intel Core Ultra 7 155H 3.8GHz
Arc 8-Core
min: 19.6 fps, max: 56.4 fps
2.01
Intel Core Ultra 7 155H 3.8GHz
Arc 8-Core
min: 4.7 fps, max: 93.7 fps
2.11
Intel Core Ultra 9 185H 3.8GHz
Arc 8-Core
min: 29.1 fps, max: 40.2 fps
2.12
Intel Core Ultra 7 155H 3.8GHz
Arc 8-Core
min: 29.3 fps, max: 40.1 fps
2.11
Intel Core Ultra 7 155H 3.8GHz
Arc 8-Core
min: 25.8 fps, max: 45.8 fps
2.02
Intel Core Ultra 7 155H 3.8GHz
Arc 8-Core
min: 18.6 fps, max: 54.4 fps
2.11
Intel Core Ultra 9 185H 3.8GHz
Arc 8-Core
min: 31 fps, max: 43.2 fps
2.12
Intel Core Ultra 7 155H 3.8GHz
Arc 8-Core
min: 31.2 fps, max: 42.8 fps
2.11
Intel Core Ultra 7 155H 3.8GHz
Arc 8-Core
min: 31.4 fps, max: 46.8 fps
2.12
Intel Core Ultra 7 155H 3.8GHz
Arc 8-Core
min: 32.7 fps, max: 44.1 fps
2.12
Intel Core Ultra 5 134U 3.6GHz
Graphics 4-Core
min: 11.2 fps, max: 15.7 fps
2.12
Intel Core Ultra 5 135U 3.6GHz
Graphics 4-Core
min: 11.9 fps, max: 19.6 fps
2.12
Intel Core Ultra 7 165U 3.8GHz
Graphics 4-Core
min: 11.9 fps, max: 16.9 fps
2.12
Intel Core Ultra 7 155U 3.8GHz
Graphics 4-Core
min: 12.4 fps, max: 17.8 fps
2.02
Intel Core Ultra 5 125U 3.6GHz
Graphics 4-Core
min: 6.99 fps, max: 20.5 fps
2.12
Intel Core Ultra 7 164U 3.8GHz
Graphics 4-Core
min: 11.9 fps, max: 21.2 fps
2.12
Intel Core Ultra 5 125U 3.6GHz
Graphics 4-Core
min: 13.2 fps, max: 17.3 fps
2.12
Intel Core Ultra 5 125U 3.6GHz
Graphics 4-Core
min: 12.9 fps, max: 19.7 fps
2.11
Intel Core Ultra 7 165U 3.8GHz
Graphics 4-Core
min: 10.9 fps, max: 27.4 fps
2.12
Intel Core Ultra 5 125U 3.6GHz
Graphics 4-Core
min: 13.8 fps, max: 21.5 fps
2.12
Intel Core Ultra 5 125U 3.6GHz
Graphics 4-Core
min: 12 fps, max: 27.4 fps
2.12
Intel Core Ultra 5 125U 3.6GHz
Graphics 4-Core
min: 14.3 fps, max: 21.7 fps
2.12
Intel Core Ultra 7 155U 3.8GHz
Graphics 4-Core
min: 14.4 fps, max: 19.2 fps
2.02
Intel Core Ultra 7 165U 3.8GHz
Graphics 4-Core
min: 12.8 fps, max: 20.8 fps
2.02
Intel Core Ultra 5 125U 3.6GHz
Graphics 4-Core
min: 7.96 fps, max: 29 fps
2.02
Intel Core Ultra 7 155U 3.8GHz
Graphics 4-Core
min: 14.4 fps, max: 22.1 fps
2.01
Intel Core Ultra 7 155H 3.8GHz
Arc 8-Core
min: 2.93 fps, max: 40.9 fps
2.11
Intel Core Ultra 7 155H 3.8GHz
Arc 8-Core
min: 7.08 fps, max: 34.1 fps
2.12
Intel Core Ultra 7 155H 3.8GHz
Arc 8-Core
min: 21.2 fps, max: 28 fps
2.1
Intel Core Ultra 7 155H 3.8GHz
Arc 8-Core
min: 9.84 fps, max: 41.4 fps
2.12
Intel Core Ultra 7 155H 3.8GHz
Arc 8-Core
min: 21.5 fps, max: 29.2 fps
2.11
Intel Core Ultra 7 155H 3.8GHz
Arc 8-Core
min: 20.9 fps, max: 31.1 fps
2.12
Intel Core Ultra 7 165H 3.8GHz
Arc 8-Core
min: 22.2 fps, max: 30 fps
2.02
Intel Core Ultra 7 155H 3.8GHz
Arc 8-Core
min: 3.29 fps, max: 56.6 fps
2.02
Intel Core Ultra 7 155H 3.8GHz
Arc 8-Core
min: 7.82 fps, max: 52.8 fps
2.12
Intel Core Ultra 7 155H 3.8GHz
Arc 8-Core
min: 20.8 fps, max: 35.7 fps
2.02
Intel Core Ultra 7 155H 3.8GHz
Arc 8-Core
min: 21.6 fps, max: 33.6 fps
2.12
Intel Core Ultra 7 155H 3.8GHz
Arc 8-Core
min: 23.7 fps, max: 30.8 fps
2.02
Intel Core Ultra 7 155H 3.8GHz
Arc 8-Core
min: 20.8 fps, max: 34.3 fps
2.12
Intel Core Ultra 7 155H 3.8GHz
Arc 8-Core
min: 24.1 fps, max: 32 fps
2.11
Intel Core Ultra 9 185H 3.8GHz
Arc 8-Core
min: 24.4 fps, max: 32.5 fps
2.11
Intel Core Ultra 7 155H 3.8GHz
Arc 8-Core
min: 19.3 fps, max: 43.6 fps
2.02
Intel Core Ultra 7 155H 3.8GHz
Arc 8-Core
min: 16.9 fps, max: 55.1 fps
2.11
Intel Core Ultra 7 155H 3.8GHz
Arc 8-Core
min: 22.4 fps, max: 40.3 fps
2.01
Intel Core Ultra 7 155H 3.8GHz
Arc 8-Core
min: 22.6 fps, max: 42.8 fps
2.11
Intel Core Ultra 9 185H 3.8GHz
Arc 8-Core
min: 25.8 fps, max: 35.6 fps
2.12
Intel Core Ultra 7 155H 3.8GHz
Arc 8-Core
min: 27.1 fps, max: 35.8 fps
2.12
Intel Core Ultra 7 155H 3.8GHz
Arc 8-Core
min: 27.7 fps, max: 36.2 fps
2.12
Intel Core Ultra 5 135U 3.6GHz
Graphics 4-Core
min: 10 fps, max: 19.5 fps
2.12
Intel Core Ultra 7 155U 3.8GHz
Graphics 4-Core
min: 10.2 fps, max: 16 fps
2.12
Intel Core Ultra 5 134U 3.6GHz
Graphics 4-Core
min: 10.6 fps, max: 14.6 fps
2.02
Intel Core Ultra 5 125U 3.6GHz
Graphics 4-Core
min: 6.86 fps, max: 20.8 fps
2.12
Intel Core Ultra 7 165U 3.8GHz
Graphics 4-Core
min: 10.3 fps, max: 15.4 fps
2.12
Intel Core Ultra 5 125U 3.6GHz
Graphics 4-Core
min: 10.7 fps, max: 14.7 fps
2.11
Intel Core Ultra 7 165U 3.8GHz
Graphics 4-Core
min: 8.99 fps, max: 21.5 fps
2.12
Intel Core Ultra 5 125U 3.6GHz
Graphics 4-Core
min: 11 fps, max: 18.6 fps
2.12
Intel Core Ultra 7 164U 3.8GHz
Graphics 4-Core
min: 9.43 fps, max: 18.2 fps
2.12
Intel Core Ultra 5 125U 3.6GHz
Graphics 4-Core
min: 10.4 fps, max: 16.6 fps
2.12
Intel Core Ultra 5 125U 3.6GHz
Graphics 4-Core
min: 9.4 fps, max: 25 fps
2.12
Intel Core Ultra 5 125U 3.6GHz
Graphics 4-Core
min: 11.7 fps, max: 21.4 fps
2.12
Intel Core Ultra 7 155U 3.8GHz
Graphics 4-Core
min: 12.1 fps, max: 17 fps
2.02
Intel Core Ultra 5 125U 3.6GHz
Graphics 4-Core
min: 3.34 fps, max: 25.6 fps
2.02
Intel Core Ultra 7 165U 3.8GHz
Graphics 4-Core
min: 10.7 fps, max: 18.9 fps
2.02
Intel Core Ultra 7 155U 3.8GHz
Graphics 4-Core
min: 12.1 fps, max: 19.5 fps
2.01
Intel Core Ultra 7 155H 3.8GHz
Arc 8-Core
min: 1.279 fps, max: 41.1 fps
2.12
Intel Core Ultra 7 155H 3.8GHz
Arc 8-Core
min: 11.6 fps, max: 22.8 fps
2.11
Intel Core Ultra 7 155H 3.8GHz
Arc 8-Core
min: 7.75 fps, max: 28.6 fps
2.01
Intel Core Ultra 7 155H 3.8GHz
Arc 8-Core
min: 2.92 fps, max: 42 fps
2.12
Intel Core Ultra 7 155H 3.8GHz
Arc 8-Core
min: 18.5 fps, max: 25.5 fps
2.12
Intel Core Ultra 7 155H 3.8GHz
Arc 8-Core
min: 16.8 fps, max: 33.8 fps
2.12
Intel Core Ultra 7 155H 3.8GHz
Arc 8-Core
min: 18.9 fps, max: 26.5 fps
2.02
Intel Core Ultra 7 155H 3.8GHz
Arc 8-Core
min: 14.4 fps, max: 29.7 fps
2.11
Intel Core Ultra 7 155H 3.8GHz
Arc 8-Core
min: 19.1 fps, max: 28.6 fps
2.02
Intel Core Ultra 7 155H 3.8GHz
Arc 8-Core
min: 6.02 fps, max: 57.9 fps
2.1
Intel Core Ultra 7 155H 3.8GHz
Arc 8-Core
min: 7 fps, max: 40.8 fps
2.02
Intel Core Ultra 7 155H 3.8GHz
Arc 8-Core
min: 1.957 fps, max: 40.6 fps
2.12
Intel Core Ultra 7 155H 3.8GHz
Arc 8-Core
min: 19.7 fps, max: 26.9 fps
2.02
Intel Core Ultra 7 155H 3.8GHz
Arc 8-Core
min: 16.3 fps, max: 29.9 fps
2.12
Intel Core Ultra 7 155H 3.8GHz
Arc 8-Core
min: 20.1 fps, max: 27.3 fps
2.12
Intel Core Ultra 7 165H 3.8GHz
Arc 8-Core
min: 20.8 fps, max: 28 fps
2.11
Intel Core Ultra 9 185H 3.8GHz
Arc 8-Core
min: 20.6 fps, max: 28.4 fps
2.11
Intel Core Ultra 7 155H 3.8GHz
Arc 8-Core
min: 18.3 fps, max: 39.1 fps
2.11
Intel Core Ultra 7 155H 3.8GHz
Arc 8-Core
min: 16.7 fps, max: 39 fps
2.02
Intel Core Ultra 7 155H 3.8GHz
Arc 8-Core
min: 11.7 fps, max: 43 fps
2.12
Intel Core Ultra 7 155H 3.8GHz
Arc 8-Core
min: 22.8 fps, max: 30.7 fps
2.12
Intel Core Ultra 7 155H 3.8GHz
Arc 8-Core
min: 22.9 fps, max: 32 fps
2.11
Intel Core Ultra 9 185H 3.8GHz
Arc 8-Core
min: 23.8 fps, max: 32.8 fps
2.12
Intel Core Ultra 5 135U 3.6GHz
Graphics 4-Core
min: 8.89 fps, max: 15 fps
2.12
Intel Core Ultra 7 155U 3.8GHz
Graphics 4-Core
min: 8.91 fps, max: 14.5 fps
2.12
Intel Core Ultra 7 165U 3.8GHz
Graphics 4-Core
min: 8.84 fps, max: 13.5 fps
2.11
Intel Core Ultra 7 165U 3.8GHz
Graphics 4-Core
min: 8.83 fps, max: 17.2 fps
2.12
Intel Core Ultra 5 134U 3.6GHz
Graphics 4-Core
min: 9.23 fps, max: 13.5 fps
2.02
Intel Core Ultra 5 125U 3.6GHz
Graphics 4-Core
min: 3.55 fps, max: 25.9 fps
2.12
Intel Core Ultra 5 125U 3.6GHz
Graphics 4-Core
min: 9.58 fps, max: 13.5 fps
2.12
Intel Core Ultra 5 125U 3.6GHz
Graphics 4-Core
min: 9.07 fps, max: 15.2 fps
2.12
Intel Core Ultra 7 164U 3.8GHz
Graphics 4-Core
min: 8.63 fps, max: 16.9 fps
2.12
Intel Core Ultra 5 125U 3.6GHz
Graphics 4-Core
min: 10.1 fps, max: 16.1 fps
2.12
Intel Core Ultra 5 125U 3.6GHz
Graphics 4-Core
min: 8.61 fps, max: 21.2 fps
2.12
Intel Core Ultra 5 125U 3.6GHz
Graphics 4-Core
min: 10.4 fps, max: 18.1 fps
2.02
Intel Core Ultra 5 125U 3.6GHz
Graphics 4-Core
min: 2.72 fps, max: 28.9 fps
2.12
Intel Core Ultra 7 155U 3.8GHz
Graphics 4-Core
min: 10.8 fps, max: 15.4 fps
2.02
Intel Core Ultra 7 165U 3.8GHz
Graphics 4-Core
min: 9.58 fps, max: 17.5 fps
2.02
Intel Core Ultra 7 155U 3.8GHz
Graphics 4-Core
min: 10.4 fps, max: 18 fps
2.11
Intel Core Ultra 7 155H 3.8GHz
Arc 8-Core
min: 5.67 fps, max: 26.5 fps
2.12
Intel Core Ultra 7 155H 3.8GHz
Arc 8-Core
min: 14.5 fps, max: 23.3 fps
2.12
Intel Core Ultra 7 155H 3.8GHz
Arc 8-Core
min: 15.9 fps, max: 24.7 fps
2.02
Intel Core Ultra 7 155H 3.8GHz
Arc 8-Core
min: 2.4 fps, max: 46.9 fps
2.02
Intel Core Ultra 7 155H 3.8GHz
Arc 8-Core
min: 4.09 fps, max: 46 fps
2.1
Intel Core Ultra 7 155H 3.8GHz
Arc 8-Core
min: 5.77 fps, max: 46 fps
2.11
Intel Core Ultra 7 155H 3.8GHz
Arc 8-Core
min: 15.8 fps, max: 26.6 fps
2.12
Intel Core Ultra 7 155H 3.8GHz
Arc 8-Core
min: 17.8 fps, max: 25.5 fps
2.12
Intel Core Ultra 7 155H 3.8GHz
Arc 8-Core
min: 17.4 fps, max: 25.5 fps
2.11
Intel Core Ultra 7 155H 3.8GHz
Arc 8-Core
min: 12.2 fps, max: 34.1 fps
2.11
Intel Core Ultra 9 185H 3.8GHz
Arc 8-Core
min: 17.8 fps, max: 26.5 fps
2.12
Intel Core Ultra 7 165H 3.8GHz
Arc 8-Core
min: 18.5 fps, max: 25.8 fps
2.11
Intel Core Ultra 7 155H 3.8GHz
Arc 8-Core
min: 14 fps, max: 36.2 fps
2.02
Intel Core Ultra 7 155H 3.8GHz
Arc 8-Core
min: 15.8 fps, max: 29.9 fps
2.02
Intel Core Ultra 7 155H 3.8GHz
Arc 8-Core
min: 7.2 fps, max: 42.9 fps
2.12
Intel Core Ultra 7 155H 3.8GHz
Arc 8-Core
min: 20.1 fps, max: 29.4 fps
2.12
Intel Core Ultra 7 155H 3.8GHz
Arc 8-Core
min: 20.3 fps, max: 29.4 fps
2.11
Intel Core Ultra 9 185H 3.8GHz
Arc 8-Core
min: 21 fps, max: 30.3 fps
2.01
Intel Core Ultra 7 155H 3.8GHz
Arc 8-Core
min: 10.8 fps, max: 17.2 fps

Baldur's Gate 3
2023Intel Core Ultra 5 125U 3.6GHz
Graphics 4-Core
min: 13.8 fps, P0.1: 13.8 fps, P1: 14 fps, max: 27.5 fps
Intel Core Ultra 7 155U 3.8GHz
Graphics 4-Core
min: 13.8 fps, P0.1: 14 fps, P1: 15.3 fps, max: 30.5 fps
Intel Core Ultra 7 165U 3.8GHz
Graphics 4-Core
min: 16.9 fps, P0.1: 17 fps, P1: 18.9 fps, max: 30.1 fps
Intel Core Ultra 5 125U 3.6GHz
Graphics 4-Core
min: 9.66 fps, P0.1: 10.5 fps, P1: 16.1 fps, max: 1599 fps
Intel Core Ultra 7 155H 3.8GHz
Arc 8-Core
min: 10.7 fps, P0.1: 10.8 fps, P1: 12 fps, max: 4873 fps
Intel Core Ultra 7 155H 3.8GHz
Arc 8-Core
min: 20.4 fps, P0.1: 20.8 fps, P1: 22.7 fps, max: 74 fps
Vulkan
Intel Core Ultra 7 155H 3.8GHz
Arc 8-Core
P0.1: 23.4 fpsP1: 28.3 fps
Intel Core Ultra 9 185H 3.8GHz
Arc 8-Core
min: 22.7 fps, P0.1: 23.2 fps, P1: 26.9 fps, max: 91.7 fps
Intel Core Ultra 9 185H 3.8GHz
Arc 8-Core
min: 24.3 fps, P0.1: 25.4 fps, P1: 28 fps, max: 90.7 fps
Intel Core Ultra 5 125U 3.6GHz
Graphics 4-Core
min: 6.17 fps, P0.1: 6.9 fps, P1: 9.5 fps, max: 48.1 fps
Intel Core Ultra 7 155U 3.8GHz
Graphics 4-Core
min: 6.37 fps, P0.1: 7.21 fps, P1: 11.2 fps, max: 82.3 fps
Intel Core Ultra 7 165U 3.8GHz
Graphics 4-Core
min: 12.9 fps, P0.1: 13 fps, P1: 13.3 fps, max: 22.1 fps
Intel Core Ultra 5 125U 3.6GHz
Graphics 4-Core
min: 12.1 fps, P0.1: 12.4 fps, P1: 14.3 fps, max: 34 fps
Intel Core Ultra 7 155H 3.8GHz
Arc 8-Core
min: 9.75 fps, P0.1: 9.82 fps, P1: 10.2 fps, max: 86 fps
Intel Core Ultra 7 155H 3.8GHz
Arc 8-Core
min: 9.42 fps, P0.1: 11.3 fps, P1: 16.1 fps, max: 62.4 fps
Vulkan
Intel Core Ultra 7 155H 3.8GHz
Arc 8-Core
P0.1: 5.2 fpsP1: 13 fps
Intel Core Ultra 9 185H 3.8GHz
Arc 8-Core
min: 17.5 fps, P0.1: 18.4 fps, P1: 19.7 fps, max: 65.1 fps
Intel Core Ultra 9 185H 3.8GHz
Arc 8-Core
min: 18.1 fps, P0.1: 18.2 fps, P1: 20.2 fps, max: 85.2 fps
Intel Core Ultra 5 125U 3.6GHz
Graphics 4-Core
min: 8.91 fps, P0.1: 8.98 fps, P1: 9.12 fps, max: 13.2 fps
Intel Core Ultra 7 155U 3.8GHz
Graphics 4-Core
min: 9.11 fps, P0.1: 9.4 fps, P1: 10.2 fps, max: 17.5 fps
Intel Core Ultra 7 165U 3.8GHz
Graphics 4-Core
min: 10.7 fps, P0.1: 10.9 fps, P1: 12 fps, max: 18.9 fps
Intel Core Ultra 5 125U 3.6GHz
Graphics 4-Core
min: 10.8 fps, P0.1: 11 fps, P1: 12.6 fps, max: 28.4 fps
Intel Core Ultra 7 155H 3.8GHz
Arc 8-Core
min: 9 fps, P0.1: 9.09 fps, P1: 9.42 fps, max: 49.1 fps
Intel Core Ultra 7 155H 3.8GHz
Arc 8-Core
min: 11.7 fps, P0.1: 12.4 fps, P1: 13.9 fps, max: 71.5 fps
Intel Core Ultra 9 185H 3.8GHz
Arc 8-Core
min: 14.5 fps, P0.1: 14.6 fps, P1: 16.2 fps, max: 88.3 fps
Intel Core Ultra 9 185H 3.8GHz
Arc 8-Core
min: 13.9 fps, P0.1: 14.3 fps, P1: 16.3 fps, max: 94.2 fps
Vulkan
Intel Core Ultra 7 155H 3.8GHz
Arc 8-Core
P0.1: 6.8 fpsP1: 20.3 fps
Intel Core Ultra 7 155U 3.8GHz
Graphics 4-Core
min: 7.26 fps, P0.1: 7.77 fps, P1: 10.2 fps, max: 29.3 fps
Intel Core Ultra 7 165U 3.8GHz
Graphics 4-Core
min: 11.2 fps, P0.1: 11.4 fps, P1: 12 fps, max: 20.5 fps
Intel Core Ultra 5 125U 3.6GHz
Graphics 4-Core
min: 10.1 fps, P0.1: 10.2 fps, P1: 11.7 fps, max: 27.6 fps
Intel Core Ultra 7 155H 3.8GHz
Arc 8-Core
min: 8.76 fps, P0.1: 8.87 fps, P1: 9.07 fps, max: 41.8 fps
Intel Core Ultra 7 155H 3.8GHz
Arc 8-Core
min: 12.8 fps, P0.1: 12.9 fps, P1: 13.6 fps, max: 66.3 fps
Vulkan
Intel Core Ultra 7 155H 3.8GHz
Arc 8-Core
P0.1: 7.7 fpsP1: 17.7 fps
Intel Core Ultra 9 185H 3.8GHz
Arc 8-Core
min: 8.14 fps, P0.1: 11.8 fps, P1: 15.7 fps, max: 98.9 fps
Intel Core Ultra 9 185H 3.8GHz
Arc 8-Core
min: 11.9 fps, P0.1: 13 fps, P1: 16.6 fps, max: 75.3 fps
Intel Core Ultra 7 155H 3.8GHz
Arc 8-Core
min: 6.81 fps, P0.1: 6.87 fps, P1: 7.21 fps, max: 22 fps
Intel Core Ultra 7 155H 3.8GHz
Arc 8-Core
min: 3.43 fps, P0.1: 3.48 fps, P1: 3.93 fps, max: 8.38 fps

Lies of P
2023Intel Core Ultra 7 155H 3.8GHz
Arc 8-Core
min: 26.9 fps, P0.1: 28.8 fps, P1: 30.4 fps, max: 216 fps
Intel Core Ultra 7 155H 3.8GHz
Arc 8-Core
min: 24.6 fps, P0.1: 24.6 fps, P1: 26 fps, max: 193.1 fps
Intel Core Ultra 7 155H 3.8GHz
Arc 8-Core
min: 20.8 fps, P0.1: 21 fps, P1: 22.6 fps, max: 177.9 fps
Intel Core Ultra 7 155H 3.8GHz
Arc 8-Core
min: 16.2 fps, P0.1: 16.6 fps, P1: 17.3 fps, max: 165.8 fps

The Crew Motorfest
2023
Starfield
2023
Armored Core 6
2023Intel Core Ultra 7 155H 3.8GHz
Arc 8-Core
min: 1.42 fps, P0.1: 3.99 fps, P1: 34.3 fps, max: 100.7 fps
Intel Core Ultra 7 155H 3.8GHz
Arc 8-Core
min: 1.475 fps, P0.1: 1.821 fps, P1: 27.1 fps, max: 110.4 fps
Intel Core Ultra 7 155H 3.8GHz
Arc 8-Core
min: 1.975 fps, P0.1: 6.24 fps, P1: 24.5 fps, max: 97.4 fps
Intel Core Ultra 7 155H 3.8GHz
Arc 8-Core
min: 21.8 fps, P0.1: 21.8 fps, P1: 23.4 fps, max: 42.7 fps

Atlas Fallen
2023Intel Core Ultra 7 155H 3.8GHz
Arc 8-Core
min: 38.4 fps, P0.1: 38.8 fps, P1: 39.9 fps, max: 58 fps
Intel Core Ultra 7 155H 3.8GHz
Arc 8-Core
min: 36.7 fps, P0.1: 37.5 fps, P1: 39 fps, max: 56.1 fps
Intel Core Ultra 7 155H 3.8GHz
Arc 8-Core
min: 34.4 fps, P0.1: 34.4 fps, P1: 34.8 fps, max: 48.7 fps
Intel Core Ultra 7 155H 3.8GHz
Arc 8-Core
min: 1.406 fps, P0.1: 2.46 fps, P1: 27.1 fps, max: 50.6 fps

Intel Core Ultra 7 155H 3.8GHz
Arc 8-Core
min: 22 fps, P0.1: 22.1 fps, P1: 23 fps, max: 32.8 fps
Intel Core Ultra 7 155H 3.8GHz
Arc 8-Core
P0.1: 20.3 fpsP1: 22.8 fps, max: 34.4 fps
Intel Core Ultra 7 155H 3.8GHz
Arc 8-Core
P0.1: 1.4 fpsP1: 4.8 fps, max: 34 fps
Intel Core Ultra 7 155H 3.8GHz
Arc 8-Core
P0.1: 10.1 fpsP1: 11.8 fps, max: 27.1 fps

F1 23
20231093534
Intel Core Ultra 5 125U 3.6GHz
Graphics 4-Core
min: 34 fps, P1: 33 fps, max: 46 fps
1093534
Intel Core Ultra 7 165U 3.8GHz
Graphics 4-Core
min: 37 fps, P1: 36 fps, max: 51 fps
1082038
Intel Core Ultra 7 155H 3.8GHz
Arc 8-Core
min: 3 fps, P1: 6 fps, max: 28 fps
1082038
Intel Core Ultra 7 155H 3.8GHz
Arc 8-Core
min: 7 fps, P1: 7 fps, max: 49 fps
1082038
Intel Core Ultra 7 155H 3.8GHz
Arc 8-Core
min: 26 fps, P1: 23 fps, max: 48 fps
1070925
Intel Core Ultra 7 155H 3.8GHz
Arc 8-Core
min: 9 fps, P1: 18 fps, max: 57 fps
1093534
Intel Core Ultra 7 155H 3.8GHz
Arc 8-Core
min: 10 fps, P1: 40 fps, max: 55 fps
1093534
Intel Core Ultra 7 155H 3.8GHz
Arc 8-Core
min: 10 fps, P1: 40 fps, max: 55 fps
1093534
Intel Core Ultra 7 155H 3.8GHz
Arc 8-Core
min: 45 fps, P1: 45 fps, max: 66 fps
1093534
Intel Core Ultra 7 155H 3.8GHz
Arc 8-Core
min: 45 fps, P1: 45 fps, max: 66 fps
1057599
Intel Core Ultra 7 155H 3.8GHz
Arc 8-Core
min: 45 fps, P1: 35 fps, max: 76 fps
1093534
Intel Core Ultra 7 155H 3.8GHz
Arc 8-Core
min: 56 fps, P1: 49 fps, max: 81 fps
1070925
Intel Core Ultra 9 185H 3.8GHz
Arc 8-Core
min: 53 fps, P1: 42 fps, max: 80 fps
1093534
Intel Core Ultra 7 155H 3.8GHz
Arc 8-Core
min: 49 fps, P1: 50 fps, max: 81 fps
1093534
Intel Core Ultra 7 155H 3.8GHz
Arc 8-Core
min: 55 fps, P1: 54 fps, max: 84 fps
1082038
Intel Core Ultra 7 155H 3.8GHz
Arc 8-Core
min: 47 fps, P1: 49 fps, max: 85 fps
1082038
Intel Core Ultra 7 155H 3.8GHz
Arc 8-Core
min: 61 fps, P1: 59 fps, max: 84 fps
1093534
Intel Core Ultra 7 155H 3.8GHz
Arc 8-Core
min: 30 fps, P1: 56 fps, max: 88 fps
1070925
Intel Core Ultra 7 155H 3.8GHz
Arc 8-Core
min: 55 fps, P1: 59 fps, max: 84 fps
1070925
Intel Core Ultra 7 155H 3.8GHz
Arc 8-Core
min: 53 fps, P1: 47 fps, max: 85 fps
1070925
Intel Core Ultra 7 155H 3.8GHz
Arc 8-Core
min: 57 fps, P1: 46 fps, max: 85 fps
1093534
Intel Core Ultra 7 155H 3.8GHz
Arc 8-Core
min: 60 fps, P1: 60 fps, max: 84 fps
1093534
Intel Core Ultra 9 185H 3.8GHz
Arc 8-Core
min: 65 fps, P1: 64 fps, max: 90 fps
1082038
Intel Core Ultra 7 155H 3.8GHz
Arc 8-Core
min: 63 fps, P1: 65 fps, max: 96 fps
1082038
Intel Core Ultra 7 155H 3.8GHz
Arc 8-Core
min: 57 fps, P1: 69 fps, max: 95 fps
1093534
Intel Core Ultra 7 155H 3.8GHz
Arc 8-Core
min: 72 fps, P1: 70 fps, max: 98 fps
1093534
Intel Core Ultra 9 185H 3.8GHz
Arc 8-Core
min: 72 fps, P1: 72 fps, max: 102 fps
1093534
Intel Core Ultra 5 125U 3.6GHz
Graphics 4-Core
min: 31 fps, P1: 30 fps, max: 44 fps
1093534
Intel Core Ultra 7 165U 3.8GHz
Graphics 4-Core
min: 35 fps, P1: 33 fps, max: 48 fps
1082038
Intel Core Ultra 7 155H 3.8GHz
Arc 8-Core
min: 11 fps, P1: 7 fps, max: 22 fps
1082038
Intel Core Ultra 7 155H 3.8GHz
Arc 8-Core
min: 10 fps, P1: 7 fps, max: 50 fps
1082038
Intel Core Ultra 7 155H 3.8GHz
Arc 8-Core
min: 20 fps, P1: 21 fps, max: 44 fps
1070925
Intel Core Ultra 7 155H 3.8GHz
Arc 8-Core
min: 11 fps, P1: 10 fps, max: 47 fps
1093534
Intel Core Ultra 7 155H 3.8GHz
Arc 8-Core
min: 37 fps, P1: 42 fps, max: 61 fps
1093534
Intel Core Ultra 7 155H 3.8GHz
Arc 8-Core
min: 37 fps, P1: 42 fps, max: 61 fps
1057599
Intel Core Ultra 7 155H 3.8GHz
Arc 8-Core
min: 22 fps, P1: 33 fps, max: 71 fps
1070925
Intel Core Ultra 7 155H 3.8GHz
Arc 8-Core
min: 51 fps, P1: 38 fps, max: 69 fps
1093534
Intel Core Ultra 7 155H 3.8GHz
Arc 8-Core
min: 47 fps, P1: 47 fps, max: 72 fps
1093534
Intel Core Ultra 7 155H 3.8GHz
Arc 8-Core
min: 34 fps, P1: 45 fps, max: 69 fps
1070925
Intel Core Ultra 7 155H 3.8GHz
Arc 8-Core
min: 30 fps, P1: 21 fps, max: 78 fps
1082038
Intel Core Ultra 7 155H 3.8GHz
Arc 8-Core
min: 32 fps, P1: 47 fps, max: 74 fps
1093534
Intel Core Ultra 7 155H 3.8GHz
Arc 8-Core
min: 50 fps, P1: 49 fps, max: 75 fps
1082038
Intel Core Ultra 7 155H 3.8GHz
Arc 8-Core
min: 57 fps, P1: 54 fps, max: 74 fps
1093534
Intel Core Ultra 7 155H 3.8GHz
Arc 8-Core
min: 16 fps, P1: 50 fps, max: 80 fps
1070925
Intel Core Ultra 9 185H 3.8GHz
Arc 8-Core
min: 42 fps, P1: 38 fps, max: 80 fps
1070925
Intel Core Ultra 7 155H 3.8GHz
Arc 8-Core
min: 51 fps, P1: 55 fps, max: 79 fps
1093534
Intel Core Ultra 7 155H 3.8GHz
Arc 8-Core
min: 56 fps, P1: 55 fps, max: 77 fps
1093534
Intel Core Ultra 9 185H 3.8GHz
Arc 8-Core
min: 61 fps, P1: 59 fps, max: 82 fps
1082038
Intel Core Ultra 7 155H 3.8GHz
Arc 8-Core
min: 49 fps, P1: 62 fps, max: 87 fps
1082038
Intel Core Ultra 7 155H 3.8GHz
Arc 8-Core
min: 54 fps, P1: 64 fps, max: 89 fps
1093534
Intel Core Ultra 7 155H 3.8GHz
Arc 8-Core
min: 67 fps, P1: 64 fps, max: 89 fps
1093534
Intel Core Ultra 9 185H 3.8GHz
Arc 8-Core
min: 52 fps, P1: 65 fps, max: 92 fps
1093534
Intel Core Ultra 5 125U 3.6GHz
Graphics 4-Core
min: 20 fps, P1: 18 fps, max: 27 fps
1093534
Intel Core Ultra 7 165U 3.8GHz
Graphics 4-Core
min: 22 fps, P1: 22 fps, max: 29 fps
1082038
Intel Core Ultra 7 155H 3.8GHz
Arc 8-Core
min: 2 fps, P1: 3 fps, max: 24 fps
1082038
Intel Core Ultra 7 155H 3.8GHz
Arc 8-Core
min: 14 fps, P1: 14 fps, max: 32 fps
1082038
Intel Core Ultra 7 155H 3.8GHz
Arc 8-Core
min: 8 fps, P1: 6 fps, max: 40 fps
1070925
Intel Core Ultra 7 155H 3.8GHz
Arc 8-Core
min: 6 fps, P1: 12 fps, max: 35 fps
1093534
Intel Core Ultra 7 155H 3.8GHz
Arc 8-Core
min: 28 fps, P1: 27 fps, max: 41 fps
1093534
Intel Core Ultra 7 155H 3.8GHz
Arc 8-Core
min: 28 fps, P1: 27 fps, max: 41 fps
1057599
Intel Core Ultra 7 155H 3.8GHz
Arc 8-Core
min: 27 fps, P1: 17 fps, max: 41 fps
1070925
Intel Core Ultra 7 155H 3.8GHz
Arc 8-Core
min: 24 fps, P1: 18 fps, max: 46 fps
1070925
Intel Core Ultra 9 185H 3.8GHz
Arc 8-Core
min: 13 fps, P1: 10 fps, max: 50 fps
1093534
Intel Core Ultra 7 155H 3.8GHz
Arc 8-Core
min: 32 fps, P1: 32 fps, max: 48 fps
1070925
Intel Core Ultra 7 155H 3.8GHz
Arc 8-Core
min: 24 fps, P1: 11 fps, max: 52 fps
1093534
Intel Core Ultra 7 155H 3.8GHz
Arc 8-Core
min: 28 fps, P1: 33 fps, max: 49 fps
1093534
Intel Core Ultra 7 155H 3.8GHz
Arc 8-Core
min: 30 fps, P1: 32 fps, max: 49 fps
1082038
Intel Core Ultra 7 155H 3.8GHz
Arc 8-Core
min: 37 fps, P1: 36 fps, max: 51 fps
1070925
Intel Core Ultra 7 155H 3.8GHz
Arc 8-Core
min: 34 fps, P1: 36 fps, max: 51 fps
1082038
Intel Core Ultra 7 155H 3.8GHz
Arc 8-Core
min: 41 fps, P1: 37 fps, max: 51 fps
1093534
Intel Core Ultra 7 155H 3.8GHz
Arc 8-Core
min: 23 fps, P1: 37 fps, max: 54 fps
1093534
Intel Core Ultra 9 185H 3.8GHz
Arc 8-Core
min: 40 fps, P1: 39 fps, max: 53 fps
1082038
Intel Core Ultra 7 155H 3.8GHz
Arc 8-Core
min: 41 fps, P1: 43 fps, max: 56 fps
1082038
Intel Core Ultra 7 155H 3.8GHz
Arc 8-Core
min: 40 fps, P1: 43 fps, max: 56 fps
1093534
Intel Core Ultra 7 155H 3.8GHz
Arc 8-Core
min: 40 fps, P1: 43 fps, max: 56 fps
1093534
Intel Core Ultra 9 185H 3.8GHz
Arc 8-Core
min: 41 fps, P1: 45 fps, max: 61 fps
1093534
Intel Core Ultra 7 165U 3.8GHz
Graphics 4-Core
min: 5 fps, P1: 5 fps, max: 8 fps
1070925
Intel Core Ultra 7 155H 3.8GHz
Arc 8-Core
min: 2 fps, P1: 3 fps, max: 9 fps
1070925
Intel Core Ultra 7 155H 3.8GHz
Arc 8-Core
min: 6 fps, P1: 3 fps, max: 14 fps
1093534
Intel Core Ultra 7 155H 3.8GHz
Arc 8-Core
min: 7 fps, P1: 7 fps, max: 13 fps
1070925
Intel Core Ultra 9 185H 3.8GHz
Arc 8-Core
min: 3 fps, P1: 3 fps, max: 15 fps
1070925
Intel Core Ultra 7 155H 3.8GHz
Arc 8-Core
min: 7 fps, P1: 4 fps, max: 16 fps
1093534
Intel Core Ultra 7 155H 3.8GHz
Arc 8-Core
min: 7 fps, P1: 8 fps, max: 14 fps
1093534
Intel Core Ultra 7 155H 3.8GHz
Arc 8-Core
min: 8 fps, P1: 8 fps, max: 14 fps
1057599
Intel Core Ultra 7 155H 3.8GHz
Arc 8-Core
min: 8 fps, P1: 8 fps, max: 14 fps
1093534
Intel Core Ultra 9 185H 3.8GHz
Arc 8-Core
min: 9 fps, P1: 9 fps, max: 15 fps
1070925
Intel Core Ultra 7 155H 3.8GHz
Arc 8-Core
min: 9 fps, P1: 9 fps, max: 15 fps
1082038
Intel Core Ultra 7 155H 3.8GHz
Arc 8-Core
min: 10 fps, P1: 10 fps, max: 17 fps
1082038
Intel Core Ultra 7 155H 3.8GHz
Arc 8-Core
min: 10 fps, P1: 10 fps, max: 17 fps
1093534
Intel Core Ultra 7 155H 3.8GHz
Arc 8-Core
min: 10 fps, P1: 10 fps, max: 17 fps
1093534
Intel Core Ultra 9 185H 3.8GHz
Arc 8-Core
min: 10 fps, P1: 10 fps, max: 17 fps

Intel Core Ultra 7 155H 3.8GHz
Arc 8-Core
min: 0.789 fps, P0.1: 4.66 fps, P1: 32.7 fps, max: 55.7 fps
Intel Core Ultra 7 155H 3.8GHz
Arc 8-Core
min: 22.7 fps, P0.1: 23.1 fps, P1: 24.3 fps, max: 43.2 fps
Intel Core Ultra 7 155H 3.8GHz
Arc 8-Core
min: 19.6 fps, P0.1: 19.7 fps, P1: 21.9 fps, max: 36 fps
Intel Core Ultra 7 155H 3.8GHz
Arc 8-Core
min: 5.1 fps, P0.1: 6.95 fps, P1: 13.9 fps, max: 23.8 fps

Company of Heroes 3
2023
Sons of the Forest
2023Intel Core Ultra 7 155H 3.8GHz
Arc 8-Core
min: 3.53 fps, P0.1: 3.78 fps, P1: 10.5 fps, max: 47.3 fps
Intel Core Ultra 7 155H 3.8GHz
Arc 8-Core
min: 8.76 fps, P0.1: 8.82 fps, P1: 9.58 fps, max: 31.8 fps
Intel Core Ultra 7 155H 3.8GHz
Arc 8-Core
min: 7.88 fps, P0.1: 7.93 fps, P1: 8.68 fps, max: 29.2 fps
Intel Core Ultra 7 155H 3.8GHz
Arc 8-Core
min: 5.88 fps, P0.1: 6.01 fps, P1: 8.17 fps, max: 98.6 fps

Atomic Heart
2023Intel Core Ultra 7 155H 3.8GHz
Arc 8-Core
min: 11.6 fps, P0.1: 27.2 fps, P1: 39.8 fps, max: 116.8 fps
Intel Core Ultra 7 155H 3.8GHz
Arc 8-Core
min: 46.9 fps, P0.1: 50 fps, P1: 52.4 fps, max: 78.2 fps
Intel Core Ultra 7 155H 3.8GHz
Arc 8-Core
min: 17.3 fps, P0.1: 18.6 fps, P1: 30.4 fps, max: 93.9 fps
Intel Core Ultra 7 155H 3.8GHz
Arc 8-Core
min: 24.4 fps, P0.1: 36 fps, P1: 38.8 fps, max: 81.5 fps
Intel Core Ultra 7 155H 3.8GHz
Arc 8-Core
min: 5.68 fps, P0.1: 9.48 fps, P1: 20.2 fps, max: 90.6 fps
Intel Core Ultra 7 155H 3.8GHz
Arc 8-Core
min: 15.6 fps, P0.1: 23.6 fps, P1: 27.3 fps, max: 85 fps
Intel Core Ultra 7 155H 3.8GHz
Arc 8-Core
min: 7.17 fps, P0.1: 7.84 fps, P1: 16 fps, max: 58.8 fps
Intel Core Ultra 7 155H 3.8GHz
Arc 8-Core
min: 17.1 fps, P0.1: 17.8 fps, P1: 19.8 fps, max: 35.1 fps

Returnal
2023
Hogwarts Legacy
2023
F1 22
2022959964
Intel Core Ultra 5 125U 3.6GHz
Graphics 4-Core
min: 31 fps, P1: 32 fps, max: 46 fps
959964
Intel Core Ultra 5 125U 3.6GHz
Graphics 4-Core
min: 32 fps, P1: 32 fps, max: 50 fps
959964
Intel Core Ultra 5 125U 3.6GHz
Graphics 4-Core
min: 34 fps, P1: 33 fps, max: 52 fps
959964
Intel Core Ultra 7 164U 3.8GHz
Graphics 4-Core
min: 29 fps, P1: 29 fps, max: 53 fps
959964
Intel Core Ultra 7 155U 3.8GHz
Graphics 4-Core
min: 36 fps, P1: 35 fps, max: 54 fps
959964
Intel Core Ultra 7 155U 3.8GHz
Graphics 4-Core
min: 36 fps, P1: 36 fps, max: 52 fps
959964
Intel Core Ultra 5 125U 3.6GHz
Graphics 4-Core
min: 38 fps, P1: 37 fps, max: 54 fps
959964
Intel Core Ultra 7 165U 3.8GHz
Graphics 4-Core
min: 38 fps, P1: 37 fps, max: 57 fps
959964
Intel Core Ultra 5 135U 3.6GHz
Graphics 4-Core
min: 36 fps, P1: 35 fps, max: 58 fps
959964
Intel Core Ultra 7 155H 3.8GHz
Arc 8-Core
min: 33 fps, P1: 18 fps, max: 67 fps
959964
Intel Core Ultra 7 155H 3.8GHz
Arc 8-Core
min: 46 fps, P1: 44 fps, max: 77 fps
959964
Intel Core Ultra 7 155H 3.8GHz
Arc 8-Core
min: 51 fps, P1: 53 fps, max: 88 fps
959964
Intel Core Ultra 7 165H 3.8GHz
Arc 8-Core
min: 57 fps, P1: 52 fps, max: 87 fps
959964
Intel Core Ultra 7 155H 3.8GHz
Arc 8-Core
min: 60 fps, P1: 59 fps, max: 88 fps
959964
Intel Core Ultra 7 155H 3.8GHz
Arc 8-Core
min: 54 fps, P1: 56 fps, max: 87 fps
959964
Intel Core Ultra 7 155H 3.8GHz
Arc 8-Core
min: 59 fps, P1: 57 fps, max: 90 fps
959964
Intel Core Ultra 7 155H 3.8GHz
Arc 8-Core
min: 41 fps, P1: 44 fps, max: 88 fps
959964
Intel Core Ultra 7 155H 3.8GHz
Arc 8-Core
min: 31 fps, P1: 45 fps, max: 87 fps
959964
Intel Core Ultra 7 155H 3.8GHz
Arc 8-Core
min: 64 fps, P1: 64 fps, max: 89 fps
959964
Intel Core Ultra 7 155H 3.8GHz
Arc 8-Core
min: 62 fps, P1: 61 fps, max: 96 fps
959964
Intel Core Ultra 7 155H 3.8GHz
Arc 8-Core
min: 52 fps, P1: 55 fps, max: 96 fps
959964
Intel Core Ultra 9 185H 3.8GHz
Arc 8-Core
min: 65 fps, P1: 62 fps, max: 96 fps
959964
Intel Core Ultra 7 155H 3.8GHz
Arc 8-Core
min: 66 fps, P1: 62 fps, max: 97 fps
959964
Intel Core Ultra 7 155H 3.8GHz
Arc 8-Core
min: 67 fps, P1: 62 fps, max: 98 fps
959964
Intel Core Ultra 9 185H 3.8GHz
Arc 8-Core
min: 65 fps, P1: 66 fps, max: 101 fps
959964
Intel Core Ultra 7 155H 3.8GHz
Arc 8-Core
min: 74 fps, P1: 75 fps, max: 116 fps
959964
Intel Core Ultra 7 164U 3.8GHz
Graphics 4-Core
min: 26 fps, P1: 26 fps, max: 41 fps
959964
Intel Core Ultra 5 125U 3.6GHz
Graphics 4-Core
min: 30 fps, P1: 30 fps, max: 44 fps
959964
Intel Core Ultra 5 125U 3.6GHz
Graphics 4-Core
min: 32 fps, P1: 31 fps, max: 44 fps
959964
Intel Core Ultra 5 125U 3.6GHz
Graphics 4-Core
min: 33 fps, P1: 32 fps, max: 49 fps
959964
Intel Core Ultra 7 155U 3.8GHz
Graphics 4-Core
min: 32 fps, P1: 33 fps, max: 50 fps
959964
Intel Core Ultra 5 135U 3.6GHz
Graphics 4-Core
min: 35 fps, P1: 34 fps, max: 48 fps
959964
Intel Core Ultra 7 165U 3.8GHz
Graphics 4-Core
min: 35 fps, P1: 34 fps, max: 50 fps
959964
Intel Core Ultra 5 125U 3.6GHz
Graphics 4-Core
min: 33 fps, P1: 34 fps, max: 51 fps
959964
Intel Core Ultra 7 155U 3.8GHz
Graphics 4-Core
min: 35 fps, P1: 34 fps, max: 51 fps
959964
Intel Core Ultra 7 155H 3.8GHz
Arc 8-Core
min: 41 fps, P1: 37 fps, max: 59 fps
959964
Intel Core Ultra 7 155H 3.8GHz
Arc 8-Core
min: 36 fps, P1: 21 fps, max: 65 fps
959964
Intel Core Ultra 7 165H 3.8GHz
Arc 8-Core
min: 49 fps, P1: 37 fps, max: 67 fps
959964
Intel Core Ultra 7 155H 3.8GHz
Arc 8-Core
min: 36 fps, P1: 30 fps, max: 75 fps
959964
Intel Core Ultra 7 155H 3.8GHz
Arc 8-Core
min: 32 fps, P1: 51 fps, max: 81 fps
959964
Intel Core Ultra 7 155H 3.8GHz
Arc 8-Core
min: 54 fps, P1: 52 fps, max: 76 fps
959964
Intel Core Ultra 7 155H 3.8GHz
Arc 8-Core
min: 42 fps, P1: 53 fps, max: 81 fps
959964
Intel Core Ultra 7 155H 3.8GHz
Arc 8-Core
min: 42 fps, P1: 53 fps, max: 82 fps
959964
Intel Core Ultra 7 155H 3.8GHz
Arc 8-Core
min: 50 fps, P1: 44 fps, max: 82 fps
959964
Intel Core Ultra 7 155H 3.8GHz
Arc 8-Core
min: 60 fps, P1: 59 fps, max: 81 fps
959964
Intel Core Ultra 9 185H 3.8GHz
Arc 8-Core
min: 24 fps, P1: 55 fps, max: 88 fps
959964
Intel Core Ultra 7 155H 3.8GHz
Arc 8-Core
min: 58 fps, P1: 55 fps, max: 86 fps
959964
Intel Core Ultra 7 155H 3.8GHz
Arc 8-Core
min: 25 fps, P1: 55 fps, max: 88 fps
959964
Intel Core Ultra 7 155H 3.8GHz
Arc 8-Core
min: 63 fps, P1: 60 fps, max: 82 fps
959964
Intel Core Ultra 7 155H 3.8GHz
Arc 8-Core
min: 62 fps, P1: 59 fps, max: 88 fps
959964
Intel Core Ultra 9 185H 3.8GHz
Arc 8-Core
min: 68 fps, P1: 64 fps, max: 94 fps
959964
Intel Core Ultra 7 155H 3.8GHz
Arc 8-Core
min: 59 fps, P1: 69 fps, max: 106 fps
959964
Intel Core Ultra 7 164U 3.8GHz
Graphics 4-Core
min: 16 fps, P1: 17 fps, max: 29 fps
959964
Intel Core Ultra 5 125U 3.6GHz
Graphics 4-Core
min: 23 fps, P1: 23 fps, max: 33 fps
959964
Intel Core Ultra 7 165U 3.8GHz
Graphics 4-Core
min: 25 fps, P1: 24 fps, max: 34 fps
959964
Intel Core Ultra 7 155U 3.8GHz
Graphics 4-Core
min: 26 fps, P1: 25 fps, max: 35 fps
959964
Intel Core Ultra 5 135U 3.6GHz
Graphics 4-Core
min: 25 fps, P1: 25 fps, max: 36 fps
959964
Intel Core Ultra 5 125U 3.6GHz
Graphics 4-Core
min: 26 fps, P1: 25 fps, max: 38 fps
959964
Intel Core Ultra 7 155H 3.8GHz
Arc 8-Core
min: 30 fps, P1: 29 fps, max: 42 fps
959964
Intel Core Ultra 7 155H 3.8GHz
Arc 8-Core
min: 18 fps, P1: 13 fps, max: 51 fps
959964
Intel Core Ultra 7 165H 3.8GHz
Arc 8-Core
min: 30 fps, P1: 27 fps, max: 51 fps
959964
Intel Core Ultra 7 155H 3.8GHz
Arc 8-Core
min: 35 fps, P1: 20 fps, max: 59 fps
959964
Intel Core Ultra 7 155H 3.8GHz
Arc 8-Core
min: 39 fps, P1: 39 fps, max: 60 fps
959964
Intel Core Ultra 7 155H 3.8GHz
Arc 8-Core
min: 36 fps, P1: 38 fps, max: 63 fps
959964
Intel Core Ultra 7 155H 3.8GHz
Arc 8-Core
min: 38 fps, P1: 38 fps, max: 66 fps
959964
Intel Core Ultra 9 185H 3.8GHz
Arc 8-Core
min: 44 fps, P1: 42 fps, max: 63 fps
959964
Intel Core Ultra 7 155H 3.8GHz
Arc 8-Core
min: 47 fps, P1: 45 fps, max: 63 fps
959964
Intel Core Ultra 7 155H 3.8GHz
Arc 8-Core
min: 41 fps, P1: 41 fps, max: 67 fps
959964
Intel Core Ultra 7 155H 3.8GHz
Arc 8-Core
min: 48 fps, P1: 42 fps, max: 64 fps
959964
Intel Core Ultra 9 185H 3.8GHz
Arc 8-Core
min: 48 fps, P1: 46 fps, max: 67 fps
959964
Intel Core Ultra 7 155H 3.8GHz
Arc 8-Core
min: 47 fps, P1: 46 fps, max: 67 fps
959964
Intel Core Ultra 7 155H 3.8GHz
Arc 8-Core
min: 56 fps, P1: 53 fps, max: 77 fps
959964
Intel Core Ultra 7 164U 3.8GHz
Graphics 4-Core
min: 5 fps, P1: 5 fps, max: 9 fps
959964
Intel Core Ultra 7 165U 3.8GHz
Graphics 4-Core
min: 5 fps, P1: 5 fps, max: 10 fps
959964
Intel Core Ultra 7 155U 3.8GHz
Graphics 4-Core
min: 6 fps, P1: 6 fps, max: 9 fps
959964
Intel Core Ultra 5 135U 3.6GHz
Graphics 4-Core
min: 6 fps, P1: 6 fps, max: 9 fps
959964
Intel Core Ultra 7 155H 3.8GHz
Arc 8-Core
min: 1 fps, P1: 1 fps, max: 12 fps
959964
Intel Core Ultra 7 155H 3.8GHz
Arc 8-Core
min: 7 fps, P1: 7 fps, max: 11 fps
959964
Intel Core Ultra 7 155H 3.8GHz
Arc 8-Core
min: 7 fps, P1: 4 fps, max: 15 fps
959964
Intel Core Ultra 9 185H 3.8GHz
Arc 8-Core
min: 10 fps, P1: 10 fps, max: 17 fps
959964
Intel Core Ultra 7 155H 3.8GHz
Arc 8-Core
min: 9 fps, P1: 10 fps, max: 17 fps
959964
Intel Core Ultra 9 185H 3.8GHz
Arc 8-Core
min: 10 fps, P1: 10 fps, max: 17 fps
959964
Intel Core Ultra 7 155H 3.8GHz
Arc 8-Core
min: 11 fps, P1: 11 fps, max: 17 fps
959964
Intel Core Ultra 7 155H 3.8GHz
Arc 8-Core
min: 11 fps, P1: 11 fps, max: 18 fps
959964
Intel Core Ultra 7 155H 3.8GHz
Arc 8-Core
min: 11 fps, P1: 11 fps, max: 18 fps
959964
Intel Core Ultra 7 155H 3.8GHz
Arc 8-Core
min: 9 fps, P1: 12 fps, max: 19 fps
959964
Intel Core Ultra 7 155H 3.8GHz
Arc 8-Core
min: 11 fps, P1: 11 fps, max: 20 fps
959964
Intel Core Ultra 7 155H 3.8GHz
Arc 8-Core
min: 12 fps, P1: 12 fps, max: 20 fps


GRID Legends
2022800660
Intel Core Ultra 9 185H 3.8GHz
Arc 8-Core
min: 46.1 fps, max: 181.8 fps
800660
Intel Core Ultra 9 185H 3.8GHz
Arc 8-Core
min: 34.5 fps, max: 151.8 fps
800660
Intel Core Ultra 9 185H 3.8GHz
Arc 8-Core
min: 29.3 fps, max: 72.2 fps
800660
Intel Core Ultra 9 185H 3.8GHz
Arc 8-Core
min: 26.1 fps, max: 65.2 fps

Dying Light 2
2022
God of War
2022Intel Core Ultra 7 155H 3.8GHz
Arc 8-Core
min: 22.1 fps, P0.1: 22.3 fps, P1: 23.6 fps, max: 36.5 fps
Intel Core Ultra 9 185H 3.8GHz
Arc 8-Core
min: 23.2 fps, P0.1: 23.7 fps, P1: 24.4 fps, max: 49.1 fps
Intel Core Ultra 7 155H 3.8GHz
Arc 8-Core
min: 20.6 fps, P0.1: 20.7 fps, P1: 21.5 fps, max: 27.6 fps
Intel Core Ultra 9 185H 3.8GHz
Arc 8-Core
min: 27.5 fps, P0.1: 27.7 fps, P1: 28.1 fps, max: 38.6 fps
Intel Core Ultra 7 155H 3.8GHz
Arc 8-Core
min: 10.5 fps, P0.1: 11 fps, P1: 15.2 fps, max: 28.6 fps
Intel Core Ultra 9 185H 3.8GHz
Arc 8-Core
min: 15 fps, P0.1: 15.3 fps, P1: 17.9 fps, max: 36.8 fps
Intel Core Ultra 7 155H 3.8GHz
Arc 8-Core
min: 9.37 fps, P0.1: 9.72 fps, P1: 11 fps, max: 17.4 fps
Intel Core Ultra 9 185H 3.8GHz
Arc 8-Core
min: 8.26 fps, P0.1: 8.27 fps, P1: 8.97 fps, max: 153.3 fps

Far Cry 6
2021
F1 2021
2021874931
Intel Core Ultra 7 155H 3.8GHz
Arc 8-Core
min: 76 fps, P1: 75 fps, max: 108 fps
874931
Intel Core Ultra 7 155H 3.8GHz
Arc 8-Core
min: 119 fps, P1: 95 fps, max: 173 fps
874931
Intel Core Ultra 7 155H 3.8GHz
Arc 8-Core
min: 111 fps, P1: 105 fps, max: 169 fps
874931
Intel Core Ultra 7 155H 3.8GHz
Arc 8-Core
min: 119 fps, P1: 118 fps, max: 174 fps
874931
Intel Core Ultra 9 185H 3.8GHz
Arc 8-Core
min: 118 fps, P1: 117 fps, max: 177 fps
874931
Intel Core Ultra 9 185H 3.8GHz
Arc 8-Core
min: 132 fps, P1: 130 fps, max: 182 fps
874931
Intel Core Ultra 7 155H 3.8GHz
Arc 8-Core
min: 20 fps, P1: 28 fps, max: 58 fps
874931
Intel Core Ultra 7 155H 3.8GHz
Arc 8-Core
min: 31 fps, P1: 35 fps, max: 89 fps
874931
Intel Core Ultra 7 155H 3.8GHz
Arc 8-Core
min: 50 fps, P1: 29 fps, max: 94 fps
874931
Intel Core Ultra 7 155H 3.8GHz
Arc 8-Core
min: 66 fps, P1: 64 fps, max: 92 fps
874931
Intel Core Ultra 9 185H 3.8GHz
Arc 8-Core
min: 66 fps, P1: 63 fps, max: 93 fps
874931
Intel Core Ultra 9 185H 3.8GHz
Arc 8-Core
min: 61 fps, P1: 67 fps, max: 94 fps
874931
Intel Core Ultra 7 155H 3.8GHz
Arc 8-Core
min: 19 fps, P1: 23 fps, max: 57 fps
874931
Intel Core Ultra 7 155H 3.8GHz
Arc 8-Core
min: 41 fps, P1: 28 fps, max: 69 fps
874931
Intel Core Ultra 7 155H 3.8GHz
Arc 8-Core
min: 39 fps, P1: 19 fps, max: 75 fps
874931
Intel Core Ultra 7 155H 3.8GHz
Arc 8-Core
min: 55 fps, P1: 49 fps, max: 72 fps
874931
Intel Core Ultra 9 185H 3.8GHz
Arc 8-Core
min: 33 fps, P1: 48 fps, max: 74 fps
874931
Intel Core Ultra 9 185H 3.8GHz
Arc 8-Core
min: 56 fps, P1: 52 fps, max: 73 fps
874931
Intel Core Ultra 7 155H 3.8GHz
Arc 8-Core
min: 6 fps, P1: 12 fps, max: 26 fps
874931
Intel Core Ultra 7 155H 3.8GHz
Arc 8-Core
min: 14 fps, P1: 8 fps, max: 33 fps
874931
Intel Core Ultra 7 155H 3.8GHz
Arc 8-Core
min: 21 fps, P1: 10 fps, max: 32 fps
874931
Intel Core Ultra 7 155H 3.8GHz
Arc 8-Core
min: 22 fps, P1: 22 fps, max: 33 fps
874931
Intel Core Ultra 9 185H 3.8GHz
Arc 8-Core
min: 23 fps, P1: 22 fps, max: 33 fps
874931
Intel Core Ultra 9 185H 3.8GHz
Arc 8-Core
min: 24 fps, P1: 23 fps, max: 34 fps

Horizon Zero Dawn
2020Intel Core Ultra 7 155H 3.8GHz
Arc 8-Core
Problem during benchmarking occured: Spiel startete nicht
Intel Core Ultra 7 155H 3.8GHz
Arc 8-Core
Problem during benchmarking occured: Leichte grafische Probleme points on the left end right edge of the displayed content

F1 2020
2020759689
Intel Core Ultra 9 185H 3.8GHz
Arc 8-Core
min: 126 fps, max: 155 fps
759689
Intel Core Ultra 9 185H 3.8GHz
Arc 8-Core
min: 64 fps, max: 88 fps
759689
Intel Core Ultra 9 185H 3.8GHz
Arc 8-Core
min: 51 fps, max: 68 fps
759689
Intel Core Ultra 9 185H 3.8GHz
Arc 8-Core
min: 32 fps, max: 51 fps

Borderlands 3
2019

Far Cry New Dawn
2019
Metro Exodus
2019

Strange Brigade
20181.47.22.14 D3D12
Intel Core Ultra 5 125U 3.6GHz
Graphics 4-Core
min: 13 fps, P1: 58.2 fps, max: 293 fps
1.47.22.14 D3D12
Intel Core Ultra 5 125U 3.6GHz
Graphics 4-Core
min: 14.9 fps, P1: 59.5 fps, max: 308 fps
1.47.22.14 D3D12
Intel Core Ultra 7 165U 3.8GHz
Graphics 4-Core
min: 14.9 fps, P1: 57.1 fps, max: 266 fps
1.47.22.14 D3D12
Intel Core Ultra 5 134U 3.6GHz
Graphics 4-Core
min: 14.9 fps, P1: 57.1 fps, max: 266 fps
1.47.22.14 D3D12
Intel Core Ultra 7 164U 3.8GHz
Graphics 4-Core
min: 25.4 fps, P1: 56.3 fps, max: 290 fps
1.47.22.14 D3D12
Intel Core Ultra 7 165U 3.8GHz
Graphics 4-Core
min: 5 fps, P1: 50.8 fps, max: 241 fps
1.47.22.14 D3D12
Intel Core Ultra 7 155U 3.8GHz
Graphics 4-Core
min: 10.4 fps, P1: 89.7 fps, max: 288 fps
1.47.22.14 D3D12
Intel Core Ultra 5 125U 3.6GHz
Graphics 4-Core
min: 33.3 fps, P1: 76.9 fps, max: 316 fps
1.47.22.14 D3D12
Intel Core Ultra 7 165U 3.8GHz
Graphics 4-Core
min: 60 fps, P1: 89 fps, max: 368 fps
1.47.22.14 D3D12
Intel Core Ultra 7 155U 3.8GHz
Graphics 4-Core
min: 28.9 fps, P1: 93.5 fps, max: 322 fps
1.47.22.14 D3D12
Intel Core Ultra 5 135U 3.6GHz
Graphics 4-Core
min: 25.8 fps, P1: 85.9 fps, max: 351 fps
1.47.22.14 D3D12
Intel Core Ultra 5 125U 3.6GHz
Graphics 4-Core
min: 39.2 fps, P1: 96.2 fps, max: 269 fps
1.47.22.14 D3D12
Intel Core Ultra 7 165U 3.8GHz
Graphics 4-Core
min: 32.1 fps, P1: 95.5 fps, max: 362 fps
1.47.22.14 D3D12
Intel Core Ultra 5 125U 3.6GHz
Graphics 4-Core
min: 29.4 fps, P1: 97.4 fps, max: 307 fps
1.47.22.14 D3D12
Intel Core Ultra 9 185H 3.8GHz
Arc 8-Core
min: 5 fps, P1: 56.5 fps, max: 524 fps
1.47.22.14 D3D12
Intel Core Ultra 7 155H 3.8GHz
Arc 8-Core
min: 10.9 fps, P1: 106.1 fps, max: 339 fps
1.47.22.14 D3D12
Intel Core Ultra 7 155H 3.8GHz
Arc 8-Core
min: 15.2 fps, P1: 64.5 fps, max: 415 fps
1.47.22.14 D3D12
Intel Core Ultra 7 155H 3.8GHz
Arc 8-Core
min: 35.7 fps, P1: 72.6 fps, max: 377 fps
1.47.22.14 D3D12
Intel Core Ultra 7 155H 3.8GHz
Arc 8-Core
min: 9.4 fps, P1: 63.1 fps, max: 227 fps
1.47.22.14 D3D12
Intel Core Ultra 7 155H 3.8GHz
Arc 8-Core
min: 43.3 fps, P1: 64.6 fps, max: 478 fps
1.47.22.14 D3D12
Intel Core Ultra 7 155H 3.8GHz
Arc 8-Core
min: 11.6 fps, P1: 70.2 fps, max: 457 fps
1.47.22.14 D3D12
Intel Core Ultra 7 155H 3.8GHz
Arc 8-Core
min: 39.9 fps, P1: 61.8 fps, max: 448 fps
1.47.22.14 D3D12
Intel Core Ultra 7 155H 3.8GHz
Arc 8-Core
min: 40.8 fps, P1: 112.7 fps, max: 450 fps
1.47.22.14 D3D12
Intel Core Ultra 7 155H 3.8GHz
Arc 8-Core
min: 9 fps, P1: 72.6 fps, max: 465 fps
1.47.22.14 D3D12
Intel Core Ultra 7 155H 3.8GHz
Arc 8-Core
min: 42.2 fps, P1: 76.8 fps, max: 319 fps
1.47.22.14 D3D12
Intel Core Ultra 7 155H 3.8GHz
Arc 8-Core
min: 7.4 fps, P1: 78.9 fps, max: 451 fps
1.47.22.14 D3D12
Intel Core Ultra 7 155H 3.8GHz
Arc 8-Core
min: 46.4 fps, P1: 76.2 fps, max: 454 fps
1.47.22.14 D3D12
Intel Core Ultra 7 155H 3.8GHz
Arc 8-Core
min: 27.8 fps, P1: 81.7 fps, max: 367 fps
1.47.22.14 D3D12
Intel Core Ultra 7 155H 3.8GHz
Arc 8-Core
min: 50.8 fps, P1: 72.3 fps, max: 550 fps
1.47.22.14 D3D12
Intel Core Ultra 7 155H 3.8GHz
Arc 8-Core
min: 35.1 fps, P1: 129.9 fps, max: 405 fps
1.47.22.14 D3D12
Intel Core Ultra 7 155H 3.8GHz
Arc 8-Core
min: 37 fps, P1: 129.2 fps, max: 521 fps
1.47.22.14 D3D12
Intel Core Ultra 7 165H 3.8GHz
Arc 8-Core
min: 42.7 fps, P1: 127.4 fps, max: 435 fps
1.47.22.14 D3D12
Intel Core Ultra 7 155H 3.8GHz
Arc 8-Core
min: 52.3 fps, P1: 138.8 fps, max: 357 fps
1.47.22.14 D3D12
Intel Core Ultra 7 155H 3.8GHz
Arc 8-Core
min: 49.7 fps, P1: 146.7 fps, max: 395 fps
1.47.22.14 D3D12
Intel Core Ultra 7 155H 3.8GHz
Arc 8-Core
min: 78.5 fps, P1: 150.9 fps, max: 329 fps
1.47.22.14 D3D12
Intel Core Ultra 7 155H 3.8GHz
Arc 8-Core
min: 54 fps, P1: 152.4 fps, max: 577 fps
1.47.22.14 D3D12
Intel Core Ultra 5 125U 3.6GHz
Graphics 4-Core
min: 9.7 fps, P1: 27.1 fps, max: 216 fps
1.47.22.14 D3D12
Intel Core Ultra 5 125U 3.6GHz
Graphics 4-Core
min: 11.4 fps, P1: 27.8 fps, max: 220 fps
1.47.22.14 D3D12
Intel Core Ultra 7 165U 3.8GHz
Graphics 4-Core
min: 8.4 fps, P1: 28.8 fps, max: 254 fps
1.47.22.14 D3D12
Intel Core Ultra 5 134U 3.6GHz
Graphics 4-Core
min: 8.4 fps, P1: 28.8 fps, max: 254 fps
1.47.22.14 D3D12
Intel Core Ultra 7 165U 3.8GHz
Graphics 4-Core
min: 5 fps, P1: 32 fps, max: 191.2 fps
1.47.22.14 D3D12
Intel Core Ultra 7 164U 3.8GHz
Graphics 4-Core
min: 22.8 fps, P1: 31.9 fps, max: 57.9 fps
1.47.22.14 D3D12
Intel Core Ultra 7 155U 3.8GHz
Graphics 4-Core
min: 24.6 fps, P1: 38 fps, max: 107.7 fps
1.47.22.14 D3D12
Intel Core Ultra 5 125U 3.6GHz
Graphics 4-Core
min: 13.2 fps, P1: 37.6 fps, max: 210 fps
1.47.22.14 D3D12
Intel Core Ultra 5 135U 3.6GHz
Graphics 4-Core
min: 26.4 fps, P1: 39.7 fps, max: 183.3 fps
1.47.22.14 D3D12
Intel Core Ultra 5 125U 3.6GHz
Graphics 4-Core
min: 35.9 fps, P1: 41.3 fps, max: 68.2 fps
1.47.22.14 D3D12
Intel Core Ultra 5 125U 3.6GHz
Graphics 4-Core
min: 24.3 fps, P1: 41.3 fps, max: 187.8 fps
1.47.22.14 D3D12
Intel Core Ultra 7 155U 3.8GHz
Graphics 4-Core
min: 25.8 fps, P1: 42.3 fps, max: 187.2 fps
1.47.22.14 D3D12
Intel Core Ultra 7 165U 3.8GHz
Graphics 4-Core
min: 31.3 fps, P1: 42.2 fps, max: 68.7 fps
1.47.22.14 D3D12
Intel Core Ultra 7 165U 3.8GHz
Graphics 4-Core
min: 23.9 fps, P1: 42 fps, max: 171.4 fps
1.47.22.14 D3D12
Intel Core Ultra 7 155H 3.8GHz
Arc 8-Core
min: 5.7 fps, P1: 43.5 fps, max: 231 fps
1.47.22.14 D3D12
Intel Core Ultra 7 155H 3.8GHz
Arc 8-Core
min: 8.4 fps, P1: 16.1 fps, max: 169.9 fps
1.47.22.14 D3D12
Intel Core Ultra 7 155H 3.8GHz
Arc 8-Core
min: 8.9 fps, P1: 48.8 fps, max: 233 fps
1.47.22.14 D3D12
Intel Core Ultra 7 155H 3.8GHz
Arc 8-Core
min: 8 fps, P1: 49.6 fps, max: 154.1 fps
1.47.22.14 D3D12
Intel Core Ultra 7 155H 3.8GHz
Arc 8-Core
min: 21.9 fps, P1: 46.8 fps, max: 87.1 fps
1.47.22.14 D3D12
Intel Core Ultra 7 155H 3.8GHz
Arc 8-Core
min: 7.4 fps, P1: 53.4 fps, max: 241 fps
1.47.22.14 D3D12
Intel Core Ultra 7 155H 3.8GHz
Arc 8-Core
min: 7 fps, P1: 51.3 fps, max: 249 fps
1.47.22.14 D3D12
Intel Core Ultra 7 155H 3.8GHz
Arc 8-Core
min: 6.7 fps, P1: 25.8 fps, max: 188 fps
1.47.22.14 D3D12
Intel Core Ultra 7 155H 3.8GHz
Arc 8-Core
min: 41.4 fps, P1: 52.7 fps, max: 94.8 fps
1.47.22.14 D3D12
Intel Core Ultra 9 185H 3.8GHz
Arc 8-Core
min: 51.1 fps, P1: 59.2 fps, max: 87.3 fps
1.47.22.14 D3D12
Intel Core Ultra 7 155H 3.8GHz
Arc 8-Core
min: 9.1 fps, P1: 58.7 fps, max: 350 fps
1.47.22.14 D3D12
Intel Core Ultra 7 155H 3.8GHz
Arc 8-Core
min: 42.7 fps, P1: 62.5 fps, max: 123.2 fps
1.47.22.14 D3D12
Intel Core Ultra 7 155H 3.8GHz
Arc 8-Core
min: 50 fps, P1: 58.5 fps, max: 101.3 fps
1.47.22.14 D3D12
Intel Core Ultra 7 155H 3.8GHz
Arc 8-Core
min: 7.6 fps, P1: 24.5 fps, max: 164.8 fps
1.47.22.14 D3D12
Intel Core Ultra 7 155H 3.8GHz
Arc 8-Core
min: 6.8 fps, P1: 59.5 fps, max: 343 fps
1.47.22.14 D3D12
Intel Core Ultra 7 155H 3.8GHz
Arc 8-Core
min: 53.6 fps, P1: 61.6 fps, max: 128.6 fps
1.47.22.14 D3D12
Intel Core Ultra 7 155H 3.8GHz
Arc 8-Core
min: 5.5 fps, P1: 58.2 fps, max: 352 fps
1.47.22.14 D3D12
Intel Core Ultra 7 155H 3.8GHz
Arc 8-Core
min: 26.3 fps, P1: 61.7 fps, max: 318 fps
1.47.22.14 D3D12
Intel Core Ultra 7 165H 3.8GHz
Arc 8-Core
min: 25.7 fps, P1: 64.2 fps, max: 331 fps
1.47.22.14 D3D12
Intel Core Ultra 7 155H 3.8GHz
Arc 8-Core
min: 60.1 fps, P1: 68.3 fps, max: 107.8 fps
1.47.22.14 D3D12
Intel Core Ultra 7 155H 3.8GHz
Arc 8-Core
min: 52.4 fps, P1: 71.5 fps, max: 119.4 fps
1.47.22.14 D3D12
Intel Core Ultra 7 155H 3.8GHz
Arc 8-Core
min: 60.9 fps, P1: 72.4 fps, max: 127.8 fps
1.47.22.14 D3D12
Intel Core Ultra 5 125U 3.6GHz
Graphics 4-Core
min: 7.8 fps, P1: 12.9 fps, max: 199.2 fps
1.47.22.14 D3D12
Intel Core Ultra 5 125U 3.6GHz
Graphics 4-Core
min: 8.2 fps, P1: 11.3 fps, max: 237 fps
1.47.22.14 D3D12
Intel Core Ultra 7 165U 3.8GHz
Graphics 4-Core
min: 5 fps, P1: 6.84 fps, max: 204 fps
1.47.22.14 D3D12
Intel Core Ultra 7 164U 3.8GHz
Graphics 4-Core
min: 20 fps, P1: 23.9 fps, max: 48 fps
1.47.22.14 D3D12
Intel Core Ultra 5 125U 3.6GHz
Graphics 4-Core
min: 7.9 fps, P1: 13.1 fps, max: 266 fps
1.47.22.14 D3D12
Intel Core Ultra 7 155U 3.8GHz
Graphics 4-Core
min: 19.8 fps, P1: 24.8 fps, max: 147.4 fps
1.47.22.14 D3D12
Intel Core Ultra 5 134U 3.6GHz
Graphics 4-Core
min: 22 fps, P1: 26.5 fps, max: 66.8 fps
1.47.22.14 D3D12
Intel Core Ultra 7 155U 3.8GHz
Graphics 4-Core
min: 6.8 fps, P1: 13.1 fps, max: 267 fps
1.47.22.14 D3D12
Intel Core Ultra 5 125U 3.6GHz
Graphics 4-Core
min: 10 fps, P1: 24 fps, max: 277 fps
1.47.22.14 D3D12
Intel Core Ultra 5 135U 3.6GHz
Graphics 4-Core
min: 20.1 fps, P1: 24.2 fps, max: 222 fps
1.47.22.14 D3D12
Intel Core Ultra 5 125U 3.6GHz
Graphics 4-Core
min: 22.9 fps, P1: 26.7 fps, max: 202 fps
1.47.22.14 D3D12
Intel Core Ultra 7 165U 3.8GHz
Graphics 4-Core
min: 15.4 fps, P1: 28.4 fps, max: 154.6 fps
1.47.22.14 D3D12
Intel Core Ultra 7 165U 3.8GHz
Graphics 4-Core
min: 20.6 fps, P1: 30.5 fps, max: 165.1 fps
1.47.22.14 D3D12
Intel Core Ultra 7 155H 3.8GHz
Arc 8-Core
min: 6.2 fps, P1: 14.3 fps, max: 187.1 fps
1.47.22.14 D3D12
Intel Core Ultra 7 155H 3.8GHz
Arc 8-Core
min: 5 fps, P1: 9 fps, max: 275 fps
1.47.22.14 D3D12
Intel Core Ultra 7 155H 3.8GHz
Arc 8-Core
min: 7.8 fps, P1: 24.6 fps, max: 162.7 fps
1.47.22.14 D3D12
Intel Core Ultra 7 155H 3.8GHz
Arc 8-Core
min: 24.4 fps, P1: 40.8 fps, max: 260 fps
1.47.22.14 D3D12
Intel Core Ultra 7 155H 3.8GHz
Arc 8-Core
min: 19.3 fps, P1: 38.2 fps, max: 75.9 fps
1.47.22.14 D3D12
Intel Core Ultra 7 155H 3.8GHz
Arc 8-Core
min: 6.4 fps, P1: 15.6 fps, max: 209 fps
1.47.22.14 D3D12
Intel Core Ultra 7 155H 3.8GHz
Arc 8-Core
min: 25.6 fps, P1: 41.4 fps, max: 283 fps
1.47.22.14 D3D12
Intel Core Ultra 7 155H 3.8GHz
Arc 8-Core
min: 17.3 fps, P1: 29.3 fps, max: 243 fps
1.47.22.14 D3D12
Intel Core Ultra 7 155H 3.8GHz
Arc 8-Core
min: 6.8 fps, P1: 15.4 fps, max: 319 fps
1.47.22.14 D3D12
Intel Core Ultra 7 155H 3.8GHz
Arc 8-Core
min: 6.4 fps, P1: 12.8 fps, max: 287 fps
1.47.22.14 D3D12
Intel Core Ultra 9 185H 3.8GHz
Arc 8-Core
min: 43.9 fps, P1: 47 fps, max: 80.7 fps
1.47.22.14 D3D12
Intel Core Ultra 7 155H 3.8GHz
Arc 8-Core
min: 8.4 fps, P1: 44.7 fps, max: 202 fps
1.47.22.14 D3D12
Intel Core Ultra 7 155H 3.8GHz
Arc 8-Core
min: 6.5 fps, P1: 15.9 fps, max: 302 fps
1.47.22.14 D3D12
Intel Core Ultra 7 155H 3.8GHz
Arc 8-Core
min: 8.3 fps, P1: 18.9 fps, max: 153.2 fps
1.47.22.14 D3D12
Intel Core Ultra 7 155H 3.8GHz
Arc 8-Core
min: 22.4 fps, P1: 45.4 fps, max: 241 fps
1.47.22.14 D3D12
Intel Core Ultra 7 155H 3.8GHz
Arc 8-Core
min: 42.8 fps, P1: 48.2 fps, max: 102.2 fps
1.47.22.14 D3D12
Intel Core Ultra 7 155H 3.8GHz
Arc 8-Core
min: 6 fps, P1: 27.6 fps, max: 294 fps
1.47.22.14 D3D12
Intel Core Ultra 7 155H 3.8GHz
Arc 8-Core
min: 5.4 fps, P1: 15.4 fps, max: 296 fps
1.47.22.14 D3D12
Intel Core Ultra 7 165H 3.8GHz
Arc 8-Core
min: 7 fps, P1: 34.8 fps, max: 281 fps
1.47.22.14 D3D12
Intel Core Ultra 7 155H 3.8GHz
Arc 8-Core
min: 21.4 fps, P1: 48.7 fps, max: 274 fps
1.47.22.14 D3D12
Intel Core Ultra 7 155H 3.8GHz
Arc 8-Core
min: 25.3 fps, P1: 53.4 fps, max: 231 fps
1.47.22.14 D3D12
Intel Core Ultra 7 155H 3.8GHz
Arc 8-Core
min: 48.1 fps, P1: 56 fps, max: 118.6 fps
1.47.22.14 D3D12
Intel Core Ultra 5 125U 3.6GHz
Graphics 4-Core
min: 7.8 fps, P1: 9.43 fps, max: 238 fps
1.47.22.14 D3D12
Intel Core Ultra 5 125U 3.6GHz
Graphics 4-Core
min: 7.3 fps, P1: 9.15 fps, max: 242 fps
1.47.22.14 D3D12
Intel Core Ultra 5 125U 3.6GHz
Graphics 4-Core
min: 7.3 fps, P1: 8.8 fps, max: 296 fps
1.47.22.14 D3D12
Intel Core Ultra 7 164U 3.8GHz
Graphics 4-Core
min: 13.7 fps, P1: 15 fps, max: 43.4 fps
1.47.22.14 D3D12
Intel Core Ultra 7 165U 3.8GHz
Graphics 4-Core
min: 5 fps, P1: 5.64 fps, max: 238 fps
1.47.22.14 D3D12
Intel Core Ultra 7 155U 3.8GHz
Graphics 4-Core
min: 17.5 fps, P1: 19 fps, max: 59.4 fps
1.47.22.14 D3D12
Intel Core Ultra 5 125U 3.6GHz
Graphics 4-Core
min: 6.1 fps, P1: 9.16 fps, max: 256 fps
1.47.22.14 D3D12
Intel Core Ultra 5 134U 3.6GHz
Graphics 4-Core
min: 15.9 fps, P1: 21.6 fps, max: 50.6 fps
1.47.22.14 D3D12
Intel Core Ultra 5 135U 3.6GHz
Graphics 4-Core
min: 7.1 fps, P1: 10 fps, max: 269 fps
1.47.22.14 D3D12
Intel Core Ultra 5 125U 3.6GHz
Graphics 4-Core
min: 7.6 fps, P1: 10.6 fps, max: 303 fps
1.47.22.14 D3D12
Intel Core Ultra 7 155U 3.8GHz
Graphics 4-Core
min: 7.5 fps, P1: 11.1 fps, max: 288 fps
1.47.22.14 D3D12
Intel Core Ultra 7 165U 3.8GHz
Graphics 4-Core
min: 7.8 fps, P1: 12.8 fps, max: 139.4 fps
1.47.22.14 D3D12
Intel Core Ultra 7 165U 3.8GHz
Graphics 4-Core
min: 21.1 fps, P1: 24.8 fps, max: 49.5 fps
1.47.22.14 D3D12
Intel Core Ultra 7 155H 3.8GHz
Arc 8-Core
min: 5 fps, P1: 5 fps, max: 247 fps
1.47.22.14 D3D12
Intel Core Ultra 7 155H 3.8GHz
Arc 8-Core
min: 7.1 fps, P1: 10.2 fps, max: 136.3 fps
1.47.22.14 D3D12
Intel Core Ultra 7 155H 3.8GHz
Arc 8-Core
min: 5 fps, P1: 6.04 fps, max: 277 fps
1.47.22.14 D3D12
Intel Core Ultra 7 155H 3.8GHz
Arc 8-Core
min: 5 fps, P1: 5 fps, max: 239 fps
1.47.22.14 D3D12
Intel Core Ultra 7 155H 3.8GHz
Arc 8-Core
min: 5 fps, P1: 9.64 fps, max: 194.6 fps
1.47.22.14 D3D12
Intel Core Ultra 7 155H 3.8GHz
Arc 8-Core
min: 5 fps, P1: 7.15 fps, max: 306 fps
1.47.22.14 D3D12
Intel Core Ultra 7 155H 3.8GHz
Arc 8-Core
min: 5 fps, P1: 7.28 fps, max: 307 fps
1.47.22.14 D3D12
Intel Core Ultra 7 155H 3.8GHz
Arc 8-Core
min: 6.8 fps, P1: 14.4 fps, max: 316 fps
1.47.22.14 D3D12
Intel Core Ultra 7 155H 3.8GHz
Arc 8-Core
min: 5.5 fps, P1: 11.5 fps, max: 309 fps
1.47.22.14 D3D12
Intel Core Ultra 7 155H 3.8GHz
Arc 8-Core
min: 23.2 fps, P1: 25.6 fps, max: 189.3 fps
1.47.22.14 D3D12
Intel Core Ultra 7 155H 3.8GHz
Arc 8-Core
min: 5.6 fps, P1: 9.57 fps, max: 312 fps
1.47.22.14 D3D12
Intel Core Ultra 7 155H 3.8GHz
Arc 8-Core
min: 5 fps, P1: 8.91 fps, max: 335 fps
1.47.22.14 D3D12
Intel Core Ultra 7 155H 3.8GHz
Arc 8-Core
min: 5 fps, P1: 20.8 fps, max: 346 fps
1.47.22.14 D3D12
Intel Core Ultra 9 185H 3.8GHz
Arc 8-Core
min: 6.9 fps, P1: 17.1 fps, max: 347 fps
1.47.22.14 D3D12
Intel Core Ultra 7 155H 3.8GHz
Arc 8-Core
min: 6.1 fps, P1: 10.4 fps, max: 338 fps
1.47.22.14 D3D12
Intel Core Ultra 7 155H 3.8GHz
Arc 8-Core
min: 5.9 fps, P1: 9.85 fps, max: 330 fps
1.47.22.14 D3D12
Intel Core Ultra 7 165H 3.8GHz
Arc 8-Core
min: 5.3 fps, P1: 10.1 fps, max: 307 fps
1.47.22.14 D3D12
Intel Core Ultra 7 155H 3.8GHz
Arc 8-Core
min: 12.8 fps, P1: 21.5 fps, max: 198.6 fps
1.47.22.14 D3D12
Intel Core Ultra 7 155H 3.8GHz
Arc 8-Core
min: 6.3 fps, P1: 16.2 fps, max: 336 fps
1.47.22.14 D3D12
Intel Core Ultra 7 155H 3.8GHz
Arc 8-Core
min: 5.9 fps, P1: 10.8 fps, max: 322 fps
1.47.22.14 D3D12
Intel Core Ultra 7 155H 3.8GHz
Arc 8-Core
min: 19.8 fps, P1: 23.1 fps, max: 238 fps
1.47.22.14 D3D12
Intel Core Ultra 7 155H 3.8GHz
Arc 8-Core
min: 6 fps, P1: 11.2 fps, max: 323 fps
1.47.22.14 D3D12
Intel Core Ultra 7 155H 3.8GHz
Arc 8-Core
min: 36.8 fps, P1: 42 fps, max: 113.6 fps
1.47.22.14 D3D12
Intel Core Ultra 7 155H 3.8GHz
Arc 8-Core
min: 5 fps, P1: 5.03 fps, max: 295 fps
1.47.22.14 D3D12
Intel Core Ultra 7 155H 3.8GHz
Arc 8-Core
min: 18.4 fps, P1: 29.1 fps, max: 167.8 fps
1.47.22.14 D3D12
Intel Core Ultra 7 155H 3.8GHz
Arc 8-Core
min: 5 fps, P1: 5 fps, max: 259 fps

Far Cry 5
2018Intel Core Ultra 5 125U 3.6GHz
Graphics 4-Core
min: 7 fps, max: 48 fps
Intel Core Ultra 5 125U 3.6GHz
Graphics 4-Core
min: 21 fps, max: 46 fps
Intel Core Ultra 7 155U 3.8GHz
Graphics 4-Core
min: 17 fps, max: 45 fps
Intel Core Ultra 5 125U 3.6GHz
Graphics 4-Core
min: 21 fps, max: 49 fps
Intel Core Ultra 5 125U 3.6GHz
Graphics 4-Core
min: 27 fps, max: 51 fps
Intel Core Ultra 5 125U 3.6GHz
Graphics 4-Core
min: 39 fps, max: 53 fps
Intel Core Ultra 7 164U 3.8GHz
Graphics 4-Core
min: 30 fps, max: 58 fps
Intel Core Ultra 7 155H 3.8GHz
Arc 8-Core
min: 11 fps, max: 86 fps
Intel Core Ultra 7 155H 3.8GHz
Arc 8-Core
min: 29 fps, max: 93 fps
Intel Core Ultra 5 125U 3.6GHz
Graphics 4-Core
min: 12 fps, max: 24 fps
Intel Core Ultra 7 155U 3.8GHz
Graphics 4-Core
min: 11 fps, max: 24 fps
Intel Core Ultra 5 125U 3.6GHz
Graphics 4-Core
min: 10 fps, max: 26 fps
Intel Core Ultra 5 125U 3.6GHz
Graphics 4-Core
min: 9 fps, max: 28 fps
Intel Core Ultra 5 125U 3.6GHz
Graphics 4-Core
min: 17 fps, max: 30 fps
Intel Core Ultra 7 164U 3.8GHz
Graphics 4-Core
min: 20 fps, max: 33 fps
Intel Core Ultra 7 155H 3.8GHz
Arc 8-Core
min: 26 fps, max: 51 fps
Intel Core Ultra 7 155H 3.8GHz
Arc 8-Core
min: 32 fps, max: 57 fps
Intel Core Ultra 5 125U 3.6GHz
Graphics 4-Core
min: 17 fps, max: 22 fps
Intel Core Ultra 7 155U 3.8GHz
Graphics 4-Core
min: 17 fps, max: 22 fps
Intel Core Ultra 5 125U 3.6GHz
Graphics 4-Core
min: 18 fps, max: 23 fps
Intel Core Ultra 5 125U 3.6GHz
Graphics 4-Core
min: 9 fps, max: 24 fps
Intel Core Ultra 5 125U 3.6GHz
Graphics 4-Core
min: 16 fps, max: 27 fps
Intel Core Ultra 5 125U 3.6GHz
Graphics 4-Core
min: 22 fps, max: 29 fps
Intel Core Ultra 7 164U 3.8GHz
Graphics 4-Core
min: 19 fps, max: 31 fps
Intel Core Ultra 7 155H 3.8GHz
Arc 8-Core
min: 29 fps, max: 47 fps
Intel Core Ultra 7 155H 3.8GHz
Arc 8-Core
min: 29 fps, max: 54 fps
Intel Core Ultra 5 125U 3.6GHz
Graphics 4-Core
min: 16 fps, max: 21 fps
Intel Core Ultra 5 125U 3.6GHz
Graphics 4-Core
min: 7 fps, max: 23 fps
Intel Core Ultra 7 155U 3.8GHz
Graphics 4-Core
min: 13 fps, max: 21 fps
Intel Core Ultra 5 125U 3.6GHz
Graphics 4-Core
min: 11 fps, max: 21 fps
Intel Core Ultra 5 125U 3.6GHz
Graphics 4-Core
min: 19 fps, max: 24 fps
Intel Core Ultra 5 125U 3.6GHz
Graphics 4-Core
min: 20 fps, max: 26 fps
Intel Core Ultra 7 164U 3.8GHz
Graphics 4-Core
min: 18 fps, max: 28 fps
Intel Core Ultra 7 155H 3.8GHz
Arc 8-Core
min: 23 fps, max: 45 fps
Intel Core Ultra 7 155H 3.8GHz
Arc 8-Core
min: 20 fps, max: 49 fps
Intel Core Ultra 7 155H 3.8GHz
Arc 8-Core
min: 20 fps, max: 33 fps

X-Plane 11.11
2018
Rocket League
2017
Dota 2 Reborn
2015Intel Core Ultra 7 165U 3.8GHz
Graphics 4-Core
min: 23.3 fps, max: -1 fps
Intel Core Ultra 5 134U 3.6GHz
Graphics 4-Core
min: 23.3 fps, max: -1 fps
Intel Core Ultra 5 125U 3.6GHz
Graphics 4-Core
min: 28.7 fps, max: -1 fps
Intel Core Ultra 7 165U 3.8GHz
Graphics 4-Core
min: 32 fps, max: -1 fps
Intel Core Ultra 7 155U 3.8GHz
Graphics 4-Core
min: 50.3 fps, max: -1 fps
Intel Core Ultra 7 164U 3.8GHz
Graphics 4-Core
min: 58.2 fps, max: -1 fps
Intel Core Ultra 7 155U 3.8GHz
Graphics 4-Core
min: 61.8 fps, max: -1 fps
Intel Core Ultra 5 125U 3.6GHz
Graphics 4-Core
min: 63.5 fps, max: -1 fps
Intel Core Ultra 5 125U 3.6GHz
Graphics 4-Core
min: 62.3 fps, max: -1 fps
Intel Core Ultra 7 165U 3.8GHz
Graphics 4-Core
min: 64.6 fps, max: -1 fps
Intel Core Ultra 7 165U 3.8GHz
Graphics 4-Core
min: 62.8 fps, max: -1 fps
Intel Core Ultra 5 125U 3.6GHz
Graphics 4-Core
min: 63.4 fps, max: -1 fps
Intel Core Ultra 5 125U 3.6GHz
Graphics 4-Core
min: 64 fps, max: -1 fps
Intel Core Ultra 5 125U 3.6GHz
Graphics 4-Core
min: 63.9 fps, max: -1 fps
Intel Core Ultra 7 165U 3.8GHz
Graphics 4-Core
min: 50.4 fps, max: -1 fps
Intel Core Ultra 5 125U 3.6GHz
Graphics 4-Core
min: 62 fps, max: -1 fps
Intel Core Ultra 7 155H 3.8GHz
Arc 8-Core
min: 35.7 fps, max: -1 fps
Intel Core Ultra 7 155H 3.8GHz
Arc 8-Core
min: 58.7 fps, max: -1 fps
Intel Core Ultra 7 155H 3.8GHz
Arc 8-Core
min: 48.8 fps, max: -1 fps
Intel Core Ultra 7 155H 3.8GHz
Arc 8-Core
min: 56.4 fps, max: -1 fps
Intel Core Ultra 9 185H 3.8GHz
Arc 8-Core
min: 55.8 fps, max: -1 fps
Intel Core Ultra 7 155H 3.8GHz
Arc 8-Core
min: 59.7 fps, max: -1 fps
Intel Core Ultra 7 155H 3.8GHz
Arc 8-Core
min: 58.4 fps, max: -1 fps
Intel Core Ultra 7 165U 3.8GHz
Graphics 4-Core
min: 24.6 fps, max: -1 fps
Intel Core Ultra 5 134U 3.6GHz
Graphics 4-Core
min: 24.6 fps, max: -1 fps
Intel Core Ultra 5 125U 3.6GHz
Graphics 4-Core
min: 27.9 fps, max: -1 fps
Intel Core Ultra 7 165U 3.8GHz
Graphics 4-Core
min: 29.8 fps, max: -1 fps
Intel Core Ultra 5 125U 3.6GHz
Graphics 4-Core
min: 37 fps, max: -1 fps
Intel Core Ultra 5 125U 3.6GHz
Graphics 4-Core
min: 28.8 fps, max: -1 fps
Intel Core Ultra 5 125U 3.6GHz
Graphics 4-Core
min: 32.5 fps, max: -1 fps
Intel Core Ultra 5 125U 3.6GHz
Graphics 4-Core
min: 29.1 fps, max: -1 fps
Intel Core Ultra 7 164U 3.8GHz
Graphics 4-Core
min: 43.4 fps, max: -1 fps
Intel Core Ultra 7 155U 3.8GHz
Graphics 4-Core
min: 33.2 fps, max: -1 fps
Intel Core Ultra 7 155U 3.8GHz
Graphics 4-Core
min: 41.9 fps, max: -1 fps
Intel Core Ultra 5 125U 3.6GHz
Graphics 4-Core
min: 38.1 fps, max: -1 fps
Intel Core Ultra 7 165U 3.8GHz
Graphics 4-Core
min: 42.7 fps, max: -1 fps
Intel Core Ultra 7 165U 3.8GHz
Graphics 4-Core
min: 50.9 fps, max: -1 fps
Intel Core Ultra 7 165U 3.8GHz
Graphics 4-Core
min: 55.4 fps, max: -1 fps
Intel Core Ultra 5 125U 3.6GHz
Graphics 4-Core
min: 52.3 fps, max: -1 fps
Intel Core Ultra 7 155H 3.8GHz
Arc 8-Core
min: 33.3 fps, max: -1 fps
Intel Core Ultra 7 155H 3.8GHz
Arc 8-Core
min: 31.4 fps, max: -1 fps
Intel Core Ultra 7 155H 3.8GHz
Arc 8-Core
min: 28.7 fps, max: -1 fps
Intel Core Ultra 9 185H 3.8GHz
Arc 8-Core
min: 49.6 fps, max: -1 fps
Intel Core Ultra 7 155H 3.8GHz
Arc 8-Core
min: 52.9 fps, max: -1 fps
Intel Core Ultra 7 155H 3.8GHz
Arc 8-Core
min: 54.2 fps, max: -1 fps
Intel Core Ultra 7 155H 3.8GHz
Arc 8-Core
min: 47.8 fps, max: -1 fps
Intel Core Ultra 7 165U 3.8GHz
Graphics 4-Core
min: 28.2 fps, max: -1 fps
Intel Core Ultra 5 134U 3.6GHz
Graphics 4-Core
min: 28.2 fps, max: -1 fps
Intel Core Ultra 5 125U 3.6GHz
Graphics 4-Core
min: 28.3 fps, max: -1 fps
Intel Core Ultra 7 165U 3.8GHz
Graphics 4-Core
min: 31.4 fps, max: -1 fps
Intel Core Ultra 5 125U 3.6GHz
Graphics 4-Core
min: 29.8 fps, max: -1 fps
Intel Core Ultra 7 164U 3.8GHz
Graphics 4-Core
min: 39.2 fps, max: -1 fps
Intel Core Ultra 7 155U 3.8GHz
Graphics 4-Core
min: 31.8 fps, max: -1 fps
Intel Core Ultra 5 125U 3.6GHz
Graphics 4-Core
min: 41.3 fps, max: -1 fps
Intel Core Ultra 7 165U 3.8GHz
Graphics 4-Core
min: 31.5 fps, max: -1 fps
Intel Core Ultra 7 155U 3.8GHz
Graphics 4-Core
min: 42.7 fps, max: -1 fps
Intel Core Ultra 7 165U 3.8GHz
Graphics 4-Core
min: 43.9 fps, max: -1 fps
Intel Core Ultra 7 165U 3.8GHz
Graphics 4-Core
min: 45.2 fps, max: -1 fps
Intel Core Ultra 5 125U 3.6GHz
Graphics 4-Core
min: 37.9 fps, max: -1 fps
Intel Core Ultra 5 125U 3.6GHz
Graphics 4-Core
min: 36.4 fps, max: -1 fps
Intel Core Ultra 5 125U 3.6GHz
Graphics 4-Core
min: 36.9 fps, max: -1 fps
Intel Core Ultra 5 125U 3.6GHz
Graphics 4-Core
min: 37.2 fps, max: -1 fps
Intel Core Ultra 7 155H 3.8GHz
Arc 8-Core
min: 34.5 fps, max: -1 fps
Intel Core Ultra 9 185H 3.8GHz
Arc 8-Core
min: 37.6 fps, max: -1 fps
Intel Core Ultra 7 155H 3.8GHz
Arc 8-Core
min: 36.9 fps, max: -1 fps
Intel Core Ultra 7 155H 3.8GHz
Arc 8-Core
min: 49.5 fps, max: -1 fps
Intel Core Ultra 7 155H 3.8GHz
Arc 8-Core
min: 49.5 fps, max: -1 fps
Intel Core Ultra 7 155H 3.8GHz
Arc 8-Core
min: 37.8 fps, max: -1 fps
Intel Core Ultra 7 155H 3.8GHz
Arc 8-Core
min: 54.8 fps, max: -1 fps
Intel Core Ultra 7 165U 3.8GHz
Graphics 4-Core
min: 25 fps, max: -1 fps
Intel Core Ultra 5 134U 3.6GHz
Graphics 4-Core
min: 25 fps, max: -1 fps
Intel Core Ultra 5 125U 3.6GHz
Graphics 4-Core
min: 27.7 fps, max: -1 fps
Intel Core Ultra 5 125U 3.6GHz
Graphics 4-Core
min: 28.8 fps, max: -1 fps
Intel Core Ultra 7 165U 3.8GHz
Graphics 4-Core
min: 31.4 fps, max: -1 fps
Intel Core Ultra 7 155U 3.8GHz
Graphics 4-Core
min: 29.4 fps, max: -1 fps
Intel Core Ultra 7 164U 3.8GHz
Graphics 4-Core
min: 38.5 fps, max: -1 fps
Intel Core Ultra 5 125U 3.6GHz
Graphics 4-Core
min: 40.1 fps, max: -1 fps
Intel Core Ultra 7 155U 3.8GHz
Graphics 4-Core
min: 41.9 fps, max: -1 fps
Intel Core Ultra 5 125U 3.6GHz
Graphics 4-Core
min: 33.1 fps, max: -1 fps
Intel Core Ultra 5 125U 3.6GHz
Graphics 4-Core
min: 31.1 fps, max: -1 fps
Intel Core Ultra 7 165U 3.8GHz
Graphics 4-Core
min: 42.7 fps, max: -1 fps
Intel Core Ultra 5 125U 3.6GHz
Graphics 4-Core
min: 37.5 fps, max: -1 fps
Intel Core Ultra 5 125U 3.6GHz
Graphics 4-Core
min: 36.3 fps, max: -1 fps
Intel Core Ultra 7 165U 3.8GHz
Graphics 4-Core
min: 38.8 fps, max: -1 fps
Intel Core Ultra 7 155H 3.8GHz
Arc 8-Core
min: 33.9 fps, max: -1 fps
Intel Core Ultra 7 155H 3.8GHz
Arc 8-Core
min: 35.2 fps, max: -1 fps
Intel Core Ultra 7 155H 3.8GHz
Arc 8-Core
min: 48.8 fps, max: -1 fps
Intel Core Ultra 7 155H 3.8GHz
Arc 8-Core
min: 39.9 fps, max: -1 fps
Intel Core Ultra 7 155H 3.8GHz
Arc 8-Core
min: 49.1 fps, max: -1 fps
Intel Core Ultra 7 155H 3.8GHz
Arc 8-Core
min: 50.8 fps, max: -1 fps
Intel Core Ultra 7 155H 3.8GHz
Arc 8-Core
min: 55.9 fps, max: -1 fps

The Witcher 3
2015Intel Core Ultra 5 125U 3.6GHz
Graphics 4-Core
min: 56 fps, max: 71 fps
Intel Core Ultra 5 125U 3.6GHz
Graphics 4-Core
min: 74 fps, P1: 74.34 fps, max: 88 fps
Intel Core Ultra 5 125U 3.6GHz
Graphics 4-Core
min: 78 fps, max: 91 fps
Intel Core Ultra 5 125U 3.6GHz
Graphics 4-Core
min: 75 fps, max: 95 fps
Intel Core Ultra 7 165U 3.8GHz
Graphics 4-Core
min: 75 fps, max: 101 fps
Intel Core Ultra 7 155U 3.8GHz
Graphics 4-Core
min: 75 fps, max: 101 fps
Intel Core Ultra 7 155H 3.8GHz
Arc 8-Core
min: 36.4 fps, P0.1: 62.1 fps, P1: 99.1 fps, max: 349 fps
Intel Core Ultra 7 155H 3.8GHz
Arc 8-Core
min: 116 fps, max: 146 fps
Intel Core Ultra 9 185H 3.8GHz
Arc 8-Core
min: 26.9 fps, P0.1: 57.9 fps, P1: 101.9 fps, max: 349 fps
Intel Core Ultra 5 125U 3.6GHz
Graphics 4-Core
min: 39 fps, max: 44 fps
Intel Core Ultra 5 125U 3.6GHz
Graphics 4-Core
min: 40 fps, max: 54 fps
Intel Core Ultra 5 125U 3.6GHz
Graphics 4-Core
min: 46 fps, P1: 46.32 fps, max: 55 fps
Intel Core Ultra 5 125U 3.6GHz
Graphics 4-Core
min: 47 fps, max: 54 fps
Intel Core Ultra 7 155H 3.8GHz
Arc 8-Core
min: 43.6 fps, P0.1: 56.8 fps, P1: 64 fps, max: 275 fps
Intel Core Ultra 9 185H 3.8GHz
Arc 8-Core
min: 38.5 fps, P0.1: 56.2 fps, P1: 65 fps, max: 232 fps
Intel Core Ultra 5 125U 3.6GHz
Graphics 4-Core
min: 17 fps, max: 24 fps
Intel Core Ultra 5 125U 3.6GHz
Graphics 4-Core
min: 24 fps, P1: 24 fps, max: 31 fps
Intel Core Ultra 5 125U 3.6GHz
Graphics 4-Core
min: 25 fps, max: 32 fps
Intel Core Ultra 5 125U 3.6GHz
Graphics 4-Core
min: 27 fps, max: 30 fps
Intel Core Ultra 7 155H 3.8GHz
Arc 8-Core
min: 26.8 fps, P0.1: 32 fps, P1: 37.7 fps, max: 88.2 fps
Intel Core Ultra 9 185H 3.8GHz
Arc 8-Core
min: 28.7 fps, P0.1: 32.6 fps, P1: 37.1 fps, max: 100.8 fps
Intel Core Ultra 5 125U 3.6GHz
Graphics 4-Core
min: 10 fps, max: 14 fps
Intel Core Ultra 5 125U 3.6GHz
Graphics 4-Core
min: 9 fps, P1: 10.4 fps, max: 16 fps
Intel Core Ultra 5 125U 3.6GHz
Graphics 4-Core
min: 11 fps, max: 18 fps
Intel Core Ultra 5 125U 3.6GHz
Graphics 4-Core
min: 13 fps, max: 18 fps
Intel Core Ultra 7 165U 3.8GHz
Graphics 4-Core
min: 15 fps, P1: 15 fps, max: 18 fps
Intel Core Ultra 7 155H 3.8GHz
Arc 8-Core
min: 11 fps, P1: 13 fps, max: 16 fps
Intel Core Ultra 7 155H 3.8GHz
Arc 8-Core
min: 11 fps, P1: 13 fps, max: 26 fps
Intel Core Ultra 7 155H 3.8GHz
Arc 8-Core
min: 1 fps, P1: 2.6 fps, max: 25 fps
Intel Core Ultra 7 155H 3.8GHz
Arc 8-Core
min: 16 fps, P1: 18 fps, max: 24 fps
Intel Core Ultra 9 185H 3.8GHz
Arc 8-Core
min: 8 fps, P1: 15 fps, max: 25 fps
Intel Core Ultra 7 155H 3.8GHz
Arc 8-Core
min: 16 fps, P1: 19 fps, max: 27 fps
Intel Core Ultra 7 155H 3.8GHz
Arc 8-Core
min: 13 fps, P1: 15 fps, max: 28 fps
Intel Core Ultra 7 155H 3.8GHz
Arc 8-Core
min: 20 fps, P1: 21 fps, max: 24 fps
Intel Core Ultra 7 155H 3.8GHz
Arc 8-Core
min: 12 fps, P1: 21 fps, max: 26 fps
Intel Core Ultra 7 155H 3.8GHz
Arc 8-Core
min: 22 fps, P1: 22 fps, max: 26 fps
Intel Core Ultra 9 185H 3.8GHz
Arc 8-Core
min: 6.26 fps, P0.1: 10.2 fps, P1: 14.1 fps, max: 108.6 fps
Intel Core Ultra 7 155H 3.8GHz
Arc 8-Core
min: 12 fps, P0.1: 16.1 fps, P1: 21.8 fps, max: 28.1 fps
Intel Core Ultra 7 155H 3.8GHz
Arc 8-Core
min: 23 fps, P1: 24 fps, max: 28 fps
Intel Core Ultra 7 155H 3.8GHz
Arc 8-Core
min: 24 fps, P1: 24 fps, max: 28 fps
Intel Core Ultra 9 185H 3.8GHz
Arc 8-Core
min: 16 fps, P1: 22 fps, max: 28 fps
Intel Core Ultra 7 155H 3.8GHz
Arc 8-Core
min: 25 fps, P1: 30 fps, max: 49 fps

GTA V
2015Intel Core Ultra 5 134U 3.6GHz
Graphics 4-Core
min: 7.37 fps, P1: 31.3 fps, max: 146.7 fps
Intel Core Ultra 7 165U 3.8GHz
Graphics 4-Core
min: 9.2 fps, P1: 55.6 fps, max: 174.1 fps
Intel Core Ultra 7 165U 3.8GHz
Graphics 4-Core
min: 13.6 fps, P1: 40 fps, max: 210 fps
Intel Core Ultra 5 125U 3.6GHz
Graphics 4-Core
min: 14 fps, P1: 47.6 fps, max: 234 fps
Intel Core Ultra 5 125U 3.6GHz
Graphics 4-Core
min: 17 fps, P1: 58.8 fps, max: 191.1 fps
Intel Core Ultra 7 155U 3.8GHz
Graphics 4-Core
min: 13.2 fps, P1: 62.5 fps, max: 221 fps
Intel Core Ultra 7 164U 3.8GHz
Graphics 4-Core
min: 16.7 fps, P1: 71.4 fps, max: 215 fps
Intel Core Ultra 7 155U 3.8GHz
Graphics 4-Core
min: 4.44 fps, P1: 62.5 fps, max: 241 fps
Intel Core Ultra 5 125U 3.6GHz
Graphics 4-Core
min: 5.14 fps, P1: 62.5 fps, max: 286 fps
Intel Core Ultra 7 165U 3.8GHz
Graphics 4-Core
min: 5.53 fps, P1: 76.9 fps, max: 276 fps
Intel Core Ultra 5 125U 3.6GHz
Graphics 4-Core
min: 3.79 fps, P1: 62.5 fps, max: 334 fps
Intel Core Ultra 7 155H 3.8GHz
Arc 8-Core
min: 6.8 fps, P1: 27.8 fps, max: 208 fps
Intel Core Ultra 7 155H 3.8GHz
Arc 8-Core
min: 4.03 fps, P1: 27 fps, max: 262 fps
Intel Core Ultra 7 155H 3.8GHz
Arc 8-Core
min: 5.22 fps, P1: 45.5 fps, max: 239 fps
Intel Core Ultra 7 155H 3.8GHz
Arc 8-Core
min: 11.6 fps, P1: 52.6 fps, max: 249 fps
Intel Core Ultra 7 155H 3.8GHz
Arc 8-Core
min: 4.09 fps, P1: 83.3 fps, max: 238 fps
Intel Core Ultra 7 155H 3.8GHz
Arc 8-Core
min: 6.84 fps, P1: 62.5 fps, max: 288 fps
Intel Core Ultra 7 155H 3.8GHz
Arc 8-Core
min: 4.96 fps, P1: 71.4 fps, max: 279 fps
Intel Core Ultra 7 155H 3.8GHz
Arc 8-Core
min: 2.1 fps, P1: 34.5 fps, max: 370 fps
Intel Core Ultra 9 185H 3.8GHz
Arc 8-Core
min: 4.49 fps, P1: 58.8 fps, max: 313 fps
Intel Core Ultra 7 155H 3.8GHz
Arc 8-Core
min: 4.63 fps, P1: 83.3 fps, max: 341 fps
Intel Core Ultra 7 155H 3.8GHz
Arc 8-Core
min: 4.09 fps, P1: 76.9 fps, max: 290 fps
Intel Core Ultra 7 155H 3.8GHz
Arc 8-Core
min: 5.16 fps, P1: 83.3 fps, max: 354 fps
Intel Core Ultra 7 155H 3.8GHz
Arc 8-Core
min: 4.62 fps, P1: 71.4 fps, max: 352 fps
Intel Core Ultra 7 155H 3.8GHz
Arc 8-Core
min: 5.62 fps, P1: 76.9 fps, max: 330 fps
Intel Core Ultra 7 155H 3.8GHz
Arc 8-Core
min: 3.87 fps, P1: 90.9 fps, max: 283 fps
Intel Core Ultra 7 155H 3.8GHz
Arc 8-Core
min: 4.43 fps, P1: 83.3 fps, max: 332 fps
Intel Core Ultra 9 185H 3.8GHz
Arc 8-Core
min: 4.96 fps, P1: 100 fps, max: 341 fps
Intel Core Ultra 7 155H 3.8GHz
Arc 8-Core
min: 4.34 fps, P1: 76.9 fps, max: 355 fps
Intel Core Ultra 7 155H 3.8GHz
Arc 8-Core
min: 3.16 fps, P1: 76.9 fps, max: 308 fps
Intel Core Ultra 7 165H 3.8GHz
Arc 8-Core
min: 4.68 fps, P1: 83.3 fps, max: 325 fps
Intel Core Ultra 9 185H 3.8GHz
Arc 8-Core
min: 3.78 fps, P1: 111.1 fps, max: 332 fps
Intel Core Ultra 7 155H 3.8GHz
Arc 8-Core
min: 4.25 fps, P1: 83.3 fps, max: 306 fps
Intel Core Ultra 9 185H 3.8GHz
Arc 8-Core
min: 4.63 fps, P1: 111.1 fps, max: 341 fps
Intel Core Ultra 9 185H 3.8GHz
Arc 8-Core
min: 3.77 fps, P1: 100 fps, max: 389 fps
Intel Core Ultra 7 155H 3.8GHz
Arc 8-Core
min: 5.28 fps, P1: 111.1 fps, max: 378 fps
Intel Core Ultra 7 155H 3.8GHz
Arc 8-Core
min: 3.43 fps, P1: 83.3 fps, max: 343 fps
Intel Core Ultra 7 155H 3.8GHz
Arc 8-Core
min: 5.12 fps, P1: 100 fps, max: 470 fps
Intel Core Ultra 7 155H 3.8GHz
Arc 8-Core
min: 3.6 fps, P1: 111.1 fps, max: 308 fps
Intel Core Ultra 7 155H 3.8GHz
Arc 8-Core
min: 3.23 fps, P1: 111.1 fps, max: 350 fps
Intel Core Ultra 7 155H 3.8GHz
Arc 8-Core
min: 3.46 fps, P1: 111.1 fps, max: 352 fps
Intel Core Ultra 5 125U 3.6GHz
Graphics 4-Core
min: 10.5 fps, P1: 52.6 fps, max: 178.6 fps
Intel Core Ultra 7 155U 3.8GHz
Graphics 4-Core
min: 8.3 fps, P1: 55.6 fps, max: 186.3 fps
Intel Core Ultra 7 165U 3.8GHz
Graphics 4-Core
min: 8.88 fps, P1: 40 fps, max: 163.9 fps
Intel Core Ultra 7 164U 3.8GHz
Graphics 4-Core
min: 8.89 fps, P1: 58.8 fps, max: 209 fps
Intel Core Ultra 5 134U 3.6GHz
Graphics 4-Core
min: 10.6 fps, P1: 37 fps, max: 199.9 fps
Intel Core Ultra 5 125U 3.6GHz
Graphics 4-Core
min: 7.35 fps, P1: 52.6 fps, max: 240 fps
Intel Core Ultra 7 165U 3.8GHz
Graphics 4-Core
min: 8.4 fps, P1: 50 fps, max: 210 fps
Intel Core Ultra 7 155U 3.8GHz
Graphics 4-Core
min: 12.9 fps, P1: 66.7 fps, max: 209 fps
Intel Core Ultra 5 125U 3.6GHz
Graphics 4-Core
min: 5.97 fps, P1: 62.5 fps, max: 202 fps
Intel Core Ultra 5 125U 3.6GHz
Graphics 4-Core
min: 6.1 fps, P1: 58.8 fps, max: 254 fps
Intel Core Ultra 7 165U 3.8GHz
Graphics 4-Core
min: 8.51 fps, P1: 71.4 fps, max: 244 fps
Intel Core Ultra 7 155H 3.8GHz
Arc 8-Core
min: 3.89 fps, P1: 26.3 fps, max: 130 fps
Intel Core Ultra 7 155H 3.8GHz
Arc 8-Core
min: 0.4928 fps, P1: 19.2 fps, max: 227 fps
Intel Core Ultra 7 155H 3.8GHz
Arc 8-Core
min: 9.41 fps, P1: 62.5 fps, max: 177.7 fps
Intel Core Ultra 7 155H 3.8GHz
Arc 8-Core
min: 12.8 fps, P1: 41.7 fps, max: 187.2 fps
Intel Core Ultra 7 155H 3.8GHz
Arc 8-Core
min: 13.2 fps, P1: 43.5 fps, max: 260 fps
Intel Core Ultra 7 155H 3.8GHz
Arc 8-Core
min: 2.19 fps, P1: 35.7 fps, max: 305 fps
Intel Core Ultra 7 155H 3.8GHz
Arc 8-Core
min: 12.2 fps, P1: 71.4 fps, max: 263 fps
Intel Core Ultra 7 155H 3.8GHz
Arc 8-Core
min: 9.14 fps, P1: 71.4 fps, max: 222 fps
Intel Core Ultra 7 155H 3.8GHz
Arc 8-Core
min: 14.7 fps, P1: 58.8 fps, max: 257 fps
Intel Core Ultra 7 155H 3.8GHz
Arc 8-Core
min: 4.39 fps, P1: 58.8 fps, max: 257 fps
Intel Core Ultra 7 155H 3.8GHz
Arc 8-Core
min: 5.86 fps, P1: 76.9 fps, max: 261 fps
Intel Core Ultra 7 155H 3.8GHz
Arc 8-Core
min: 7.99 fps, P1: 71.4 fps, max: 297 fps
Intel Core Ultra 7 155H 3.8GHz
Arc 8-Core
min: 6.1 fps, P1: 76.9 fps, max: 276 fps
Intel Core Ultra 9 185H 3.8GHz
Arc 8-Core
min: 4.65 fps, P1: 62.5 fps, max: 275 fps
Intel Core Ultra 7 155H 3.8GHz
Arc 8-Core
min: 4.02 fps, P1: 76.9 fps, max: 270 fps
Intel Core Ultra 7 155H 3.8GHz
Arc 8-Core
min: 6.1 fps, P1: 55.6 fps, max: 336 fps
Intel Core Ultra 7 155H 3.8GHz
Arc 8-Core
min: 8 fps, P1: 66.7 fps, max: 317 fps
Intel Core Ultra 9 185H 3.8GHz
Arc 8-Core
min: 5.95 fps, P1: 76.9 fps, max: 337 fps
Intel Core Ultra 7 155H 3.8GHz
Arc 8-Core
min: 4.82 fps, P1: 76.9 fps, max: 300 fps
Intel Core Ultra 9 185H 3.8GHz
Arc 8-Core
min: 3.68 fps, P1: 83.3 fps, max: 340 fps
Intel Core Ultra 7 165H 3.8GHz
Arc 8-Core
min: 4.24 fps, P1: 71.4 fps, max: 346 fps
Intel Core Ultra 7 155H 3.8GHz
Arc 8-Core
min: 4.19 fps, P1: 66.7 fps, max: 339 fps
Intel Core Ultra 9 185H 3.8GHz
Arc 8-Core
min: 4.46 fps, P1: 100 fps, max: 298 fps
Intel Core Ultra 7 155H 3.8GHz
Arc 8-Core
min: 4.34 fps, P1: 83.3 fps, max: 324 fps
Intel Core Ultra 9 185H 3.8GHz
Arc 8-Core
min: 4.07 fps, P1: 100 fps, max: 390 fps
Intel Core Ultra 7 155H 3.8GHz
Arc 8-Core
min: 4.92 fps, P1: 100 fps, max: 275 fps
Intel Core Ultra 7 155H 3.8GHz
Arc 8-Core
min: 5.65 fps, P1: 100 fps, max: 371 fps
Intel Core Ultra 7 155H 3.8GHz
Arc 8-Core
min: 4.86 fps, P1: 100 fps, max: 329 fps
Intel Core Ultra 7 155H 3.8GHz
Arc 8-Core
min: 4.77 fps, P1: 100 fps, max: 359 fps
Intel Core Ultra 7 155H 3.8GHz
Arc 8-Core
min: 4.66 fps, P1: 111.1 fps, max: 331 fps
Intel Core Ultra 7 155H 3.8GHz
Arc 8-Core
min: 3.24 fps, P1: 111.1 fps, max: 355 fps
Intel Core Ultra 7 155U 3.8GHz
Graphics 4-Core
min: 1.725 fps, P1: 12 fps, max: 93.5 fps
Intel Core Ultra 7 164U 3.8GHz
Graphics 4-Core
min: 2.25 fps, P1: 12.5 fps, max: 80.4 fps
Intel Core Ultra 5 134U 3.6GHz
Graphics 4-Core
min: 2.97 fps, P1: 15.9 fps, max: 88.5 fps
Intel Core Ultra 5 125U 3.6GHz
Graphics 4-Core
min: 3 fps, P1: 15.2 fps, max: 80.5 fps
Intel Core Ultra 5 125U 3.6GHz
Graphics 4-Core
min: 2.05 fps, P1: 14.7 fps, max: 82 fps
Intel Core Ultra 5 125U 3.6GHz
Graphics 4-Core
min: 2.35 fps, P1: 15.6 fps, max: 106.2 fps
Intel Core Ultra 7 165U 3.8GHz
Graphics 4-Core
min: 1.866 fps, P1: 14.9 fps, max: 91.7 fps
Intel Core Ultra 5 125U 3.6GHz
Graphics 4-Core
min: 2.61 fps, P1: 15.6 fps, max: 116.7 fps
Intel Core Ultra 7 165U 3.8GHz
Graphics 4-Core
min: 2.16 fps, P1: 11.6 fps, max: 82.2 fps
Intel Core Ultra 7 165U 3.8GHz
Graphics 4-Core
min: 2.14 fps, P1: 13.5 fps, max: 96 fps
Intel Core Ultra 7 155U 3.8GHz
Graphics 4-Core
min: 4.04 fps, P1: 19.6 fps, max: 112.7 fps
Intel Core Ultra 7 155H 3.8GHz
Arc 8-Core
min: 0.3962 fps, P1: 2.04 fps, max: 118.7 fps
Intel Core Ultra 7 155H 3.8GHz
Arc 8-Core
min: 1.414 fps, P1: 6.02 fps, max: 87 fps
Intel Core Ultra 7 155H 3.8GHz
Arc 8-Core
min: 3.2 fps, P1: 17.2 fps, max: 99.2 fps
Intel Core Ultra 7 155H 3.8GHz
Arc 8-Core
min: 5.31 fps, P1: 15.6 fps, max: 106.5 fps
Intel Core Ultra 7 155H 3.8GHz
Arc 8-Core
min: 2.94 fps, P1: 22.7 fps, max: 181.5 fps
Intel Core Ultra 7 155H 3.8GHz
Arc 8-Core
min: 6.83 fps, P1: 23.3 fps, max: 70.5 fps
Intel Core Ultra 7 155H 3.8GHz
Arc 8-Core
min: 2.04 fps, P1: 20.8 fps, max: 109.1 fps
Intel Core Ultra 7 155H 3.8GHz
Arc 8-Core
min: 2.29 fps, P1: 20.8 fps, max: 112.9 fps
Intel Core Ultra 7 155H 3.8GHz
Arc 8-Core
min: 1.688 fps, P1: 22.2 fps, max: 122.9 fps
Intel Core Ultra 7 155H 3.8GHz
Arc 8-Core
min: 2.16 fps, P1: 22.2 fps, max: 115.8 fps
Intel Core Ultra 7 155H 3.8GHz
Arc 8-Core
min: 2.83 fps, P1: 22.2 fps, max: 200 fps
Intel Core Ultra 7 155H 3.8GHz
Arc 8-Core
min: 2.44 fps, P1: 16.7 fps, max: 142.5 fps
Intel Core Ultra 7 155H 3.8GHz
Arc 8-Core
min: 1.027 fps, P1: 4.59 fps, max: 113.6 fps
Intel Core Ultra 7 155H 3.8GHz
Arc 8-Core
min: 2.94 fps, P1: 22.2 fps, max: 113.8 fps
Intel Core Ultra 7 155H 3.8GHz
Arc 8-Core
min: 3.03 fps, P1: 24.4 fps, max: 139.8 fps
Intel Core Ultra 7 155H 3.8GHz
Arc 8-Core
min: 4.35 fps, P1: 23.8 fps, max: 103.6 fps
Intel Core Ultra 7 155H 3.8GHz
Arc 8-Core
min: 1.994 fps, P1: 7.58 fps, max: 190.4 fps
Intel Core Ultra 7 155H 3.8GHz
Arc 8-Core
min: 4.48 fps, P1: 23.3 fps, max: 99.9 fps
Intel Core Ultra 7 155H 3.8GHz
Arc 8-Core
min: 2.94 fps, P1: 27 fps, max: 92.9 fps
Intel Core Ultra 9 185H 3.8GHz
Arc 8-Core
min: 5.32 fps, P1: 23.8 fps, max: 90 fps
Intel Core Ultra 7 155H 3.8GHz
Arc 8-Core
min: 3.06 fps, P1: 28.6 fps, max: 81.3 fps
Intel Core Ultra 7 155H 3.8GHz
Arc 8-Core
min: 3.49 fps, P1: 28.6 fps, max: 152.5 fps
Intel Core Ultra 9 185H 3.8GHz
Arc 8-Core
min: 3.3 fps, P1: 30.3 fps, max: 102.5 fps
Intel Core Ultra 7 155H 3.8GHz
Arc 8-Core
min: 5.85 fps, P1: 27.8 fps, max: 127.7 fps
Intel Core Ultra 9 185H 3.8GHz
Arc 8-Core
min: 3.12 fps, P1: 30.3 fps, max: 188 fps
Intel Core Ultra 7 155H 3.8GHz
Arc 8-Core
min: 3.29 fps, P1: 27.8 fps, max: 262 fps
Intel Core Ultra 7 165H 3.8GHz
Arc 8-Core
min: 2.29 fps, P1: 25.6 fps, max: 118.4 fps
Intel Core Ultra 7 155H 3.8GHz
Arc 8-Core
min: 2.85 fps, P1: 21.7 fps, max: 121.9 fps
Intel Core Ultra 9 185H 3.8GHz
Arc 8-Core
min: 3.49 fps, P1: 32.3 fps, max: 126.1 fps
Intel Core Ultra 7 155H 3.8GHz
Arc 8-Core
min: 3.17 fps, P1: 32.3 fps, max: 131.7 fps
Intel Core Ultra 7 155H 3.8GHz
Arc 8-Core
min: 2.84 fps, P1: 28.6 fps, max: 105.9 fps
Intel Core Ultra 9 185H 3.8GHz
Arc 8-Core
min: 3.82 fps, P1: 33.3 fps, max: 116.9 fps
Intel Core Ultra 7 155H 3.8GHz
Arc 8-Core
min: 3.3 fps, P1: 38.5 fps, max: 120.6 fps
Intel Core Ultra 7 155U 3.8GHz
Graphics 4-Core
min: 1.883 fps, P1: 5 fps, max: 67.8 fps
Intel Core Ultra 7 164U 3.8GHz
Graphics 4-Core
min: 1.677 fps, P1: 4.78 fps, max: 62.6 fps
Intel Core Ultra 5 125U 3.6GHz
Graphics 4-Core
min: 2.29 fps, P1: 6.29 fps, max: 79.2 fps
Intel Core Ultra 5 134U 3.6GHz
Graphics 4-Core
min: 2.4 fps, P1: 6.54 fps, max: 86.9 fps
Intel Core Ultra 5 125U 3.6GHz
Graphics 4-Core
min: 1.788 fps, P1: 6.33 fps, max: 63.5 fps
Intel Core Ultra 5 125U 3.6GHz
Graphics 4-Core
min: 2.6 fps, P1: 6.29 fps, max: 79.8 fps
Intel Core Ultra 5 125U 3.6GHz
Graphics 4-Core
min: 1.867 fps, P1: 6.33 fps, max: 100.4 fps
Intel Core Ultra 7 165U 3.8GHz
Graphics 4-Core
min: 1.463 fps, P1: 6.33 fps, max: 57.8 fps
Intel Core Ultra 7 165U 3.8GHz
Graphics 4-Core
min: 1.588 fps, P1: 6.54 fps, max: 84.7 fps
Intel Core Ultra 7 165U 3.8GHz
Graphics 4-Core
min: 1.644 fps, P1: 7.41 fps, max: 38.1 fps
Intel Core Ultra 7 155U 3.8GHz
Graphics 4-Core
min: 2.71 fps, P1: 7.46 fps, max: 88.1 fps
Intel Core Ultra 7 155H 3.8GHz
Arc 8-Core
min: 0.2412 fps, P1: 0.903 fps, max: 66 fps
Intel Core Ultra 7 155H 3.8GHz
Arc 8-Core
min: 1.989 fps, P1: 4.98 fps, max: 43.6 fps
Intel Core Ultra 7 155H 3.8GHz
Arc 8-Core
min: 0.636 fps, P1: 4.48 fps, max: 47.6 fps
Intel Core Ultra 7 155H 3.8GHz
Arc 8-Core
min: 1.718 fps, P1: 8.77 fps, max: 72.1 fps
Intel Core Ultra 7 155H 3.8GHz
Arc 8-Core
min: 3.95 fps, P1: 8.77 fps, max: 85.8 fps
Intel Core Ultra 7 155H 3.8GHz
Arc 8-Core
min: 3.05 fps, P1: 8.77 fps, max: 48.3 fps
Intel Core Ultra 7 155H 3.8GHz
Arc 8-Core
min: 2.12 fps, P1: 9.35 fps, max: 53.3 fps
Intel Core Ultra 7 155H 3.8GHz
Arc 8-Core
min: 1.703 fps, P1: 8 fps, max: 34.2 fps
Intel Core Ultra 7 155H 3.8GHz
Arc 8-Core
min: 2.1 fps, P1: 9.35 fps, max: 107.7 fps
Intel Core Ultra 7 155H 3.8GHz
Arc 8-Core
min: 2.72 fps, P1: 9.09 fps, max: 46.4 fps
Intel Core Ultra 7 155H 3.8GHz
Arc 8-Core
min: 2.71 fps, P1: 10.6 fps, max: 148.3 fps
Intel Core Ultra 7 155H 3.8GHz
Arc 8-Core
min: 0.852 fps, P1: 2.6 fps, max: 100.5 fps
Intel Core Ultra 7 155H 3.8GHz
Arc 8-Core
min: 2.16 fps, P1: 9.09 fps, max: 102.6 fps
Intel Core Ultra 7 155H 3.8GHz
Arc 8-Core
min: 4.16 fps, P1: 9.17 fps, max: 50.8 fps
Intel Core Ultra 7 155H 3.8GHz
Arc 8-Core
min: 1.247 fps, P1: 7.75 fps, max: 52.6 fps
Intel Core Ultra 9 185H 3.8GHz
Arc 8-Core
min: 0.635 fps, P1: 5.56 fps, max: 96.9 fps
Intel Core Ultra 7 155H 3.8GHz
Arc 8-Core
min: 2.21 fps, P1: 10.8 fps, max: 90.8 fps
Intel Core Ultra 7 155H 3.8GHz
Arc 8-Core
min: 9.76 fps, P1: 11.4 fps, max: 41.1 fps
Intel Core Ultra 9 185H 3.8GHz
Arc 8-Core
min: 3.06 fps, P1: 12 fps, max: 81.2 fps
Intel Core Ultra 7 155H 3.8GHz
Arc 8-Core
min: 1.337 fps, P1: 3.02 fps, max: 115.5 fps
Intel Core Ultra 7 155H 3.8GHz
Arc 8-Core
min: 2.93 fps, P1: 11.4 fps, max: 82.9 fps
Intel Core Ultra 7 155H 3.8GHz
Arc 8-Core
min: 2.73 fps, P1: 11.4 fps, max: 78.7 fps
Intel Core Ultra 9 185H 3.8GHz
Arc 8-Core
min: 3.13 fps, P1: 12.8 fps, max: 68.7 fps
Intel Core Ultra 7 155H 3.8GHz
Arc 8-Core
min: 2.34 fps, P1: 11.6 fps, max: 81 fps
Intel Core Ultra 9 185H 3.8GHz
Arc 8-Core
min: 3.08 fps, P1: 12.7 fps, max: 71.8 fps
Intel Core Ultra 7 165H 3.8GHz
Arc 8-Core
min: 1.72 fps, P1: 12.3 fps, max: 79.3 fps
Intel Core Ultra 7 155H 3.8GHz
Arc 8-Core
min: 2.07 fps, P1: 12 fps, max: 135.5 fps
Intel Core Ultra 7 155H 3.8GHz
Arc 8-Core
min: 3.01 fps, P1: 13.5 fps, max: 83.6 fps
Intel Core Ultra 7 155H 3.8GHz
Arc 8-Core
min: 2.18 fps, P1: 11.9 fps, max: 73.6 fps
Intel Core Ultra 9 185H 3.8GHz
Arc 8-Core
min: 2.77 fps, P1: 14.5 fps, max: 74.6 fps
Intel Core Ultra 7 155H 3.8GHz
Arc 8-Core
min: 2.02 fps, P1: 11.5 fps, max: 54.1 fps
Intel Core Ultra 7 155H 3.8GHz
Arc 8-Core
min: 2.88 fps, P1: 15.9 fps, max: 92.3 fps
Intel Core Ultra 7 155H 3.8GHz
Arc 8-Core
min: 1.96 fps, P1: 6.99 fps, max: 66.9 fps
Intel Core Ultra 7 155H 3.8GHz
Arc 8-Core
min: 2.11 fps, P1: 9.17 fps, max: 118.1 fps
Intel Core Ultra 7 155H 3.8GHz
Arc 8-Core
min: 2.2 fps, P1: 7.46 fps, max: 83.7 fps
BioShock Infinite
2013Average Gaming Intel Graphics 4-Cores iGPU (Arc) → 100%
Average Gaming 30-70 fps → 100%
Average Gaming Intel UHD Graphics 617 → 49%
Average Gaming 30-70 fps → 77%
Average Gaming Intel Arc 8-Core iGPU → 163%
Average Gaming 30-70 fps → 164%
| Intel Graphics 4-Cores iGPU (Arc) | low | med. | high | ultra | QHD | 4K |
|---|---|---|---|---|---|---|
| F1 24 | 39 | 34 | 26.9 | 7.33 | ||
| Cyberpunk 2077 2.1 Phantom Liberty | 19 | 15 | 13 | 12 | ||
| Baldur's Gate 3 | 18 | 14 | 12 | 12 | ||
| F1 23 | 42 | 39 | 25 | 7.14 | ||
| F1 22 | 43 | 39 | 29 | 8 | ||
| Tiny Tina's Wonderlands | 29 | 23 | 16 | 13 | ||
| Strange Brigade | 103 | 45 | 36 | 28 | ||
| Far Cry 5 | 44 | 24 | 22 | 20 | ||
| X-Plane 11.11 | 36 | 28 | 24 | |||
| Final Fantasy XV Benchmark | 40 | 22 | 16 | |||
| Dota 2 Reborn | 87 | 56 | 55 | 52 | ||
| The Witcher 3 | 86 | 53 | 29 | 16 | ||
| GTA V | 113 | 104 | 21 | 9 | ||
| < 30 fps < 60 fps < 120 fps ≥ 120 fps | 3 6 4 | 6 6 1 | 11 2 | 10 1 | | |
| Intel UHD Graphics 617 | low | med. | high | ultra | QHD | 4K |
|---|---|---|---|---|---|---|
| X-Plane 11.11 | 20.2 | 14.1 | 12.8 | |||
| Rocket League | 61.2 | 26 | 18.3 | |||
| Rise of the Tomb Raider | 16.1 | |||||
| Dota 2 Reborn | 67.2 | 28.2 | 14.6 | 13.6 | ||
| BioShock Infinite | 47.6 | 27.9 | 25 | 8.4 | ||
| < 30 fps < 60 fps < 120 fps ≥ 120 fps | 2 1 2 | 4 | 4 | 2 | | |
Eine Liste mit weiteren Spielen und allen Grafikkarten finden Sie auf unserer Seite: Welches Spiel ist mit welcher Grafikkarte spielbar?
#0 ran 0s before starting gpusingle class +0s ... 0s
#1 checking url part for id 12259 +0s ... 0s
#2 checking url part for id 9356 +0s ... 0s
#3 checking url part for id 12086 +0s ... 0s
#4 redirected to Ajax server, took 1736210502s time from redirect:0 +0s ... 0s
#5 did not recreate cache, as it is less than 5 days old! Created at Sat, 04 Jan 2025 05:19:14 +0100 +0s ... 0s
#6 composed specs +0.019s ... 0.019s
#7 did output specs +0s ... 0.019s
#8 start showIntegratedCPUs +0s ... 0.019s
#9 getting avg benchmarks for device 12259 +0.018s ... 0.037s
#10 got single benchmarks 12259 +0.025s ... 0.062s
#11 getting avg benchmarks for device 9356 +0s ... 0.062s
#12 got single benchmarks 9356 +0s ... 0.063s
#13 getting avg benchmarks for device 12086 +0.005s ... 0.067s
#14 got single benchmarks 12086 +0.047s ... 0.114s
#15 got avg benchmarks for devices +0s ... 0.114s
#16 min, max, avg, median took s +0.061s ... 0.174s
#17 before gaming benchmark output +0s ... 0.175s
#18 Got 2276 rows for game benchmarks. +0.156s ... 0.331s
#19 composed SQL query for gamebenchmarks +0s ... 0.331s
#20 got data and put it in $dataArray +0.01s ... 0.341s
#21 benchmarks composed for output. +0.035s ... 0.376s
#22 calculated avg scores. +0s ... 0.376s
#23 return log +0.004s ... 0.38s