Notebookcheck Logo

NVIDIA GeForce RTX 3070 Max-Q vs Intel HD Graphics 515

NVIDIA GeForce RTX 3070 Max-Q

► remove from comparison NVIDIA GeForce RTX 3070 Max-Q

Die Nvidia GeForce RTX 3070 Max-Q (für Laptops, GN20-E5) bezeichnet eine GeForce RTX 3070 Laptop GPU mit Max-Q Technologien. Früher waren die Max-Q-Varianten die Stromsparversionen, mit der RTX 3000 Serie kann jedoch jede TGP-Variante mit Max-Q Technologien ausgestattet werden.

Intel HD Graphics 515

► remove from comparison Intel HD Graphics 515

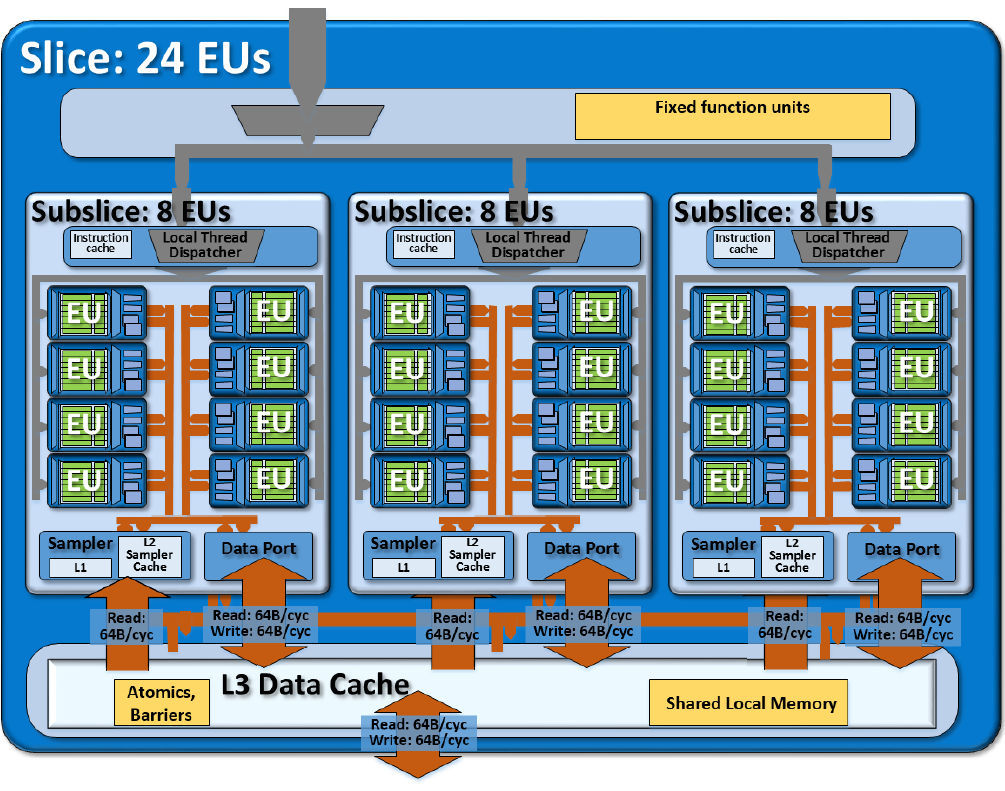
Die Intel HD Graphics 515 (GT2) ist eine Prozessorgrafikkarte der im September 2015 vorgestellten Core-m-CPUs der Skylake-Generation (z.B. Core m7-6Y75). Zwar glänzt die GPU mit einer extrem niedrigen Leistungsaufnahme, allerdings siedelt sich die Performance nur im absoluten Low-End-Segment an und ist für neuere Spiele kaum ausreichend. Als sogenannte GT2-Ausbaustufe der Skylake-GPU verfügt die HD Graphics 515 über 24 Execution Units (EUs), die je nach Modell mit bis zu 1.000 MHz takten.

Mangels eigenem Grafikspeicher oder eDRAM-Cache greift die HD Graphics 515 über das Interface des Prozessors auf den System-RAM zu (2x 64 Bit DDR3L-1600/LPDDR3-1866).

Performance

Die exakte Leistung der HD Graphics 515 hängt stark vom jeweiligen CPU-Modell und Endgerät ab, da sich Maximaltaktrate und TDP-Einstellung unterscheiden können. Zum anderen bestimmt auch der eingesetzte Speicher die Performance.

Im Optimalfall übertrifft die HD 515 sogar leicht die ältere HD Graphics 4400, kann aktuelle Spiele (Stand 2015) aber dennoch allenfalls in niedrigsten Einstellungen flüssig darstellen.

Features

Der überarbeitete Videodecoder decodiert nun auch H.265-/HEVC-Videos vollständig in Hardware und arbeitet dadurch deutlich effizienter als bislang. Die Bildausgabe erfolgt über DP 1.2/eDP 1.3 (max. 3.840 x 2.160 @ 60 Hz), wohingegen HDMI nur in der älteren Version 1.4a angeboten wird. Ein HDMI-2.0-Anschluss kann aber mittels Konverter von DisplayPort ergänzt werden. Maximal lassen sich drei Displays parallel angesteuern.

Leistungsaufnahme

Die TDP des gesamten Chips liegt standardmäßig bei 4,5 Watt, sodass viele Ultrabooks oder 2-in-1-Geräte mit einer rein passiven Kühlung auskommen. Teils kann die TDP auch auf niedrigere (3,5/3,8 Watt) oder höhere Werte (7 Watt) angepasst werden.

NVIDIA GeForce RTX 3070 Max-QIntel HD Graphics 515
Gen. 9 Serie
NVIDIA GeForce RTX 3090 Ti compare 10752 @ 1.56 - 1.86 GHz384 Bit @ 21000 MHz
NVIDIA GeForce RTX 3090 compare 10496 @ 1.4 - 1.7 GHz384 Bit @ 19500 MHz
NVIDIA GeForce RTX 3080 Ti compare 10240 @ 1.37 - 1.67 GHz384 Bit @ 19000 MHz
NVIDIA GeForce RTX 3080 12 GB compare 8960/ cores @ 1.26 - 1.71 GHz384 Bit @ 19000 MHz
NVIDIA GeForce RTX 3080 compare 8704 @ 1.45 - 1.71 GHz320 Bit @ 19000 MHz
GeForce RTX 3070 Ti compare 6144 @ 1.58 - 1.77 GHz256 Bit @ 19000 MHz
GeForce RTX 3080 Ti Laptop GPU compare 7424 @ 0.98 - 1.59 GHz256 Bit @ 14000 MHz
NVIDIA GeForce RTX 3070 compare 5888 @ 1.5 - 1.73 GHz256 Bit @ 14000 MHz
GeForce RTX 3080 Laptop GPU compare 6144 @ 0.78 - 1.25 GHz256 Bit @ 14000 MHz
NVIDIA GeForce RTX 3060 Ti compare 4864 @ 1.41 - 1.67 GHz256 Bit @ 14000 MHz
GeForce RTX 3070 Ti Laptop GPU compare 5888 @ 0.92 - 1.48 GHz256 Bit @ 14000 MHz
GeForce RTX 3070 Laptop GPU compare 5120 @ 0.78 - 1.29 GHz256 Bit @ 14000 MHz
NVIDIA GeForce RTX 3060 compare 3584 @ 1.32 - 1.78 GHz192 Bit @ 15000 MHz
GeForce RTX 3080 Max-Q compare 6144 @ 0.78 - 1.25 GHz256 Bit @ 6000 MHz
GeForce RTX 3070 Max-Q 5120 @ 1.29 GHz256 Bit
GeForce RTX 3060 Laptop GPU compare 3840 @ 0.82 - 1.7 GHz192 Bit @ 14000 MHz
GeForce RTX 3060 Max-Q compare 3840 @ 1.28 GHz192 Bit
NVIDIA GeForce RTX 3050 compare 2560 @ 1.55 - 1.78 GHz128 Bit Bit @ 1750 MHz
GeForce RTX 3050 Ti Laptop GPU compare 2560 @ 1.22 - 1.49 GHz128 Bit @ 12000 MHz
GeForce RTX 3050 6GB Laptop GPU compare 2560 @ 1.24 - 1.49 GHz96 Bit @ 12000 MHz
GeForce RTX 3050 A Laptop GPU compare 1792 64 Bit
GeForce RTX 3050 4GB Laptop GPU compare 2048 @ 1.24 - 1.5 GHz128 Bit @ 12000 MHz
Iris Pro Graphics P580 compare 72 @ 0.35 - 1.1 GHzeDRAM + 64/128 Bit
Iris Pro Graphics 580 compare 72 @ 0.35 - 1.05 GHzeDRAM + 64/128 Bit
Iris Graphics 550 compare 48 @ 0.3 - 1.1 GHzeDRAM + 64/128 Bit
Iris Graphics 540 compare 48 @ 0.3 - 1.05 GHzeDRAM + 64/128 Bit
HD Graphics 530 compare 24 @ 0.35 - 1.15 GHz64/128 Bit
HD Graphics 520 compare 24 @ 0.3 - 1.05 GHz64/128 Bit
HD Graphics 515 24 @ 0.3 - 1 GHz64/128 Bit
UHD Graphics 610 compare 12 @ 0.3 - 0.95 GHz64/128 Bit
HD Graphics 610 compare 12 @ 0.3 - 0.95 GHz64/128 Bit
HD Graphics 510 compare 12 @ 0.3 - 0.95 GHz64/128 Bit
UHD Graphics 605 compare 18 @ 0.3 - 0.75 GHz64/128 Bit
HD Graphics 505 compare 18 @ 0.3 - 0.75 GHz64/128 Bit
UHD Graphics 600 compare 12 @ 0.3 - 0.7 GHz64/128 Bit
HD Graphics 500 compare 12 @ 0.3 - 0.7 GHz64/128 Bit
CodenameGN20-E5 GA104Skylake GT2
ArchitekturAmpereGen. 9 Skylake
Pipelines5120 - unified24 - unified
Kerntakt1290 (Boost) MHz300 - 1000 (Boost) MHz
Speicherbandbreite256 Bit64/128 Bit
SpeichertypGDDR6DDR3L/LPDDR3
Max. Speichergröße8 GB
Shared Memoryneinja
APIDirectX 12_2, Shader 6.7, OpenGL 4.6DirectX 12_1, OpenGL 4.4
Stromverbrauch80 Watt
Herstellungsprozess8 nm14 nm
Notebookgrößegroß (17" z.B.)
Erscheinungsdatum04.01.2021 01.09.2015
FeaturesQuickSync
CPU in HD Graphics 515GPU Base SpeedGPU Boost / Turbo
Intel Core m7-6Y752 x 1200 MHz, 4.5 W300 MHz1000 MHz
Intel Core m5-6Y572 x 1100 MHz, 4.5 W300 MHz900 MHz
Intel Core m5-6Y542 x 1100 MHz, 4.5 W300 MHz900 MHz
Intel Core m3-6Y302 x 900 MHz, 4.5 W300 MHz850 MHz
min. - max.300 MHz850 - 1000 MHz

Benchmarks

Performance Rating - 3DMark 11 + Fire Strike + Time Spy - HD Graphics 515
0.3 pt (1%)
3DMark - 3DMark Ice Storm Unlimited Graphics
min: 43449     avg: 58940     median: 56787 (6%)     max: 78808 Points
3DMark - 3DMark Ice Storm Extreme Graphics
min: 18749     avg: 24669     median: 23314 (3%)     max: 33413 Points
3DMark - 3DMark Cloud Gate Score
min: 2705     avg: 3940     median: 3850.5 (4%)     max: 5257 Points
3DMark - 3DMark Cloud Gate Graphics
min: 3982     avg: 5440     median: 5467 (1%)     max: 7035 Points
3DMark - 3DMark Fire Strike Standard Score
min: 453     avg: 617     median: 623.5 (1%)     max: 780 Points
3DMark - 3DMark Fire Strike Standard Graphics
min: 494     avg: 679     median: 691.5 (1%)     max: 892 Points
3DMark - 3DMark Ice Storm Graphics
min: 31627     avg: 44439     median: 45108 (5%)     max: 54558 Points
3DMark 11 - 3DM11 Performance Score
min: 785     avg: 1105     median: 1115 (2%)     max: 1360 Points
3DMark 11 - 3DM11 Performance GPU
min: 714     avg: 1013     median: 1014 (1%)     max: 1254 Points
3DMark Vantage
3DM Vant. Perf. total + Intel HD Graphics 515
3DMark Vantage - 3DM Vant. Perf. total
4672 Points (1%)
3DM Vant. Perf. GPU no PhysX + Intel HD Graphics 515
3DMark Vantage - 3DM Vant. Perf. GPU no PhysX
4218 Points (2%)
3DMark 2001SE - 3DMark 2001 - Standard
20345 Points (21%)
3DMark 03 - 3DMark 03 - Standard
18019 Points (9%)
3DMark 05 - 3DMark 05 - Standard
9173 Points (10%)
3DMark 06 3DMark 06 - Standard 1280x1024 + Intel HD Graphics 515
3DMark 06
min: 4968     avg: 6621     median: 6446 (8%)     max: 7912 Points
Unigine Heaven 2.1 - Heaven 2.1 high
min: 15.7     avg: 16.9     median: 16.9 (3%)     max: 18 fps
SPECviewperf 12
specvp12 sw-03 + Intel HD Graphics 515
SPECviewperf 12 - specvp12 sw-03
17.6 fps (4%)
specvp12 snx-02 + Intel HD Graphics 515
SPECviewperf 12 - specvp12 snx-02
2.1 fps (0%)
specvp12 showcase-01 + Intel HD Graphics 515
SPECviewperf 12 - specvp12 showcase-01
5 fps (1%)
specvp12 mediacal-01 + Intel HD Graphics 515
SPECviewperf 12 - specvp12 mediacal-01
1.8 fps (0%)
specvp12 maya-04 + Intel HD Graphics 515
SPECviewperf 12 - specvp12 maya-04
9 fps (2%)
specvp12 energy-01 + Intel HD Graphics 515
SPECviewperf 12 - specvp12 energy-01
0.1 fps (0%)
specvp12 creo-01 + Intel HD Graphics 515
SPECviewperf 12 - specvp12 creo-01
7.9 fps (3%)
specvp12 catia-04 + Intel HD Graphics 515
SPECviewperf 12 - specvp12 catia-04
9.8 fps (2%)
Cinebench R10 Cinebench R10 Shading (32bit) + Intel HD Graphics 515
Cinebench R10 - Cinebench R10 Shading (32bit)
min: 4740     avg: 6063     median: 6088 (4%)     max: 7263 Points
Cinebench R11.5 Cinebench R11.5 OpenGL 64 Bit + Intel HD Graphics 515
Cinebench R11.5 - Cinebench R11.5 OpenGL 64 Bit
min: 16.86     avg: 23.6     median: 23.1 (8%)     max: 31.86 fps
Cinebench R15
Cinebench R15 OpenGL 64 Bit + Intel HD Graphics 515
Cinebench R15 - Cinebench R15 OpenGL 64 Bit
min: 18.93     avg: 28.6     median: 29.4 (2%)     max: 35.98 fps
Cinebench R15 OpenGL Ref. Match 64 Bit + Intel HD Graphics 515
Cinebench R15 - Cinebench R15 OpenGL Ref. Match 64 Bit
min: 97.7     avg: 98     median: 97.8 (98%)     max: 99.3 %
GFXBench - GFXBench Car Chase Offscreen
20.9 fps (2%)
GFXBench 3.1 - GFXBench Manhattan ES 3.1 Offscreen
min: 25.5     avg: 27.7     median: 27.7 (1%)     max: 29.9 fps
GFXBench 3.0 - GFXBench 3.0 Manhattan Offscreen
min: 31.9     avg: 36.5     median: 36.7 (2%)     max: 43.6 fps
GFXBench (DX / GLBenchmark) 2.7
GFXBench T-Rex HD Offscreen C24Z16 + Intel HD Graphics 515
GFXBench (DX / GLBenchmark) 2.7 - GFXBench T-Rex HD Offscreen C24Z16
min: 70     avg: 75.4     median: 73.2 (1%)     max: 87 fps
LuxMark v2.0 64Bit - LuxMark v2.0 Room GPU
min: 173     avg: 183     median: 183 (1%)     max: 193 Samples/s
LuxMark v2.0 64Bit - LuxMark v2.0 Sala GPU
min: 395     avg: 413.5     median: 416 (1%)     max: 427 Samples/s
ComputeMark v2.1 - ComputeMark v2.1 Result
min: 476     avg: 660     median: 704 (1%)     max: 741 Points

Average Benchmarks Intel HD Graphics 515 → 0% n=0

- Bereich der Benchmarkergebnisse für diese Grafikkarte
- Durchschnittliche Benchmarkergebnisse für diese Grafikkarte
* Smaller numbers mean a higher performance
1 This benchmark is not used for the average calculation

Spiele-Benchmarks

Die folgenden Benchmarks basieren auf unseren Spieletests mit Testnotebooks. Die Performance dieser Grafikkarte bei den gelisteten Spielen ist abhängig von der verwendeten CPU, Speicherausstattung, Treiber und auch Betriebssystem. Dadurch müssen die untenstehenden Werte nicht repräsentativ sein. Detaillierte Informationen über das verwendete System sehen Sie nach einem Klick auf den fps-Wert.

FIFA 19

FIFA 19

2018
low 1280x720
HD Graphics 515:
21 (!)  fps
low 1280x720
HD Graphics 515:
14.4  fps
low 1280x720
HD Graphics 515:
42 48 ~ 45 fps
med. 1366x768
HD Graphics 515:
30 36 ~ 33 fps
high 1920x1080
HD Graphics 515:
14 24 ~ 19 fps
Dirt 4

Dirt 4

2017
low 1280x720
HD Graphics 515:
26.6  fps
low 1280x720
HD Graphics 515:
28 30.1 ~ 29 fps
med. 1920x1080
HD Graphics 515:
10.7 11 ~ 11 fps
low 1280x720
HD Graphics 515:
9.4  fps
med. 1920x1080
HD Graphics 515:
4.3  fps
For Honor

For Honor

2017
low 1280x720
HD Graphics 515:
17.2  fps
med. 1920x1080
HD Graphics 515:
6.6  fps
low 1280x720
HD Graphics 515:
22.3  fps
med. 1920x1080
HD Graphics 515:
10.3  fps
low 1280x720
HD Graphics 515:
48  fps
med. 1366x768
HD Graphics 515:
24.1  fps
high 1920x1080
HD Graphics 515:
10.1  fps
low 1024x768
HD Graphics 515:
21.5  fps
med. 1366x768
HD Graphics 515:
10.3  fps
low 1280x720
HD Graphics 515:
10.7  fps
med. 1366x768
HD Graphics 515:
7.8  fps
low 1280x720
HD Graphics 515:
11.4  fps
Overwatch

Overwatch

2016
low 1280x720
HD Graphics 515:
13.8 21.7 ~ 18 fps
med. 1366x768
HD Graphics 515:
8.4  fps
low 1280x720
HD Graphics 515:
6.1 8.4 ~ 7 fps
med. 1366x768
HD Graphics 515:
5.9  fps
low 1280x720
HD Graphics 515:
10.1  fps
med. 1366x768
HD Graphics 515:
9.2  fps
low 1280x720
HD Graphics 515:
12  fps
med. 1366x768
HD Graphics 515:
8.4  fps
low 1280x720
HD Graphics 515:
11  fps
med. 1920x1080
HD Graphics 515:
5  fps
XCOM 2

XCOM 2

2016
low 1280x720
HD Graphics 515:
11.2  fps
med. 1920x1080
HD Graphics 515:
4.9  fps
low 1024x768
HD Graphics 515:
0 (!) 7.3 8 8.3 8.4 ~ 6 fps
med. 1366x768
HD Graphics 515:
4.2 5.2 5.7 ~ 5 fps
low 1024x768
HD Graphics 515:
25.7  fps
med. 1366x768
HD Graphics 515:
15.2  fps
low 1024x768
HD Graphics 515:
13.1  fps
med. 1366x768
HD Graphics 515:
8.7  fps
low 1024x768
HD Graphics 515:
18.7  fps
med. 1366x768
HD Graphics 515:
10.4  fps
Fallout 4

Fallout 4

2015
low 1280x720
HD Graphics 515:
0 (!) 0 (!) ~ 0 fps
low 1024x768
HD Graphics 515:
12.4  fps
med. 1366x768
HD Graphics 515:
8.1  fps
Anno 2205

Anno 2205

2015
low 1024x768
HD Graphics 515:
15.5  fps
med. 1366x768
HD Graphics 515:
9.3  fps
FIFA 16

FIFA 16

2015
low 1280x720
HD Graphics 515:
42 (!)  fps
low 1366x768
HD Graphics 515:
32 32.1 42.8 ~ 36 fps
med. 1366x768
HD Graphics 515:
23.6 26.3 30.2 ~ 27 fps
high 1920x1080
HD Graphics 515:
12.7 16.4 ~ 15 fps
ultra 1920x1080
HD Graphics 515:
7.4 11.7 ~ 10 fps
low 1024x768
HD Graphics 515:
25.7  fps
med. 1366x768
HD Graphics 515:
15.3  fps
low 1280x720
HD Graphics 515:
48  fps
med. 1366x768
HD Graphics 515:
25.4 30 ~ 28 fps
high 1920x1080
HD Graphics 515:
9.4  fps
ultra 1920x1080
HD Graphics 515:
8.1  fps
low 1024x768
HD Graphics 515:
5.1 7.2 7.4 11.2 12.8 ~ 9 fps
med. 1366x768
HD Graphics 515:
7.1  fps
low 1024x768
HD Graphics 515:
57 57.8 65.7 67.2 ~ 62 fps
med. 1366x768
HD Graphics 515:
13.9 14.4 15.8 16 ~ 15 fps
high 1920x1080
HD Graphics 515:
12.5 12.5 12.5 ~ 13 fps
ultra 1920x1080
HD Graphics 515:
12.5  fps
low 1024x768
HD Graphics 515:
22.1 25.9 ~ 24 fps
med. 1366x768
HD Graphics 515:
18.1 20.5 ~ 19 fps
high 1920x1080
HD Graphics 515:
6.8 8.3 ~ 8 fps
ultra 1920x1080
HD Graphics 515:
4.1  fps
low 1024x768
HD Graphics 515:
13.5  fps
med. 1366x768
HD Graphics 515:
9.3  fps
F1 2014

F1 2014

2014
low 1024x768
HD Graphics 515:
41 41 ~ 41 fps
med. 1366x768
HD Graphics 515:
27 28 ~ 28 fps
high 1920x1080
HD Graphics 515:
15 17 ~ 16 fps
ultra 1920x1080
HD Graphics 515:
12.5  fps
Fifa 15

Fifa 15

2014
low 1280x720
HD Graphics 515:
38.3  fps
high 1366x768
HD Graphics 515:
29.6  fps
ultra 1920x1080
HD Graphics 515:
15.1  fps
Sims 4

Sims 4

2014
low 1024x768
HD Graphics 515:
161.1  fps
med. 1366x768
HD Graphics 515:
39.2  fps
high 1920x1080
HD Graphics 515:
17.1  fps
ultra 1920x1080
HD Graphics 515:
10.4  fps
low 1024x768
HD Graphics 515:
86.5  fps
med. 1366x768
HD Graphics 515:
26.3  fps
high 1920x1080
HD Graphics 515:
14.9  fps
ultra 1920x1080
HD Graphics 515:
12.5  fps
Thief

Thief

2014
low 1024x768
HD Graphics 515:
13.9 16.4 ~ 15 fps
med. 1366x768
HD Graphics 515:
6.7 10.1 ~ 8 fps
high 1366x768
HD Graphics 515:
7.5  fps
low 1024x768
HD Graphics 515:
17.7 21.7 22.6 24.6 24.8 26.4 34.3 35.5 ~ 26 fps
med. 1366x768
HD Graphics 515:
12.4 15.2 15.7 16 17.9 18.2 23.2 23.5 ~ 18 fps
high 1366x768
HD Graphics 515:
8.4 8.5 9.7 10.9 11.9 12.8 15 15.2 ~ 12 fps
ultra 1920x1080
HD Graphics 515:
2.3 2.9 4.3 5.6 6.7 ~ 4 fps
low 1024x768
HD Graphics 515:
16.4 21.5 ~ 19 fps
med. 1366x768
HD Graphics 515:
13.5 18 30.4 ~ 21 fps
high 1366x768
HD Graphics 515:
8.7 12.5 18.2 ~ 13 fps
ultra 1920x1080
HD Graphics 515:
9  fps
low 1280x720
HD Graphics 515:
21.8 26 26.5 29.5 32 32.6 33 33.1 33.3 35.6 36.4 37.5 38 38.9 39.7 44 44.1 44.2 44.6 48 49.9 52.4 ~ 37 fps
med. 1366x768
HD Graphics 515:
12 13 13.7 16 17.4 17.4 17.8 18.5 18.8 19.5 20 20.1 20.2 20.3 21.7 23.3 23.8 24.6 24.8 24.8 25 26.9 ~ 20 fps
high 1366x768
HD Graphics 515:
11.8 12.3 13.6 14.8 15.1 15.3 15.3 15.4 15.8 15.9 16.2 16.7 17.6 19.9 20 20.1 20.7 20.9 21.9 22.7 ~ 17 fps
ultra 1920x1080
HD Graphics 515:
3.8 4 4.3 4.4 4.6 4.7 4.7 4.9 5.1 5.3 5.9 6 6.5 6.7 ~ 5 fps
low 1024x768
HD Graphics 515:
80.8  fps
med. 1366x768
HD Graphics 515:
24.9  fps
high 1366x768
HD Graphics 515:
14.6  fps
low 1024x768
HD Graphics 515:
27.9 32.3 34.8 40.6 45.3 49.4 54.4 59.9 ~ 43 fps
med. 1366x768
HD Graphics 515:
12.4 14.8 16.9 19.7 22.8 23 26 31.2 ~ 21 fps
high 1366x768
HD Graphics 515:
12.1 13.1 15.9 16.3 17.8 21.6 ~ 16 fps
ultra 1920x1080
HD Graphics 515:
5.8 7.2 7.4 9.5 ~ 7 fps
Crysis 3

Crysis 3

2013
low 1024x768
HD Graphics 515:
20.2  fps
med. 1366x768
HD Graphics 515:
12.9  fps
high 1366x768
HD Graphics 515:
8.3  fps
low 1024x768
HD Graphics 515:
76.7  fps
med. 1366x768
HD Graphics 515:
57.3  fps
high 1366x768
HD Graphics 515:
35.1  fps
ultra 1920x1080
HD Graphics 515:
20.2  fps
low 1024x768
HD Graphics 515:
61.9  fps
med. 1366x768
HD Graphics 515:
41.8  fps
high 1366x768
HD Graphics 515:
35.1  fps
ultra 1920x1080
HD Graphics 515:
20.5  fps
Anno 2070

Anno 2070

2011
low 1024x768
HD Graphics 515:
47.3 54.2 ~ 51 fps
med. 1366x768
HD Graphics 515:
23.9 33.2 ~ 29 fps
high 1366x768
HD Graphics 515:
14.8 19.2 ~ 17 fps
ultra 1920x1080
HD Graphics 515:
9.6  fps
low 1280x720
HD Graphics 515:
31.1  fps
med. 1366x768
HD Graphics 515:
18.7  fps
high 1366x768
HD Graphics 515:
11.6  fps
ultra 1920x1080
HD Graphics 515:
7.1  fps
low 1024x768
HD Graphics 515:
50  fps
high 1366x768
HD Graphics 515:
27.2  fps
ultra 1920x1080
HD Graphics 515:
11.2  fps
Intel HD Graphics 515lowmed.highultraQHD4K
FIFA 1921
X-Plane 11.1114.4
Team Fortress 2453319
Dirt 426.6
Rocket League2911
Ghost Recon Wildlands9.44.3
For Honor17.26.6
Resident Evil 722.310.3
Farming Simulator 174824.110.1
Civilization VI21.510.3
Deus Ex Mankind Divided10.77.8
Mirror's Edge Catalyst11.4
Overwatch188.4
Need for Speed 201675.9
Hitman 201610.19.2
The Division128.4
Far Cry Primal115
XCOM 211.24.9
Rise of the Tomb Raider65
Rainbow Six Siege25.715.2
Just Cause 313.18.7
Star Wars Battlefront18.710.4
Fallout 40
Call of Duty: Black Ops 312.48.1
Anno 220515.59.3
FIFA 1642
World of Warships36271510
Metal Gear Solid V25.715.3
Dota 2 Reborn48289.48.1
The Witcher 397.1
Dirt Rally62151312.5
Battlefield Hardline241984.1
Dragon Age: Inquisition13.59.3
F1 201441281612.5
Fifa 1538.329.615.1
Sims 4161.139.217.110.4
GRID: Autosport86.526.314.912.5
Thief1587.5
Battlefield 42618124
Metro: Last Light1921139.02
BioShock Infinite3720175
StarCraft II: Heart of the Swarm80.824.914.6
Tomb Raider4321167
Crysis 320.212.98.3
Counter-Strike: GO76.757.335.120.2
Diablo III61.941.835.120.5
Anno 20705129179.6
The Elder Scrolls V: Skyrim31.118.711.67.1
Deus Ex Human Revolution5027.211.2
< 30 fps
< 60 fps
< 120 fps
≥ 120 fps
30
12
5
1
37
4

20
2

17


Eine Liste mit weiteren Spielen und allen Grafikkarten finden Sie auf unserer Seite: Welches Spiel ist mit welcher Grafikkarte spielbar?

Add one or more devices and compare

In the following list you can select (and also search for) devices that should be added to the comparison. You can select more than one device.

restrict list:

show all (including archived), 2024, 2023
v1.28
log 20. 03:25:58

#0 ran 0s before starting gpusingle class +0s ... 0s

#1 checking url part for id 10588 +0s ... 0s

#2 checking url part for id 6450 +0s ... 0s

#3 redirected to Ajax server, took 1726795558s time from redirect:0 +0s ... 0s

#4 did not recreate cache, as it is less than 5 days old! Created at Thu, 19 Sep 2024 05:16:33 +0200 +0s ... 0s

#5 composed specs +0.028s ... 0.028s

#6 did output specs +0s ... 0.028s

#7 start showIntegratedCPUs +0s ... 0.028s

#8 getting avg benchmarks for device 10588 +0.011s ... 0.038s

#9 got single benchmarks 10588 +0s ... 0.038s

#10 getting avg benchmarks for device 6450 +0.004s ... 0.043s

#11 got single benchmarks 6450 +0.035s ... 0.077s

#12 got avg benchmarks for devices +0s ... 0.077s

#13 min, max, avg, median took s +0.019s ... 0.097s

#14 before gaming benchmark output +0s ... 0.097s

#15 Got 299 rows for game benchmarks. +0.028s ... 0.125s

#16 composed SQL query for gamebenchmarks +0s ... 0.125s

#17 got data and put it in $dataArray +0.002s ... 0.128s

#18 benchmarks composed for output. +0.015s ... 0.142s

#19 calculated avg scores. +0s ... 0.142s

#20 return log +0.002s ... 0.145s

Teilen Sie diesen Artikel, um uns zu unterstützen. Jeder Link hilft!
> Notebook Test, Laptop Test und News > Benchmarks / Technik > Benchmarks / Technik > Grafikkarten Vergleich - Head 2 Head
Autor: Klaus Hinum,  8.09.2017 (Update:  1.07.2023)