Notebookcheck Logo

NVIDIA GeForce RTX 3050 A Laptop GPU vs Intel UHD Graphics 605 vs Intel Iris Pro Graphics P580

NVIDIA GeForce RTX 3050 A Laptop GPU

► remove from comparison NVIDIA GeForce RTX 3050 A Laptop GPU

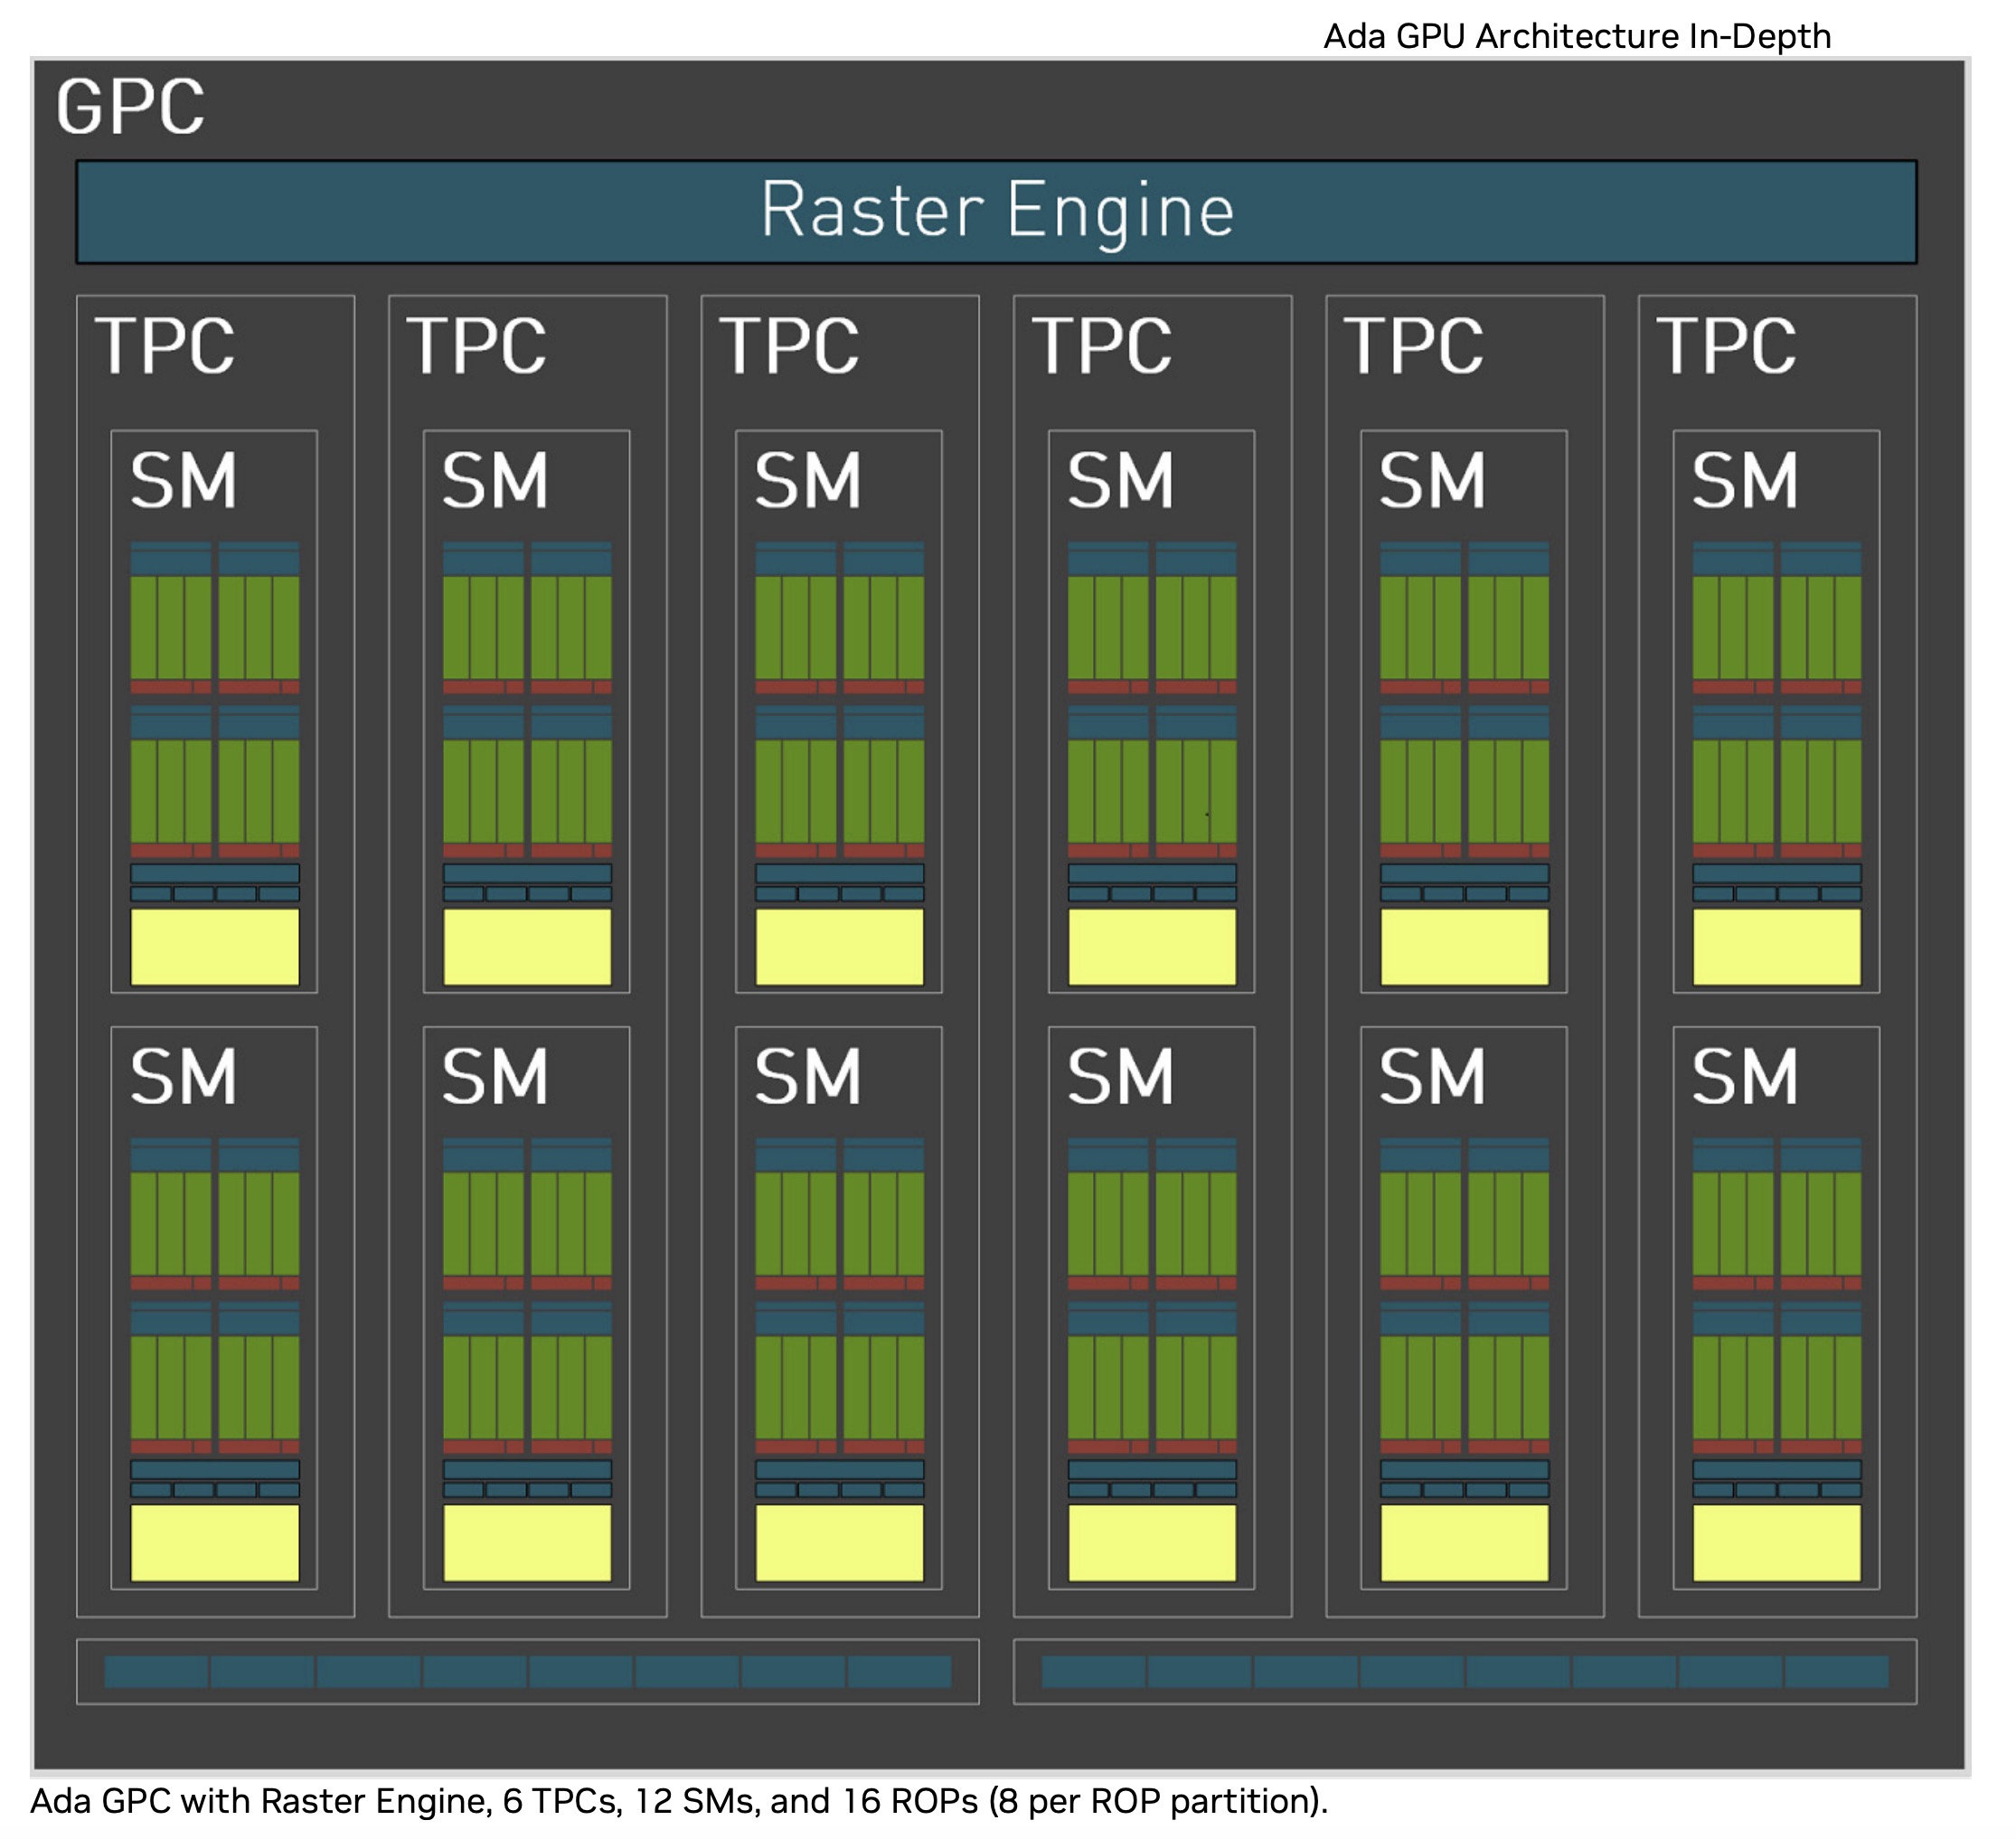
Die Nvidia GeForce RTX 3050 A Laptop GPU (oder Mobile) ist eine neue Variante basierend auf die aktuelle Ada Lovelace Architektur (im Vergleich zu Ampere bei den anderen RTX 3050 Laptop GPUs). Sie nutzt den AD106 Chip der RTX 4060 oder AD107 der RTX 4050, jedoch mit deutlich verringerter Kernanzahl und Speicherbus. Die RTX 3050 A bietet nur 1.792 GPU Kerne (CUDA Cores) und ein 4GB GDDR6 Grafikspeicher der nur mit 64-Bit angebunden ist. Nach aktuellen Informationen ist die 3050 A zum Launch nur für den Indischen Markt gedacht.

Durch die geringe Kernanzahl und den kleinen Speicherbus, sollte die Performance nicht deutlich überhalb der alten RTX 3050 4GB Laptop GPU liegen.

Der AD106 Chip wird bei TSMC im 5nm (4N) Verfahren gefertigt und ist dadurch deutlich effizienter als der alte Ampere Chip der RTX 3050 4GB. Der TGP kann vom Notebookhersteller zwischen 35 und 50 Watt gewählt werden (System Power).

Intel UHD Graphics 605

► remove from comparison Intel UHD Graphics 605

Die Intel UHD Graphics 605 ist eine Prozessorgrafikkarte der Ende 2017 vorgestellten Gemini-Lake-Generation (z.B. Pentium Silver N5000). Zwar glänzt die GPU mit einer sehr niedrigen Leistungsaufnahme, allerdings siedelt sich die Performance nur im Low-End-Segment an und ist für neuere Spiele nicht ausreichend. Als maximale Ausbaustufe der Gemini-Lake-GPU verfügt die UHD Graphics 605 über 18 Execution Units (EUs), die mit bis zu 750 MHz takten. Technisch basiert die GPU auf der Intel-Gen9-Architektur, die auch bei der teureren Skylake-Serie zum Einsatz kommt. Im Vergleich zur alten Intel HD Graphics 505 in Apollo Lake, wurden nur die Displayausgänge verbessert (Gen. 10). Performance und Architektur blieben unangetastet. 

Mangels eigenem Grafikspeicher oder eDRAM-Cache greift die UHD Graphics 605 über das Interface des Prozessors auf den System-RAM zu (2x 64 Bit DDR3L/LPDDR4-2400).

Performance

Die theoretische Grafikleistung entspricht in etwa der älteren Core-M-Grafikeinheit HD Graphics 5300. Dadurch sind nur wenige anspruchslose Spiele flüssig spielbar (siehe auch die Spielebenchmarks der Intel HD Graphics 505). In unseren Tests erreichte z.B. nur wenige Spiele wie Dirt Rally oder Sims 4 spielbare Frameraten in niedrigsten Detailstufe.

Features

Der überarbeitete Videodecoder decodiert und encodiert H.265-/HEVC-Videos (8b und 10b) sowie VP9 vollständig in Hardware und arbeitet dadurch deutlich effizienter als bislang. Bei der Bildausgabe unterstützt der SoC dank Gen.10 nun auch HDMI 2.0a mit HDCP 2.2 un DisplayPort 1.2a nativ.

Leistungsaufnahme

Die TDP des gesamten Chips liegt beim Pentium N5000 standardmäßig bei 6 Watt, sodass die GPU vor allem in (oftmals passiv gekühlten) Netbooks oder schlanken Notebooks zu finden ist. Optional kann die TDP auch auf 4,8 Watt abgesenkt werden, wodurch allerdings die Performance sinkt.

Intel Iris Pro Graphics P580

► remove from comparison

Die Intel Iris Pro Graphics P580 (GT4e) ist eine Prozessorgrafikkarte der im Sommer 2015 vorgestellten Skylake-Generation. Als Nachfolger der Iris Pro Graphics 6200 (Broadwell) ist die Iris Pro P580 dabei in ausgewählten Quad-Core-Modellen der Xeon-Serie zu finden und besitzt einen dedizierten eDRAM-Cache mit 128 MB Kapazität. Die sogenannte GT4e-Ausbaustufe der Skylake-GPU verfügt zudem über 72 Execution Units (EUs) und damit deutlich mehr Rechenleistung als die GT2- (24 EUs) und GT3e-Ausbaustufen (48 EUs). Neben dem eDRAM-Cache kann die Iris P580 auch über das Interface des Prozessors auf den Hauptspeicher zugreifen (2x 64 Bit DDR3L-1600/DDR4-2133).

Im Unterschied zur Consumer-Variante Iris Pro Graphics 580 ist die Iris P580 ausschließlich den professionellen Xeon-Modellen vorbehalten, weist ansonsten aber keine bedeutsamen technischen Abweichungen auf.

Performance

Die exakte Leistung der Iris Pro Graphics P580 ist bislang noch nicht bekannt und hängt unter anderem vom jeweiligen CPU-Modell sowie der Speicherbestückung ab. Im Optimalfall sollte die Performance aber knapp an eine dedizierte GeForce 945M heranreichen und liegt damit in der Mittelklasse mobiler Grafikchips des Jahres 2015/2016. Aktuelle Spiele können zumeist in mittleren Einstellungen flüssig dargestellt werden.

Features

Die überarbeitete Videoeinheit decodiert nun auch H.265-/HEVC-Videos vollständig in Hardware und arbeitet dadurch deutlich effizienter als bislang. Die Bildausgabe erfolgt über DP 1.2/eDP 1.3 (max. 3.840 x 2.160 @ 60 Hz), wohingegen HDMI nur in der älteren Version 1.4 angeboten wird. Ein HDMI-2.0-Anschluss kann aber mittels Konverter von DisplayPort ergänzt werden. Maximal lassen sich drei Displays parallel angesteuern.

Leistungsaufnahme

Die Iris Pro Graphics P580 wird zunächst ausschließlich in Prozessoren der 45-Watt-Klasse verbaut und ist damit vorrangig in größeren Notebooks zu finden.

NVIDIA GeForce RTX 3050 A Laptop GPUIntel UHD Graphics 605Intel Iris Pro Graphics P580
Gen. 9 Serie
NVIDIA GeForce RTX 3090 Ti 10752 @ 1.56 - 1.86 GHz384 Bit @ 21000 MHz
NVIDIA GeForce RTX 3090 10496 @ 1.4 - 1.7 GHz384 Bit @ 19500 MHz
NVIDIA GeForce RTX 3080 Ti 10240 @ 1.37 - 1.67 GHz384 Bit @ 19000 MHz
NVIDIA GeForce RTX 3080 12 GB 8960/ cores @ 1.26 - 1.71 GHz384 Bit @ 19000 MHz
NVIDIA GeForce RTX 3080 8704 @ 1.45 - 1.71 GHz320 Bit @ 19000 MHz
GeForce RTX 3070 Ti 6144 @ 1.58 - 1.77 GHz256 Bit @ 19000 MHz
GeForce RTX 3080 Ti Laptop GPU 7424 @ 0.98 - 1.59 GHz256 Bit @ 14000 MHz
NVIDIA GeForce RTX 3070 5888 @ 1.5 - 1.73 GHz256 Bit @ 14000 MHz
GeForce RTX 3080 Laptop GPU 6144 @ 0.78 - 1.25 GHz256 Bit @ 14000 MHz
NVIDIA GeForce RTX 3060 Ti 4864 @ 1.41 - 1.67 GHz256 Bit @ 14000 MHz
GeForce RTX 3070 Ti Laptop GPU 5888 @ 0.92 - 1.48 GHz256 Bit @ 14000 MHz
GeForce RTX 3070 Laptop GPU 5120 @ 0.78 - 1.29 GHz256 Bit @ 14000 MHz
NVIDIA GeForce RTX 3060 3584 @ 1.32 - 1.78 GHz192 Bit @ 15000 MHz
GeForce RTX 3080 Max-Q 6144 @ 0.78 - 1.25 GHz256 Bit @ 6000 MHz
GeForce RTX 3070 Max-Q 5120 @ 1.29 GHz256 Bit
GeForce RTX 3060 Laptop GPU 3840 @ 0.82 - 1.7 GHz192 Bit @ 14000 MHz
GeForce RTX 3060 Max-Q 3840 @ 1.28 GHz192 Bit
NVIDIA GeForce RTX 3050 2560 @ 1.55 - 1.78 GHz128 Bit Bit @ 1750 MHz
GeForce RTX 3050 Ti Laptop GPU 2560 @ 1.22 - 1.49 GHz128 Bit @ 12000 MHz
GeForce RTX 3050 6GB Laptop GPU 2560 @ 1.24 - 1.49 GHz96 Bit @ 12000 MHz
GeForce RTX 3050 A Laptop GPU 1792 64 Bit
GeForce RTX 3050 4GB Laptop GPU 2048 @ 1.24 - 1.5 GHz128 Bit @ 12000 MHz
Iris Pro Graphics P580 72 @ 0.35 - 1.1 GHzeDRAM + 64/128 Bit
Iris Pro Graphics 580 72 @ 0.35 - 1.05 GHzeDRAM + 64/128 Bit
Iris Graphics 550 48 @ 0.3 - 1.1 GHzeDRAM + 64/128 Bit
Iris Graphics 540 48 @ 0.3 - 1.05 GHzeDRAM + 64/128 Bit
HD Graphics 530 24 @ 0.35 - 1.15 GHz64/128 Bit
HD Graphics 520 24 @ 0.3 - 1.05 GHz64/128 Bit
HD Graphics 515 24 @ 0.3 - 1 GHz64/128 Bit
UHD Graphics 610 12 @ 0.3 - 0.95 GHz64/128 Bit
HD Graphics 610 12 @ 0.3 - 0.95 GHz64/128 Bit
HD Graphics 510 12 @ 0.3 - 0.95 GHz64/128 Bit
UHD Graphics 605 18 @ 0.3 - 0.75 GHz64/128 Bit
HD Graphics 505 18 @ 0.3 - 0.75 GHz64/128 Bit
UHD Graphics 600 12 @ 0.3 - 0.7 GHz64/128 Bit
HD Graphics 500 12 @ 0.3 - 0.7 GHz64/128 Bit
ArchitekturAda LovelaceGen. 9 Apollo LakeGen. 9 Skylake
Pipelines1792 - unified18 - unified72 - unified
Speicherbandbreite64 Bit64/128 BiteDRAM + 64/128 Bit
SpeichertypGDDR6DDR4 / LPDDR4eDRAM
Max. Speichergröße4 GB128 MB
Shared Memoryneinjaja
APIDirectX 12_2, Shader 6.7, OpenGL 4.6DirectX 12_1, OpenGL 4.4DirectX 12_1, OpenGL 4.4
Stromverbrauch45 Watt (35 - 80 Watt TGP)
Herstellungsprozess5 nm14 nm14 nm
PCIe4.0
DisplaysHDMI 2.1, DisplayPort 1.4a
FeaturesNVIDIA DLSS, NVIDIA Reflex, Resizable BAR, NVIDIA Broadcast, NVIDIA Ansel, NVIDIA ShadowPlay, NVIDIA G-SYNC, Advanced Optimus, Nvidia Max-Q, Dynamic BoostQuickSyncQuickSync
Notebookgrößemittel (15.4" z.B.)
Erscheinungsdatum26.07.2024 11.12.2017 24.01.2016
PredecessorGeForce RTX 3050 4GB Laptop GPU
CodenameGemini LakeSkylake GT4e
Kerntakt300 - 750 (Boost) MHz350 - 1100 (Boost) MHz
Herstellerseiteark.intel.com
CPU in UHD Graphics 605GPU Base SpeedGPU Boost / Turbo
Intel Pentium Silver J50404 x 2000 MHz, 10 W250 MHz800 MHz
Intel Pentium Silver N50304 x 1100 MHz, 6 W200 MHz750 MHz
Intel Pentium Silver N50004 x 1100 MHz, 6 W200 MHz750 MHz
min. - max.200 - 250 MHz750 - 800 MHz
CPU in Iris Pro Graphics P580GPU Base SpeedGPU Boost / Turbo
Intel Xeon E3-1575M v54 x 3000 MHz, 45 W350 MHz1100 MHz

Benchmarks

Performance Rating - 3DMark 11 + Fire Strike + Time Spy - UHD Graphics 605
0.2 pt (1%)
3DMark - 3DMark Time Spy Score
129 Points (0%)
3DMark - 3DMark Time Spy Graphics
113 Points (0%)
3DMark - 3DMark Ice Storm Extreme Graphics
min: 13350     avg: 16118     median: 16553.5 (2%)     max: 18016 Points
3DMark - 3DMark Ice Storm Graphics
min: 20859     avg: 25930     median: 26031 (3%)     max: 30797 Points
3DMark - 3DMark Sling Shot (ES 3.0) Unlimited
2870 Points (12%)
3DMark - 3DMark Sling Shot (ES 3.0) Unlimited Graphics
2805 Points (6%)
3DMark - 3DMark Sling Shot Extreme (ES 3.1) Unlimited
1628 Points (8%)
3DMark - 3DMark Sling Shot Extreme (ES 3.1) Unlimited Graphics
1450 Points (4%)
3DMark - 3DMark Sling Shot (ES 3.0)
2642 Points (23%)
3DMark - 3DMark Sling Shot (ES 3.0) Graphics
2628 Points (16%)
3DMark - 3DMark Sling Shot Extreme (ES 3.1)
1789 Points (9%)
3DMark - 3DMark Sling Shot Extreme (ES 3.1) Graphics
1636 Points (5%)
3DMark - 3DMark Wild Life Unlimited
882 Points (0%)
3DMark - 3DMark Wild Life Extreme Unlimited
281 Points (0%)
3DMark - 3DMark Night Raid
min: 1614     avg: 1751     median: 1619 (2%)     max: 2019 Points
3DMark - 3DMark Night Raid Graphics Score
min: 1849     avg: 2059     median: 1893 (1%)     max: 2434 Points
3DMark Vantage
3DM Vant. Perf. total + Intel UHD Graphics 605
3DMark Vantage - 3DM Vant. Perf. total
2162 Points (1%)
3DM Vant. Perf. GPU no PhysX + Intel UHD Graphics 605
3DMark Vantage - 3DM Vant. Perf. GPU no PhysX
1785 Points (1%)
3DMark 03 - 3DMark 03 - Standard
8388 Points (4%)
3DMark 05 - 3DMark 05 - Standard
5802 Points (6%)
3DMark 06 3DMark 06 - Standard 1280x1024 + Intel UHD Graphics 605
3DMark 06
min: 2882     avg: 4208     median: 4171 (5%)     max: 5570 Points
Unigine Valley 1.0 - Unigine Valley 1.0 DX
1.7 fps (1%)
Unigine Heaven 3.0 - Unigine Heaven 3.0 DX 11
6.5 fps (2%)
Unigine Heaven 3.0 - Unigine Heaven 3.0 OpenGL
7.2 fps (3%)
Unigine Heaven 2.1 - Heaven 2.1 high
9 fps (2%)
Cinebench R10 Cinebench R10 Shading (32bit) + Intel UHD Graphics 605
Cinebench R10 - Cinebench R10 Shading (32bit)
min: 3505     avg: 3812     median: 3773 (3%)     max: 4366 Points
Cinebench R11.5 Cinebench R11.5 OpenGL 64 Bit + Intel UHD Graphics 605
Cinebench R11.5 - Cinebench R11.5 OpenGL 64 Bit
min: 15.24     avg: 17.9     median: 17.9 (6%)     max: 20.5 fps
Cinebench R15
Cinebench R15 OpenGL 64 Bit + Intel UHD Graphics 605
Cinebench R15 OpenGL Ref. Match 64 Bit + Intel UHD Graphics 605
GFXBench - GFXBench 5.0 Aztec Ruins High Tier Offscreen
min: 5.9     avg: 6.4     median: 6.4 (1%)     max: 6.8 fps
GFXBench - GFXBench 5.0 Aztec Ruins Normal Tier Offscreen
min: 9.9     avg: 12.8     median: 12.8 (1%)     max: 15.7 fps
GFXBench - GFXBench Car Chase Offscreen
min: 7.1     avg: 11     median: 11.3 (1%)     max: 14.6 fps
GFXBench 3.1 - GFXBench Manhattan ES 3.1 Offscreen
min: 13     avg: 17.6     median: 16.5 (0%)     max: 23.3 fps
GFXBench 3.0 - GFXBench 3.0 Manhattan Offscreen
min: 16     avg: 23.8     median: 22.1 (1%)     max: 33.4 fps
GFXBench (DX / GLBenchmark) 2.7
GFXBench T-Rex HD Offscreen C24Z16 + Intel UHD Graphics 605
GFXBench (DX / GLBenchmark) 2.7 - GFXBench T-Rex HD Offscreen C24Z16
min: 32     avg: 43.1     median: 45.5 (0%)     max: 51.9 fps
Basemark GPU 1.2 - Basemark GPU 1.2 Vulkan Official Medium Offscreen 1080
23.3 fps (0%)
Basemark GPU 1.2 - Basemark GPU 1.2 Vulkan Official High Offscreen 2160
2 fps (0%)
LuxMark v2.0 64Bit - LuxMark v2.0 Room GPU
min: 67     avg: 93.5     median: 93.5 (0%)     max: 120 Samples/s
LuxMark v2.0 64Bit - LuxMark v2.0 Sala GPU
min: 96     avg: 142     median: 142 (0%)     max: 188 Samples/s
ComputeMark v2.1 - ComputeMark v2.1 Result
min: 432     avg: 490.5     median: 490.5 (1%)     max: 549 Points
Power Consumption - Furmark Stress Test Power Consumption - external Monitor *
min: 10.3     avg: 11     median: 11 (2%)     max: 11.6 Watt
Power Consumption - Witcher 3 Power Consumption *
11.8 Watt (3%)
Power Consumption - Witcher 3 ultra Power Efficiency
0.1 fps per Watt (9%)
Clock Speed - GPU Clock Speed Furmark
515 MHz (20%)

Average Benchmarks Intel UHD Graphics 605 → 0% n=0

- Bereich der Benchmarkergebnisse für diese Grafikkarte
- Durchschnittliche Benchmarkergebnisse für diese Grafikkarte
* Smaller numbers mean a higher performance
1 This benchmark is not used for the average calculation

Spiele-Benchmarks

Die folgenden Benchmarks basieren auf unseren Spieletests mit Testnotebooks. Die Performance dieser Grafikkarte bei den gelisteten Spielen ist abhängig von der verwendeten CPU, Speicherausstattung, Treiber und auch Betriebssystem. Dadurch müssen die untenstehenden Werte nicht repräsentativ sein. Detaillierte Informationen über das verwendete System sehen Sie nach einem Klick auf den fps-Wert.

low 1920x1080
UHD Graphics 605:
31.1  fps
F1 2019

F1 2019

2019
low 1280x720
UHD Graphics 605:
7 8.2 ~ 8 fps
low 1280x720
UHD Graphics 605:
49.8  fps
med. 1920x1080
UHD Graphics 605:
39  fps
high 1920x1080
UHD Graphics 605:
26.6  fps
ultra 1920x1080
UHD Graphics 605:
24.9  fps
QHD 2560x1440
UHD Graphics 605:
23.6  fps
4K 3840x2160
UHD Graphics 605:
15  fps
low 1280x720
UHD Graphics 605:
6.5 10.9 ~ 9 fps
Anno 1800

Anno 1800

2019
low 1280x720
UHD Graphics 605:
5.8  fps
low 1280x720
UHD Graphics 605:
1  fps
low 1280x720
UHD Graphics 605:
11.7 (!) 17.6 ~ 15 fps
low 1280x720
UHD Graphics 605:
1  fps
low 1280x720
UHD Graphics 605:
7.2  fps
low 1280x720
UHD Graphics 605:
4  fps
low 1280x720
UHD Graphics 605:
4  fps
low 1280x720
UHD Graphics 605:
4  fps
Strange Brigade

Strange Brigade

2018
low 1280x720
UHD Graphics 605:
8.5  fps
F1 2018

F1 2018

2018
low 1280x720
UHD Graphics 605:
12  fps
low 1280x720
UHD Graphics 605:
4.6  fps
low 1280x720
UHD Graphics 605:
8.8  fps
Far Cry 5

Far Cry 5

2018
low 1280x720
UHD Graphics 605:
3  fps
World of Tanks enCore

World of Tanks enCore

2018
low 1366x768
UHD Graphics 605:
53  fps
med. 1920x1080
UHD Graphics 605:
8.9  fps
low 1280x720
UHD Graphics 605:
5 6.4 7.2 8.6 9.1 ~ 7 fps
med. 1920x1080
UHD Graphics 605:
3.5 5.9 6 6.1 ~ 5 fps
high 1920x1080
UHD Graphics 605:
3.1 5.3 5.5 5.5 ~ 5 fps
low 1280x720
UHD Graphics 605:
5.5  fps
low 1280x720
UHD Graphics 605:
3.4 4.2 4.4 5.2 7.5 ~ 5 fps
med. 1920x1080
UHD Graphics 605:
3.3  fps
ELEX

ELEX

2017
low 1280x720
UHD Graphics 605:
5.2  fps
low 1280x720
UHD Graphics 605:
7  fps
F1 2017

F1 2017

2017
low 1280x720
UHD Graphics 605:
13  fps
low 1280x720
UHD Graphics 605:
38 41.4 ~ 40 fps
med. 1366x768
UHD Graphics 605:
34.5 36.5 ~ 36 fps
high 1920x1080
UHD Graphics 605:
17 18.4 ~ 18 fps
Dirt 4

Dirt 4

2017
low 1280x720
UHD Graphics 605:
18.8  fps
low 1280x720
UHD Graphics 605:
22.6 26.8 27.8 ~ 26 fps
med. 1920x1080
UHD Graphics 605:
9.9 10 ~ 10 fps
Prey

Prey

2017
low 1280x720
UHD Graphics 605:
5.5  fps
low 1280x720
UHD Graphics 605:
3.2  fps
For Honor

For Honor

2017
low 1280x720
UHD Graphics 605:
9  fps
low 1280x720
UHD Graphics 605:
7.9  fps
low 1024x768
UHD Graphics 605:
12.7  fps
med. 1366x768
UHD Graphics 605:
5.5  fps
Overwatch

Overwatch

2016
low 1280x720
UHD Graphics 605:
11.4  fps
med. 1366x768
UHD Graphics 605:
8.3  fps
low 1280x720
UHD Graphics 605:
4.3  fps
low 1024x768
UHD Graphics 605:
6.9  fps
low 1024x768
UHD Graphics 605:
12.3  fps
low 1366x768
UHD Graphics 605:
22.7 24.7 ~ 24 fps
med. 1366x768
UHD Graphics 605:
14.3  fps
low 1024x768
UHD Graphics 605:
21.6  fps
med. 1366x768
UHD Graphics 605:
15.8  fps
low 1280x720
UHD Graphics 605:
32.5 33.7 35 35.9 36.5 49.5 ~ 37 fps
med. 1366x768
UHD Graphics 605:
11.5 14 14.3 14.3 15.1 18.6 ~ 15 fps
high 1920x1080
UHD Graphics 605:
5.9 6.7 7.4 7.8 10.6 ~ 8 fps
ultra 1920x1080
UHD Graphics 605:
5.9 6.7 10 ~ 8 fps
ultra 1920x1080
UHD Graphics 605:
1.2  fps
low 1024x768
UHD Graphics 605:
42  fps
med. 1366x768
UHD Graphics 605:
12.5  fps
GTA V

GTA V

2015
low 1024x768
UHD Graphics 605:
9.5 11.6 11.7 ~ 11 fps
med. 1366x768
UHD Graphics 605:
9.3  fps
low 1024x768
UHD Graphics 605:
10.9  fps
med. 1366x768
UHD Graphics 605:
9.5  fps
high 1920x1080
UHD Graphics 605:
4  fps
low 1024x768
UHD Graphics 605:
7.8  fps
med. 1366x768
UHD Graphics 605:
6.2  fps
F1 2014

F1 2014

2014
low 1024x768
UHD Graphics 605:
31  fps
med. 1366x768
UHD Graphics 605:
20  fps
high 1920x1080
UHD Graphics 605:
13  fps
low 1024x768
UHD Graphics 605:
17.5  fps
med. 1366x768
UHD Graphics 605:
13.1  fps
low 1280x720
UHD Graphics 605:
14.4  fps
med. 1344x756
UHD Graphics 605:
9.3  fps
Sims 4

Sims 4

2014
low 1024x768
UHD Graphics 605:
96.9  fps
med. 1366x768
UHD Graphics 605:
21.8  fps
high 1920x1080
UHD Graphics 605:
10.5  fps
low 1024x768
UHD Graphics 605:
14.3  fps
med. 1366x768
UHD Graphics 605:
9.5  fps
low 1024x768
UHD Graphics 605:
58.5  fps
med. 1366x768
UHD Graphics 605:
16.5  fps
high 1920x1080
UHD Graphics 605:
12.5  fps
GRID 2

GRID 2

2013
low 1024x768
UHD Graphics 605:
34.7  fps
med. 1366x768
UHD Graphics 605:
17.1  fps
low 1280x720
UHD Graphics 605:
14.8 20.1 23.5 24.4 25.3 26.4 26.9 27.4 33.2 ~ 25 fps
med. 1366x768
UHD Graphics 605:
10.8 11.1 13.2 13.5 13.7 14.7 16.6 17.2 ~ 14 fps
high 1366x768
UHD Graphics 605:
9.4 9.5 10.4 11.6 11.6 12.2 12.9 15.2 ~ 12 fps
ultra 1920x1080
UHD Graphics 605:
2.8 3.3 4.2 4.3 ~ 4 fps
low 1024x768
UHD Graphics 605:
31.6  fps
med. 1366x768
UHD Graphics 605:
18.5  fps
high 1366x768
UHD Graphics 605:
12.5  fps
low 1024x768
UHD Graphics 605:
32.3  fps
med. 1366x768
UHD Graphics 605:
17.1  fps
high 1366x768
UHD Graphics 605:
14.1  fps
low 1024x768
UHD Graphics 605:
44.4 48.4 ~ 46 fps
med. 1366x768
UHD Graphics 605:
26.4 27.5 ~ 27 fps
high 1366x768
UHD Graphics 605:
16.4 17.1 ~ 17 fps
low 1024x768
UHD Graphics 605:
28.8  fps
med. 1366x768
UHD Graphics 605:
21.1  fps
high 1366x768
UHD Graphics 605:
18.6  fps
ultra 1920x1080
UHD Graphics 605:
12.5  fps
Anno 2070

Anno 2070

2011
low 1024x768
UHD Graphics 605:
35  fps
med. 1366x768
UHD Graphics 605:
18  fps
high 1366x768
UHD Graphics 605:
11.4  fps
low 1280x720
UHD Graphics 605:
19.9  fps
med. 1366x768
UHD Graphics 605:
12.3  fps
high 1366x768
UHD Graphics 605:
7.5  fps
low 1024x768
UHD Graphics 605:
27.4  fps
high 1366x768
UHD Graphics 605:
21.2  fps
ultra 1920x1080
UHD Graphics 605:
6.7  fps
Dirt 3

Dirt 3

2011
low 800x600
UHD Graphics 605:
55.6  fps
med. 1024x768
UHD Graphics 605:
22.7  fps
high 1360x768
UHD Graphics 605:
15.2  fps
ultra 1920x1080
UHD Graphics 605:
12.5  fps
low 1024x768
UHD Graphics 605:
78.7  fps
med. 1360x768
UHD Graphics 605:
17.4  fps
high 1360x768
UHD Graphics 605:
10  fps
ultra 1920x1080
UHD Graphics 605:
3.9  fps
Intel UHD Graphics 605lowmed.highultraQHD4K
Hearthstone31.1
F1 20198
League of Legends49.83926.624.923.615
Total War: Three Kingdoms9
Anno 18005.8
The Division 21
Dirt Rally 2.015
Far Cry New Dawn1
Apex Legends7.2
Assassin´s Creed Odyssey4
Forza Horizon 44
Shadow of the Tomb Raider4
Strange Brigade8.5
F1 201812
Monster Hunter World4.6
The Crew 28.8
Far Cry 53
World of Tanks enCore538.9
X-Plane 11.11755
Kingdom Come: Deliverance5.5
Final Fantasy XV Benchmark53.27
ELEX5.2
Middle-earth: Shadow of War7
F1 201713
Team Fortress 2403618
Dirt 418.8
Rocket League2610
Prey5.5
Ghost Recon Wildlands3.2
For Honor9
Resident Evil 77.9
Civilization VI12.75.5
Overwatch11.48.3
The Division4.3
Rise of the Tomb Raider6.9
Rainbow Six Siege12.3
World of Warships2414.3
Metal Gear Solid V21.615.8
Dota 2 Reborn371588
The Witcher 31.2
Dirt Rally4212.5
GTA V119.29
Battlefield Hardline10.99.54
Dragon Age: Inquisition7.86.2
F1 2014312013
Alien: Isolation17.513.1
Middle-earth: Shadow of Mordor14.49.3
Sims 496.921.810.5
Risen 3: Titan Lords14.39.5
GRID: Autosport58.516.512.5
GRID 234.717.1
BioShock Infinite2514124
Tomb Raider31.618.512.5
Dead Space 332.317.114.1
Counter-Strike: GO462717
Diablo III28.821.118.612.5
Anno 2070351811.4
The Elder Scrolls V: Skyrim19.912.37.5
Deus Ex Human Revolution27.421.26.7
Dirt 355.622.715.212.5
StarCraft 278.717.4103.9
< 30 fps
< 60 fps
< 120 fps
≥ 120 fps
44
14
2
29
2

18


8


1


1


Eine Liste mit weiteren Spielen und allen Grafikkarten finden Sie auf unserer Seite: Welches Spiel ist mit welcher Grafikkarte spielbar?

v1.28
log 20. 00:57:03

#0 ran 0s before starting gpusingle class +0s ... 0s

#1 checking url part for id 12736 +0s ... 0s

#2 checking url part for id 8270 +0s ... 0s

#3 checking url part for id 7172 +0s ... 0s

#4 redirected to Ajax server, took 1726786623s time from redirect:0 +0s ... 0s

#5 did not recreate cache, as it is less than 5 days old! Created at Thu, 19 Sep 2024 05:16:33 +0200 +0s ... 0s

#6 composed specs +0.004s ... 0.004s

#7 did output specs +0s ... 0.004s

#8 start showIntegratedCPUs +0s ... 0.004s

#9 getting avg benchmarks for device 12736 +0.018s ... 0.023s

#10 got single benchmarks 12736 +0s ... 0.023s

#11 getting avg benchmarks for device 8270 +0.003s ... 0.026s

#12 got single benchmarks 8270 +0.017s ... 0.043s

#13 getting avg benchmarks for device 7172 +0s ... 0.044s

#14 got single benchmarks 7172 +0.002s ... 0.046s

#15 got avg benchmarks for devices +0s ... 0.046s

#16 min, max, avg, median took s +0.025s ... 0.071s

#17 before gaming benchmark output +0s ... 0.071s

#18 Got 189 rows for game benchmarks. +0.012s ... 0.082s

#19 composed SQL query for gamebenchmarks +0s ... 0.082s

#20 got data and put it in $dataArray +0.003s ... 0.085s

#21 benchmarks composed for output. +0.018s ... 0.103s

#22 calculated avg scores. +0s ... 0.103s

#23 return log +0.001s ... 0.104s

Teilen Sie diesen Artikel, um uns zu unterstützen. Jeder Link hilft!
> Notebook Test, Laptop Test und News > Benchmarks / Technik > Benchmarks / Technik > Grafikkarten Vergleich - Head 2 Head
Autor: Klaus Hinum,  8.09.2017 (Update:  1.07.2023)