

NVIDIA GeForce RTX 3050 A Laptop GPU vs NVIDIA Quadro P4000 Max-Q vs NVIDIA GeForce RTX 3060 Max-Q
NVIDIA GeForce RTX 3050 A Laptop GPU
► remove from comparison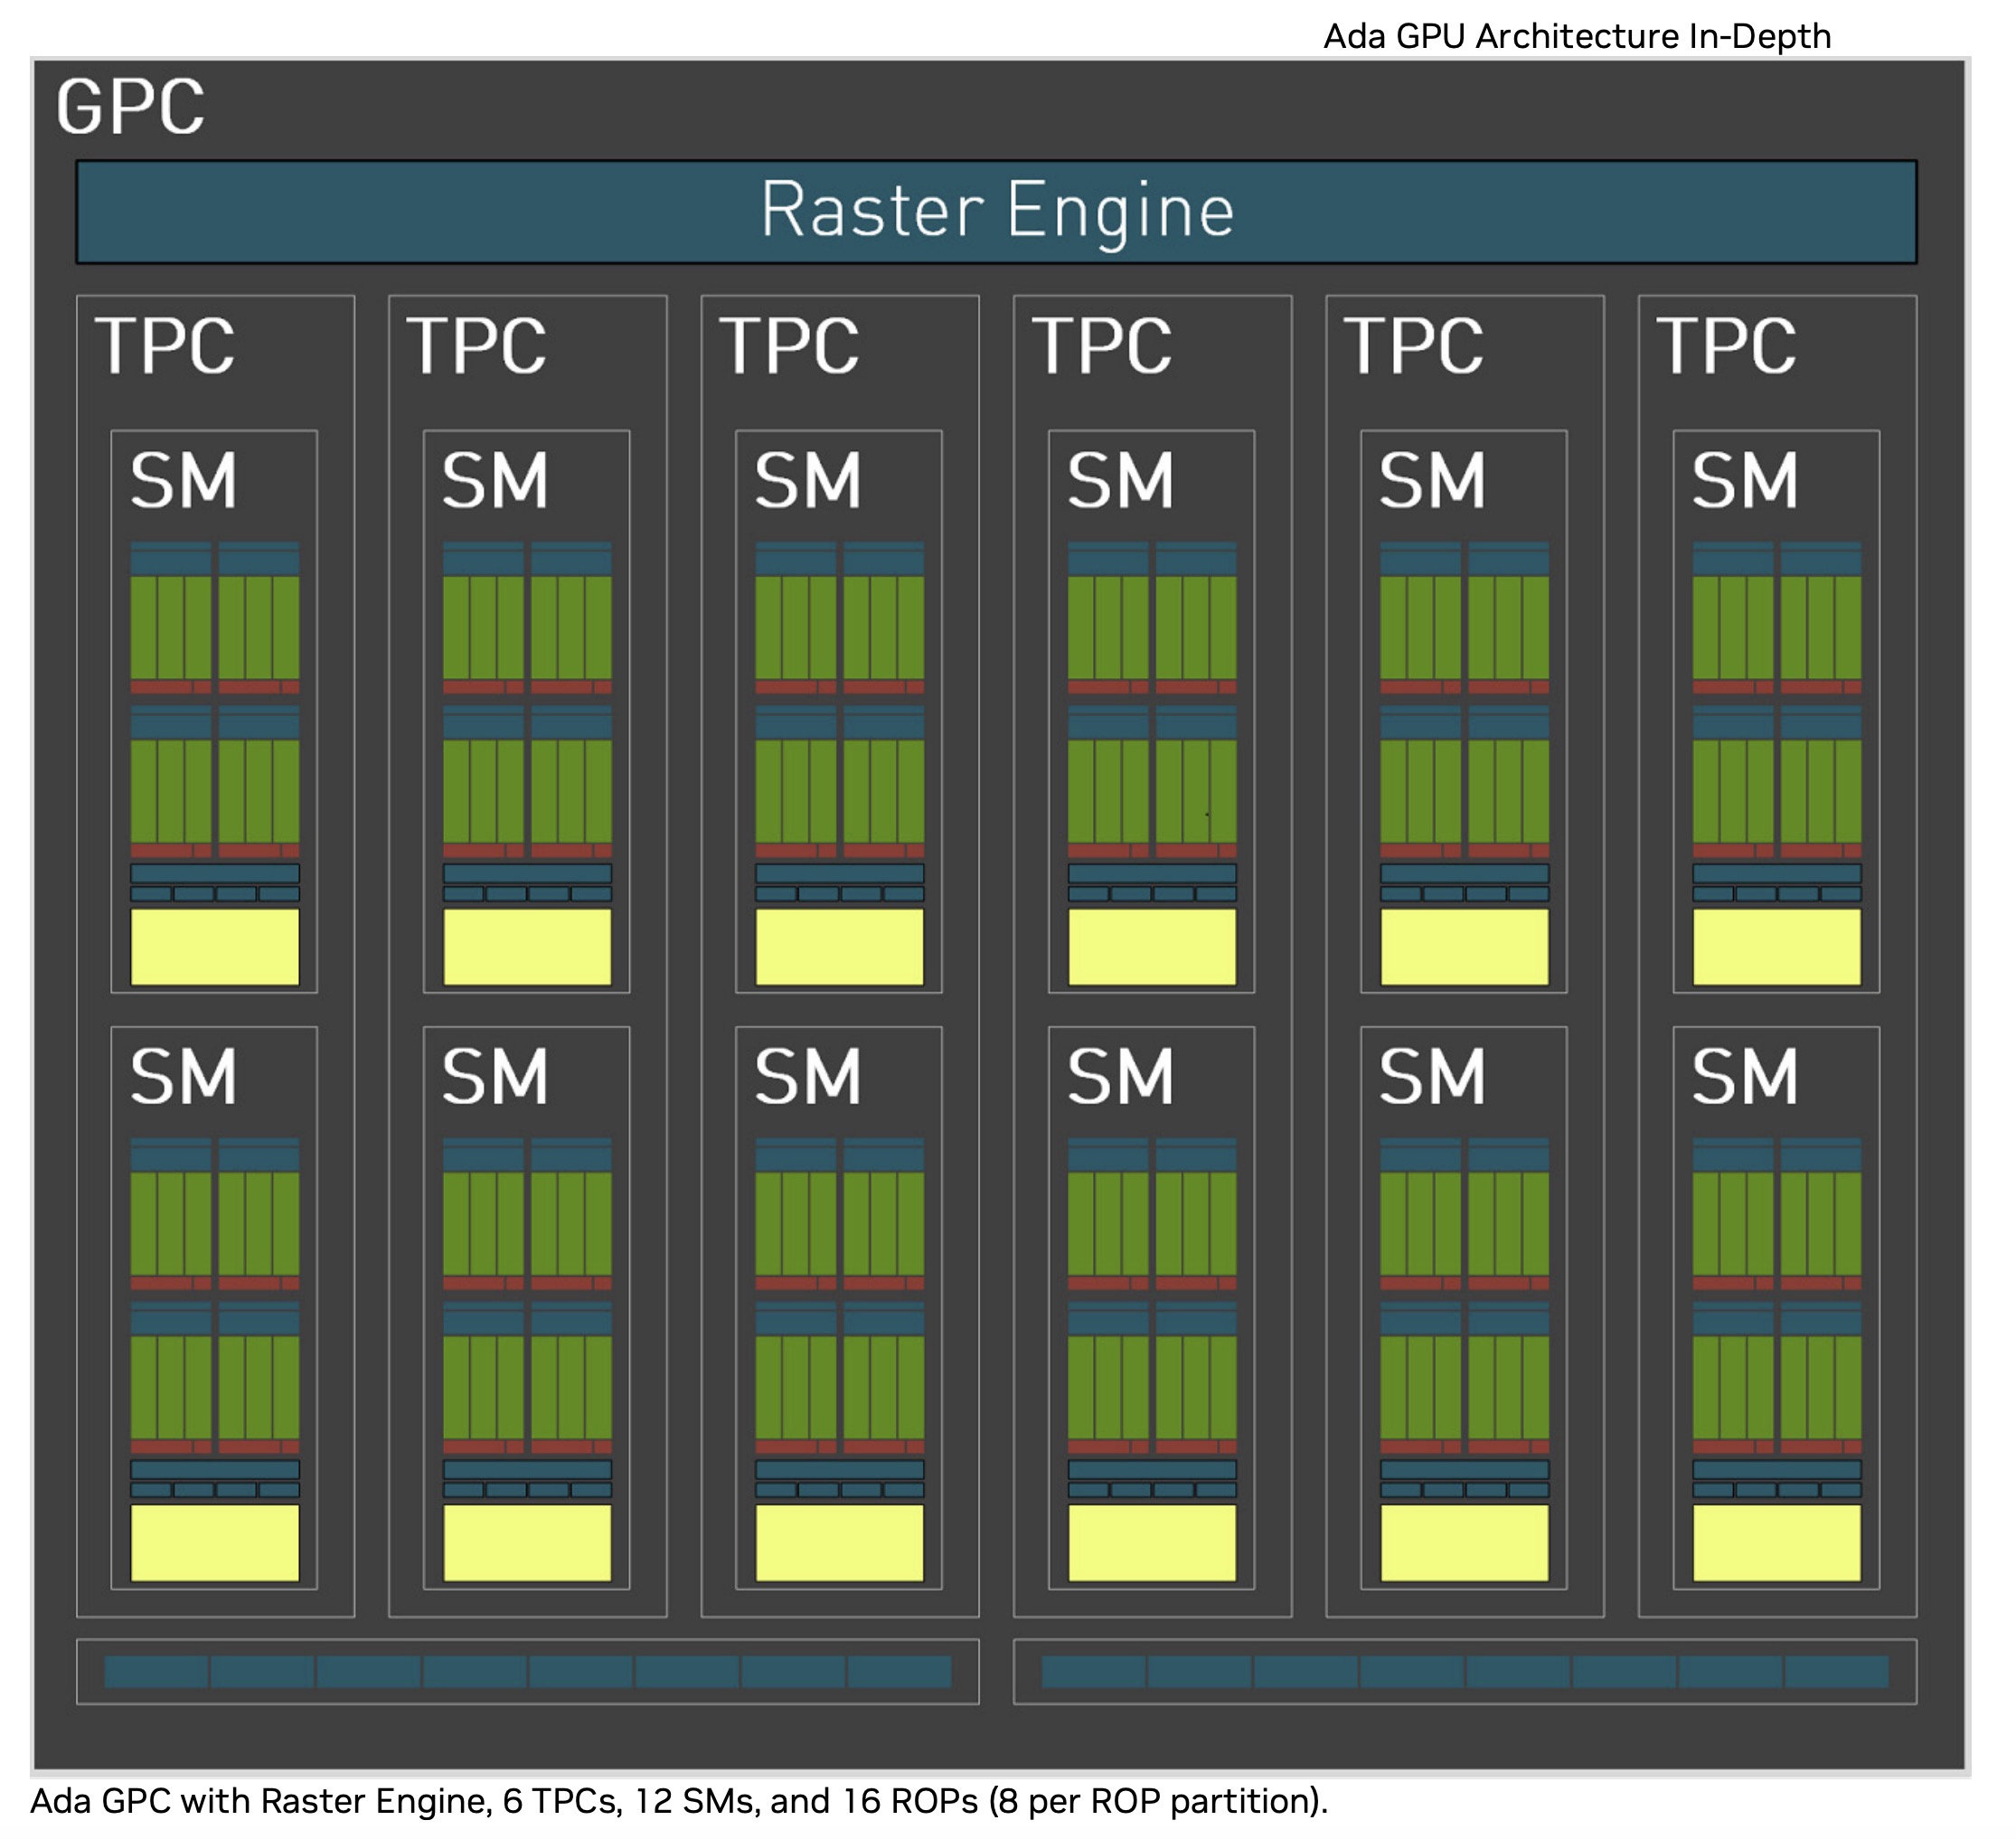
Die Nvidia GeForce RTX 3050 A Laptop GPU (oder Mobile) ist eine neue Variante basierend auf die aktuelle Ada Lovelace Architektur (im Vergleich zu Ampere bei den anderen RTX 3050 Laptop GPUs). Sie nutzt den AD106 Chip der RTX 4060 oder AD107 der RTX 4050, jedoch mit deutlich verringerter Kernanzahl und Speicherbus. Die RTX 3050 A bietet nur 1.792 GPU Kerne (CUDA Cores) und ein 4GB GDDR6 Grafikspeicher der nur mit 64-Bit angebunden ist. Nach aktuellen Informationen ist die 3050 A zum Launch nur für den Indischen Markt gedacht.
Durch die geringe Kernanzahl und den kleinen Speicherbus, sollte die Performance nicht deutlich überhalb der alten RTX 3050 4GB Laptop GPU liegen.
Der AD106 Chip wird bei TSMC im 5nm (4N) Verfahren gefertigt und ist dadurch deutlich effizienter als der alte Ampere Chip der RTX 3050 4GB. Der TGP kann vom Notebookhersteller zwischen 35 und 50 Watt gewählt werden (System Power).
NVIDIA Quadro P4000 Max-Q
► remove from comparison
Die Nvidia Quadro P4000 Max-Q (offiziell Quadro P4000 with Max-Q Design) ist eine mobile High-End-Workstation-Grafikkarte für Notebooks. Sie basiert derzeit auf keiner Consumer Karte direkt und ist die Stromsparvariante der Quadro P4000. Sie bietet ebenfalls 1792 Shader, jedoch etwas niedriger getakatet (1113 - 1240 versus 1202 - ?) bei deutlich reduziertem Stromverbrauch (80 Watt versus 100 Watt TGP). Dadurch eignet sie sich auch für schlankere Notebooks und braucht nur 5 Watt mehr als die normale Quadro P3000. Die stärkere Quadro P5000 mit Max-Q Design ist jedoch ebenfalls mit 80 Watt spezifiziert.
Die Quadro-Grafikkarten bieten zertifizierte Treiber, welche auf Stabiltität und Performance bei professionellen Anwendungen (CAD-, DCC-, Medizin-, Prospektions-, Visualisierungsanwendungen) optimiert sind. Dadurch ist die Performance im Vergleich zu den Consumergrafikkarten mit gleichem Chip in diesen Bereichen deutlich besser.
NVIDIA GeForce RTX 3060 Max-Q
► remove from comparison
Die Nvidia GeForce RTX 3060 Max-Q (für Laptops, GN20-E3) bezeichnet eine GeForce RTX 3060 Laptop GPU mit Max-Q Technologien. Früher waren die Max-Q-Varianten die Stromsparversionen, mit der RTX 3000 Serie kann jedoch jede TGP-Variante mit Max-Q Technologien ausgestattet werden.
| NVIDIA GeForce RTX 3050 A Laptop GPU | NVIDIA Quadro P4000 Max-Q | NVIDIA GeForce RTX 3060 Max-Q | ||||||||||||||||||||||||||||||||||||||||||||||||||||||||||||||||||||||||||||||||||||||||||||||||||||||||||||||||||||||||||||||||||||||||||||||||||||||||||||||||||||||||||||
| GeForce RTX 3000 Serie |
|
|
| |||||||||||||||||||||||||||||||||||||||||||||||||||||||||||||||||||||||||||||||||||||||||||||||||||||||||||||||||||||||||||||||||||||||||||||||||||||||||||||||||||||||||||
| Architektur | Ada Lovelace | Pascal | Ampere | |||||||||||||||||||||||||||||||||||||||||||||||||||||||||||||||||||||||||||||||||||||||||||||||||||||||||||||||||||||||||||||||||||||||||||||||||||||||||||||||||||||||||||
| Pipelines | 1792 - unified | 1792 - unified | 3840 - unified | |||||||||||||||||||||||||||||||||||||||||||||||||||||||||||||||||||||||||||||||||||||||||||||||||||||||||||||||||||||||||||||||||||||||||||||||||||||||||||||||||||||||||||
| Speicherbandbreite | 64 Bit | 256 Bit | 192 Bit | |||||||||||||||||||||||||||||||||||||||||||||||||||||||||||||||||||||||||||||||||||||||||||||||||||||||||||||||||||||||||||||||||||||||||||||||||||||||||||||||||||||||||||
| Speichertyp | GDDR6 | GDDR5 | GDDR6 | |||||||||||||||||||||||||||||||||||||||||||||||||||||||||||||||||||||||||||||||||||||||||||||||||||||||||||||||||||||||||||||||||||||||||||||||||||||||||||||||||||||||||||
| Max. Speichergröße | 4 GB | 16 GB | 6 GB | |||||||||||||||||||||||||||||||||||||||||||||||||||||||||||||||||||||||||||||||||||||||||||||||||||||||||||||||||||||||||||||||||||||||||||||||||||||||||||||||||||||||||||
| Shared Memory | nein | nein | nein | |||||||||||||||||||||||||||||||||||||||||||||||||||||||||||||||||||||||||||||||||||||||||||||||||||||||||||||||||||||||||||||||||||||||||||||||||||||||||||||||||||||||||||
| API | DirectX 12_2, Shader 6.7, OpenGL 4.6 | DirectX 12_1, Shader 5.0, OpenGL 4.5 | DirectX 12_2, Shader 6.7, OpenGL 4.6 | |||||||||||||||||||||||||||||||||||||||||||||||||||||||||||||||||||||||||||||||||||||||||||||||||||||||||||||||||||||||||||||||||||||||||||||||||||||||||||||||||||||||||||
| Stromverbrauch | 45 Watt (35 - 80 Watt TGP) | 80 Watt | 60 Watt | |||||||||||||||||||||||||||||||||||||||||||||||||||||||||||||||||||||||||||||||||||||||||||||||||||||||||||||||||||||||||||||||||||||||||||||||||||||||||||||||||||||||||||
| Herstellungsprozess | 5 nm | 16 nm | 8 nm | |||||||||||||||||||||||||||||||||||||||||||||||||||||||||||||||||||||||||||||||||||||||||||||||||||||||||||||||||||||||||||||||||||||||||||||||||||||||||||||||||||||||||||
| PCIe | 4.0 | |||||||||||||||||||||||||||||||||||||||||||||||||||||||||||||||||||||||||||||||||||||||||||||||||||||||||||||||||||||||||||||||||||||||||||||||||||||||||||||||||||||||||||||
| Displays | HDMI 2.1, DisplayPort 1.4a | |||||||||||||||||||||||||||||||||||||||||||||||||||||||||||||||||||||||||||||||||||||||||||||||||||||||||||||||||||||||||||||||||||||||||||||||||||||||||||||||||||||||||||||
| Features | NVIDIA DLSS, NVIDIA Reflex, Resizable BAR, NVIDIA Broadcast, NVIDIA Ansel, NVIDIA ShadowPlay, NVIDIA G-SYNC, Advanced Optimus, Nvidia Max-Q, Dynamic Boost | Optimus, PhysX, 3D Vision Pro, nView, Optimus | ||||||||||||||||||||||||||||||||||||||||||||||||||||||||||||||||||||||||||||||||||||||||||||||||||||||||||||||||||||||||||||||||||||||||||||||||||||||||||||||||||||||||||||
| Notebookgröße | mittel (15.4" z.B.) | groß (17" z.B.) | groß (17" z.B.) | |||||||||||||||||||||||||||||||||||||||||||||||||||||||||||||||||||||||||||||||||||||||||||||||||||||||||||||||||||||||||||||||||||||||||||||||||||||||||||||||||||||||||||
| Erscheinungsdatum | 26.07.2024 | 11.01.2017 | 04.01.2021 | |||||||||||||||||||||||||||||||||||||||||||||||||||||||||||||||||||||||||||||||||||||||||||||||||||||||||||||||||||||||||||||||||||||||||||||||||||||||||||||||||||||||||||
| Predecessor | GeForce RTX 3050 4GB Laptop GPU | |||||||||||||||||||||||||||||||||||||||||||||||||||||||||||||||||||||||||||||||||||||||||||||||||||||||||||||||||||||||||||||||||||||||||||||||||||||||||||||||||||||||||||||
| Codename | N17E-Q3 Max-Q | GN20-E3 GA106 | ||||||||||||||||||||||||||||||||||||||||||||||||||||||||||||||||||||||||||||||||||||||||||||||||||||||||||||||||||||||||||||||||||||||||||||||||||||||||||||||||||||||||||||
| Kerntakt | 1113 - 1240 (Boost) MHz | 1283 (Boost) MHz | ||||||||||||||||||||||||||||||||||||||||||||||||||||||||||||||||||||||||||||||||||||||||||||||||||||||||||||||||||||||||||||||||||||||||||||||||||||||||||||||||||||||||||||
| Speichertakt | 6006 MHz | |||||||||||||||||||||||||||||||||||||||||||||||||||||||||||||||||||||||||||||||||||||||||||||||||||||||||||||||||||||||||||||||||||||||||||||||||||||||||||||||||||||||||||||
| Herstellerseite | www.nvidia.com |
Benchmarks

specvp12 sw-03 + NVIDIA Quadro P4000 Max-Q
Cinebench R15 OpenGL 64 Bit + NVIDIA Quadro P4000 Max-Q
Average Benchmarks NVIDIA Quadro P4000 Max-Q → 0% n=0
* Smaller numbers mean a higher performance
1 This benchmark is not used for the average calculation
Spiele-Benchmarks
Die folgenden Benchmarks basieren auf unseren Spieletests mit Testnotebooks. Die Performance dieser Grafikkarte bei den gelisteten Spielen ist abhängig von der verwendeten CPU, Speicherausstattung, Treiber und auch Betriebssystem. Dadurch müssen die untenstehenden Werte nicht repräsentativ sein. Detaillierte Informationen über das verwendete System sehen Sie nach einem Klick auf den fps-Wert.
Ark Survival Evolved
2017
F1 2017
2017Dirt 4
2017Rocket League
2017Prey
2017
Resident Evil 7
2017
Civilization VI
2016Mafia 3
2016
Doom
2016


Just Cause 3
2015
Fallout 4
2015

Metal Gear Solid V
2015

The Witcher 3
2015
Ryse: Son of Rome
2014
Alien: Isolation
2014

Thief
2014

Company of Heroes 2
2013
Metro: Last Light
2013BioShock Infinite
2013
Batman: Arkham City
2011| NVIDIA Quadro P4000 Max-Q | low | med. | high | ultra | QHD | 4K |
|---|---|---|---|---|---|---|
| Ark Survival Evolved | 92 | 52 | 51 | 27 | 27 | |
| F1 2017 | 193 | 140 | 105 | 72 | 34 | |
| Dirt 4 | 220 | 164 | 93 | 55 | 34 | |
| Rocket League | 244 | 223 | 163 | |||
| Prey | 142 | 129 | 125 | 109 | 38 | |
| Resident Evil 7 | 354 | 195 | 161 | 135 | 60 | |
| Civilization VI | 80 | 76 | 63 | 60 | 44 | |
| Mafia 3 | 84 | 104 | 43 | 17 | ||
| Deus Ex Mankind Divided | 129 | 106 | 60 | 32 | 21 | |
| Doom | 130 | 121 | 97 | 92 | 35 | |
| Ashes of the Singularity | 76 | 67 | 62 | 26 | ||
| Rise of the Tomb Raider | 176 | 144 | 77 | 65 | 28 | |
| Just Cause 3 | 140 | 133 | 89 | 77 | 35 | |
| Fallout 4 | 156 | 151 | 93 | 76 | 30 | |
| Call of Duty: Black Ops 3 | 145 | 133 | 85 | 82 | 32 | |
| Metal Gear Solid V | 60 | 60 | 60 | 60 | 50 | |
| Batman: Arkham Knight | 171 | 152 | 96 | 94 | 32 | |
| The Witcher 3 | 162 | 119 | 79 | 42 | 29 | |
| Ryse: Son of Rome | 121 | 111 | 88 | 82 | ||
| Alien: Isolation | 250 | 212 | 192 | 148 | ||
| Middle-earth: Shadow of Mordor | 123 | 112 | 107 | 90 | ||
| Thief | 96 | 94 | 93 | 79 | ||
| Batman: Arkham Origins | 330 | 270 | 177 | 82 | ||
| Company of Heroes 2 | 69 | 63 | 62 | 50 | ||
| Metro: Last Light | 129 | 79 | 78 | 84 | ||
| BioShock Infinite | 256 | 218 | 202 | 113 | ||
| Batman: Arkham City | 195 | 170 | 144 | 106 | ||
| < 30 fps < 60 fps < 120 fps ≥ 120 fps | 7 20 | 1 11 15 | 2 18 7 | 1 4 17 2 | | 6 10 1 |
Eine Liste mit weiteren Spielen und allen Grafikkarten finden Sie auf unserer Seite: Welches Spiel ist mit welcher Grafikkarte spielbar?