Notebookcheck Logo

NVIDIA GeForce RTX 2080 Super Mobile vs NVIDIA Quadro RTX 6000 (Laptop) vs NVIDIA Quadro RTX 5000 Max-Q

NVIDIA GeForce RTX 2080 Super Mobile

► remove from comparison NVIDIA GeForce RTX 2080 Super Mobile

Die Nvidia GeForce RTX 2080 Super Mobile (für Laptops) ist Anfang 2020 die schnellste Grafikkarte für Notebooks. Sie basiert auf die Desktop GeForce RTX 2080 Super jedoch bei deutlich reduzierten Taktraten der Kerne (oder auch weniger Kerne). Im Vergleich zur älteren RTX 2080 für Laptops, handelt es sich bei der Super Variante um einen leichten Refresh.

Nach aktuellen Informationen wird es die RTX 2080 Super mit einem TGP von 150 - 200 Watt geben mit Taktraten von 1365 / 1560 (Base / Boost) bis 1560 / 1710 MHz und dementsprechend unterschiedlicher Leistung. Nvidia listet offiziell bis zur 150 Watt Variante mit 1365 - 1560 MHz. Zusätzliche gibt es noch 3 Max-Q Varianten mit einem TGP von 80, 85 und 90 Watt.

ModelTGPBaseBoost
RTX 2080 Super200W15601740
RTX 2080 Super190W15301710
RTX 2080 Super180W14851680
RTX 2080 Super170W14551635
RTX 2080 Super160W14101605
RTX 2080 Super150W13651560
RTX 2080 Super Max-Q90W9751230
RTX 2080 Super Max-Q85W8851155
RTX 2080 Super Max-Q80W7351080

Features

Der TU104-Chip wird in 12nm gefertigt und bietet eine Reihe neuer Features, wie DLSS (Deep Learning Super Sampling) und Real Time Ray Tracing. Dadurch lassen sich vor allem Beleuchtungseffekte sehr viel realistischer darstellen. Weiterhin gibt es Support für DisplayPort 1.4 (ready), HDMI 2.0b, HDR, Simultaneous Multi-Projection (SMP) sowie H.265 Video De- und Encoding (PlayReady 3.0). 

Performance

Im Vergleich zu einer RTX 2080 Mobile (bei gleichen TDP Settings) soll der Performance-Gewinn relativ gering ausfallen. Damit ordnet sich die RTX 2080 im absoluten High-End-Segment ein und kann die meisten Spiele des Jahres 2019 in hohen Einstellungen und 4K-Auflösung flüssig darstellen.

Der Stromverbrauch wurde im Vergleich zur Desktop-Version von 250 auf 150-200 Watt TDP reduziert. Daher eignet sich die RTX 2080 nur für große und schwere Notebooks. Die sparsamere und langsamere Max-Q Version mit 80 bzw 90 Watt TDP ist für dünnere Notebooks gedacht.

NVIDIA Quadro RTX 6000 (Laptop)

► remove from comparison NVIDIA Quadro RTX 6000 (Laptop)

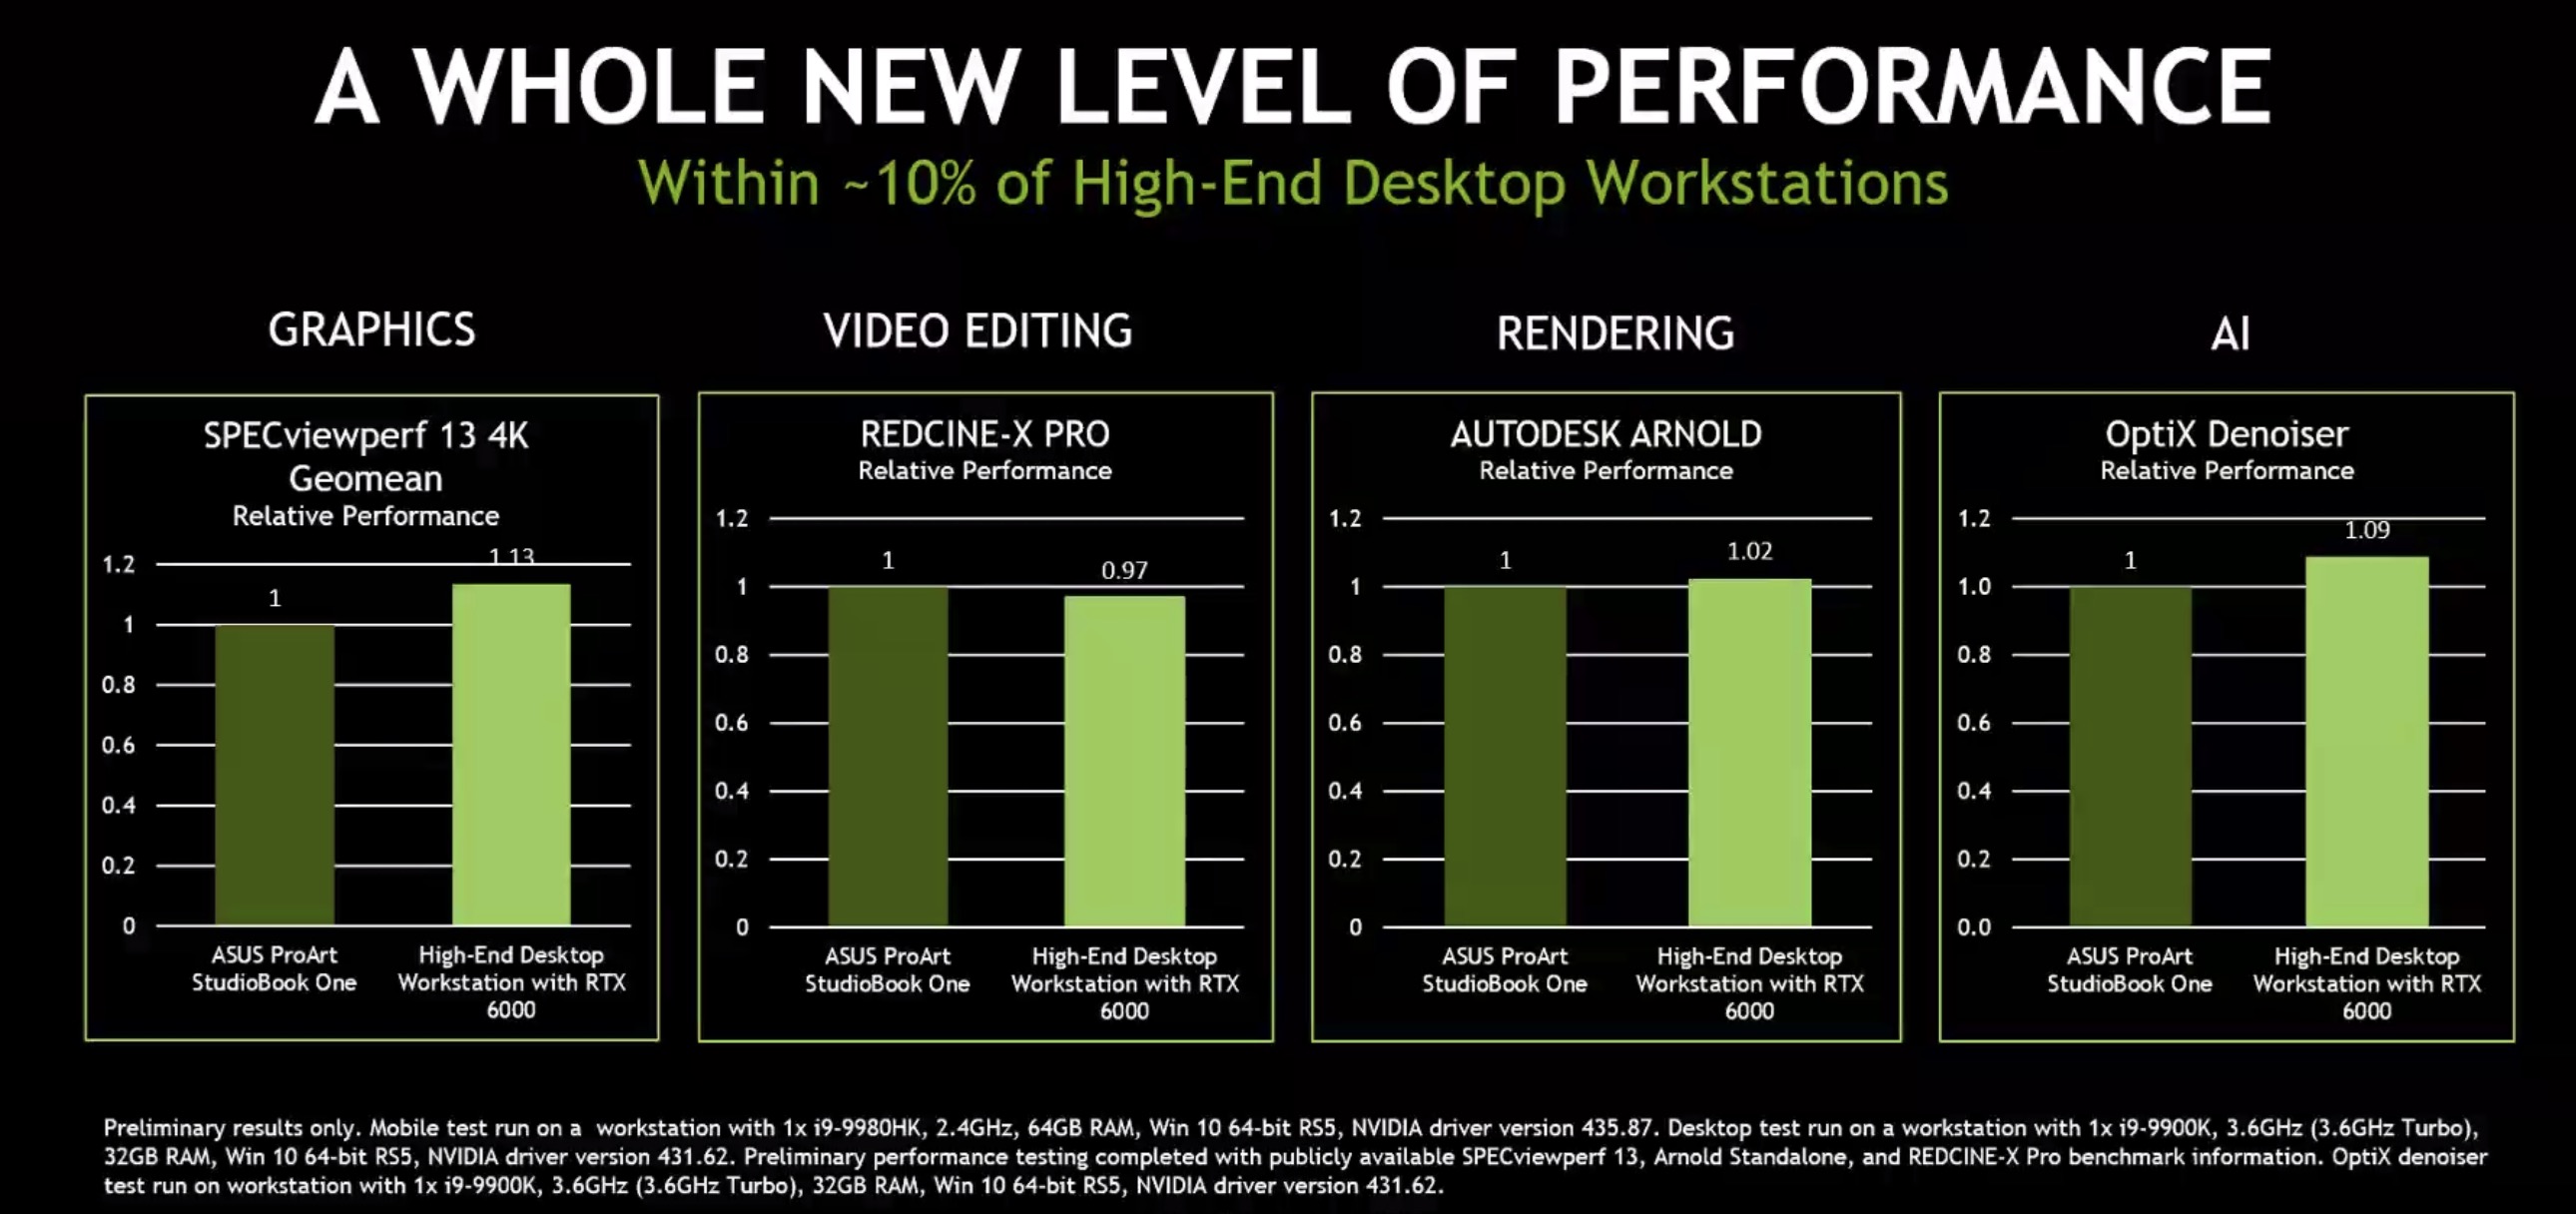
Die Nvidia Quadro RTX 6000 für Laptops ist eine professionelle Grafikkarte für große und schwere Notebooks. Sie basiert wie die Consumer GeForce RTX 2080 Ti auf den TU102 Chip, bietet jedoch mit 4.608 Shader und 24 GB GDDR6 Grafikspeicher. Im Vergleich zur Desktop RTX 6000, wird die mobile deutlich geringer getaktet.

Die Quadro-Grafikkarten bieten zertifizierte Treiber, welche auf Stabiltität und Performance bei professionellen Anwendungen (CAD-, DCC-, Medizin-, Prospektions-, Visualisierungsanwendungen) optimiert sind. Dadurch ist die Performance im Vergleich zu den Consumergrafikkarten mit gleichem Chip in diesen Bereichen deutlich besser.

Features

Der TU102-Chip wird in 12nm gefertigt und bietet eine Reihe neuer Features, wie DLSS (Deep Learning Super Sampling) und Real Time Ray Tracing. Dadurch lassen sich vor allem Beleuchtungseffekte sehr viel realistischer darstellen. Weiterhin gibt es Support für DisplayPort 1.4 (ready), HDMI 2.0b, HDR, Simultaneous Multi-Projection (SMP) sowie H.265 Video De- und Encoding (PlayReady 3.0).

Performance

Durch die verringerten Taktraten bleibt die RTX 6000 für Notebooks etwas hinter der gleichnamigen Desktop GPU zurück. Nvidia selbst gibt and das die Desktop Version 13% schneller ist im Durchschnittswert des SPECviewperf 13 4K.

Der extrem hohe TDP von 200 Watt ermöglicht die nutzung der mobilen Quadro RTX 6000 nur in großen Notebooks mit hervorragender Kühllösung.

NVIDIA Quadro RTX 5000 Max-Q

► remove from comparison

Die Nvidia Quadro RTX 5000 mit Max-Q Design ist eine professionelle Grafikkarte für große und schwere Laptops. Sie basiert auf die normale (Max-P) Quadro RTX 5000 für Laptops jedoch mit reduzierten Taktraten und dadurch geringere Leistung bei weniger Stromverbrauch und höherer Effizienz. Nach unseren Informationen gibt es drei Varianten mit 80, 85 und 90 Watt TGP Stromverbrauch und damit bis zu 27% weniger (RTX5000 ist auf 110 Watt spezifiziert). Die Performance kann dadurch auch um bis zu 24% schlechter ausfallen (Boost-Takt-Unterschied).

VarianteTGP (W)Base (MHz)Boost (MHz)
Quadro RTX 5000 Desktop23016201815
Quadro RTX 5000 Mobile15013501770
Quadro RTX 5000 Mobile11010351545
Quadro RTX 5000 Max-Q909301455
Quadro RTX 5000 Max-Q857651395
Quadro RTX 5000 Max-Q806001350

Die Quadro-Grafikkarten bieten zertifizierte Treiber, welche auf Stabiltität und Performance bei professionellen Anwendungen (CAD-, DCC-, Medizin-, Prospektions-, Visualisierungsanwendungen) optimiert sind. Dadurch ist die Performance im Vergleich zu den Consumergrafikkarten mit gleichem Chip in diesen Bereichen deutlich besser.

Features

Der TU104-Chip wird in 12nm gefertigt und bietet eine Reihe neuer Features, wie DLSS (Deep Learning Super Sampling) und Real Time Ray Tracing. Dadurch lassen sich vor allem Beleuchtungseffekte sehr viel realistischer darstellen. Weiterhin gibt es Support für DisplayPort 1.4 (ready), HDMI 2.0b, HDR, Simultaneous Multi-Projection (SMP) sowie H.265 Video De- und Encoding (PlayReady 3.0). 

Performance

Die schwächsten Max-Q Varianten werden wahrscheinlich Probleme haben mit den starken Quadro RTX 4000 GPUs mitzuhalten. Trotzdem ist die Leistung der Quadro RTX 5000 Max-Q hervorragend und unter den schnellsten Notebook-GPUs. 

Durch den immer noch hohen Stromverbrauch, eignet sich die Quadro RTX5000 Max-Q nicht für kleine und sehr dünne Notebooks.

NVIDIA GeForce RTX 2080 Super MobileNVIDIA Quadro RTX 6000 (Laptop)NVIDIA Quadro RTX 5000 Max-Q
Quadro Turing Serie
NVIDIA Titan RTX 4608 @ 1.35 - 1.77 GHz384 Bit @ 14000 MHz
GeForce RTX 2080 Ti (Desktop) 4352 @ 1.35 - 1.55 GHz352 Bit @ 14000 MHz
GeForce RTX 2080 Super (Desktop) 3072 @ 1.65 - 1.82 GHz256 Bit @ 15500 MHz
GeForce RTX 2080 (Desktop) 2944 @ 1.52 - 1.71 GHz256 Bit @ 14000 MHz
GeForce RTX 2080 Super Mobile 3072 @ 1.37 - 1.56 GHz256 Bit @ 14000 MHz
GeForce RTX 2080 Mobile 2944 @ 1.38 - 1.59 GHz256 Bit @ 14000 MHz
GeForce RTX 2070 Super (Desktop) 2560 @ 1.61 - 1.77 GHz256 Bit @ 14000 MHz
GeForce RTX 2070 (Desktop) 2304 @ 1.41 - 1.62 GHz256 Bit @ 14000 MHz
GeForce RTX 2070 Super Mobile 2560 @ 1.14 - 1.38 GHz256 Bit @ 14002 MHz
GeForce RTX 2080 Super Max-Q 3072 @ 0.98 - 1.23 GHz256 Bit @ 11000 MHz
GeForce RTX 2060 Super (Desktop) 2176 @ 1.47 - 1.65 GHz256 Bit @ 14000 MHz
GeForce RTX 2070 Mobile 2304 @ 1.22 - 1.44 GHz256 Bit @ 14000 MHz
GeForce RTX 2080 Max-Q 2944 @ 0.74 - 1.1 GHz256 Bit @ 12000 MHz
GeForce RTX 2060 (Desktop) 1920 @ 1.32 - 1.62 GHz192 Bit @ 14000 MHz
GeForce RTX 2070 Super Max-Q 2560 @ 0.93 - 1.16 GHz256 Bit @ 11000 MHz
GeForce RTX 2070 Max-Q 2304 @ 0.89 - 1.19 GHz256 Bit @ 12000 MHz
GeForce RTX 2060 Mobile 1920 @ 0.96 - 1.2 GHz192 Bit @ 14000 MHz
GeForce RTX 2060 Max-Q 1920 @ 0.98 - 1.19 GHz192 Bit @ 11000 MHz
GeForce RTX 2050 Mobile 2048 @ 1.48 GHz64 Bit @ 14000 MHz
Quadro RTX 6000 (Laptop) 4608 @ 1.28 - 1.46 GHz384 Bit @ 14000 MHz
Quadro RTX 5000 (Laptop) 3072 @ 1.04 - 1.55 GHz256 Bit @ 14000 MHz
Quadro RTX 5000 Max-Q 3072 @ 0.6 - 1.35 GHz256 Bit @ 14000 MHz
Quadro RTX 4000 (Laptop) 2560 @ 1.11 - 1.56 GHz256 Bit @ 14000 MHz
Quadro RTX 4000 Max-Q 2560 @ 0.78 - 1.38 GHz256 Bit @ 14000 MHz
Quadro RTX 3000 (Laptop) 1920 @ 0.95 - 1.38 GHz192 Bit @ 14000 MHz
Quadro RTX 3000 Max-Q 1920 @ 0.6 - 1.22 GHz192 Bit @ 14000 MHz
Quadro T2000 (Laptop) 1024 @ 1.58 - 1.79 GHz128 Bit @ 8000 MHz
Quadro T2000 Max-Q 1024 @ 0.93 - 1.5 GHz128 Bit @ 8000 MHz
T1000
T1200 Laptop GPU 1024 @ 0.86 - 1.43 GHz128 Bit @ 10000 MHz
Quadro T1000 (Laptop) 768 @ 1.4 - 1.46 GHz128 Bit @ 8000 MHz
Quadro T1000 Max-Q 768 @ 0.8 - 1.46 GHz128 Bit @ 8000 MHz
T600 Laptop GPU 896 @ 1.4 GHz128 Bit @ 10000 MHz
T550 Laptop GPU 1024 @ 1.07 - 1.67 GHz64 Bit @ 12000 MHz
T500 Laptop GPU 896 @ 1.37 - 1.7 GHz64 Bit @ 10000 MHz
T600 640 @ 0.74 - 1.34 GHz128 Bit @ 10000 MHz
CodenameN18E-G3 TU104TU102N19E-Q5 MAX-Q
ArchitekturTuringTuringTuring
Pipelines3072 - unified4608 - unified3072 - unified
Kerntakt1365 - 1560 (Boost) MHz1275 - 1455 (Boost) MHz600 - 930 - 1350 - 1455 (Boost) MHz
Speichertakt14000 MHz14000 MHz14000 MHz
Speicherbandbreite256 Bit384 Bit256 Bit
SpeichertypGDDR6GDDR6GDDR6
Max. Speichergröße8 GB24 GB16 GB
Shared Memoryneinneinnein
APIDirectX 12_1, OpenGL 4.6DirectX 12_1, OpenGL 4.6DirectX 12_1, OpenGL 4.6
Stromverbrauch150 Watt200 Watt80 - 90 Watt
Transistors13.6 Billion18.6 Billion13.6 Billion
Herstellungsprozess12 nm12 nm12 nm
FeaturesNVLink, DLSS, Raytraycing, VR Ready, G-SYNC, Vulkan, Multi Monitor, 650 Watt system power recommendedNVLink, DLSS, Raytraycing, VR Ready, G-SYNC, Vulkan, Multi MonitorNVLink, DLSS, Raytraycing, VR Ready, G-SYNC, Vulkan, Multi Monitor
Notebookgrößegroß (17" z.B.)groß (17" z.B.)groß (17" z.B.)
Erscheinungsdatum02.04.2020 04.09.2019 27.05.2019

Benchmarks

Performance Rating - 3DMark 11 + Fire Strike + Time Spy - Quadro RTX 5000 Max-Q
8.8 pt (26%)
3DMark - 3DMark Time Spy Score
min: 9629     avg: 10443     median: 10465.5 (30%)     max: 11211 Points
11084 Points (32%)
min: 6801     avg: 7289     median: 7282.5 (21%)     max: 7920 Points
3DMark - 3DMark Time Spy Graphics
min: 9638     avg: 10301     median: 10313 (27%)     max: 10938 Points
min: 6999     avg: 7432     median: 7396 (20%)     max: 7977 Points
3DMark - 3DMark Ice Storm Unlimited Graphics
min: 414147     avg: 428807     median: 433183 (44%)     max: 439090 Points
3DMark - 3DMark Ice Storm Extreme Graphics
47453 Points (6%)
3DMark - 3DMark Cloud Gate Score
min: 49644     avg: 53643     median: 54828 (59%)     max: 56456 Points
min: 25769     avg: 34615     median: 32096 (34%)     max: 52005 Points
3DMark - 3DMark Cloud Gate Graphics
min: 120212     avg: 140608     median: 141486 (37%)     max: 160125 Points
min: 50993     avg: 78524     median: 64768 (17%)     max: 126073 Points
3DMark - 3DMark Fire Strike Standard Score
min: 20902     avg: 21566     median: 21377.5 (38%)     max: 22606 Points
min: 16005     avg: 16773     median: 16600.5 (29%)     max: 18226 Points
3DMark - 3DMark Fire Strike Standard Graphics
min: 24211     avg: 24932     median: 24960 (28%)     max: 25597 Points
min: 18247     avg: 19825     median: 19790 (22%)     max: 21115 Points
3DMark - 3DMark Ice Storm Graphics
min: 70493     avg: 94644     median: 94644 (11%)     max: 118795 Points
3DMark 11 - 3DM11 Performance Score
min: 27065     avg: 28873     median: 28467 (39%)     max: 31493 Points
min: 19250     avg: 21300     median: 20890 (29%)     max: 23789 Points
3DMark 11 - 3DM11 Performance GPU
min: 34021     avg: 35153     median: 34875.5 (30%)     max: 36838 Points
min: 24156     avg: 26602     median: 26465 (23%)     max: 28524 Points
3DMark Vantage
3DM Vant. Perf. total + NVIDIA GeForce RTX 2080 Super Mobile
3DMark Vantage - 3DM Vant. Perf. total
69838 Points (20%)
3DM Vant. Perf. total + NVIDIA Quadro RTX 5000 Max-Q
min: 52289     avg: 53221     median: 53221 (15%)     max: 54153 Points
3DM Vant. Perf. GPU no PhysX + NVIDIA GeForce RTX 2080 Super Mobile
3DMark Vantage - 3DM Vant. Perf. GPU no PhysX
77180 Points (42%)
3DM Vant. Perf. GPU no PhysX + NVIDIA Quadro RTX 5000 Max-Q
min: 62319     avg: 62862     median: 62861.5 (34%)     max: 63404 Points
3DMark 06 3DMark 06 - Standard 1280x1024 + NVIDIA GeForce RTX 2080 Super Mobile
3DMark 06
41873 Points (55%)
3DMark 06 - Standard 1280x1024 + NVIDIA Quadro RTX 5000 Max-Q
min: 38739     avg: 40510     median: 40509.5 (53%)     max: 42280 Points
Unigine Valley 1.0 - Unigine Valley 1.0 DX
94.6 fps (29%)
Unigine Heaven 3.0 - Unigine Heaven 3.0 DX 11
236.6 fps (78%)
Unigine Heaven 3.0 - Unigine Heaven 3.0 OpenGL
174.6 fps (77%)
Unigine Heaven 2.1 - Heaven 2.1 high
236.1 fps (44%)
SPECviewperf 12
specvp12 sw-03 + NVIDIA Quadro RTX 5000 Max-Q
SPECviewperf 12 - specvp12 sw-03
min: 106.8     avg: 125.7     median: 122.8 (30%)     max: 156.9 fps
specvp12 snx-02 + NVIDIA Quadro RTX 5000 Max-Q
SPECviewperf 12 - specvp12 snx-02
min: 120.7     avg: 139.8     median: 138.4 (20%)     max: 165 fps
specvp12 showcase-01 + NVIDIA Quadro RTX 5000 Max-Q
SPECviewperf 12 - specvp12 showcase-01
min: 89     avg: 95.8     median: 96.5 (21%)     max: 100.3 fps
specvp12 mediacal-01 + NVIDIA Quadro RTX 5000 Max-Q
SPECviewperf 12 - specvp12 mediacal-01
min: 57.8     avg: 62.6     median: 62.7 (16%)     max: 66.4 fps
specvp12 maya-04 + NVIDIA Quadro RTX 5000 Max-Q
SPECviewperf 12 - specvp12 maya-04
min: 70.3     avg: 83.4     median: 81.6 (22%)     max: 105.4 fps
specvp12 energy-01 + NVIDIA Quadro RTX 5000 Max-Q
SPECviewperf 12 - specvp12 energy-01
min: 13.3     avg: 14.5     median: 14.3 (13%)     max: 16.1 fps
specvp12 creo-01 + NVIDIA Quadro RTX 5000 Max-Q
SPECviewperf 12 - specvp12 creo-01
min: 114.1     avg: 127     median: 125.2 (50%)     max: 145.1 fps
specvp12 catia-04 + NVIDIA Quadro RTX 5000 Max-Q
SPECviewperf 12 - specvp12 catia-04
min: 113.1     avg: 126.4     median: 123.6 (20%)     max: 154.9 fps
specvp12 3dsmax-05 + NVIDIA Quadro RTX 5000 Max-Q
SPECviewperf 12 - specvp12 3dsmax-05
min: 158.9     avg: 176.3     median: 180.9 (32%)     max: 184.3 fps
SPECviewperf 13 specvp13 sw-04 + NVIDIA GeForce RTX 2080 Super Mobile
SPECviewperf 13 - specvp13 sw-04
87.9 fps (24%)
specvp13 sw-04 + NVIDIA Quadro RTX 6000 (Laptop)
217 fps (58%)
specvp13 sw-04 + NVIDIA Quadro RTX 5000 Max-Q
min: 119.7     avg: 135.3     median: 134 (36%)     max: 158.9 fps
specvp13 showcase-02 + NVIDIA GeForce RTX 2080 Super Mobile
SPECviewperf 13 - specvp13 showcase-02
110.4 fps (24%)
specvp13 showcase-02 + NVIDIA Quadro RTX 5000 Max-Q
min: 89.2     avg: 95.2     median: 95.5 (21%)     max: 98.7 fps
specvp13 medical-02 + NVIDIA GeForce RTX 2080 Super Mobile
SPECviewperf 13 - specvp13 medical-02
60.6 fps (13%)
specvp13 medical-02 + NVIDIA Quadro RTX 5000 Max-Q
min: 79     avg: 89.8     median: 89.9 (19%)     max: 102.5 fps
specvp13 maya-05 + NVIDIA GeForce RTX 2080 Super Mobile
SPECviewperf 13 - specvp13 maya-05
201.7 fps (23%)
specvp13 maya-05 + NVIDIA Quadro RTX 5000 Max-Q
min: 179.5     avg: 206.4     median: 206 (23%)     max: 231.3 fps
specvp13 energy-02 + NVIDIA GeForce RTX 2080 Super Mobile
SPECviewperf 13 - specvp13 energy-02
22.3 fps (7%)
specvp13 energy-02 + NVIDIA Quadro RTX 5000 Max-Q
min: 35.39     avg: 37.3     median: 36.9 (12%)     max: 39.92 fps
specvp13 creo-02 + NVIDIA GeForce RTX 2080 Super Mobile
SPECviewperf 13 - specvp13 creo-02
173.4 fps (25%)
specvp13 creo-02 + NVIDIA Quadro RTX 5000 Max-Q
min: 181.9     avg: 217.7     median: 220.5 (32%)     max: 238.4 fps
specvp13 catia-05 + NVIDIA GeForce RTX 2080 Super Mobile
SPECviewperf 13 - specvp13 catia-05
144.9 fps (16%)
specvp13 catia-05 + NVIDIA Quadro RTX 5000 Max-Q
min: 186.9     avg: 222.1     median: 220.4 (24%)     max: 259.7 fps
specvp13 3dsmax-06 + NVIDIA GeForce RTX 2080 Super Mobile
SPECviewperf 13 - specvp13 3dsmax-06
184.8 fps (32%)
specvp13 3dsmax-06 + NVIDIA Quadro RTX 6000 (Laptop)
217 fps (38%)
specvp13 3dsmax-06 + NVIDIA Quadro RTX 5000 Max-Q
min: 157.3     avg: 174.8     median: 176.5 (31%)     max: 181.8 fps
specvp13 snx-03 + NVIDIA Quadro RTX 5000 Max-Q
SPECviewperf 13 - specvp13 snx-03
min: 244.1     avg: 287     median: 289.8 (32%)     max: 306.1 fps
Cinebench R10 Cinebench R10 Shading (32bit) + NVIDIA Quadro RTX 5000 Max-Q
Cinebench R10 - Cinebench R10 Shading (32bit)
min: 6814     avg: 6821     median: 6819 (5%)     max: 6830 Points
Cinebench R11.5 Cinebench R11.5 OpenGL 64 Bit + NVIDIA Quadro RTX 5000 Max-Q
Cinebench R11.5 - Cinebench R11.5 OpenGL 64 Bit
min: 130.9     avg: 140.2     median: 140.2 (46%)     max: 149.4 fps
Cinebench R15
Cinebench R15 OpenGL 64 Bit + NVIDIA GeForce RTX 2080 Super Mobile
Cinebench R15 - Cinebench R15 OpenGL 64 Bit
min: 154     avg: 178     median: 166 (10%)     max: 226 fps
Cinebench R15 OpenGL 64 Bit + NVIDIA Quadro RTX 5000 Max-Q
min: 175.3     avg: 205.9     median: 210 (12%)     max: 230 fps
Cinebench R15 OpenGL Ref. Match 64 Bit + NVIDIA GeForce RTX 2080 Super Mobile
Cinebench R15 - Cinebench R15 OpenGL Ref. Match 64 Bit
99.6 % (100%)
Cinebench R15 OpenGL Ref. Match 64 Bit + NVIDIA Quadro RTX 5000 Max-Q
99.6 % (100%)
GFXBench - GFXBench 5.0 Aztec Ruins High Tier Offscreen
min: 138.7     avg: 153     median: 153 (28%)     max: 167.2 fps
GFXBench - GFXBench 5.0 Aztec Ruins Normal Tier Offscreen
min: 343.2     avg: 383.1     median: 383.1 (28%)     max: 422.9 fps
GFXBench - GFXBench Car Chase Offscreen
412.6 fps (46%)
min: 300.8     avg: 311.8     median: 311.8 (35%)     max: 322.7 fps
GFXBench 3.1 - GFXBench Manhattan ES 3.1 Offscreen
min: 447.1     avg: 466.7     median: 466.7 (10%)     max: 486.3 fps
GFXBench 3.0 - GFXBench 3.0 Manhattan Offscreen
min: 512     avg: 522     median: 522 (31%)     max: 532 fps
GFXBench (DX / GLBenchmark) 2.7
GFXBench T-Rex HD Offscreen C24Z16 + NVIDIA Quadro RTX 5000 Max-Q
GFXBench (DX / GLBenchmark) 2.7 - GFXBench T-Rex HD Offscreen C24Z16
min: 1282     avg: 1335     median: 1334.5 (11%)     max: 1387 fps
LuxMark v2.0 64Bit - LuxMark v2.0 Room GPU
3764 Samples/s (17%)
min: 1972     avg: 1990     median: 1990 (9%)     max: 2008 Samples/s
LuxMark v2.0 64Bit - LuxMark v2.0 Sala GPU
8244 Samples/s (14%)
min: 4913     avg: 4983     median: 4983 (9%)     max: 5053 Samples/s
ComputeMark v2.1 - ComputeMark v2.1 Result
17233 Points (19%)
min: 14095     avg: 14179     median: 14178.5 (15%)     max: 14262 Points
Power Consumption - Furmark Stress Test Power Consumption - external Monitor *
min: 117     avg: 126     median: 126 (18%)     max: 135 Watt
Power Consumption - The Witcher 3 Power Consumption - external Monitor *
min: 122     avg: 123     median: 123 (17%)     max: 124 Watt
Power Consumption - Witcher 3 Power Consumption *
min: 227     avg: 274.9     median: 277.3 (61%)     max: 318 Watt
min: 145     avg: 151.9     median: 151.6 (33%)     max: 157.5 Watt
Power Consumption - Witcher 3 ultra Power Efficiency
min: 0.3428     avg: 0.4     median: 0.4 (35%)     max: 0.4115 fps per Watt
min: 0.4765     avg: 0.5     median: 0.5 (46%)     max: 0.577 fps per Watt
Power Consumption - Witcher 3 ultra Power Efficiency - external Monitor
min: 0.682     avg: 0.7     median: 0.7 (57%)     max: 0.685 fps per Watt
Emissions Witcher 3 Fan Noise + NVIDIA GeForce RTX 2080 Super Mobile
Emissions - Witcher 3 Fan Noise
min: 50     avg: 54.4     median: 53.4 (85%)     max: 60.7 dB(A)
Witcher 3 Fan Noise + NVIDIA Quadro RTX 5000 Max-Q
min: 38.3     avg: 46.6     median: 47.4 (76%)     max: 51.9 dB(A)
Clock Speed - GPU Clock Witcher 3 ultra
min: 1635     avg: 1725     median: 1725 (68%)     max: 1815 MHz
min: 1137     avg: 1171     median: 1170.5 (46%)     max: 1204 MHz
Clock Speed - GPU Clock Speed Furmark
min: 465     avg: 920     median: 919.5 (36%)     max: 1374 MHz

Average Benchmarks NVIDIA GeForce RTX 2080 Super Mobile → 100% n=3

Average Benchmarks NVIDIA Quadro RTX 6000 (Laptop) → 157% n=3

Average Benchmarks NVIDIA Quadro RTX 5000 Max-Q → 106% n=3

- Bereich der Benchmarkergebnisse für diese Grafikkarte
- Durchschnittliche Benchmarkergebnisse für diese Grafikkarte
* Smaller numbers mean a higher performance
1 This benchmark is not used for the average calculation

Spiele-Benchmarks

Die folgenden Benchmarks basieren auf unseren Spieletests mit Testnotebooks. Die Performance dieser Grafikkarte bei den gelisteten Spielen ist abhängig von der verwendeten CPU, Speicherausstattung, Treiber und auch Betriebssystem. Dadurch müssen die untenstehenden Werte nicht repräsentativ sein. Detaillierte Informationen über das verwendete System sehen Sie nach einem Klick auf den fps-Wert.

low 1280x720
Quadro RTX 5000 Max-Q:
90  fps
med. 1920x1080
Quadro RTX 5000 Max-Q:
85  fps
high 1920x1080
Quadro RTX 5000 Max-Q:
75  fps
ultra 1920x1080
Quadro RTX 5000 Max-Q:
51  fps
QHD 2560x1440
Quadro RTX 5000 Max-Q:
37  fps
4K 3840x2160
Quadro RTX 5000 Max-Q:
21  fps
FIFA 21

FIFA 21

2020
low 1280x720
Quadro RTX 5000 Max-Q:
208.3  fps
med. 1920x1080
Quadro RTX 5000 Max-Q:
188.7  fps
high 1920x1080
100%
GeForce RTX 2080 Super Mobile:
278  fps
65%
Quadro RTX 5000 Max-Q:
181.6  fps
ultra 1920x1080
100%
GeForce RTX 2080 Super Mobile:
278  fps
61%
Quadro RTX 5000 Max-Q:
170  fps
QHD 2560x1440
100%
GeForce RTX 2080 Super Mobile:
274  fps
52%
Quadro RTX 5000 Max-Q:
143  fps
4K 3840x2160
100%
GeForce RTX 2080 Super Mobile:
238  fps
35%
Quadro RTX 5000 Max-Q:
84.4  fps
low 1280x720
Quadro RTX 5000 Max-Q:
296  fps
med. 1920x1080
Quadro RTX 5000 Max-Q:
225.7  fps
high 1920x1080
100%
GeForce RTX 2080 Super Mobile:
263  fps
77%
Quadro RTX 5000 Max-Q:
203.3  fps
ultra 1920x1080
100%
GeForce RTX 2080 Super Mobile:
243  fps
76%
Quadro RTX 5000 Max-Q:
185.3  fps
QHD 2560x1440
100%
GeForce RTX 2080 Super Mobile:
175  fps
72%
Quadro RTX 5000 Max-Q:
125.9  fps
4K 3840x2160
100%
GeForce RTX 2080 Super Mobile:
105  fps
67%
Quadro RTX 5000 Max-Q:
70.4  fps
low 1280x720
Quadro RTX 5000 Max-Q:
113.6  fps
med. 1920x1080
Quadro RTX 5000 Max-Q:
90.3  fps
high 1920x1080
100%
GeForce RTX 2080 Super Mobile:
122  fps
68%
Quadro RTX 5000 Max-Q:
82.9  fps
QHD 2560x1440
100%
GeForce RTX 2080 Super Mobile:
83.4  fps
68%
Quadro RTX 5000 Max-Q:
56.7  fps
4K 3840x2160
100%
GeForce RTX 2080 Super Mobile:
45.2  fps
67%
Quadro RTX 5000 Max-Q:
30.2  fps
low 1280x720
Quadro RTX 5000 Max-Q:
106  fps
med. 1920x1080
Quadro RTX 5000 Max-Q:
84.7  fps
high 1920x1080
100%
GeForce RTX 2080 Super Mobile:
113  fps
71%
Quadro RTX 5000 Max-Q:
79.8  fps
ultra 1920x1080
100%
GeForce RTX 2080 Super Mobile:
95  fps
73%
Quadro RTX 5000 Max-Q:
69.6  fps
QHD 2560x1440
100%
GeForce RTX 2080 Super Mobile:
84.2  fps
68%
Quadro RTX 5000 Max-Q:
57.5  fps
4K 3840x2160
100%
GeForce RTX 2080 Super Mobile:
54.4  fps
64%
Quadro RTX 5000 Max-Q:
34.9  fps
low 1280x720
Quadro RTX 5000 Max-Q:
58.3  fps
med. 1920x1080
Quadro RTX 5000 Max-Q:
49  fps
high 1920x1080
100%
GeForce RTX 2080 Super Mobile:
64.6  fps
68%
Quadro RTX 5000 Max-Q:
44  fps
ultra 1920x1080
100%
GeForce RTX 2080 Super Mobile:
47.1  fps
73%
Quadro RTX 5000 Max-Q:
34.3  fps
QHD 2560x1440
100%
GeForce RTX 2080 Super Mobile:
37.8  fps
71%
Quadro RTX 5000 Max-Q:
26.9  fps
4K 3840x2160
100%
GeForce RTX 2080 Super Mobile:
23.8  fps
68%
Quadro RTX 5000 Max-Q:
16.1  fps
low 1280x720
Quadro RTX 5000 Max-Q:
120  fps
med. 1920x1080
Quadro RTX 5000 Max-Q:
103  fps
high 1920x1080
100%
GeForce RTX 2080 Super Mobile:
127  fps
73%
Quadro RTX 5000 Max-Q:
93  fps
ultra 1920x1080
100%
GeForce RTX 2080 Super Mobile:
104  fps
85%
Quadro RTX 5000 Max-Q:
86 89 ~ 88 fps
QHD 2560x1440
100%
GeForce RTX 2080 Super Mobile:
80  fps
86%
Quadro RTX 5000 Max-Q:
69  fps
4K 3840x2160
100%
GeForce RTX 2080 Super Mobile:
45  fps
93%
Quadro RTX 5000 Max-Q:
42  fps
low 1280x720
Quadro RTX 5000 Max-Q:
100.1 127.2 ~ 114 fps
med. 1920x1080
Quadro RTX 5000 Max-Q:
100.5 112.6 ~ 107 fps
high 1920x1080
100%
GeForce RTX 2080 Super Mobile:
149  fps
68%
Quadro RTX 5000 Max-Q:
97.3 103.8 ~ 101 fps
ultra 1920x1080
100%
GeForce RTX 2080 Super Mobile:
147  fps
67%
Quadro RTX 5000 Max-Q:
97.4 101.5 ~ 99 fps
QHD 2560x1440
100%
GeForce RTX 2080 Super Mobile:
108  fps
67%
Quadro RTX 5000 Max-Q:
70 73.7 ~ 72 fps
4K 3840x2160
100%
GeForce RTX 2080 Super Mobile:
60  fps
67%
Quadro RTX 5000 Max-Q:
39 41.1 ~ 40 fps
F1 2020

F1 2020

2020
low 1280x720
Quadro RTX 5000 Max-Q:
214 219 ~ 217 fps
med. 1920x1080
100%
GeForce RTX 2080 Super Mobile:
235  fps
69%
Quadro RTX 5000 Max-Q:
158 166 ~ 162 fps
high 1920x1080
100%
GeForce RTX 2080 Super Mobile:
175 234 ~ 205 fps
68%
Quadro RTX 5000 Max-Q:
135 143 ~ 139 fps
ultra 1920x1080
100%
GeForce RTX 2080 Super Mobile:
146 161 ~ 154 fps
70%
Quadro RTX 5000 Max-Q:
107 108 ~ 108 fps
QHD 2560x1440
100%
GeForce RTX 2080 Super Mobile:
119 122 ~ 121 fps
69%
Quadro RTX 5000 Max-Q:
82.8 83 ~ 83 fps
4K 3840x2160
100%
GeForce RTX 2080 Super Mobile:
72 72.5 ~ 72 fps
64%
Quadro RTX 5000 Max-Q:
44.4 47 ~ 46 fps
low 1280x720
Quadro RTX 5000 Max-Q:
177.7 226.8 ~ 202 fps
med. 1920x1080
100%
GeForce RTX 2080 Super Mobile:
226  fps
62%
Quadro RTX 5000 Max-Q:
126.6 151 ~ 139 fps
high 1920x1080
100%
GeForce RTX 2080 Super Mobile:
144 154 ~ 149 fps
67%
Quadro RTX 5000 Max-Q:
90.7 110.2 ~ 100 fps
ultra 1920x1080
100%
GeForce RTX 2080 Super Mobile:
106 125 ~ 116 fps
68%
Quadro RTX 5000 Max-Q:
73.6 84.6 ~ 79 fps
QHD 2560x1440
100%
GeForce RTX 2080 Super Mobile:
70.3 82.1 ~ 76 fps
68%
Quadro RTX 5000 Max-Q:
50 54.3 ~ 52 fps
4K 3840x2160
100%
GeForce RTX 2080 Super Mobile:
38.4 43.2 ~ 41 fps
63%
Quadro RTX 5000 Max-Q:
24 27.6 ~ 26 fps
low 1280x720
Quadro RTX 5000 Max-Q:
213.8 216.7 ~ 215 fps
med. 1920x1080
100%
GeForce RTX 2080 Super Mobile:
216  fps
75%
Quadro RTX 5000 Max-Q:
159.9 161.9 ~ 161 fps
high 1920x1080
100%
GeForce RTX 2080 Super Mobile:
193 222 ~ 208 fps
69%
Quadro RTX 5000 Max-Q:
142.3 145 ~ 144 fps
ultra 1920x1080
100%
GeForce RTX 2080 Super Mobile:
191 219 ~ 205 fps
69%
Quadro RTX 5000 Max-Q:
137.8 140.6 145.3 ~ 141 fps
QHD 2560x1440
100%
GeForce RTX 2080 Super Mobile:
147 176 ~ 162 fps
60%
Quadro RTX 5000 Max-Q:
92.5 103.2 ~ 98 fps
4K 3840x2160
100%
GeForce RTX 2080 Super Mobile:
80.8 96.5 ~ 89 fps
57%
Quadro RTX 5000 Max-Q:
47.1 54.5 ~ 51 fps
low 1280x720
Quadro RTX 5000 Max-Q:
158.2  fps
med. 1920x1080
100%
GeForce RTX 2080 Super Mobile:
151  fps
70%
Quadro RTX 5000 Max-Q:
106.2  fps
high 1920x1080
100%
GeForce RTX 2080 Super Mobile:
120 133 ~ 127 fps
74%
Quadro RTX 5000 Max-Q:
94  fps
QHD 2560x1440
100%
GeForce RTX 2080 Super Mobile:
83.1 92.4 ~ 88 fps
60%
Quadro RTX 5000 Max-Q:
52.5  fps
4K 3840x2160
100%
GeForce RTX 2080 Super Mobile:
38.4 85.6 ~ 62 fps
43%
Quadro RTX 5000 Max-Q:
26.7  fps
med. 1920x1080
100%
GeForce RTX 2080 Super Mobile:
121  fps
high 1920x1080
100%
GeForce RTX 2080 Super Mobile:
121  fps
ultra 1920x1080
100%
GeForce RTX 2080 Super Mobile:
121  fps
QHD 2560x1440
100%
GeForce RTX 2080 Super Mobile:
102  fps
4K 3840x2160
100%
GeForce RTX 2080 Super Mobile:
49.5  fps
low 1280x720
Quadro RTX 5000 Max-Q:
107.5 124.2 ~ 116 fps
med. 1920x1080
100%
GeForce RTX 2080 Super Mobile:
117  fps
74%
Quadro RTX 5000 Max-Q:
84.8 89.1 ~ 87 fps
high 1920x1080
100%
GeForce RTX 2080 Super Mobile:
79.8  fps
74%
Quadro RTX 5000 Max-Q:
54.8 63.9 ~ 59 fps
ultra 1920x1080
100%
GeForce RTX 2080 Super Mobile:
52.9  fps
78%
Quadro RTX 5000 Max-Q:
39.7 41.3 ~ 41 fps
QHD 2560x1440
100%
GeForce RTX 2080 Super Mobile:
42.5  fps
75%
Quadro RTX 5000 Max-Q:
32 32.9 ~ 32 fps
4K 3840x2160
100%
GeForce RTX 2080 Super Mobile:
27.6  fps
83%
Quadro RTX 5000 Max-Q:
19.8 25.2 ~ 23 fps
med. 1920x1080
100%
GeForce RTX 2080 Super Mobile:
121  fps
80%
Quadro RTX 5000 Max-Q:
88.5 105 ~ 97 fps
high 1920x1080
100%
GeForce RTX 2080 Super Mobile:
117  fps
78%
Quadro RTX 5000 Max-Q:
83.1 99.5 ~ 91 fps
ultra 1920x1080
100%
GeForce RTX 2080 Super Mobile:
107  fps
79%
Quadro RTX 5000 Max-Q:
80.4 89.7 ~ 85 fps
QHD 2560x1440
100%
GeForce RTX 2080 Super Mobile:
86.4  fps
75%
Quadro RTX 5000 Max-Q:
64 66.3 ~ 65 fps
4K 3840x2160
100%
GeForce RTX 2080 Super Mobile:
49  fps
69%
Quadro RTX 5000 Max-Q:
33.5 34 ~ 34 fps
low 1280x720
Quadro RTX 5000 Max-Q:
92.3  fps
med. 1920x1080
100%
GeForce RTX 2080 Super Mobile:
104  fps
81%
Quadro RTX 5000 Max-Q:
84.4  fps
high 1920x1080
100%
GeForce RTX 2080 Super Mobile:
91  fps
85%
Quadro RTX 5000 Max-Q:
77.5  fps
ultra 1920x1080
100%
GeForce RTX 2080 Super Mobile:
79.4  fps
91%
Quadro RTX 5000 Max-Q:
72.1  fps
QHD 2560x1440
100%
GeForce RTX 2080 Super Mobile:
75.3  fps
87%
Quadro RTX 5000 Max-Q:
65.4  fps
4K 3840x2160
100%
GeForce RTX 2080 Super Mobile:
51.3  fps
72%
Quadro RTX 5000 Max-Q:
36.9  fps
low 1280x720
Quadro RTX 5000 Max-Q:
156.5 185.2 ~ 171 fps
med. 1920x1080
100%
GeForce RTX 2080 Super Mobile:
145  fps
83%
Quadro RTX 5000 Max-Q:
111.2 130.6 ~ 121 fps
high 1920x1080
100%
GeForce RTX 2080 Super Mobile:
136  fps
74%
Quadro RTX 5000 Max-Q:
99 103.6 ~ 101 fps
ultra 1920x1080
100%
GeForce RTX 2080 Super Mobile:
115  fps
77%
Quadro RTX 5000 Max-Q:
86.7 91.8 ~ 89 fps
QHD 2560x1440
100%
GeForce RTX 2080 Super Mobile:
83.6  fps
77%
Quadro RTX 5000 Max-Q:
62.2 65.2 ~ 64 fps
4K 3840x2160
100%
GeForce RTX 2080 Super Mobile:
48.3  fps
72%
Quadro RTX 5000 Max-Q:
34 35.2 ~ 35 fps
GRID 2019

GRID 2019

2019
low 1280x720
Quadro RTX 5000 Max-Q:
131.5 178.8 ~ 155 fps
med. 1920x1080
100%
GeForce RTX 2080 Super Mobile:
164  fps
80%
Quadro RTX 5000 Max-Q:
107.8 155.6 ~ 132 fps
high 1920x1080
100%
GeForce RTX 2080 Super Mobile:
120  fps
89%
Quadro RTX 5000 Max-Q:
96.2 118.5 ~ 107 fps
ultra 1920x1080
100%
GeForce RTX 2080 Super Mobile:
88.7  fps
94%
Quadro RTX 5000 Max-Q:
79.2 87.2 ~ 83 fps
QHD 2560x1440
100%
GeForce RTX 2080 Super Mobile:
72.5  fps
86%
Quadro RTX 5000 Max-Q:
61.4 62.7 ~ 62 fps
4K 3840x2160
100%
GeForce RTX 2080 Super Mobile:
48.8  fps
78%
Quadro RTX 5000 Max-Q:
36.8 38.6 ~ 38 fps
low 1280x720
Quadro RTX 5000 Max-Q:
117 127 ~ 122 fps
med. 1920x1080
100%
GeForce RTX 2080 Super Mobile:
109  fps
93%
Quadro RTX 5000 Max-Q:
96 105 ~ 101 fps
high 1920x1080
100%
GeForce RTX 2080 Super Mobile:
99  fps
94%
Quadro RTX 5000 Max-Q:
92 93 ~ 93 fps
ultra 1920x1080
100%
GeForce RTX 2080 Super Mobile:
74  fps
91%
Quadro RTX 5000 Max-Q:
65 68 ~ 67 fps
QHD 2560x1440
100%
GeForce RTX 2080 Super Mobile:
57  fps
84%
Quadro RTX 5000 Max-Q:
47 49 ~ 48 fps
4K 3840x2160
100%
GeForce RTX 2080 Super Mobile:
34  fps
79%
Quadro RTX 5000 Max-Q:
26 28 ~ 27 fps
FIFA 20

FIFA 20

2019
med. 1920x1080
100%
GeForce RTX 2080 Super Mobile:
281  fps
high 1920x1080
100%
GeForce RTX 2080 Super Mobile:
267  fps
ultra 1920x1080
100%
GeForce RTX 2080 Super Mobile:
262  fps
QHD 2560x1440
100%
GeForce RTX 2080 Super Mobile:
258  fps
4K 3840x2160
100%
GeForce RTX 2080 Super Mobile:
227  fps
low 1280x720
Quadro RTX 5000 Max-Q:
118.8  fps
med. 1920x1080
100%
GeForce RTX 2080 Super Mobile:
131  fps
76%
Quadro RTX 5000 Max-Q:
99.9  fps
high 1920x1080
100%
GeForce RTX 2080 Super Mobile:
98 107 ~ 103 fps
76%
Quadro RTX 5000 Max-Q:
78.4  fps
ultra 1920x1080
100%
GeForce RTX 2080 Super Mobile:
88 89.8 ~ 89 fps
70%
Quadro RTX 5000 Max-Q:
62.5  fps
QHD 2560x1440
100%
GeForce RTX 2080 Super Mobile:
64.6 65.4 ~ 65 fps
66%
Quadro RTX 5000 Max-Q:
42.9  fps
4K 3840x2160
100%
GeForce RTX 2080 Super Mobile:
35.2 37.1 ~ 36 fps
63%
Quadro RTX 5000 Max-Q:
22.8  fps
Control

Control

2019
low 1280x720
Quadro RTX 5000 Max-Q:
223.5 228.8 ~ 226 fps
med. 1920x1080
100%
GeForce RTX 2080 Super Mobile:
113  fps
84%
Quadro RTX 5000 Max-Q:
93.2 96.7 ~ 95 fps
high 1920x1080
100%
GeForce RTX 2080 Super Mobile:
87.6  fps
78%
Quadro RTX 5000 Max-Q:
66.5 69.9 ~ 68 fps
QHD 2560x1440
100%
GeForce RTX 2080 Super Mobile:
58.9  fps
73%
Quadro RTX 5000 Max-Q:
42.7 43 ~ 43 fps
4K 3840x2160
100%
GeForce RTX 2080 Super Mobile:
29.8  fps
67%
Quadro RTX 5000 Max-Q:
19.1 20 ~ 20 fps
F1 2019

F1 2019

2019
low 1280x720
Quadro RTX 5000 Max-Q:
113 192 ~ 153 fps
med. 1920x1080
100%
GeForce RTX 2080 Super Mobile:
224  fps
59%
Quadro RTX 5000 Max-Q:
101 165 ~ 133 fps
high 1920x1080
100%
GeForce RTX 2080 Super Mobile:
174  fps
64%
Quadro RTX 5000 Max-Q:
93 131 ~ 112 fps
ultra 1920x1080
100%
GeForce RTX 2080 Super Mobile:
167  fps
62%
Quadro RTX 5000 Max-Q:
88 118 ~ 103 fps
QHD 2560x1440
100%
GeForce RTX 2080 Super Mobile:
130  fps
65%
Quadro RTX 5000 Max-Q:
83 86 ~ 85 fps
4K 3840x2160
100%
GeForce RTX 2080 Super Mobile:
80  fps
68%
Quadro RTX 5000 Max-Q:
52 56 ~ 54 fps
low 1280x720
Quadro RTX 5000 Max-Q:
218.6 243.7 ~ 231 fps
med. 1920x1080
Quadro RTX 5000 Max-Q:
120.2 129 ~ 125 fps
high 1920x1080
Quadro RTX 5000 Max-Q:
80.9 87.3 ~ 84 fps
ultra 1920x1080
Quadro RTX 5000 Max-Q:
57.5 64.9 ~ 61 fps
QHD 2560x1440
Quadro RTX 5000 Max-Q:
34.1 43.5 ~ 39 fps
4K 3840x2160
Quadro RTX 5000 Max-Q:
18.5 21.5 ~ 20 fps
Rage 2

Rage 2

2019
low 1280x720
Quadro RTX 5000 Max-Q:
224  fps
med. 1920x1080
100%
GeForce RTX 2080 Super Mobile:
148  fps
78%
Quadro RTX 5000 Max-Q:
114.8  fps
high 1920x1080
100%
GeForce RTX 2080 Super Mobile:
127  fps
76%
Quadro RTX 5000 Max-Q:
96.4  fps
ultra 1920x1080
100%
GeForce RTX 2080 Super Mobile:
127  fps
74%
Quadro RTX 5000 Max-Q:
94.3  fps
QHD 2560x1440
100%
GeForce RTX 2080 Super Mobile:
81.9  fps
73%
Quadro RTX 5000 Max-Q:
59.4  fps
4K 3840x2160
100%
GeForce RTX 2080 Super Mobile:
40.3  fps
71%
Quadro RTX 5000 Max-Q:
28.7  fps
Anno 1800

Anno 1800

2019
low 1280x720
Quadro RTX 5000 Max-Q:
94.5 95.8 ~ 95 fps
med. 1920x1080
100%
GeForce RTX 2080 Super Mobile:
122  fps
77%
Quadro RTX 5000 Max-Q:
90.9 97.8 ~ 94 fps
high 1920x1080
100%
GeForce RTX 2080 Super Mobile:
91.7  fps
79%
Quadro RTX 5000 Max-Q:
69.3 73.9 ~ 72 fps
ultra 1920x1080
100%
GeForce RTX 2080 Super Mobile:
50.6  fps
75%
Quadro RTX 5000 Max-Q:
37.4 38.9 ~ 38 fps
QHD 2560x1440
100%
GeForce RTX 2080 Super Mobile:
45.3  fps
73%
Quadro RTX 5000 Max-Q:
31.5 34.7 ~ 33 fps
4K 3840x2160
100%
GeForce RTX 2080 Super Mobile:
27.1  fps
78%
Quadro RTX 5000 Max-Q:
21.2  fps
low 1280x720
Quadro RTX 5000 Max-Q:
144  fps
med. 1920x1080
100%
GeForce RTX 2080 Super Mobile:
147  fps
76%
Quadro RTX 5000 Max-Q:
112  fps
high 1920x1080
100%
GeForce RTX 2080 Super Mobile:
131  fps
74%
Quadro RTX 5000 Max-Q:
97  fps
ultra 1920x1080
100%
GeForce RTX 2080 Super Mobile:
102  fps
55%
Quadro RTX 5000 Max-Q:
56  fps
QHD 2560x1440
100%
GeForce RTX 2080 Super Mobile:
69  fps
74%
Quadro RTX 5000 Max-Q:
51  fps
4K 3840x2160
100%
GeForce RTX 2080 Super Mobile:
36  fps
75%
Quadro RTX 5000 Max-Q:
27  fps
low 1280x720
Quadro RTX 5000 Max-Q:
241.2 275 ~ 258 fps
med. 1920x1080
100%
GeForce RTX 2080 Super Mobile:
178  fps
101%
Quadro RTX 5000 Max-Q:
169.4 188.9 ~ 179 fps
high 1920x1080
100%
GeForce RTX 2080 Super Mobile:
158  fps
99%
Quadro RTX 5000 Max-Q:
153 160.3 ~ 157 fps
ultra 1920x1080
100%
GeForce RTX 2080 Super Mobile:
91.6  fps
98%
Quadro RTX 5000 Max-Q:
89.3 90.7 ~ 90 fps
QHD 2560x1440
100%
GeForce RTX 2080 Super Mobile:
74.1  fps
93%
Quadro RTX 5000 Max-Q:
66.8 70.2 ~ 69 fps
4K 3840x2160
Quadro RTX 5000 Max-Q:
39.8  fps
low 1280x720
Quadro RTX 5000 Max-Q:
104 107 ~ 106 fps
med. 1920x1080
100%
GeForce RTX 2080 Super Mobile:
116  fps
81%
Quadro RTX 5000 Max-Q:
90 98 ~ 94 fps
high 1920x1080
100%
GeForce RTX 2080 Super Mobile:
113  fps
79%
Quadro RTX 5000 Max-Q:
88 90 ~ 89 fps
ultra 1920x1080
100%
GeForce RTX 2080 Super Mobile:
100  fps
84%
Quadro RTX 5000 Max-Q:
81 86 ~ 84 fps
QHD 2560x1440
100%
GeForce RTX 2080 Super Mobile:
90  fps
81%
Quadro RTX 5000 Max-Q:
72 74 ~ 73 fps
4K 3840x2160
100%
GeForce RTX 2080 Super Mobile:
55  fps
78%
Quadro RTX 5000 Max-Q:
43 43 ~ 43 fps
low 1280x720
Quadro RTX 5000 Max-Q:
115.2 145.6 ~ 130 fps
med. 1920x1080
100%
GeForce RTX 2080 Super Mobile:
116  fps
79%
Quadro RTX 5000 Max-Q:
87.8 96.3 ~ 92 fps
high 1920x1080
100%
GeForce RTX 2080 Super Mobile:
90.2  fps
78%
Quadro RTX 5000 Max-Q:
66.9 72.8 ~ 70 fps
ultra 1920x1080
100%
GeForce RTX 2080 Super Mobile:
71  fps
80%
Quadro RTX 5000 Max-Q:
55.4 59.2 ~ 57 fps
QHD 2560x1440
100%
GeForce RTX 2080 Super Mobile:
55.4  fps
65%
Quadro RTX 5000 Max-Q:
25.4 45.6 ~ 36 fps
4K 3840x2160
100%
GeForce RTX 2080 Super Mobile:
34.9  fps
74%
Quadro RTX 5000 Max-Q:
25.2 27 ~ 26 fps
low 1280x720
Quadro RTX 5000 Max-Q:
144  fps
med. 1920x1080
100%
GeForce RTX 2080 Super Mobile:
144  fps
100%
Quadro RTX 5000 Max-Q:
144  fps
high 1920x1080
100%
GeForce RTX 2080 Super Mobile:
144  fps
100%
Quadro RTX 5000 Max-Q:
144  fps
ultra 1920x1080
100%
GeForce RTX 2080 Super Mobile:
144  fps
99%
Quadro RTX 5000 Max-Q:
142.8  fps
QHD 2560x1440
100%
GeForce RTX 2080 Super Mobile:
131  fps
80%
Quadro RTX 5000 Max-Q:
104.9  fps
4K 3840x2160
100%
GeForce RTX 2080 Super Mobile:
75.4  fps
71%
Quadro RTX 5000 Max-Q:
53.4  fps
med. 1920x1080
100%
GeForce RTX 2080 Super Mobile:
157  fps
high 1920x1080
100%
GeForce RTX 2080 Super Mobile:
120  fps
ultra 1920x1080
100%
GeForce RTX 2080 Super Mobile:
113  fps
QHD 2560x1440
100%
GeForce RTX 2080 Super Mobile:
81.2  fps
4K 3840x2160
100%
GeForce RTX 2080 Super Mobile:
46  fps
med. 1920x1080
100%
GeForce RTX 2080 Super Mobile:
168  fps
high 1920x1080
100%
GeForce RTX 2080 Super Mobile:
143  fps
ultra 1920x1080
100%
GeForce RTX 2080 Super Mobile:
132  fps
QHD 2560x1440
100%
GeForce RTX 2080 Super Mobile:
97.2  fps
4K 3840x2160
100%
GeForce RTX 2080 Super Mobile:
50.5  fps
low 1280x720
Quadro RTX 5000 Max-Q:
139.4 153.6 156.6 ~ 150 fps
med. 1920x1080
100%
GeForce RTX 2080 Super Mobile:
169  fps
72%
Quadro RTX 5000 Max-Q:
105.4 130.7 130.8 ~ 122 fps
high 1920x1080
100%
GeForce RTX 2080 Super Mobile:
153 168 ~ 161 fps
69%
Quadro RTX 5000 Max-Q:
88.2 120.4 124.5 ~ 111 fps
ultra 1920x1080
100%
GeForce RTX 2080 Super Mobile:
142 152 ~ 147 fps
70%
Quadro RTX 5000 Max-Q:
81.2 112.1 114.7 ~ 103 fps
QHD 2560x1440
100%
GeForce RTX 2080 Super Mobile:
115 126 ~ 121 fps
69%
Quadro RTX 5000 Max-Q:
68.3 90.8 91.6 ~ 84 fps
4K 3840x2160
100%
GeForce RTX 2080 Super Mobile:
68.7 76.2 ~ 72 fps
69%
Quadro RTX 5000 Max-Q:
42.5 53.4 53.5 ~ 50 fps
Hitman 2

Hitman 2

2018
low 1280x720
Quadro RTX 5000 Max-Q:
87.7  fps
med. 1920x1080
100%
GeForce RTX 2080 Super Mobile:
104  fps
82%
Quadro RTX 5000 Max-Q:
85.3  fps
high 1920x1080
100%
GeForce RTX 2080 Super Mobile:
87.8  fps
89%
Quadro RTX 5000 Max-Q:
78.4  fps
ultra 1920x1080
100%
GeForce RTX 2080 Super Mobile:
80  fps
94%
Quadro RTX 5000 Max-Q:
75.3  fps
QHD 2560x1440
100%
GeForce RTX 2080 Super Mobile:
77.7  fps
94%
Quadro RTX 5000 Max-Q:
73.3  fps
4K 3840x2160
100%
GeForce RTX 2080 Super Mobile:
48.4  fps
96%
Quadro RTX 5000 Max-Q:
46.6  fps
low 1280x720
Quadro RTX 5000 Max-Q:
95 107 ~ 101 fps
med. 1920x1080
100%
GeForce RTX 2080 Super Mobile:
98  fps
88%
Quadro RTX 5000 Max-Q:
80 91 ~ 86 fps
high 1920x1080
100%
GeForce RTX 2080 Super Mobile:
85  fps
92%
Quadro RTX 5000 Max-Q:
75 80 ~ 78 fps
ultra 1920x1080
100%
GeForce RTX 2080 Super Mobile:
62  fps
90%
Quadro RTX 5000 Max-Q:
54 57 ~ 56 fps
QHD 2560x1440
100%
GeForce RTX 2080 Super Mobile:
57  fps
84%
Quadro RTX 5000 Max-Q:
47 48 ~ 48 fps
4K 3840x2160
100%
GeForce RTX 2080 Super Mobile:
38  fps
82%
Quadro RTX 5000 Max-Q:
30 31 ~ 31 fps
low 1280x720
Quadro RTX 5000 Max-Q:
105 127 ~ 116 fps
med. 1920x1080
100%
GeForce RTX 2080 Super Mobile:
136  fps
72%
Quadro RTX 5000 Max-Q:
94 102 ~ 98 fps
high 1920x1080
100%
GeForce RTX 2080 Super Mobile:
127 142 ~ 135 fps
70%
Quadro RTX 5000 Max-Q:
91 98 ~ 95 fps
ultra 1920x1080
100%
GeForce RTX 2080 Super Mobile:
121 126 ~ 124 fps
70%
Quadro RTX 5000 Max-Q:
85 87 90 ~ 87 fps
QHD 2560x1440
100%
GeForce RTX 2080 Super Mobile:
84 87.5 ~ 86 fps
71%
Quadro RTX 5000 Max-Q:
59 62 ~ 61 fps
4K 3840x2160
100%
GeForce RTX 2080 Super Mobile:
45 47.1 ~ 46 fps
67%
Quadro RTX 5000 Max-Q:
29 33 ~ 31 fps
Strange Brigade

Strange Brigade

2018
low 1280x720
100%
GeForce RTX 2080 Super Mobile:
515  fps
med. 1920x1080
100%
GeForce RTX 2080 Super Mobile:
265  fps
high 1920x1080
100%
GeForce RTX 2080 Super Mobile:
217  fps
ultra 1920x1080
100%
GeForce RTX 2080 Super Mobile:
183  fps
QHD 2560x1440
100%
GeForce RTX 2080 Super Mobile:
137  fps
4K 3840x2160
100%
GeForce RTX 2080 Super Mobile:
78.4  fps
med. 1920x1080
100%
GeForce RTX 2080 Super Mobile:
131  fps
high 1920x1080
100%
GeForce RTX 2080 Super Mobile:
119  fps
ultra 1920x1080
100%
GeForce RTX 2080 Super Mobile:
102  fps
QHD 2560x1440
100%
GeForce RTX 2080 Super Mobile:
69.1  fps
4K 3840x2160
100%
GeForce RTX 2080 Super Mobile:
36  fps
Far Cry 5

Far Cry 5

2018
low 1280x720
Quadro RTX 5000 Max-Q:
128  fps
med. 1920x1080
Quadro RTX 5000 Max-Q:
106  fps
high 1920x1080
Quadro RTX 5000 Max-Q:
101  fps
ultra 1920x1080
Quadro RTX 5000 Max-Q:
96  fps
QHD 2560x1440
Quadro RTX 5000 Max-Q:
74  fps
4K 3840x2160
Quadro RTX 5000 Max-Q:
40  fps
World of Tanks enCore

World of Tanks enCore

2018
low 1366x768
Quadro RTX 5000 Max-Q:
595  fps
med. 1920x1080
Quadro RTX 5000 Max-Q:
367.5  fps
ultra 1920x1080
Quadro RTX 5000 Max-Q:
175.5  fps
QHD 2560x1440
Quadro RTX 5000 Max-Q:
109.6  fps
4K 3840x2160
Quadro RTX 5000 Max-Q:
52.3  fps
low 1280x720
100%
GeForce RTX 2080 Super Mobile:
123 128 138 145 ~ 134 fps
80%
Quadro RTX 5000 Max-Q:
96.1 96.3 100 109 113 117 118 ~ 107 fps
med. 1920x1080
100%
GeForce RTX 2080 Super Mobile:
105 114 122 127 ~ 117 fps
80%
Quadro RTX 5000 Max-Q:
84.9 86.9 88 94.9 98.9 99 102 ~ 94 fps
high 1920x1080
100%
GeForce RTX 2080 Super Mobile:
88.4 93.8 98 103 ~ 96 fps
82%
Quadro RTX 5000 Max-Q:
72.2 72.9 73.4 78.7 82 85 85.7 ~ 79 fps
4K 3840x2160
100%
GeForce RTX 2080 Super Mobile:
84.2 88.2 ~ 86 fps
64%
Quadro RTX 5000 Max-Q:
48.8 56.6 60.6 ~ 55 fps
med. 1920x1080
100%
GeForce RTX 2080 Super Mobile:
144  fps
high 1920x1080
100%
GeForce RTX 2080 Super Mobile:
107  fps
ultra 1920x1080
100%
GeForce RTX 2080 Super Mobile:
75.3  fps
QHD 2560x1440
100%
GeForce RTX 2080 Super Mobile:
56.1  fps
4K 3840x2160
100%
GeForce RTX 2080 Super Mobile:
33.1  fps
low 1280x720
100%
GeForce RTX 2080 Super Mobile:
193 196 ~ 195 fps
71%
Quadro RTX 5000 Max-Q:
87 132 154 177 ~ 138 fps
med. 1920x1080
100%
GeForce RTX 2080 Super Mobile:
124 134 140 ~ 133 fps
73%
Quadro RTX 5000 Max-Q:
82.3 99.7 101 103 ~ 97 fps
high 1920x1080
100%
GeForce RTX 2080 Super Mobile:
95.7 103 107 ~ 102 fps
75%
Quadro RTX 5000 Max-Q:
65.8 77.3 79.4 80.8 ~ 76 fps
QHD 2560x1440
100%
GeForce RTX 2080 Super Mobile:
80.2  fps
71%
Quadro RTX 5000 Max-Q:
56 58.4 ~ 57 fps
4K 3840x2160
100%
GeForce RTX 2080 Super Mobile:
42 47 ~ 45 fps
71%
Quadro RTX 5000 Max-Q:
30.6 32.8 33.9 ~ 32 fps
Fortnite

Fortnite

2018
med. 1920x1080
100%
GeForce RTX 2080 Super Mobile:
178  fps
high 1920x1080
100%
GeForce RTX 2080 Super Mobile:
171  fps
ultra 1920x1080
100%
GeForce RTX 2080 Super Mobile:
136  fps
QHD 2560x1440
100%
GeForce RTX 2080 Super Mobile:
104  fps
4K 3840x2160
100%
GeForce RTX 2080 Super Mobile:
52  fps
low 1280x720
Quadro RTX 5000 Max-Q:
113  fps
med. 1920x1080
Quadro RTX 5000 Max-Q:
108  fps
high 1920x1080
Quadro RTX 5000 Max-Q:
98  fps
ultra 1920x1080
Quadro RTX 5000 Max-Q:
86  fps
4K 3840x2160
Quadro RTX 5000 Max-Q:
38  fps
low 1280x720
Quadro RTX 5000 Max-Q:
130.4  fps
med. 1920x1080
Quadro RTX 5000 Max-Q:
91.9  fps
high 1920x1080
Quadro RTX 5000 Max-Q:
85.7  fps
ultra 1920x1080
Quadro RTX 5000 Max-Q:
58.7  fps
4K 3840x2160
Quadro RTX 5000 Max-Q:
38.6  fps
For Honor

For Honor

2017
low 1280x720
Quadro RTX 5000 Max-Q:
246.1  fps
med. 1920x1080
Quadro RTX 5000 Max-Q:
162.1  fps
high 1920x1080
Quadro RTX 5000 Max-Q:
156  fps
ultra 1920x1080
Quadro RTX 5000 Max-Q:
123.2  fps
4K 3840x2160
Quadro RTX 5000 Max-Q:
48.1  fps
low 1280x768
Quadro RTX 5000 Max-Q:
84.4  fps
med. 1920x1080
Quadro RTX 5000 Max-Q:
77.7  fps
high 1920x1080
Quadro RTX 5000 Max-Q:
75.4  fps
4K 3840x2160
Quadro RTX 5000 Max-Q:
42.3  fps
low 1024x768
Quadro RTX 5000 Max-Q:
281.4  fps
med. 1366x768
Quadro RTX 5000 Max-Q:
198.6  fps
high 1920x1080
Quadro RTX 5000 Max-Q:
134.5  fps
ultra 1920x1080
Quadro RTX 5000 Max-Q:
110.1  fps
4K 3840x2160
Quadro RTX 5000 Max-Q:
45.4  fps
low 1024x768
Quadro RTX 5000 Max-Q:
254.8  fps
med. 1366x768
Quadro RTX 5000 Max-Q:
226.7  fps
high 1920x1080
Quadro RTX 5000 Max-Q:
191.8  fps
ultra 1920x1080
Quadro RTX 5000 Max-Q:
183.4  fps
4K 3840x2160
Quadro RTX 5000 Max-Q:
86.9  fps
low 1280x720
100%
GeForce RTX 2080 Super Mobile:
150 168 179 190 ~ 172 fps
86%
Quadro RTX 5000 Max-Q:
138.4 140.8 142 148 156 161 ~ 148 fps
med. 1366x768
100%
GeForce RTX 2080 Super Mobile:
140 154 163 172 ~ 157 fps
85%
Quadro RTX 5000 Max-Q:
126 128.7 130.1 137 142 143 ~ 134 fps
high 1920x1080
100%
GeForce RTX 2080 Super Mobile:
134 148 158 167 ~ 152 fps
82%
Quadro RTX 5000 Max-Q:
117 119 120.1 124.5 130 132 ~ 124 fps
ultra 1920x1080
100%
GeForce RTX 2080 Super Mobile:
127 134 148 156 ~ 141 fps
84%
Quadro RTX 5000 Max-Q:
111 112 114.9 122 122.3 126 ~ 118 fps
4K 3840x2160
100%
GeForce RTX 2080 Super Mobile:
136 145 ~ 141 fps
70%
Quadro RTX 5000 Max-Q:
96.7 98.7 102 ~ 99 fps
low 1024x768
100%
GeForce RTX 2080 Super Mobile:
389.7 471.7 ~ 431 fps
72%
Quadro RTX 5000 Max-Q:
281.8 286.9 298.9 299 320 323.2 353.2 ~ 309 fps
med. 1366x768
100%
GeForce RTX 2080 Super Mobile:
274.2 280 332 ~ 295 fps
81%
Quadro RTX 5000 Max-Q:
225.5 229.5 235 235.8 238.8 249.4 249.8 ~ 238 fps
high 1920x1080
100%
GeForce RTX 2080 Super Mobile:
178 186.2 209 223.2 ~ 199 fps
72%
Quadro RTX 5000 Max-Q:
125.4 139.1 141 144.8 145.3 149.8 158.2 ~ 143 fps
ultra 1920x1080
100%
GeForce RTX 2080 Super Mobile:
93.4 97.7 109 113.2 ~ 103 fps
80%
Quadro RTX 5000 Max-Q:
71 77.3 79.5 81.1 83.3 83.6 84.6 85 85.3 88.5 ~ 82 fps
4K 3840x2160
100%
GeForce RTX 2080 Super Mobile:
66.4 75.6 80.5 ~ 74 fps
68%
Quadro RTX 5000 Max-Q:
46.4 47.5 49.2 50.4 52.5 55.4 ~ 50 fps
GTA V

GTA V

2015
low 1024x768
100%
GeForce RTX 2080 Super Mobile:
185 185 187 ~ 186 fps
93%
Quadro RTX 5000 Max-Q:
169.1 177 ~ 173 fps
med. 1366x768
100%
GeForce RTX 2080 Super Mobile:
178 182 183 ~ 181 fps
92%
Quadro RTX 5000 Max-Q:
163.4 170 ~ 167 fps
high 1920x1080
100%
GeForce RTX 2080 Super Mobile:
164 176 179 ~ 173 fps
82%
Quadro RTX 5000 Max-Q:
132.3 150.4 ~ 141 fps
ultra 1920x1080
100%
GeForce RTX 2080 Super Mobile:
92.8 101 ~ 97 fps
77%
Quadro RTX 5000 Max-Q:
72 77.6 ~ 75 fps
QHD 2560x1440
100%
GeForce RTX 2080 Super Mobile:
90.2  fps
4K 3840x2160
100%
GeForce RTX 2080 Super Mobile:
96 98.9 ~ 97 fps
81%
Quadro RTX 5000 Max-Q:
68.4 89.1 ~ 79 fps
low 1280x720
Quadro RTX 5000 Max-Q:
320.5 365.3 ~ 343 fps
med. 1366x768
Quadro RTX 5000 Max-Q:
283.2 321.5 ~ 302 fps
high 1366x768
Quadro RTX 5000 Max-Q:
265 296.5 ~ 281 fps
ultra 1920x1080
Quadro RTX 5000 Max-Q:
167.2 168.5 174.3 ~ 170 fps

Average Gaming NVIDIA GeForce RTX 2080 Super Mobile → 100%

Average Gaming 30-70 fps → 100%

Average Gaming NVIDIA Quadro RTX 5000 Max-Q → 76%

Average Gaming 30-70 fps → 74%

NVIDIA Quadro RTX 5000 Max-Qlowmed.highultraQHD4K
Watch Dogs Legion908575513721
FIFA 21208.3188.7181.617014384.4
Star Wars Squadrons296225.7203.3185.3125.970.4
Mafia Definitive Edition113.690.382.956.730.2
Serious Sam 410684.779.869.657.534.9
Flight Simulator 202058.3494434.326.916.1
Horizon Zero Dawn12010393886942
Death Stranding114107101997240
F1 20202171621391088346
Gears Tactics202139100795226
Doom Eternal2151611441419851
Hunt Showdown158.2106.29452.526.7
Red Dead Redemption 21168759413223
Star Wars Jedi Fallen Order9791856534
Need for Speed Heat92.384.477.572.165.436.9
Call of Duty Modern Warfare 2019171121101896435
GRID 2019155132107836238
Ghost Recon Breakpoint12210193674827
Borderlands 3118.899.978.462.542.922.8
Control22695684320
F1 20191531331121038554
Total War: Three Kingdoms23112584613920
Rage 2224114.896.494.359.428.7
Anno 1800959472383321.2
The Division 214411297565127
Dirt Rally 2.0258179157906939.8
Far Cry New Dawn1069489847343
Metro Exodus1309270573626
Apex Legends144144144142.8104.953.4
Battlefield V1501221111038450
Hitman 287.785.378.475.373.346.6
Assassin´s Creed Odyssey1018678564831
Shadow of the Tomb Raider1169895876131
Far Cry 5128106101967440
World of Tanks enCore595367.5175.5109.652.3
X-Plane 11.11107947955
Final Fantasy XV Benchmark13897765732
Middle-earth: Shadow of War113108988638
Ghost Recon Wildlands130.491.985.758.738.6
For Honor246.1162.1156123.248.1
Ashes of the Singularity84.477.775.442.3
Rise of the Tomb Raider281.4198.6134.5110.145.4
Rainbow Six Siege254.8226.7191.8183.486.9
Dota 2 Reborn14813412411899
The Witcher 33092381438250
GTA V1731671417579
BioShock Infinite343302281170
< 30 fps
< 60 fps
< 120 fps
≥ 120 fps

1
15
30

1
26
20

2
31
13

8
25
8
1
16
17
2
13
28
5
NVIDIA GeForce RTX 2080 Super Mobilelowmed.highultraQHD4K
FIFA 21278278274238
Star Wars Squadrons263243175105
Mafia Definitive Edition12283.445.2
Serious Sam 41139584.254.4
Flight Simulator 202064.647.137.823.8
Horizon Zero Dawn1271048045
Death Stranding14914710860
F1 202023520515412172
Gears Tactics2261491167641
Doom Eternal21620820516289
Hunt Showdown1511278862
Escape from Tarkov12112112110249.5
Red Dead Redemption 211779.852.942.527.6
Star Wars Jedi Fallen Order12111710786.449
Need for Speed Heat1049179.475.351.3
Call of Duty Modern Warfare 201914513611583.648.3
GRID 201916412088.772.548.8
Ghost Recon Breakpoint10999745734
FIFA 20281267262258227
Borderlands 3131103896536
Control11387.658.929.8
F1 201922417416713080
Rage 214812712781.940.3
Anno 180012291.750.645.327.1
The Division 21471311026936
Dirt Rally 2.017815891.674.1
Far Cry New Dawn1161131009055
Metro Exodus11690.27155.434.9
Apex Legends14414414413175.4
Just Cause 415712011381.246
Darksiders III16814313297.250.5
Battlefield V16916114712172
Hitman 210487.88077.748.4
Assassin´s Creed Odyssey9885625738
Shadow of the Tomb Raider1361351248646
Strange Brigade51526521718313778.4
Monster Hunter World13111910269.136
X-Plane 11.111341179686
Kingdom Come: Deliverance14410775.356.133.1
Final Fantasy XV Benchmark19513310280.245
Fortnite17817113610452
Dota 2 Reborn172157152141141
The Witcher 343129519910374
GTA V1861811739790.297
< 30 fps
< 60 fps
< 120 fps
≥ 120 fps


6


9
28


17
27

3
20
16

8
24
9
4
24
12
3

Eine Liste mit weiteren Spielen und allen Grafikkarten finden Sie auf unserer Seite: Welches Spiel ist mit welcher Grafikkarte spielbar?

v1.28
log 19. 23:16:54

#0 ran 0s before starting gpusingle class +0s ... 0s

#1 checking url part for id 10231 +0s ... 0s

#2 checking url part for id 9923 +0s ... 0s

#3 checking url part for id 9880 +0s ... 0s

#4 redirected to Ajax server, took 1726780614s time from redirect:0 +0s ... 0s

#5 did not recreate cache, as it is less than 5 days old! Created at Thu, 19 Sep 2024 05:16:33 +0200 +0s ... 0s

#6 composed specs +0.006s ... 0.006s

#7 did output specs +0s ... 0.006s

#8 start showIntegratedCPUs +0s ... 0.006s

#9 getting avg benchmarks for device 10231 +0.019s ... 0.025s

#10 got single benchmarks 10231 +0.001s ... 0.027s

#11 getting avg benchmarks for device 9923 +0s ... 0.027s

#12 got single benchmarks 9923 +0.003s ... 0.03s

#13 getting avg benchmarks for device 9880 +0.004s ... 0.034s

#14 got single benchmarks 9880 +0.012s ... 0.046s

#15 got avg benchmarks for devices +0s ... 0.046s

#16 min, max, avg, median took s +0.041s ... 0.087s

#17 before gaming benchmark output +0s ... 0.087s

#18 Got 762 rows for game benchmarks. +0.041s ... 0.128s

#19 composed SQL query for gamebenchmarks +0s ... 0.128s

#20 got data and put it in $dataArray +0.004s ... 0.132s

#21 benchmarks composed for output. +0.019s ... 0.151s

#22 calculated avg scores. +0s ... 0.151s

#23 return log +0.001s ... 0.152s

Teilen Sie diesen Artikel, um uns zu unterstützen. Jeder Link hilft!
> Notebook Test, Laptop Test und News > Benchmarks / Technik > Benchmarks / Technik > Grafikkarten Vergleich - Head 2 Head
Autor: Klaus Hinum,  8.09.2017 (Update:  1.07.2023)