Notebookcheck Logo

NVIDIA GeForce RTX 2080 Super Max-Q vs NVIDIA GeForce RTX 4070 Ti SUPER vs NVIDIA GeForce RTX 4070 SUPER

NVIDIA GeForce RTX 2080 Super Max-Q

► remove from comparison NVIDIA GeForce RTX 2080 Super Max-Q

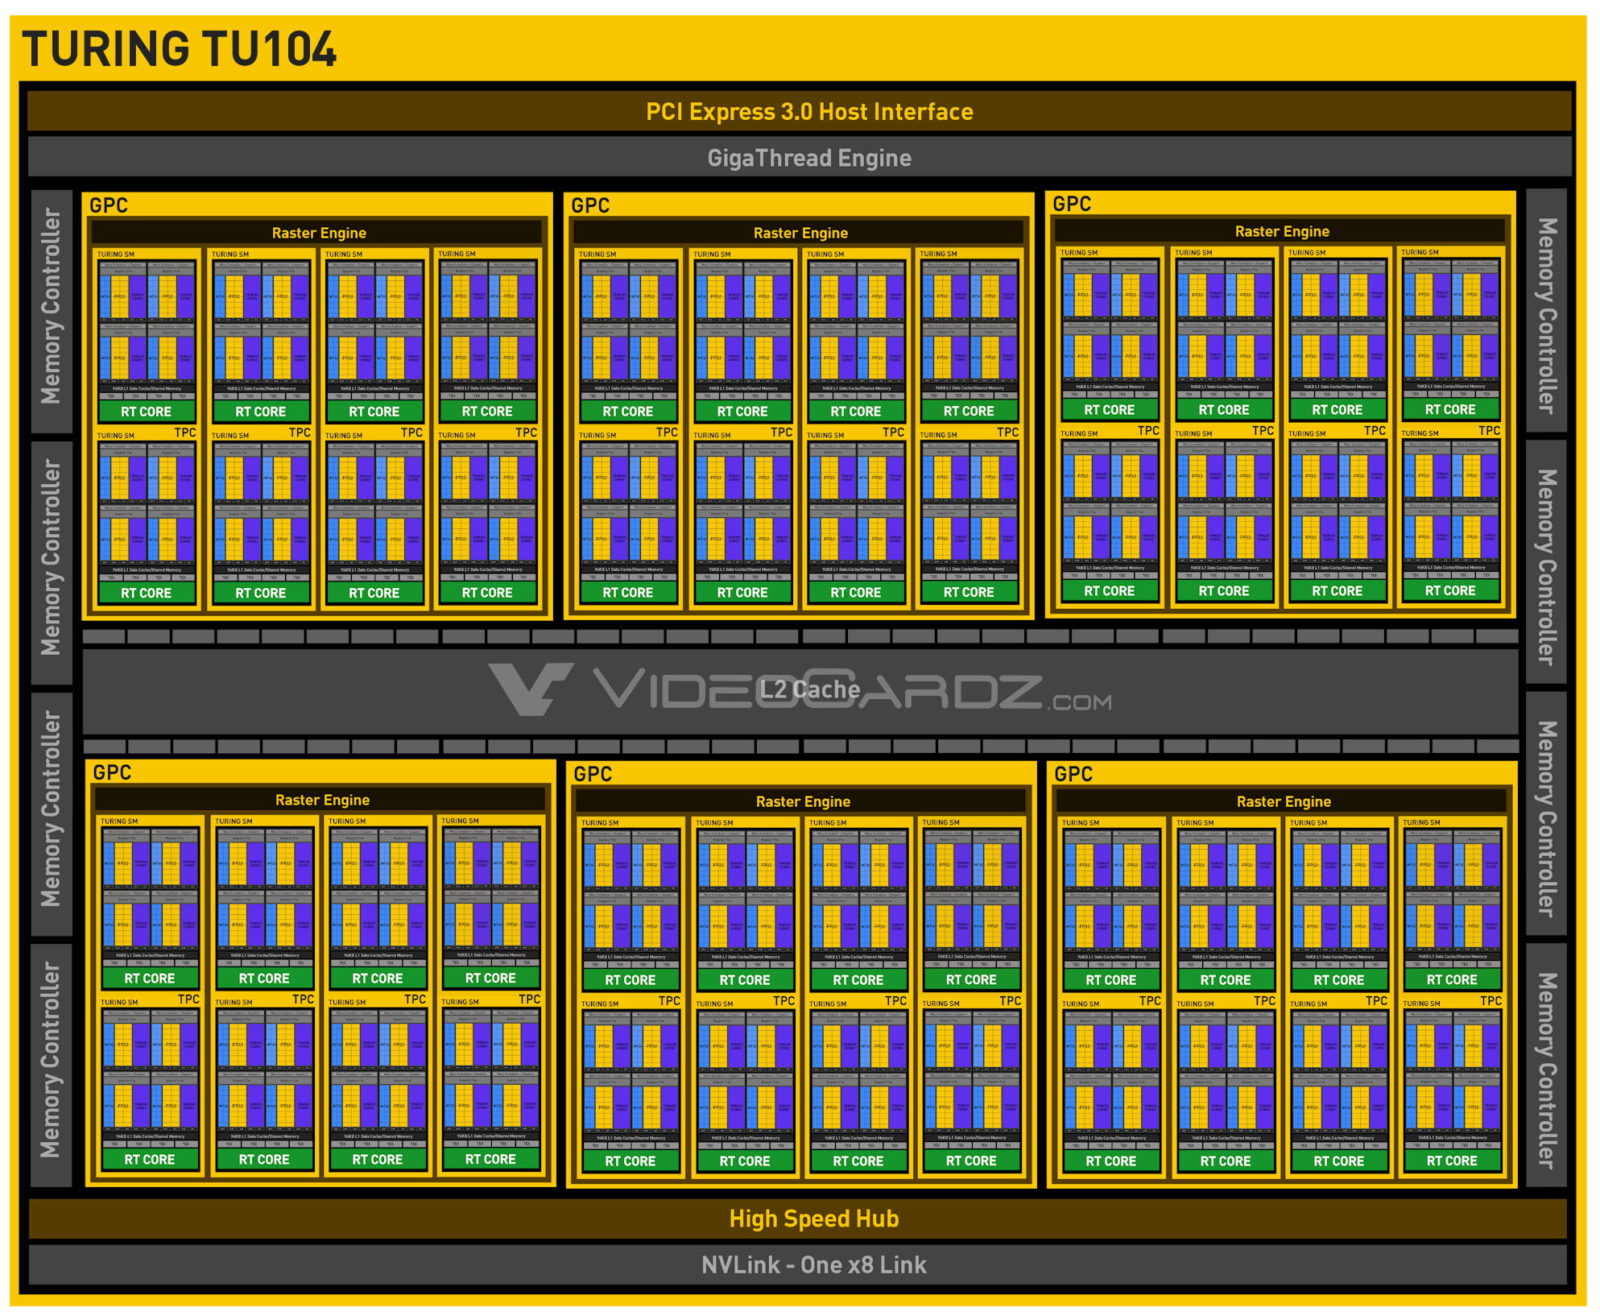
Die Nvidia GeForce RTX 2080 Super Max-Q (für Laptops) ist die Stromsparversion der mobilen GeForce RTX 2080 Super. Sie basiert auf den selben TU104-775-A1 Chip mit 3.072 Shader, jedoch bei deutlich reduzierten Taktraten und Stromverbrauch. Es gibt drei Varianten mit einem TGP (Stromverbrauch des Chips) von 80, 85 und 90 Watt. Die Taktung rangiert von 735 - 975 MHz für den Basistakt und 1.080 - 1.230 MHz im Boost. Die normale 2080 Super Mobile taktet mit 1.365 - 1.560 / 1.560 - 1.740 MHz bis zu 48% höher im Boost, die gleichnamige Desktop-Version ist nochmals schneller getaktet. Die GPU trägt den Codenamen N18E-G3R-A1 (für Refresh).

Mit dem Refresh wurden die Max-Q Technologien überarbeitet und bieten nun neben einer verbesserten Effizienz durch (neue Spannungswandler, Low-Power-GDDR6) auch zwei optionale Features. Der Notebookhersteller kann Dynamic Boost implementieren um Strom von der CPU zur GPU zu verlagern (TDP in 5 Watt Schritten). Weiters gibt es einen neuen "Dynamic Display Switch" für Advanced Optimus der G-SYNC und bis zu 4K 120 Hz ermöglichen.

Features

Der TU104-Chip wird in 12nm gefertigt und bietet eine Reihe neuer Features, wie DLSS (Deep Learning Super Sampling) und Real Time Ray Tracing. Dadurch lassen sich vor allem Beleuchtungseffekte sehr viel realistischer darstellen. Weiterhin gibt es Support für DisplayPort 1.4 (ready), HDMI 2.0b, HDR, Simultaneous Multi-Projection (SMP) sowie H.265 Video De- und Encoding (PlayReady 3.0). 

Performance

Die Performance der mobilen GeForce RTX 2080 Super Max-Q ist stark abhängig vom verbauten Notebook und kann sich in unseren ersten Tests nur minimal von der alten RTX 2080 Max-Q absetzen. Damit erreicht sie meist nur die Performance einer normalen RTX 2070 für Notebooks. Damit eignet sich die Grafikkarte am besten für 1440p bei maximalen Details in anspruchsvollen Spielen wie Red Dead Redemption 2, Control oder Borderlands 3. Weniger anspruchsvolle Spiele wie F1 2019 können auch in 4k mit maximalen Details flüssig gespielt werden. Detaillierte Spielebenchmarks finden Sie am Ende dieser Seite.

Durch den verringerten Stromverbrauch von 80 - 90 Watt TGP eignet sich die RTX 2080 Super Max-Q auch für dünnere Gaming-Notebooks.

NVIDIA GeForce RTX 4070 Ti SUPER

► remove from comparison NVIDIA NVIDIA GeForce RTX 4070 Ti SUPER

Die Nvidia GeForce RTX 4070 Ti SUPER ist eine High-End-Desktop-Grafikkarte basierend auf die Ada Lovelace Architektur. Sie nutzt den AD103 Chip und bietet 8,448 Kerne und 16 GB GDDR6X Grafikspeicher (256 Bit Bus mit 22,4 Gbits).

Die Gaming-Performance reicht auch bei anspruchsvollen Spielen wie bei Cyberpunk noch für 4k mit ultra Settings, jedoch werden die 60 fps nicht mehr immer erreicht. Mit Raytracing empfiehlt sich der Einsatz von DLSS und eventuell das reduzieren der Auflösung. Im Konkurrenzvergleich reiht sich die SUPER Variante wie erwartet zwischen RTX 4080 und alter 4070 Ti ein.

Der AD103 Chip wird bei TSMC in 5nm (4N mit EUV) produziert und ist mit einem TGP (Total Graphics Power) von 285 Watt spezifiziert.

NVIDIA GeForce RTX 4070 SUPER

► remove from comparison NVIDIA NVIDIA GeForce RTX 4070 SUPER

Die Nvidia GeForce RTX 4070 SUPER ist eine High-End-Desktop-Grafikkarte basierend auf die Ada Lovelace Architektur. Sie nutzt den AD104 Chip und bietet 7.168 Kerne und 12 GB GDDR6X Grafikspeicher (192 Bit Bus mit 21 Gbits).

Die Leistung der RTX 4070S liegt zwischen den älteren RTX 4070 und RTX 4070 Ti in der Spitzenklasse der High-End GPUs in 2024. Verglichen mit AMD liegt die 4070 Super auf dem Niveau der RX 7800 XT. Damit eignet sich die GPU am besten für QHD und maximale Details von anspruchsvollen Spielen (wie Avatar Frontiers of Pandora, Allan Wake 2, Cyberpunk 2033 oder F1 23). Weniger anspruchsvolle Spiele können auch in 4K flüssig gespielt werden (AC Mirage, Cod MW 3, ...).

Der AD104 Chip wird bei TSMC in 5 nm (4N mit EUV) produziert und ist mit einem TGP (Total Graphics Power) von 200 Watt spezifiziert.

NVIDIA GeForce RTX 2080 Super Max-QNVIDIA GeForce RTX 4070 Ti SUPERNVIDIA GeForce RTX 4070 SUPER
GeForce RTX 4000 Serie
NVIDIA Titan RTX 4608 @ 1.35 - 1.77 GHz384 Bit @ 14000 MHz
GeForce RTX 2080 Ti (Desktop) 4352 @ 1.35 - 1.55 GHz352 Bit @ 14000 MHz
GeForce RTX 2080 Super (Desktop) 3072 @ 1.65 - 1.82 GHz256 Bit @ 15500 MHz
GeForce RTX 2080 (Desktop) 2944 @ 1.52 - 1.71 GHz256 Bit @ 14000 MHz
GeForce RTX 2080 Super Mobile 3072 @ 1.37 - 1.56 GHz256 Bit @ 14000 MHz
GeForce RTX 2080 Mobile 2944 @ 1.38 - 1.59 GHz256 Bit @ 14000 MHz
GeForce RTX 2070 Super (Desktop) 2560 @ 1.61 - 1.77 GHz256 Bit @ 14000 MHz
GeForce RTX 2070 (Desktop) 2304 @ 1.41 - 1.62 GHz256 Bit @ 14000 MHz
GeForce RTX 2070 Super Mobile 2560 @ 1.14 - 1.38 GHz256 Bit @ 14002 MHz
GeForce RTX 2080 Super Max-Q 3072 @ 0.98 - 1.23 GHz256 Bit @ 11000 MHz
GeForce RTX 2060 Super (Desktop) 2176 @ 1.47 - 1.65 GHz256 Bit @ 14000 MHz
GeForce RTX 2070 Mobile 2304 @ 1.22 - 1.44 GHz256 Bit @ 14000 MHz
GeForce RTX 2080 Max-Q 2944 @ 0.74 - 1.1 GHz256 Bit @ 12000 MHz
GeForce RTX 2060 (Desktop) 1920 @ 1.32 - 1.62 GHz192 Bit @ 14000 MHz
GeForce RTX 2070 Super Max-Q 2560 @ 0.93 - 1.16 GHz256 Bit @ 11000 MHz
GeForce RTX 2070 Max-Q 2304 @ 0.89 - 1.19 GHz256 Bit @ 12000 MHz
GeForce RTX 2060 Mobile 1920 @ 0.96 - 1.2 GHz192 Bit @ 14000 MHz
GeForce RTX 2060 Max-Q 1920 @ 0.98 - 1.19 GHz192 Bit @ 11000 MHz
GeForce RTX 2050 Mobile 2048 @ 1.48 GHz64 Bit @ 14000 MHz
NVIDIA GeForce RTX 4090 16384 @ 2.24 - 2.52 GHz384 Bit @ 21000 MHz
NVIDIA GeForce RTX 4080 Super 10240 @ 2.3 - 2.55 GHz? Bit @ 23000 MHz
NVIDIA GeForce RTX 4080 9728 @ 2.21 - 2.51 GHz256 Bit @ 22400 MHz
NVIDIA GeForce RTX 4070 Ti SUPER 8448 @ 2.34 - 2.61 GHz256 Bit @ 21000 MHz
NVIDIA GeForce RTX 4070 Ti 7680 @ 2.31 - 2.61 GHz192 Bit @ 21000 MHz
NVIDIA GeForce RTX 4070 SUPER 7168 @ 1.98 - 2.48 GHz192 Bit @ 21000 MHz
NVIDIA GeForce RTX 4070 5888 @ 1.92 - 2.48 GHz192 Bit @ 21000 MHz
NVIDIA GeForce RTX 4060 Ti 16G 4352 @ 2.31 - 2.54 GHz128 Bit @ 18000 MHz
NVIDIA GeForce RTX 4060 Ti 8G 4352 @ 2.31 - 2.54 GHz128 Bit @ 18000 MHz
NVIDIA GeForce RTX 4060 3072 @ 1.83 - 2.46 GHz128 Bit @ 17000 MHz
CodenameN18E-G3AD103-275AD104
ArchitekturTuringAda LovelaceAda Lovelace
Pipelines3072 - unified8448 - unified7168 - unified
Kerntakt975 - 1230 (Boost) MHz2340 - 2610 (Boost) MHz1980 - 2475 (Boost) MHz
Speichertakt11000 MHz21000 effective = 1400 MHz21000 effective = 1313 MHz
Speicherbandbreite256 Bit256 Bit192 Bit
SpeichertypGDDR6GDDR6XGDDR6X
Max. Speichergröße8 GB16 GB12 GB
Shared Memoryneinneinnein
APIDirectX 12_1, OpenGL 4.6DirectX 12 Ultimate, Shader 6.7, OpenGL 4.6, OpenCL 3.0, Vulkan 1.3DirectX 12 Ultimate, Shader 6.7, OpenGL 4.6, OpenCL 3.0, Vulkan 1.3
Stromverbrauch90 Watt285 Watt220 Watt
Transistors13.6 Billion45.9 Billion35.8 Billion
Herstellungsprozess12 nm5 nm5 nm
FeaturesNVLink, DLSS, Raytraycing, VR Ready, G-SYNC, Vulkan, Multi Monitor, 650 Watt system power recommended
Notebookgrößegroß (17" z.B.)
Erscheinungsdatum02.04.2020 24.01.2024 17.01.2024
TMUs264224
ROPs9680
Raytracing Cores6656
Tensor / AI Cores264224
Theoretical Performance40.1 TFLOPS FP16, 40.1 TFLOPS FP32, 0.63 TFLOPS FP6435.5 TFLOPS FP16, 35.5 TFLOPS FP32, 0.55 TFLOPS FP64
CacheL2: 48 MBL2: 48 MB
Die Size 379 mm² 295 mm²
PCIe4.0 x164.0 x16
Displays4 Displays (max.), HDMI 2.1, DisplayPort 1.4a4 Displays (max.), HDMI 2.1, DisplayPort 1.4a
PredecessorNVIDIA GeForce RTX 4070 TiNVIDIA GeForce RTX 4070
Memory Bandwidth504.2 GB/s

Benchmarks

Performance Rating - 3DMark 11 + Fire Strike + Time Spy - NVIDIA GeForce RTX 4070 Ti SUPER
23.3 pt (70%)
Performance Rating - 3DMark 11 + Fire Strike + Time Spy - NVIDIA GeForce RTX 4070 SUPER
21.6 pt (65%)
3DMark - 3DMark Time Spy Score
min: 7475     avg: 8204     median: 8075 (23%)     max: 9051 Points
23540 Points (68%)
min: 21080     avg: 21186     median: 21186 (61%)     max: 21292 Points
3DMark - 3DMark Time Spy Graphics
min: 7372     avg: 8210     median: 8331 (22%)     max: 8979 Points
23695 Points (63%)
min: 20867     avg: 20992     median: 20992 (56%)     max: 21117 Points
3DMark - 3DMark Ice Storm Unlimited Graphics
min: 443119     avg: 465029     median: 468363 (47%)     max: 483604 Points
min: 763636     avg: 766679     median: 766678 (77%)     max: 769721 Points
3DMark - 3DMark Ice Storm Extreme Graphics
min: 515758     avg: 517177     median: 517176 (64%)     max: 518595 Points
3DMark - 3DMark Cloud Gate Score
min: 32880     avg: 42751     median: 44534 (48%)     max: 53680 Points
min: 81504     avg: 81898     median: 81897.5 (88%)     max: 82291 Points
3DMark - 3DMark Cloud Gate Graphics
min: 101976     avg: 126108     median: 127741 (34%)     max: 140750 Points
min: 170014     avg: 171098     median: 171098 (45%)     max: 172182 Points
3DMark - 3DMark Fire Strike Standard Score
min: 17053     avg: 18565     median: 18578.5 (33%)     max: 20173 Points
42631 Points (75%)
min: 39061     avg: 40120     median: 40119.5 (71%)     max: 41178 Points
3DMark - 3DMark Fire Strike Standard Graphics
min: 19655     avg: 21743     median: 21902.5 (25%)     max: 23649 Points
52738 Points (60%)
min: 48043     avg: 48876     median: 48876 (55%)     max: 49709 Points
3DMark - 3DMark Ice Storm Graphics
587810 Points (69%)
min: 559629     avg: 564567     median: 564567 (66%)     max: 569505 Points
3DMark - 3DMark Wild Life Unlimited
min: 134699     avg: 135490     median: 135490 (68%)     max: 136280 Points
3DMark - 3DMark Wild Life Extreme Unlimited
min: 41082     avg: 41368     median: 41368 (48%)     max: 41654 Points
3DMark - 3DMark Night Raid
91419 Points (86%)
min: 89236     avg: 89795     median: 89795 (85%)     max: 90354 Points
3DMark - 3DMark Night Raid Graphics Score
209177 Points (80%)
min: 195290     avg: 198557     median: 198556 (76%)     max: 201823 Points
3DMark 11 - 3DM11 Performance Score
min: 20888     avg: 23821     median: 24119 (33%)     max: 26066 Points
54278 Points (75%)
min: 51107     avg: 51340     median: 51339.5 (71%)     max: 51572 Points
3DMark 11 - 3DM11 Performance GPU
min: 26292     avg: 29663     median: 29636.5 (25%)     max: 32995 Points
74834 Points (64%)
min: 67852     avg: 68373     median: 68373 (59%)     max: 68894 Points
3DMark Vantage
3DM Vant. Perf. total + NVIDIA GeForce RTX 2080 Super Max-Q
3DMark Vantage - 3DM Vant. Perf. total
60306 Points (17%)
3DM Vant. Perf. GPU no PhysX + NVIDIA GeForce RTX 2080 Super Max-Q
3DMark Vantage - 3DM Vant. Perf. GPU no PhysX
69467 Points (38%)
3DMark 06 3DMark 06 - Standard 1280x1024 + NVIDIA GeForce RTX 2080 Super Max-Q
3DMark 06
38265 Points (50%)
Unigine Valley 1.0 - Unigine Valley 1.0 DX
242.6 fps (75%)
min: 213.8     avg: 214.6     median: 214.6 (66%)     max: 215.3 fps
Blender - Blender 3.3 Classroom CUDA *
17 Seconds (3%)
Blender - Blender 3.3 Classroom OPTIX *
10 Seconds (4%)
SPECviewperf 13 specvp13 sw-04 + NVIDIA GeForce RTX 2080 Super Max-Q
SPECviewperf 13 - specvp13 sw-04
min: 88.7     avg: 88.8     median: 88.8 (24%)     max: 88.9 fps
specvp13 snx-03 + NVIDIA GeForce RTX 2080 Super Max-Q
SPECviewperf 13 - specvp13 snx-03
min: 20.88     avg: 21.1     median: 21.1 (2%)     max: 21.33 fps
specvp13 showcase-02 + NVIDIA GeForce RTX 2080 Super Max-Q
SPECviewperf 13 - specvp13 showcase-02
96.2 fps (21%)
specvp13 medical-02 + NVIDIA GeForce RTX 2080 Super Max-Q
SPECviewperf 13 - specvp13 medical-02
min: 53.1     avg: 55.5     median: 55.5 (12%)     max: 57.9 fps
specvp13 maya-05 + NVIDIA GeForce RTX 2080 Super Max-Q
SPECviewperf 13 - specvp13 maya-05
min: 210.2     avg: 212.8     median: 212.8 (24%)     max: 215.4 fps
specvp13 energy-02 + NVIDIA GeForce RTX 2080 Super Max-Q
SPECviewperf 13 - specvp13 energy-02
min: 17.49     avg: 17.7     median: 17.7 (6%)     max: 17.92 fps
specvp13 creo-02 + NVIDIA GeForce RTX 2080 Super Max-Q
SPECviewperf 13 - specvp13 creo-02
min: 170     avg: 173.6     median: 173.6 (25%)     max: 177.2 fps
specvp13 catia-05 + NVIDIA GeForce RTX 2080 Super Max-Q
SPECviewperf 13 - specvp13 catia-05
min: 132.3     avg: 136.4     median: 136.4 (15%)     max: 140.4 fps
specvp13 3dsmax-06 + NVIDIA GeForce RTX 2080 Super Max-Q
SPECviewperf 13 - specvp13 3dsmax-06
min: 175.5     avg: 176.1     median: 176.1 (31%)     max: 176.6 fps
Cinebench R10 Cinebench R10 Shading (32bit) + NVIDIA GeForce RTX 2080 Super Max-Q
Cinebench R10 - Cinebench R10 Shading (32bit)
13620 Points (10%)
Cinebench R11.5 Cinebench R11.5 OpenGL 64 Bit + NVIDIA GeForce RTX 2080 Super Max-Q
Cinebench R11.5 - Cinebench R11.5 OpenGL 64 Bit
82.1 fps (27%)
Cinebench R15
Cinebench R15 OpenGL 64 Bit + NVIDIA GeForce RTX 2080 Super Max-Q
Cinebench R15 - Cinebench R15 OpenGL 64 Bit
min: 114     avg: 140.1     median: 142 (8%)     max: 152.1 fps
Cinebench R15 OpenGL 64 Bit + NVIDIA GeForce RTX 4070 Ti SUPER
Cinebench R15 OpenGL Ref. Match 64 Bit + NVIDIA GeForce RTX 2080 Super Max-Q
Cinebench R15 - Cinebench R15 OpenGL Ref. Match 64 Bit
99.6 % (100%)
Cinebench R15 OpenGL Ref. Match 64 Bit + NVIDIA GeForce RTX 4070 Ti SUPER
GFXBench - GFXBench Car Chase Offscreen
368.4 fps (41%)
LuxMark v2.0 64Bit - LuxMark v2.0 Room GPU
9355 Samples/s (42%)
min: 8257     avg: 8260     median: 8259.5 (37%)     max: 8262 Samples/s
LuxMark v2.0 64Bit - LuxMark v2.0 Sala GPU
19620 Samples/s (34%)
min: 19072     avg: 19102     median: 19101.5 (33%)     max: 19131 Samples/s
ComputeMark v2.1 - ComputeMark v2.1 Result
16221 Points (18%)
min: 47808     avg: 47986     median: 47985.5 (52%)     max: 48163 Points
Power Consumption - Furmark Stress Test Power Consumption - external Monitor *
161 Watt (23%)
min: 395     avg: 410.5     median: 410.5 (58%)     max: 426 Watt
Power Consumption - The Witcher 3 Power Consumption - external Monitor *
149 Watt (21%)
min: 393     avg: 395.5     median: 395.5 (55%)     max: 398 Watt
Power Consumption - Witcher 3 Power Consumption *
min: 140     avg: 150.1     median: 146.1 (32%)     max: 170 Watt
Power Consumption - Witcher 3 ultra Power Efficiency
min: 0.4418     avg: 0.6     median: 0.6 (51%)     max: 0.635 fps per Watt
Power Consumption - Witcher 3 ultra Power Efficiency - external Monitor
0.6 fps per Watt (49%)
0.5 fps per Watt (44%)
min: 0.509     avg: 0.5     median: 0.5 (43%)     max: 0.541 fps per Watt
Emissions Witcher 3 Fan Noise + NVIDIA GeForce RTX 2080 Super Max-Q
Emissions - Witcher 3 Fan Noise
min: 41     avg: 48.1     median: 48 (77%)     max: 54 dB(A)
Clock Speed - GPU Clock Witcher 3 ultra
min: 1215     avg: 1371     median: 1387.5 (54%)     max: 1506 MHz
Clock Speed - GPU Clock Speed Furmark
819 MHz (32%)

Average Benchmarks NVIDIA GeForce RTX 2080 Super Max-Q → 100% n=10

Average Benchmarks NVIDIA GeForce RTX 4070 Ti SUPER → 233% n=10

Average Benchmarks NVIDIA GeForce RTX 4070 SUPER → 217% n=10

- Bereich der Benchmarkergebnisse für diese Grafikkarte
- Durchschnittliche Benchmarkergebnisse für diese Grafikkarte
* Smaller numbers mean a higher performance
1 This benchmark is not used for the average calculation

Spiele-Benchmarks

Die folgenden Benchmarks basieren auf unseren Spieletests mit Testnotebooks. Die Performance dieser Grafikkarte bei den gelisteten Spielen ist abhängig von der verwendeten CPU, Speicherausstattung, Treiber und auch Betriebssystem. Dadurch müssen die untenstehenden Werte nicht repräsentativ sein. Detaillierte Informationen über das verwendete System sehen Sie nach einem Klick auf den fps-Wert.

med. 1920x1080
NVIDIA GeForce RTX 4070 Ti SUPER:
163  fps
NVIDIA GeForce RTX 4070 SUPER:
137.4  fps
high 1920x1080
NVIDIA GeForce RTX 4070 Ti SUPER:
141.8  fps
NVIDIA GeForce RTX 4070 SUPER:
122.1 129.9 ~ 126 fps
ultra 1920x1080
NVIDIA GeForce RTX 4070 Ti SUPER:
113.2  fps
NVIDIA GeForce RTX 4070 SUPER:
96.2 101.2 ~ 99 fps
QHD 2560x1440
NVIDIA GeForce RTX 4070 Ti SUPER:
76.6  fps
NVIDIA GeForce RTX 4070 SUPER:
61.5 67.6 ~ 65 fps
4K 3840x2160
NVIDIA GeForce RTX 4070 Ti SUPER:
39.8  fps
NVIDIA GeForce RTX 4070 SUPER:
33.9 34.6 ~ 34 fps
4K DLSS 3840x2160
NVIDIA GeForce RTX 4070 Ti SUPER:
68.9  fps
NVIDIA GeForce RTX 4070 SUPER:
56.6 60.5 ~ 59 fps
med. 1920x1080
NVIDIA GeForce RTX 4070 Ti SUPER:
227  fps
NVIDIA GeForce RTX 4070 SUPER:
226  fps
high 1920x1080
NVIDIA GeForce RTX 4070 Ti SUPER:
184  fps
NVIDIA GeForce RTX 4070 SUPER:
179 184 ~ 182 fps
ultra 1920x1080
NVIDIA GeForce RTX 4070 Ti SUPER:
179  fps
NVIDIA GeForce RTX 4070 SUPER:
165 166 ~ 166 fps
QHD 2560x1440
NVIDIA GeForce RTX 4070 Ti SUPER:
133  fps
NVIDIA GeForce RTX 4070 SUPER:
118 120 ~ 119 fps
4K 3840x2160
NVIDIA GeForce RTX 4070 Ti SUPER:
84  fps
NVIDIA GeForce RTX 4070 SUPER:
70 71 ~ 71 fps
4K DLSS 3840x2160
NVIDIA GeForce RTX 4070 Ti SUPER:
112  fps
NVIDIA GeForce RTX 4070 SUPER:
99 100 ~ 100 fps
med. 1920x1080
NVIDIA GeForce RTX 4070 Ti SUPER:
124.7  fps
NVIDIA GeForce RTX 4070 SUPER:
112.8  fps
high 1920x1080
NVIDIA GeForce RTX 4070 Ti SUPER:
114.4  fps
NVIDIA GeForce RTX 4070 SUPER:
105.1 114.1 ~ 110 fps
QHD 2560x1440
NVIDIA GeForce RTX 4070 Ti SUPER:
82.5  fps
NVIDIA GeForce RTX 4070 SUPER:
73.8 79.7 ~ 77 fps
4K 3840x2160
NVIDIA GeForce RTX 4070 Ti SUPER:
44.7  fps
NVIDIA GeForce RTX 4070 SUPER:
40 42.7 ~ 41 fps
4K DLSS 3840x2160
NVIDIA GeForce RTX 4070 Ti SUPER:
63.7  fps
NVIDIA GeForce RTX 4070 SUPER:
28.9 44.2 ~ 37 fps
med. 1920x1080
NVIDIA GeForce RTX 4070 Ti SUPER:
221  fps
NVIDIA GeForce RTX 4070 SUPER:
205  fps
high 1920x1080
NVIDIA GeForce RTX 4070 Ti SUPER:
206  fps
NVIDIA GeForce RTX 4070 SUPER:
193 204 ~ 199 fps
ultra 1920x1080
NVIDIA GeForce RTX 4070 Ti SUPER:
170  fps
NVIDIA GeForce RTX 4070 SUPER:
157 169 ~ 163 fps
QHD 2560x1440
NVIDIA GeForce RTX 4070 Ti SUPER:
136  fps
NVIDIA GeForce RTX 4070 SUPER:
121 130 ~ 126 fps
4K 3840x2160
NVIDIA GeForce RTX 4070 Ti SUPER:
84  fps
NVIDIA GeForce RTX 4070 SUPER:
72 77 ~ 75 fps
4K DLSS 3840x2160
NVIDIA GeForce RTX 4070 Ti SUPER:
112  fps
NVIDIA GeForce RTX 4070 SUPER:
99 106 ~ 103 fps
low 1920x1080
NVIDIA GeForce RTX 4070 Ti SUPER:
188.5  fps
NVIDIA GeForce RTX 4070 SUPER:
186  fps
med. 1920x1080
NVIDIA GeForce RTX 4070 Ti SUPER:
188.5  fps
NVIDIA GeForce RTX 4070 SUPER:
181.8  fps
high 1920x1080
NVIDIA GeForce RTX 4070 Ti SUPER:
170.8  fps
NVIDIA GeForce RTX 4070 SUPER:
156.3 162.1 ~ 159 fps
ultra 1920x1080
NVIDIA GeForce RTX 4070 Ti SUPER:
150.3  fps
NVIDIA GeForce RTX 4070 SUPER:
136.2 141.9 ~ 139 fps
QHD 2560x1440
NVIDIA GeForce RTX 4070 Ti SUPER:
94.9  fps
NVIDIA GeForce RTX 4070 SUPER:
83.8 89.6 ~ 87 fps
4K 3840x2160
NVIDIA GeForce RTX 4070 Ti SUPER:
42.3  fps
NVIDIA GeForce RTX 4070 SUPER:
38.4 38.9 ~ 39 fps
med. 1920x1080
NVIDIA GeForce RTX 4070 Ti SUPER:
246  fps
NVIDIA GeForce RTX 4070 SUPER:
228  fps
high 1920x1080
NVIDIA GeForce RTX 4070 Ti SUPER:
223  fps
NVIDIA GeForce RTX 4070 SUPER:
198.8 203 ~ 201 fps
ultra 1920x1080
NVIDIA GeForce RTX 4070 Ti SUPER:
218  fps
NVIDIA GeForce RTX 4070 SUPER:
194.3 203 ~ 199 fps
QHD 2560x1440
NVIDIA GeForce RTX 4070 Ti SUPER:
157.8  fps
NVIDIA GeForce RTX 4070 SUPER:
140.3 142.7 ~ 142 fps
4K 3840x2160
NVIDIA GeForce RTX 4070 Ti SUPER:
117.2  fps
NVIDIA GeForce RTX 4070 SUPER:
71.6 71.7 ~ 72 fps
4K DLSS 3840x2160
NVIDIA GeForce RTX 4070 Ti SUPER:
133.9  fps
NVIDIA GeForce RTX 4070 SUPER:
115.4 119.7 ~ 118 fps
F1 23

F1 23

2023
low 1920x1080
NVIDIA GeForce RTX 4070 Ti SUPER:
385  fps
NVIDIA GeForce RTX 4070 SUPER:
380 381 ~ 381 fps
med. 1920x1080
NVIDIA GeForce RTX 4070 Ti SUPER:
402  fps
NVIDIA GeForce RTX 4070 SUPER:
398 406 ~ 402 fps
high 1920x1080
NVIDIA GeForce RTX 4070 Ti SUPER:
363  fps
NVIDIA GeForce RTX 4070 SUPER:
344 357 ~ 351 fps
ultra 1920x1080
NVIDIA GeForce RTX 4070 Ti SUPER:
138.2  fps
NVIDIA GeForce RTX 4070 SUPER:
122.4 125.9 ~ 124 fps
QHD 2560x1440
NVIDIA GeForce RTX 4070 Ti SUPER:
90  fps
NVIDIA GeForce RTX 4070 SUPER:
78 81.2 ~ 80 fps
4K 3840x2160
NVIDIA GeForce RTX 4070 Ti SUPER:
45.1  fps
NVIDIA GeForce RTX 4070 SUPER:
39 40.7 ~ 40 fps
4K DLSS 3840x2160
NVIDIA GeForce RTX 4070 Ti SUPER:
77.4  fps
NVIDIA GeForce RTX 4070 SUPER:
66.8 69.7 ~ 68 fps
med. 1920x1080
NVIDIA GeForce RTX 4070 Ti SUPER:
210.6  fps
NVIDIA GeForce RTX 4070 SUPER:
208  fps
high 1920x1080
NVIDIA GeForce RTX 4070 Ti SUPER:
202.9  fps
NVIDIA GeForce RTX 4070 SUPER:
201.7 216.1 ~ 209 fps
ultra 1920x1080
NVIDIA GeForce RTX 4070 Ti SUPER:
149.4  fps
NVIDIA GeForce RTX 4070 SUPER:
149.6 155.7 ~ 153 fps
QHD 2560x1440
NVIDIA GeForce RTX 4070 Ti SUPER:
114.8  fps
NVIDIA GeForce RTX 4070 SUPER:
118 123.8 ~ 121 fps
4K 3840x2160
NVIDIA GeForce RTX 4070 Ti SUPER:
70  fps
NVIDIA GeForce RTX 4070 SUPER:
73.6 78 ~ 76 fps
F1 22

F1 22

2022
low 1920x1080
NVIDIA GeForce RTX 4070 Ti SUPER:
371  fps
NVIDIA GeForce RTX 4070 SUPER:
363 381 ~ 372 fps
med. 1920x1080
NVIDIA GeForce RTX 4070 Ti SUPER:
384  fps
NVIDIA GeForce RTX 4070 SUPER:
386 403 ~ 395 fps
high 1920x1080
NVIDIA GeForce RTX 4070 Ti SUPER:
336  fps
NVIDIA GeForce RTX 4070 SUPER:
321 340 ~ 331 fps
ultra 1920x1080
NVIDIA GeForce RTX 4070 Ti SUPER:
144.9  fps
NVIDIA GeForce RTX 4070 SUPER:
128.7 136.3 ~ 133 fps
QHD 2560x1440
NVIDIA GeForce RTX 4070 Ti SUPER:
95.1  fps
NVIDIA GeForce RTX 4070 SUPER:
83.1 88.8 ~ 86 fps
4K 3840x2160
NVIDIA GeForce RTX 4070 Ti SUPER:
48.9  fps
NVIDIA GeForce RTX 4070 SUPER:
41.9 44.6 ~ 43 fps
med. 1920x1080
NVIDIA GeForce RTX 4070 Ti SUPER:
278  fps
NVIDIA GeForce RTX 4070 SUPER:
285  fps
high 1920x1080
NVIDIA GeForce RTX 4070 Ti SUPER:
282  fps
NVIDIA GeForce RTX 4070 SUPER:
279 284 ~ 282 fps
ultra 1920x1080
NVIDIA GeForce RTX 4070 Ti SUPER:
283  fps
NVIDIA GeForce RTX 4070 SUPER:
278 291 ~ 285 fps
QHD 2560x1440
NVIDIA GeForce RTX 4070 Ti SUPER:
217  fps
NVIDIA GeForce RTX 4070 SUPER:
189.6 194.8 ~ 192 fps
4K 3840x2160
NVIDIA GeForce RTX 4070 Ti SUPER:
99.2  fps
NVIDIA GeForce RTX 4070 SUPER:
87.5 92.7 ~ 90 fps
low 1920x1080
NVIDIA GeForce RTX 4070 Ti SUPER:
196.9  fps
NVIDIA GeForce RTX 4070 SUPER:
195.7  fps
med. 1920x1080
NVIDIA GeForce RTX 4070 Ti SUPER:
195.9  fps
NVIDIA GeForce RTX 4070 SUPER:
184.1  fps
high 1920x1080
NVIDIA GeForce RTX 4070 Ti SUPER:
172.3  fps
NVIDIA GeForce RTX 4070 SUPER:
156.5 161.8 ~ 159 fps
ultra 1920x1080
NVIDIA GeForce RTX 4070 Ti SUPER:
157.5  fps
NVIDIA GeForce RTX 4070 SUPER:
141 146 ~ 144 fps
QHD 2560x1440
NVIDIA GeForce RTX 4070 Ti SUPER:
103.6  fps
NVIDIA GeForce RTX 4070 SUPER:
91.3 92.8 ~ 92 fps
4K 3840x2160
NVIDIA GeForce RTX 4070 Ti SUPER:
49.7  fps
NVIDIA GeForce RTX 4070 SUPER:
43.5 44.9 ~ 44 fps
med. 1920x1080
NVIDIA GeForce RTX 4070 Ti SUPER:
213  fps
NVIDIA GeForce RTX 4070 SUPER:
201  fps
high 1920x1080
NVIDIA GeForce RTX 4070 Ti SUPER:
162.2  fps
NVIDIA GeForce RTX 4070 SUPER:
150.5 157 ~ 154 fps
QHD 2560x1440
NVIDIA GeForce RTX 4070 Ti SUPER:
121.5  fps
NVIDIA GeForce RTX 4070 SUPER:
108 109.7 ~ 109 fps
4K 3840x2160
NVIDIA GeForce RTX 4070 Ti SUPER:
63.7  fps
NVIDIA GeForce RTX 4070 SUPER:
52.8 54.5 ~ 54 fps
Far Cry 6

Far Cry 6

2021
med. 1920x1080
NVIDIA GeForce RTX 4070 Ti SUPER:
209  fps
NVIDIA GeForce RTX 4070 SUPER:
206  fps
high 1920x1080
NVIDIA GeForce RTX 4070 Ti SUPER:
191  fps
NVIDIA GeForce RTX 4070 SUPER:
181.8 193.7 ~ 188 fps
ultra 1920x1080
NVIDIA GeForce RTX 4070 Ti SUPER:
169  fps
NVIDIA GeForce RTX 4070 SUPER:
143.9 160 173.6 ~ 159 fps
QHD 2560x1440
NVIDIA GeForce RTX 4070 Ti SUPER:
154  fps
NVIDIA GeForce RTX 4070 SUPER:
139.4 145.9 ~ 143 fps
4K 3840x2160
NVIDIA GeForce RTX 4070 Ti SUPER:
91  fps
NVIDIA GeForce RTX 4070 SUPER:
79 82.7 ~ 81 fps
med. 1920x1080
NVIDIA GeForce RTX 4070 Ti SUPER:
171.2  fps
NVIDIA GeForce RTX 4070 SUPER:
169.2  fps
high 1920x1080
NVIDIA GeForce RTX 4070 Ti SUPER:
159.3  fps
NVIDIA GeForce RTX 4070 SUPER:
159.1  fps
ultra 1920x1080
NVIDIA GeForce RTX 4070 Ti SUPER:
144.2  fps
NVIDIA GeForce RTX 4070 SUPER:
135.5 142.3 ~ 139 fps
QHD 2560x1440
NVIDIA GeForce RTX 4070 Ti SUPER:
115.9  fps
NVIDIA GeForce RTX 4070 SUPER:
106 109.2 ~ 108 fps
4K 3840x2160
NVIDIA GeForce RTX 4070 Ti SUPER:
68.6  fps
NVIDIA GeForce RTX 4070 SUPER:
61.4 63.4 ~ 62 fps
med. 1920x1080
NVIDIA GeForce RTX 4070 Ti SUPER:
239  fps
NVIDIA GeForce RTX 4070 SUPER:
233  fps
high 1920x1080
NVIDIA GeForce RTX 4070 Ti SUPER:
231  fps
NVIDIA GeForce RTX 4070 SUPER:
216 226 ~ 221 fps
QHD 2560x1440
NVIDIA GeForce RTX 4070 Ti SUPER:
181  fps
NVIDIA GeForce RTX 4070 SUPER:
156.8 161.5 ~ 159 fps
4K 3840x2160
NVIDIA GeForce RTX 4070 Ti SUPER:
96.6  fps
NVIDIA GeForce RTX 4070 SUPER:
80.5 83.2 ~ 82 fps
low 1280x720
100%
GeForce RTX 2080 Super Max-Q:
148  fps
med. 1920x1080
100%
GeForce RTX 2080 Super Max-Q:
109  fps
high 1920x1080
100%
GeForce RTX 2080 Super Max-Q:
90  fps
ultra 1920x1080
100%
GeForce RTX 2080 Super Max-Q:
74 76 ~ 75 fps
low 1280x720
100%
GeForce RTX 2080 Super Max-Q:
139.8 166.1 ~ 153 fps
med. 1920x1080
100%
GeForce RTX 2080 Super Max-Q:
118.7 123.5 ~ 121 fps
high 1920x1080
100%
GeForce RTX 2080 Super Max-Q:
108.6 114.5 ~ 112 fps
ultra 1920x1080
100%
GeForce RTX 2080 Super Max-Q:
104.5 112.8 ~ 109 fps
F1 2020

F1 2020

2020
low 1280x720
100%
GeForce RTX 2080 Super Max-Q:
219 253 268 ~ 247 fps
med. 1920x1080
100%
GeForce RTX 2080 Super Max-Q:
167 174 184 ~ 175 fps
high 1920x1080
100%
GeForce RTX 2080 Super Max-Q:
149 150 161 ~ 153 fps
ultra 1920x1080
100%
GeForce RTX 2080 Super Max-Q:
102 115 118 119 126 ~ 116 fps
QHD 2560x1440
100%
GeForce RTX 2080 Super Max-Q:
89  fps
4K 3840x2160
100%
GeForce RTX 2080 Super Max-Q:
51  fps
low 1280x720
100%
GeForce RTX 2080 Super Max-Q:
188.8 210.4 267.4 ~ 222 fps
med. 1920x1080
100%
GeForce RTX 2080 Super Max-Q:
161.2 171.6 184.5 ~ 172 fps
high 1920x1080
100%
GeForce RTX 2080 Super Max-Q:
110.6 114 122.2 126.2 ~ 118 fps
ultra 1920x1080
100%
GeForce RTX 2080 Super Max-Q:
78.4 82.9 84.3 89.7 92.7 ~ 86 fps
QHD 2560x1440
100%
GeForce RTX 2080 Super Max-Q:
54 57.9 ~ 56 fps
4K 3840x2160
100%
GeForce RTX 2080 Super Max-Q:
28.1 30.3 ~ 29 fps
low 1280x720
100%
GeForce RTX 2080 Super Max-Q:
205 212.2 249 256 ~ 231 fps
med. 1920x1080
100%
GeForce RTX 2080 Super Max-Q:
164 165.1 167.6 168.3 176.6 ~ 168 fps
high 1920x1080
100%
GeForce RTX 2080 Super Max-Q:
147.1 147.9 150 154 156.7 ~ 151 fps
ultra 1920x1080
100%
GeForce RTX 2080 Super Max-Q:
140 144.4 147 152.1 155.1 163.7 165.2 177.7 ~ 156 fps
QHD 2560x1440
100%
GeForce RTX 2080 Super Max-Q:
108 116.7 131.2 ~ 119 fps
4K 3840x2160
100%
GeForce RTX 2080 Super Max-Q:
58 64 73.3 ~ 65 fps
low 1280x720
100%
GeForce RTX 2080 Super Max-Q:
207.4  fps
med. 1920x1080
100%
GeForce RTX 2080 Super Max-Q:
119 121.4 ~ 120 fps
high 1920x1080
100%
GeForce RTX 2080 Super Max-Q:
101 102 ~ 102 fps
QHD 2560x1440
100%
GeForce RTX 2080 Super Max-Q:
68.8  fps
4K 3840x2160
100%
GeForce RTX 2080 Super Max-Q:
32.4  fps
low 1280x720
100%
GeForce RTX 2080 Super Max-Q:
121  fps
med. 1920x1080
100%
GeForce RTX 2080 Super Max-Q:
121 121 ~ 121 fps
high 1920x1080
100%
GeForce RTX 2080 Super Max-Q:
120 121 ~ 121 fps
ultra 1920x1080
100%
GeForce RTX 2080 Super Max-Q:
119 120 ~ 120 fps
QHD 2560x1440
100%
GeForce RTX 2080 Super Max-Q:
83.1  fps
4K 3840x2160
100%
GeForce RTX 2080 Super Max-Q:
39.7  fps
low 1280x720
100%
GeForce RTX 2080 Super Max-Q:
113.3 131.4 138.4 ~ 128 fps
med. 1920x1080
100%
GeForce RTX 2080 Super Max-Q:
96.5 98 99.7 101.5 ~ 99 fps
high 1920x1080
100%
GeForce RTX 2080 Super Max-Q:
62.4 62.7 67.4 68.3 69 ~ 66 fps
ultra 1920x1080
100%
GeForce RTX 2080 Super Max-Q:
40.6 41 43.7 44.9 45 ~ 43 fps
QHD 2560x1440
100%
GeForce RTX 2080 Super Max-Q:
35 36.2 37 ~ 36 fps
4K 3840x2160
100%
GeForce RTX 2080 Super Max-Q:
21.5 23.5 23.8 ~ 23 fps
med. 1920x1080
100%
GeForce RTX 2080 Super Max-Q:
95.7 99.5 113.7 ~ 103 fps
high 1920x1080
100%
GeForce RTX 2080 Super Max-Q:
93.1 94.1 102 103.7 ~ 98 fps
ultra 1920x1080
100%
GeForce RTX 2080 Super Max-Q:
88.7 89.9 95.2 97.5 ~ 93 fps
QHD 2560x1440
100%
GeForce RTX 2080 Super Max-Q:
72.2 76.2 ~ 74 fps
4K 3840x2160
100%
GeForce RTX 2080 Super Max-Q:
36.8 42.7 ~ 40 fps
low 1280x720
100%
GeForce RTX 2080 Super Max-Q:
101.9  fps
med. 1920x1080
100%
GeForce RTX 2080 Super Max-Q:
92 93 ~ 93 fps
high 1920x1080
100%
GeForce RTX 2080 Super Max-Q:
84 86.6 ~ 85 fps
ultra 1920x1080
100%
GeForce RTX 2080 Super Max-Q:
76.9 83.3 ~ 80 fps
QHD 2560x1440
100%
GeForce RTX 2080 Super Max-Q:
66.9  fps
4K 3840x2160
100%
GeForce RTX 2080 Super Max-Q:
40.9  fps
low 1280x720
100%
GeForce RTX 2080 Super Max-Q:
165.5 172.3 ~ 169 fps
med. 1920x1080
100%
GeForce RTX 2080 Super Max-Q:
114.1 123.6 134 ~ 124 fps
high 1920x1080
100%
GeForce RTX 2080 Super Max-Q:
96.4 104.3 114 129 ~ 111 fps
ultra 1920x1080
100%
GeForce RTX 2080 Super Max-Q:
91.2 91.8 93.8 107 ~ 96 fps
QHD 2560x1440
100%
GeForce RTX 2080 Super Max-Q:
64.7 67.3 78.9 ~ 70 fps
4K 3840x2160
100%
GeForce RTX 2080 Super Max-Q:
36.3 36.8 44.5 ~ 39 fps
GRID 2019

GRID 2019

2019
low 1280x720
100%
GeForce RTX 2080 Super Max-Q:
174.8  fps
med. 1920x1080
100%
GeForce RTX 2080 Super Max-Q:
85.9 125 ~ 105 fps
high 1920x1080
100%
GeForce RTX 2080 Super Max-Q:
77.7 111 ~ 94 fps
ultra 1920x1080
100%
GeForce RTX 2080 Super Max-Q:
72 74 ~ 73 fps
QHD 2560x1440
100%
GeForce RTX 2080 Super Max-Q:
66.4  fps
4K 3840x2160
100%
GeForce RTX 2080 Super Max-Q:
46.9  fps
low 1280x720
100%
GeForce RTX 2080 Super Max-Q:
117 128 130 ~ 125 fps
med. 1920x1080
100%
GeForce RTX 2080 Super Max-Q:
93 95 96 102 ~ 97 fps
high 1920x1080
100%
GeForce RTX 2080 Super Max-Q:
86 87 88 92 ~ 88 fps
ultra 1920x1080
100%
GeForce RTX 2080 Super Max-Q:
65 65 66 70 ~ 67 fps
QHD 2560x1440
100%
GeForce RTX 2080 Super Max-Q:
49 53 ~ 51 fps
4K 3840x2160
100%
GeForce RTX 2080 Super Max-Q:
29 31 ~ 30 fps
FIFA 20

FIFA 20

2019
med. 1920x1080
100%
GeForce RTX 2080 Super Max-Q:
251  fps
high 1920x1080
100%
GeForce RTX 2080 Super Max-Q:
217 241 ~ 229 fps
ultra 1920x1080
100%
GeForce RTX 2080 Super Max-Q:
213 240 ~ 227 fps
QHD 2560x1440
100%
GeForce RTX 2080 Super Max-Q:
189 239 ~ 214 fps
4K 3840x2160
100%
GeForce RTX 2080 Super Max-Q:
114 190 ~ 152 fps
low 1280x720
100%
GeForce RTX 2080 Super Max-Q:
128.3 132.5 ~ 130 fps
med. 1920x1080
100%
GeForce RTX 2080 Super Max-Q:
101.6 105.7 107 ~ 105 fps
183%
NVIDIA GeForce RTX 4070 Ti SUPER:
192.1  fps
184%
NVIDIA GeForce RTX 4070 SUPER:
193.6  fps
high 1920x1080
100%
GeForce RTX 2080 Super Max-Q:
78.2 79.8 81.1 84.3 ~ 81 fps
218%
NVIDIA GeForce RTX 4070 Ti SUPER:
176.8  fps
225%
NVIDIA GeForce RTX 4070 SUPER:
179.3 184.2 ~ 182 fps
ultra 1920x1080
100%
GeForce RTX 2080 Super Max-Q:
62.5 63.5 68.1 71.6 ~ 66 fps
257%
NVIDIA GeForce RTX 4070 Ti SUPER:
169.6  fps
250%
NVIDIA GeForce RTX 4070 SUPER:
163.4 166.6 ~ 165 fps
QHD 2560x1440
100%
GeForce RTX 2080 Super Max-Q:
49.1 51.7 ~ 50 fps
287%
NVIDIA GeForce RTX 4070 Ti SUPER:
143.6  fps
256%
NVIDIA GeForce RTX 4070 SUPER:
125.4 131.2 ~ 128 fps
4K 3840x2160
100%
GeForce RTX 2080 Super Max-Q:
26.6 26.9 ~ 27 fps
294%
NVIDIA GeForce RTX 4070 Ti SUPER:
79.4  fps
252%
NVIDIA GeForce RTX 4070 SUPER:
66.2 68.9 ~ 68 fps
Control

Control

2019
low 1280x720
100%
GeForce RTX 2080 Super Max-Q:
221.7  fps
med. 1920x1080
100%
GeForce RTX 2080 Super Max-Q:
96.6 107 ~ 102 fps
222%
NVIDIA GeForce RTX 4070 Ti SUPER:
226  fps
220%
NVIDIA GeForce RTX 4070 SUPER:
224  fps
high 1920x1080
100%
GeForce RTX 2080 Super Max-Q:
71 71.1 79.8 ~ 74 fps
266%
NVIDIA GeForce RTX 4070 Ti SUPER:
196.9  fps
238%
NVIDIA GeForce RTX 4070 SUPER:
172.7 180.1 ~ 176 fps
QHD 2560x1440
100%
GeForce RTX 2080 Super Max-Q:
46.1 48.4 ~ 47 fps
277%
NVIDIA GeForce RTX 4070 Ti SUPER:
130.3  fps
243%
NVIDIA GeForce RTX 4070 SUPER:
112.6 115.5 ~ 114 fps
4K 3840x2160
100%
GeForce RTX 2080 Super Max-Q:
22 24.9 ~ 23 fps
289%
NVIDIA GeForce RTX 4070 Ti SUPER:
66.4  fps
252%
NVIDIA GeForce RTX 4070 SUPER:
57.4 58.2 ~ 58 fps
4K DLSS 3840x2160
NVIDIA GeForce RTX 4070 Ti SUPER:
78.9  fps
NVIDIA GeForce RTX 4070 SUPER:
67.1 69 ~ 68 fps
F1 2019

F1 2019

2019
low 1280x720
100%
GeForce RTX 2080 Super Max-Q:
205  fps
med. 1920x1080
100%
GeForce RTX 2080 Super Max-Q:
168 174 ~ 171 fps
high 1920x1080
100%
GeForce RTX 2080 Super Max-Q:
141 147 ~ 144 fps
ultra 1920x1080
100%
GeForce RTX 2080 Super Max-Q:
138 142 ~ 140 fps
QHD 2560x1440
100%
GeForce RTX 2080 Super Max-Q:
122  fps
4K 3840x2160
100%
GeForce RTX 2080 Super Max-Q:
74  fps
low 1280x720
100%
GeForce RTX 2080 Super Max-Q:
227.8 233 245.5 273.1 ~ 245 fps
med. 1920x1080
100%
GeForce RTX 2080 Super Max-Q:
123.8 127.8 136.4 142.4 ~ 133 fps
high 1920x1080
100%
GeForce RTX 2080 Super Max-Q:
83.8 86.5 88.5 95.4 ~ 89 fps
ultra 1920x1080
100%
GeForce RTX 2080 Super Max-Q:
61 62.5 64.1 69 ~ 64 fps
QHD 2560x1440
100%
GeForce RTX 2080 Super Max-Q:
39.9  fps
4K 3840x2160
100%
GeForce RTX 2080 Super Max-Q:
19.6  fps
Rage 2

Rage 2

2019
med. 1920x1080
100%
GeForce RTX 2080 Super Max-Q:
126  fps
high 1920x1080
100%
GeForce RTX 2080 Super Max-Q:
102 106 ~ 104 fps
ultra 1920x1080
100%
GeForce RTX 2080 Super Max-Q:
101 103 ~ 102 fps
QHD 2560x1440
100%
GeForce RTX 2080 Super Max-Q:
63.8 68.4 ~ 66 fps
4K 3840x2160
100%
GeForce RTX 2080 Super Max-Q:
30.9 34.1 ~ 33 fps
Anno 1800

Anno 1800

2019
low 1280x720
100%
GeForce RTX 2080 Super Max-Q:
159  fps
med. 1920x1080
100%
GeForce RTX 2080 Super Max-Q:
94 98.2 ~ 96 fps
high 1920x1080
100%
GeForce RTX 2080 Super Max-Q:
74.4 76.7 ~ 76 fps
ultra 1920x1080
100%
GeForce RTX 2080 Super Max-Q:
44.4 44.9 ~ 45 fps
QHD 2560x1440
100%
GeForce RTX 2080 Super Max-Q:
38.8  fps
4K 3840x2160
100%
GeForce RTX 2080 Super Max-Q:
23.2  fps
low 1280x720
100%
GeForce RTX 2080 Super Max-Q:
165  fps
med. 1920x1080
100%
GeForce RTX 2080 Super Max-Q:
117 129 ~ 123 fps
high 1920x1080
100%
GeForce RTX 2080 Super Max-Q:
96 112 ~ 104 fps
ultra 1920x1080
100%
GeForce RTX 2080 Super Max-Q:
73 80 ~ 77 fps
QHD 2560x1440
100%
GeForce RTX 2080 Super Max-Q:
59  fps
4K 3840x2160
100%
GeForce RTX 2080 Super Max-Q:
31  fps
low 1280x720
100%
GeForce RTX 2080 Super Max-Q:
252  fps
med. 1920x1080
100%
GeForce RTX 2080 Super Max-Q:
166 168.4 ~ 167 fps
high 1920x1080
100%
GeForce RTX 2080 Super Max-Q:
158.5 162 ~ 160 fps
ultra 1920x1080
100%
GeForce RTX 2080 Super Max-Q:
90 98.8 ~ 94 fps
QHD 2560x1440
100%
GeForce RTX 2080 Super Max-Q:
76.4  fps
med. 1920x1080
100%
GeForce RTX 2080 Super Max-Q:
103  fps
high 1920x1080
100%
GeForce RTX 2080 Super Max-Q:
97 98 ~ 98 fps
ultra 1920x1080
100%
GeForce RTX 2080 Super Max-Q:
87 92 ~ 90 fps
QHD 2560x1440
100%
GeForce RTX 2080 Super Max-Q:
71 78 ~ 75 fps
4K 3840x2160
100%
GeForce RTX 2080 Super Max-Q:
43 48 ~ 46 fps
low 1280x720
100%
GeForce RTX 2080 Super Max-Q:
131 143.3 ~ 137 fps
195%
NVIDIA GeForce RTX 4070 SUPER:
267  fps
med. 1920x1080
100%
GeForce RTX 2080 Super Max-Q:
93.2 96.2 101 ~ 97 fps
243%
NVIDIA GeForce RTX 4070 Ti SUPER:
236  fps
231%
NVIDIA GeForce RTX 4070 SUPER:
224  fps
high 1920x1080
100%
GeForce RTX 2080 Super Max-Q:
70.3 74.4 77.8 ~ 74 fps
261%
NVIDIA GeForce RTX 4070 Ti SUPER:
193.5  fps
246%
NVIDIA GeForce RTX 4070 SUPER:
178.8 186.1 ~ 182 fps
ultra 1920x1080
100%
GeForce RTX 2080 Super Max-Q:
57.2 59 63.4 ~ 60 fps
264%
NVIDIA GeForce RTX 4070 Ti SUPER:
158.3  fps
247%
NVIDIA GeForce RTX 4070 SUPER:
144.8 150.6 ~ 148 fps
QHD 2560x1440
100%
GeForce RTX 2080 Super Max-Q:
51.2  fps
256%
NVIDIA GeForce RTX 4070 Ti SUPER:
130.9  fps
230%
NVIDIA GeForce RTX 4070 SUPER:
116.1 120.8 ~ 118 fps
4K 3840x2160
100%
GeForce RTX 2080 Super Max-Q:
31.6  fps
267%
NVIDIA GeForce RTX 4070 Ti SUPER:
84.4  fps
234%
NVIDIA GeForce RTX 4070 SUPER:
72.8 76.1 ~ 74 fps
low 1280x720
100%
GeForce RTX 2080 Super Max-Q:
299  fps
med. 1920x1080
100%
GeForce RTX 2080 Super Max-Q:
194 196 ~ 195 fps
high 1920x1080
100%
GeForce RTX 2080 Super Max-Q:
148.8 165 ~ 157 fps
ultra 1920x1080
100%
GeForce RTX 2080 Super Max-Q:
147.6 163 ~ 155 fps
QHD 2560x1440
100%
GeForce RTX 2080 Super Max-Q:
118  fps
4K 3840x2160
100%
GeForce RTX 2080 Super Max-Q:
65  fps
med. 1920x1080
100%
GeForce RTX 2080 Super Max-Q:
152  fps
high 1920x1080
100%
GeForce RTX 2080 Super Max-Q:
113  fps
ultra 1920x1080
100%
GeForce RTX 2080 Super Max-Q:
105  fps
QHD 2560x1440
100%
GeForce RTX 2080 Super Max-Q:
73.9  fps
4K 3840x2160
100%
GeForce RTX 2080 Super Max-Q:
41.3  fps
med. 1920x1080
100%
GeForce RTX 2080 Super Max-Q:
112  fps
high 1920x1080
100%
GeForce RTX 2080 Super Max-Q:
109  fps
ultra 1920x1080
100%
GeForce RTX 2080 Super Max-Q:
103  fps
QHD 2560x1440
100%
GeForce RTX 2080 Super Max-Q:
82.1  fps
4K 3840x2160
100%
GeForce RTX 2080 Super Max-Q:
43.2  fps
low 1280x720
100%
GeForce RTX 2080 Super Max-Q:
154.3 173 ~ 164 fps
med. 1920x1080
100%
GeForce RTX 2080 Super Max-Q:
124.7 139 148 ~ 137 fps
high 1920x1080
100%
GeForce RTX 2080 Super Max-Q:
116.2 127 127 135 ~ 126 fps
ultra 1920x1080
100%
GeForce RTX 2080 Super Max-Q:
109.7 118 119 125 ~ 118 fps
QHD 2560x1440
100%
GeForce RTX 2080 Super Max-Q:
95.4 96.1 ~ 96 fps
4K 3840x2160
100%
GeForce RTX 2080 Super Max-Q:
52.6 58.7 ~ 56 fps
Hitman 2

Hitman 2

2018
med. 1920x1080
100%
GeForce RTX 2080 Super Max-Q:
86.7  fps
high 1920x1080
100%
GeForce RTX 2080 Super Max-Q:
78.6  fps
ultra 1920x1080
100%
GeForce RTX 2080 Super Max-Q:
77  fps
QHD 2560x1440
100%
GeForce RTX 2080 Super Max-Q:
76  fps
4K 3840x2160
100%
GeForce RTX 2080 Super Max-Q:
46.1  fps
low 1280x720
100%
GeForce RTX 2080 Super Max-Q:
102  fps
med. 1920x1080
100%
GeForce RTX 2080 Super Max-Q:
87 92 ~ 90 fps
high 1920x1080
100%
GeForce RTX 2080 Super Max-Q:
75 78 ~ 77 fps
ultra 1920x1080
100%
GeForce RTX 2080 Super Max-Q:
54 58 ~ 56 fps
QHD 2560x1440
100%
GeForce RTX 2080 Super Max-Q:
53  fps
4K 3840x2160
100%
GeForce RTX 2080 Super Max-Q:
32  fps
low 1280x720
100%
GeForce RTX 2080 Super Max-Q:
103 117 138 139 150 ~ 129 fps
med. 1920x1080
100%
GeForce RTX 2080 Super Max-Q:
95 104 109 111 116 120 ~ 109 fps
250%
NVIDIA GeForce RTX 4070 Ti SUPER:
273  fps
243%
NVIDIA GeForce RTX 4070 SUPER:
265  fps
high 1920x1080
100%
GeForce RTX 2080 Super Max-Q:
93 100 104 105 105 110 116 ~ 105 fps
256%
NVIDIA GeForce RTX 4070 Ti SUPER:
269  fps
247%
NVIDIA GeForce RTX 4070 SUPER:
257 260 ~ 259 fps
ultra 1920x1080
100%
GeForce RTX 2080 Super Max-Q:
89 91 92 92 93 96 97 99 103 106 ~ 96 fps
267%
NVIDIA GeForce RTX 4070 Ti SUPER:
256  fps
260%
NVIDIA GeForce RTX 4070 SUPER:
244 255 ~ 250 fps
QHD 2560x1440
100%
GeForce RTX 2080 Super Max-Q:
63 67 72 75 ~ 69 fps
297%
NVIDIA GeForce RTX 4070 Ti SUPER:
205  fps
257%
NVIDIA GeForce RTX 4070 SUPER:
165.3 188 ~ 177 fps
4K 3840x2160
100%
GeForce RTX 2080 Super Max-Q:
32 36 39 41 ~ 37 fps
296%
NVIDIA GeForce RTX 4070 Ti SUPER:
109.5  fps
254%
NVIDIA GeForce RTX 4070 SUPER:
91.5 96.7 ~ 94 fps
Strange Brigade

Strange Brigade

2018
low 1280x720
NVIDIA GeForce RTX 4070 Ti SUPER:
568  fps
NVIDIA GeForce RTX 4070 SUPER:
570 601 ~ 586 fps
med. 1920x1080
NVIDIA GeForce RTX 4070 Ti SUPER:
467  fps
NVIDIA GeForce RTX 4070 SUPER:
398 469 ~ 434 fps
high 1920x1080
NVIDIA GeForce RTX 4070 Ti SUPER:
442  fps
NVIDIA GeForce RTX 4070 SUPER:
418 437 ~ 428 fps
ultra 1920x1080
NVIDIA GeForce RTX 4070 Ti SUPER:
407  fps
NVIDIA GeForce RTX 4070 SUPER:
376 385 ~ 381 fps
QHD 2560x1440
NVIDIA GeForce RTX 4070 Ti SUPER:
306  fps
NVIDIA GeForce RTX 4070 SUPER:
260 270 ~ 265 fps
4K 3840x2160
NVIDIA GeForce RTX 4070 Ti SUPER:
161.9  fps
NVIDIA GeForce RTX 4070 SUPER:
130 134.7 ~ 132 fps
med. 1920x1080
100%
GeForce RTX 2080 Super Max-Q:
105  fps
high 1920x1080
100%
GeForce RTX 2080 Super Max-Q:
97.7  fps
ultra 1920x1080
100%
GeForce RTX 2080 Super Max-Q:
90  fps
QHD 2560x1440
100%
GeForce RTX 2080 Super Max-Q:
63.3  fps
4K 3840x2160
100%
GeForce RTX 2080 Super Max-Q:
31.9  fps
Far Cry 5

Far Cry 5

2018
low 1280x720
100%
GeForce RTX 2080 Super Max-Q:
111 143 154 ~ 136 fps
med. 1920x1080
100%
GeForce RTX 2080 Super Max-Q:
100 115 122 ~ 112 fps
181%
NVIDIA GeForce RTX 4070 Ti SUPER:
203  fps
181%
NVIDIA GeForce RTX 4070 SUPER:
203  fps
high 1920x1080
100%
GeForce RTX 2080 Super Max-Q:
96 108 116 ~ 107 fps
184%
NVIDIA GeForce RTX 4070 Ti SUPER:
197  fps
187%
NVIDIA GeForce RTX 4070 SUPER:
199 201 ~ 200 fps
ultra 1920x1080
100%
GeForce RTX 2080 Super Max-Q:
91 101 102 110 ~ 101 fps
186%
NVIDIA GeForce RTX 4070 Ti SUPER:
188  fps
188%
NVIDIA GeForce RTX 4070 SUPER:
188 191 ~ 190 fps
QHD 2560x1440
100%
GeForce RTX 2080 Super Max-Q:
77  fps
243%
NVIDIA GeForce RTX 4070 Ti SUPER:
187  fps
238%
NVIDIA GeForce RTX 4070 SUPER:
181 185 ~ 183 fps
4K 3840x2160
100%
GeForce RTX 2080 Super Max-Q:
42  fps
283%
NVIDIA GeForce RTX 4070 Ti SUPER:
119  fps
245%
NVIDIA GeForce RTX 4070 SUPER:
101 104 ~ 103 fps
low 1280x720
100%
GeForce RTX 2080 Super Max-Q:
102 107 109 113 114 114 ~ 110 fps
204%
NVIDIA GeForce RTX 4070 Ti SUPER:
224  fps
209%
NVIDIA GeForce RTX 4070 SUPER:
226 233 ~ 230 fps
med. 1920x1080
100%
GeForce RTX 2080 Super Max-Q:
90.9 93.4 95.8 97.6 99.8 104 ~ 97 fps
203%
NVIDIA GeForce RTX 4070 Ti SUPER:
196.7  fps
202%
NVIDIA GeForce RTX 4070 SUPER:
196.3 196.4 ~ 196 fps
high 1920x1080
100%
GeForce RTX 2080 Super Max-Q:
76.8 79.5 80.8 82.8 84.3 87.6 ~ 82 fps
183%
NVIDIA GeForce RTX 4070 Ti SUPER:
150  fps
185%
NVIDIA GeForce RTX 4070 SUPER:
151.9 152.4 ~ 152 fps
4K 3840x2160
100%
GeForce RTX 2080 Super Max-Q:
67  fps
191%
NVIDIA GeForce RTX 4070 Ti SUPER:
127.8  fps
194%
NVIDIA GeForce RTX 4070 SUPER:
129.1 131.7 ~ 130 fps
med. 1920x1080
100%
GeForce RTX 2080 Super Max-Q:
119  fps
high 1920x1080
100%
GeForce RTX 2080 Super Max-Q:
100  fps
ultra 1920x1080
100%
GeForce RTX 2080 Super Max-Q:
72  fps
QHD 2560x1440
100%
GeForce RTX 2080 Super Max-Q:
56.1  fps
4K 3840x2160
100%
GeForce RTX 2080 Super Max-Q:
31.9  fps
low 1280x720
NVIDIA GeForce RTX 4070 Ti SUPER:
235  fps
NVIDIA GeForce RTX 4070 SUPER:
235 244 ~ 240 fps
med. 1920x1080
100%
GeForce RTX 2080 Super Max-Q:
103  fps
228%
NVIDIA GeForce RTX 4070 Ti SUPER:
235  fps
228%
NVIDIA GeForce RTX 4070 SUPER:
234 235 ~ 235 fps
high 1920x1080
100%
GeForce RTX 2080 Super Max-Q:
67 80.8 ~ 74 fps
282%
NVIDIA GeForce RTX 4070 Ti SUPER:
209  fps
265%
NVIDIA GeForce RTX 4070 SUPER:
194 197.1 ~ 196 fps
QHD 2560x1440
NVIDIA GeForce RTX 4070 Ti SUPER:
168.8  fps
NVIDIA GeForce RTX 4070 SUPER:
148 150.5 ~ 149 fps
4K 3840x2160
100%
GeForce RTX 2080 Super Max-Q:
37.6  fps
263%
NVIDIA GeForce RTX 4070 Ti SUPER:
98.9  fps
226%
NVIDIA GeForce RTX 4070 SUPER:
84.8 85.2 ~ 85 fps
Fortnite

Fortnite

2018
med. 1920x1080
100%
GeForce RTX 2080 Super Max-Q:
121  fps
high 1920x1080
100%
GeForce RTX 2080 Super Max-Q:
114  fps
ultra 1920x1080
100%
GeForce RTX 2080 Super Max-Q:
99.5  fps
QHD 2560x1440
100%
GeForce RTX 2080 Super Max-Q:
80.3  fps
4K 3840x2160
100%
GeForce RTX 2080 Super Max-Q:
44.5  fps
low 1280x720
100%
GeForce RTX 2080 Super Max-Q:
134.3 146 146.6 147 155 156 ~ 147 fps
167%
NVIDIA GeForce RTX 4070 Ti SUPER:
245  fps
168%
NVIDIA GeForce RTX 4070 SUPER:
244 250 ~ 247 fps
med. 1366x768
100%
GeForce RTX 2080 Super Max-Q:
128.7 132 134 135.8 141 141 ~ 135 fps
169%
NVIDIA GeForce RTX 4070 Ti SUPER:
228  fps
170%
NVIDIA GeForce RTX 4070 SUPER:
228 229 ~ 229 fps
high 1920x1080
100%
GeForce RTX 2080 Super Max-Q:
117.4 122 123 124.2 134 139 ~ 127 fps
178%
NVIDIA GeForce RTX 4070 Ti SUPER:
226  fps
175%
NVIDIA GeForce RTX 4070 SUPER:
221 223 ~ 222 fps
ultra 1920x1080
100%
GeForce RTX 2080 Super Max-Q:
115 116 117.7 118 125 128 ~ 120 fps
168%
NVIDIA GeForce RTX 4070 Ti SUPER:
202  fps
174%
NVIDIA GeForce RTX 4070 SUPER:
208 209 ~ 209 fps
4K 3840x2160
100%
GeForce RTX 2080 Super Max-Q:
102  fps
199%
NVIDIA GeForce RTX 4070 Ti SUPER:
203  fps
193%
NVIDIA GeForce RTX 4070 SUPER:
192.9 202 ~ 197 fps
low 1024x768
100%
GeForce RTX 2080 Super Max-Q:
308.4 310.3 330.5 345 348.2 ~ 328 fps
med. 1366x768
100%
GeForce RTX 2080 Super Max-Q:
236 237 239.5 239.9 245 251.3 ~ 241 fps
232%
NVIDIA GeForce RTX 4070 Ti SUPER:
558  fps
235%
NVIDIA GeForce RTX 4070 SUPER:
566  fps
high 1920x1080
100%
GeForce RTX 2080 Super Max-Q:
138 142.7 143 143.4 153.2 159.8 160 ~ 149 fps
289%
NVIDIA GeForce RTX 4070 Ti SUPER:
430  fps
277%
NVIDIA GeForce RTX 4070 SUPER:
406 418 ~ 412 fps
ultra 1920x1080
100%
GeForce RTX 2080 Super Max-Q:
74.3 75.1 75.8 82.6 83.4 87.7 88.6 88.8 90.2 95.8 96 ~ 85 fps
247%
NVIDIA GeForce RTX 4070 Ti SUPER:
210  fps
236%
NVIDIA GeForce RTX 4070 SUPER:
191.9 210 ~ 201 fps
QHD 2560x1440
NVIDIA GeForce RTX 4070 Ti SUPER:
159.3  fps
NVIDIA GeForce RTX 4070 SUPER:
148.9 159.1 ~ 154 fps
4K 3840x2160
100%
GeForce RTX 2080 Super Max-Q:
49.8 53.5 54.3 58.2 ~ 54 fps
246%
NVIDIA GeForce RTX 4070 SUPER:
129.4 136.7 ~ 133 fps
GTA V

GTA V

2015
low 1024x768
100%
GeForce RTX 2080 Super Max-Q:
179 180 ~ 180 fps
104%
NVIDIA GeForce RTX 4070 Ti SUPER:
187.6  fps
104%
NVIDIA GeForce RTX 4070 SUPER:
187.7 188.3 ~ 188 fps
med. 1366x768
100%
GeForce RTX 2080 Super Max-Q:
172 174 ~ 173 fps
108%
NVIDIA GeForce RTX 4070 Ti SUPER:
187.6  fps
109%
NVIDIA GeForce RTX 4070 SUPER:
187.6 187.9 ~ 188 fps
high 1920x1080
100%
GeForce RTX 2080 Super Max-Q:
153 157 ~ 155 fps
121%
NVIDIA GeForce RTX 4070 Ti SUPER:
187.4  fps
121%
NVIDIA GeForce RTX 4070 SUPER:
186.9 186.9 ~ 187 fps
ultra 1920x1080
100%
GeForce RTX 2080 Super Max-Q:
85.3 85.8 ~ 86 fps
186%
NVIDIA GeForce RTX 4070 Ti SUPER:
160.1  fps
185%
NVIDIA GeForce RTX 4070 SUPER:
158.8 160 ~ 159 fps
QHD 2560x1440
NVIDIA GeForce RTX 4070 Ti SUPER:
155.3  fps
NVIDIA GeForce RTX 4070 SUPER:
147.2 148.2 ~ 148 fps
4K 3840x2160
100%
GeForce RTX 2080 Super Max-Q:
71.5  fps
255%
NVIDIA GeForce RTX 4070 Ti SUPER:
182.1  fps
232%
NVIDIA GeForce RTX 4070 SUPER:
164.6 166.6 ~ 166 fps
low 1280x720
100%
GeForce RTX 2080 Super Max-Q:
347.4 400 425.1 426.3 ~ 400 fps
med. 1366x768
100%
GeForce RTX 2080 Super Max-Q:
330.2 344.4 349.2 364.5 ~ 347 fps
high 1366x768
100%
GeForce RTX 2080 Super Max-Q:
300.5 319.9 323.7 324.2 ~ 317 fps
ultra 1920x1080
100%
GeForce RTX 2080 Super Max-Q:
170.2 173 173.1 181.1 ~ 174 fps

Average Gaming NVIDIA GeForce RTX 2080 Super Max-Q → 100%

Average Gaming 30-70 fps → 100%

Average Gaming NVIDIA GeForce RTX 4070 Ti SUPER → 227%

Average Gaming 30-70 fps → 289%

Average Gaming NVIDIA GeForce RTX 4070 SUPER → 216%

Average Gaming 30-70 fps → 252%

NVIDIA GeForce RTX 4070 Ti SUPERlowmed.highultraQHD4K
Avatar Frontiers of Pandora163141.8113.276.639.8
Call of Duty Modern Warfare 3 202322718417913384
Alan Wake 2124.7114.482.544.7
Assassin's Creed Mirage22120617013684
Cyberpunk 2077 2.1 Phantom Liberty188.5188.5170.8150.394.942.3
Baldur's Gate 3246223218157.8117.2
F1 23385402363138.29045.1
The Callisto Protocol210.62202.94149.39114.8270.04
F1 22371384336144.995.148.9
Ghostwire Tokyo27828228321799.2
Cyberpunk 2077 1.6196.9195.9172.3157.5103.649.7
Dying Light 2213162.2121.563.7
Far Cry 620919116915491
Watch Dogs Legion171.2159.3144.2115.968.6
Mafia Definitive Edition23923118196.6
Borderlands 3192.1176.8169.6143.679.4
Control226196.9130.366.4
Metro Exodus236193.5158.3130.984.4
Shadow of the Tomb Raider273269256205109.5
Strange Brigade568467442407306161.9
Far Cry 5203197188187119
X-Plane 11.11224196.7150127.8
Final Fantasy XV Benchmark235235209168.898.9
Dota 2 Reborn245228226202203
The Witcher 3558430210159.3
GTA V187.6187.6187.4160.1155.3182.1
< 30 fps
< 60 fps
< 120 fps
≥ 120 fps


9


26


1
25


1
19


8
16

6
15
4
NVIDIA GeForce RTX 4070 SUPERlowmed.highultraQHD4K
Avatar Frontiers of Pandora137.4126996534
Call of Duty Modern Warfare 3 202322618216611971
Alan Wake 2112.81107741
Assassin's Creed Mirage20519916312675
Cyberpunk 2077 2.1 Phantom Liberty186181.81591398739
Baldur's Gate 322820119914272
F1 233814023511248040
The Callisto Protocol207.9720915312176
F1 223723953311338643
Ghostwire Tokyo28528228519290
Cyberpunk 2077 1.6195.7184.11591449244
Dying Light 220115410954
Far Cry 620618815914381
Watch Dogs Legion169.2159.113910862
Mafia Definitive Edition23322115982
Borderlands 3193.618216512868
Control22417611458
Metro Exodus26722418214811874
Shadow of the Tomb Raider26525925017794
Strange Brigade586434428381265132
Far Cry 5203200190183103
X-Plane 11.11230196152130
Final Fantasy XV Benchmark24023519614985
Dota 2 Reborn247229222209197
The Witcher 3566412201154133
GTA V188188187159148166
< 30 fps
< 60 fps
< 120 fps
≥ 120 fps


10


1
25


1
25


1
19


11
13

8
13
5
NVIDIA GeForce RTX 2080 Super Max-Qlowmed.highultraQHD4K
Horizon Zero Dawn1481099075
Death Stranding153121112109
F1 20202471751531168951
Gears Tactics222172118865629
Doom Eternal23116815115611965
Hunt Showdown207.412010268.832.4
Escape from Tarkov12112112112083.139.7
Red Dead Redemption 21289966433623
Star Wars Jedi Fallen Order10398937440
Need for Speed Heat101.993858066.940.9
Call of Duty Modern Warfare 2019169124111967039
GRID 2019174.8105947366.446.9
Ghost Recon Breakpoint1259788675130
FIFA 20251229227214152
Borderlands 313010581665027
Control221.7102744723
F1 201920517114414012274
Total War: Three Kingdoms245133896439.919.6
Rage 21261041026633
Anno 180015996764538.823.2
The Division 2165123104775931
Dirt Rally 2.02521671609476.4
Far Cry New Dawn10398907546
Metro Exodus13797746051.231.6
Apex Legends29919515715511865
Just Cause 415211310573.941.3
Darksiders III11210910382.143.2
Battlefield V1641371261189656
Hitman 286.778.6777646.1
Assassin´s Creed Odyssey1029077565332
Shadow of the Tomb Raider129109105966937
Monster Hunter World10597.79063.331.9
Far Cry 51361121071017742
X-Plane 11.11110978267
Kingdom Come: Deliverance1191007256.131.9
Final Fantasy XV Benchmark1037437.6
Fortnite12111499.580.344.5
Dota 2 Reborn147135127120102
The Witcher 33282411498554
GTA V1801731558671.5
BioShock Infinite400347317174
< 30 fps
< 60 fps
< 120 fps
≥ 120 fps


3
27


20
21


29
12

3
27
7

11
20
2
6
24
6
1

Eine Liste mit weiteren Spielen und allen Grafikkarten finden Sie auf unserer Seite: Welches Spiel ist mit welcher Grafikkarte spielbar?

v1.28
log 20. 04:30:04

#0 ran 0s before starting gpusingle class +0s ... 0s

#1 checking url part for id 10305 +0s ... 0s

#2 checking url part for id 12305 +0s ... 0s

#3 checking url part for id 12293 +0s ... 0s

#4 redirected to Ajax server, took 1726799404s time from redirect:0 +0s ... 0s

#5 did not recreate cache, as it is less than 5 days old! Created at Thu, 19 Sep 2024 05:16:33 +0200 +0s ... 0s

#6 composed specs +0.032s ... 0.032s

#7 did output specs +0s ... 0.032s

#8 start showIntegratedCPUs +0s ... 0.032s

#9 getting avg benchmarks for device 10305 +0.029s ... 0.061s

#10 got single benchmarks 10305 +0.017s ... 0.078s

#11 getting avg benchmarks for device 12305 +0.004s ... 0.082s

#12 got single benchmarks 12305 +0.004s ... 0.087s

#13 getting avg benchmarks for device 12293 +0.004s ... 0.09s

#14 got single benchmarks 12293 +0.005s ... 0.095s

#15 got avg benchmarks for devices +0s ... 0.095s

#16 min, max, avg, median took s +0.038s ... 0.133s

#17 before gaming benchmark output +0s ... 0.133s

#18 Got 921 rows for game benchmarks. +0.067s ... 0.2s

#19 composed SQL query for gamebenchmarks +0s ... 0.2s

#20 got data and put it in $dataArray +0.004s ... 0.204s

#21 benchmarks composed for output. +0.022s ... 0.226s

#22 calculated avg scores. +0s ... 0.226s

#23 return log +0.001s ... 0.227s

Teilen Sie diesen Artikel, um uns zu unterstützen. Jeder Link hilft!
> Notebook Test, Laptop Test und News > Benchmarks / Technik > Benchmarks / Technik > Grafikkarten Vergleich - Head 2 Head
Autor: Klaus Hinum,  8.09.2017 (Update:  1.07.2023)