

NVIDIA GeForce RTX 2070 Super Mobile vs Intel Arc A770M vs Intel Arc A350M
NVIDIA GeForce RTX 2070 Super Mobile
► remove from comparison
Die Nvidia GeForce RTX 2070 Super Mobile (für Laptops) ist nach der mobilen RTX 2080 und 2080 Super die drittschnellste mobile Grafikkarte in 2020. Sie basiert auf die Desktop RTX 2070 Super jedoch werden die Shader wahrscheinlich deutlich niedriger getaktet.
Die GPU trägt den Codenamen N18-G2R (für Refresh) und schafft in ersten Benchmarks eine 10% höhere Leistung als die alte GeForce RTX 2070 Mobile.
Features
Der TU106-Chip wird in 12nm gefertigt und bietet eine Reihe neuer Features, wie DLSS (Deep Learning Super Sampling) und Real Time Ray Tracing. Dadurch lassen sich vor allem Beleuchtungseffekte sehr viel realistischer darstellen. Weiterhin gibt es Support für DisplayPort 1.4 (ready), HDMI 2.0b, HDR, Simultaneous Multi-Projection (SMP) sowie H.265 Video De- und Encoding (PlayReady 3.0).
Performance
Die Performance der mobilen GeForce RTX 2070 Super Mobile sollte etwas unterhalb der Desktop RTX 2070 liegen und in etwa auf dem Niveau der mobilen GTX 1080. Damit ordnet sich die RTX 2070 Super im absoluten High-End-Segment ein und kann die meisten Spiele des Jahres 2019 in hohen Einstellungen und 4K-Auflösung flüssig darstellen.
Der Stromverbrauch der normalen (Max-P) Notebook-Grafikkarte ist mit 115 Watt von Nvidia spezifiziert und damit 35 Watt höher als bei der Max-Q Version.
Intel Arc A770M
► remove from comparison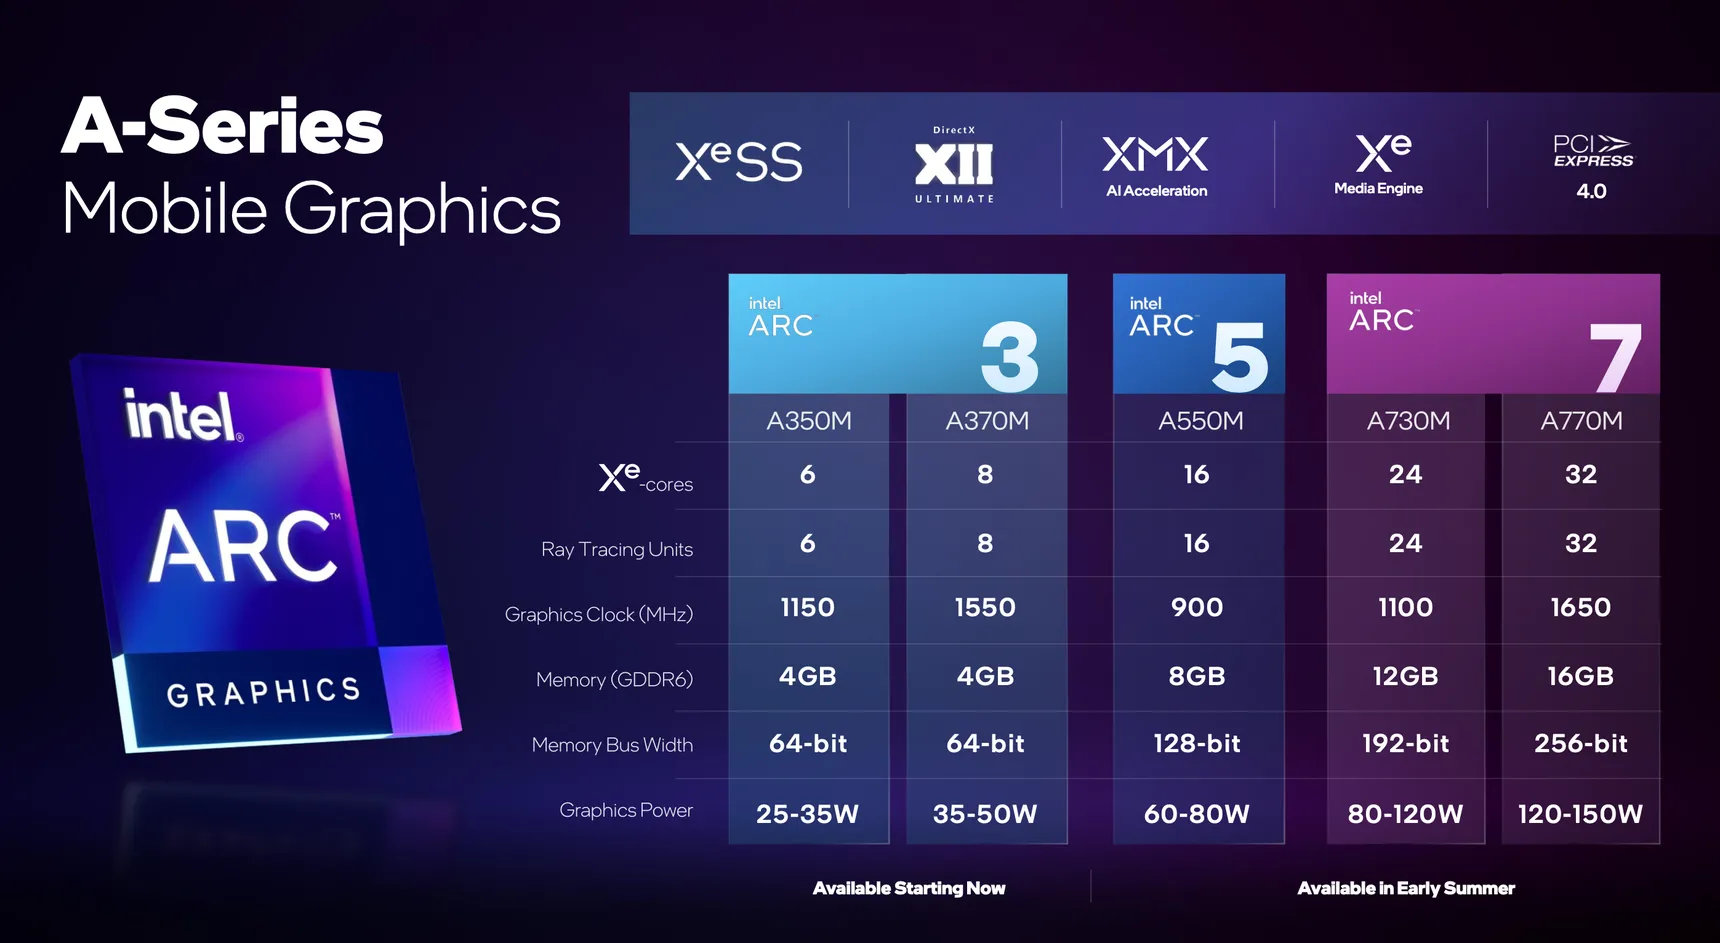
Die Intel Arc A770M (Device ID 5690) ist eine dedizierte Mittelklasse-Grafikkarte von Intel für Notebooks. Sie basiert auf dem ACM-G10 Chip und bietet alle 32 Xe-Kerne (512 ALUs), 32 Ray-Tracing-Units, 6 MB L1-Cache und 16 MB L2-Cache. Die Taktraten können von 300 MHz über 1650 MHz (Gaming) bis 2050 MHz (Turbo) rangieren. Das Speicherinterface ist 256 Bit breit und unterstützt 16 GB GDDR6 Grafikspeicher mit 16 Gbps. Der TGP ist zwischen 120 und 150 Watt je nach Modell.
Die Performance der A770M liegt in der oberen Mittelklasse von dedizierten Grafikkarten für Notebooks. Die genauen Leistungsdaten sind noch nicht ganz klar, der Stromverbrauch spielt, aber in der Klasse einer RTX 3070 und daher schätzen wir die Performance etwas darunter ein.
Der ACM-G10 Chip wird bei TSMC in 6 nm gefertigt (N6 Prozess), nutzt ein BGA2660 Interface (aufgelöstet), bietet 21,7 Mrd. Transistoren und ist 406 mm² groß. Er integriert zwei Media Engines für VP9, AVC, HEVC, AV1 8k60 12-Bit HDR Dekodierung und 8k 10-Bit HDR Enkodierung. Die integrierten 4 Display Pipes unterstützen 4x 4k120 HDR, HDMI 2.0B, DP 2.0 10G und Adaptive Sync.
Mittels Deep Link kann mit einer CPU der 12. Generation (Alder Lake) Dynamic Power Share genutzt werden.
Intel Arc A350M
► remove from comparisonDie Intel Arc A350M ist eine dedizierte Einstiegs-Grafikkarte von Intel für Notebooks. Sie basiert auf den ACM-G11 Chip und bietet 6 der 8 Xe-Kerne (96 ALUs), 6 der 8 Ray-Tracing-Units, 1,152 MB L1-Cache und 4MB L2-Cache. Das Speicherinterface ist 64 Bit breit und unterstützt 4GB GDDR6 Grafikspeicher mit 14 Gbps. Der TGP ist zwischen 25 und 35 Watt je nach Modell.
Die Performance sollte etwas oberhalb der älteren Intel Xe Max liegen (ebenfalls 96 ALUs) und dadurch in der Einstiegsklasse von dedizierten GPUs.
Der ACM-G11 Chip wird bei TSMC in 6nm gefertigt (N6 Prozess) und bietet 7,2 Mrd. Transistoren und ist 157 mm2 groß. Er integriert zwei Media Engines für VP9, AVC, HEVC, AV1 8k60 12-Bit HDR Dekodierung und 8k 10-Bit HDR Enkodierung. Die integrierten 4 Display Pipes unterstützen 4x 4k120 HDR, HDMI 2.0B, DP 2.0 10G und Adaptive Sync.
Mittels Deep Link kann mit einer CPU der 12. Generation (Alder Lake) Dynamic Power Share genutzt werden.
| NVIDIA GeForce RTX 2070 Super Mobile | Intel Arc A770M | Intel Arc A350M | ||||||||||||||||||||||||||||||||||||||||||||||||||||||||||||||||||||||||||||||||||||||||||||||||||||||||||||||||||||||||||||||||||||||||
| Arc Serie |
|
|
| |||||||||||||||||||||||||||||||||||||||||||||||||||||||||||||||||||||||||||||||||||||||||||||||||||||||||||||||||||||||||||||||||||||||
| Codename | N18E-G2R | Alchemist | Alchemist | |||||||||||||||||||||||||||||||||||||||||||||||||||||||||||||||||||||||||||||||||||||||||||||||||||||||||||||||||||||||||||||||||||||||
| Architektur | Turing | Xe HPG | Xe HPG | |||||||||||||||||||||||||||||||||||||||||||||||||||||||||||||||||||||||||||||||||||||||||||||||||||||||||||||||||||||||||||||||||||||||
| Pipelines | 2560 - unified | 4096 - unified | 6 - unified | |||||||||||||||||||||||||||||||||||||||||||||||||||||||||||||||||||||||||||||||||||||||||||||||||||||||||||||||||||||||||||||||||||||||
| Kerntakt | 1140 - 1380 (Boost) MHz | 1650 MHz | 1150 MHz | |||||||||||||||||||||||||||||||||||||||||||||||||||||||||||||||||||||||||||||||||||||||||||||||||||||||||||||||||||||||||||||||||||||||
| Speichertakt | 14002 MHz | 16000 MHz | 14000 MHz | |||||||||||||||||||||||||||||||||||||||||||||||||||||||||||||||||||||||||||||||||||||||||||||||||||||||||||||||||||||||||||||||||||||||
| Speicherbandbreite | 256 Bit | 256 Bit | 64 Bit | |||||||||||||||||||||||||||||||||||||||||||||||||||||||||||||||||||||||||||||||||||||||||||||||||||||||||||||||||||||||||||||||||||||||
| Speichertyp | GDDR6 | GDDR6 | GDDR6 | |||||||||||||||||||||||||||||||||||||||||||||||||||||||||||||||||||||||||||||||||||||||||||||||||||||||||||||||||||||||||||||||||||||||
| Max. Speichergröße | 8 GB | 16 GB | 4 GB | |||||||||||||||||||||||||||||||||||||||||||||||||||||||||||||||||||||||||||||||||||||||||||||||||||||||||||||||||||||||||||||||||||||||
| Shared Memory | nein | nein | nein | |||||||||||||||||||||||||||||||||||||||||||||||||||||||||||||||||||||||||||||||||||||||||||||||||||||||||||||||||||||||||||||||||||||||
| API | DirectX 12_1, OpenGL 4.6 | DirectX 12_2, OpenGL 4.6, Vulkan 1.3 | DirectX 12_2, OpenGL 4.6, Vulkan 1.3 | |||||||||||||||||||||||||||||||||||||||||||||||||||||||||||||||||||||||||||||||||||||||||||||||||||||||||||||||||||||||||||||||||||||||
| Stromverbrauch | 115 Watt | 150 Watt (120 - 150 Watt TGP) | 35 Watt (25 - 35 Watt TGP) | |||||||||||||||||||||||||||||||||||||||||||||||||||||||||||||||||||||||||||||||||||||||||||||||||||||||||||||||||||||||||||||||||||||||
| Herstellungsprozess | 12 nm | 6 nm | 6 nm | |||||||||||||||||||||||||||||||||||||||||||||||||||||||||||||||||||||||||||||||||||||||||||||||||||||||||||||||||||||||||||||||||||||||
| Features | DLSS, Raytraycing, VR Ready, G-SYNC, Vulkan, Multi Monitor, 550 Watt system power recommended | |||||||||||||||||||||||||||||||||||||||||||||||||||||||||||||||||||||||||||||||||||||||||||||||||||||||||||||||||||||||||||||||||||||||||
| Notebookgröße | groß (17" z.B.) | groß (17" z.B.) | ||||||||||||||||||||||||||||||||||||||||||||||||||||||||||||||||||||||||||||||||||||||||||||||||||||||||||||||||||||||||||||||||||||||||
| Erscheinungsdatum | 02.04.2020 | 30.03.2022 | 30.03.2022 | |||||||||||||||||||||||||||||||||||||||||||||||||||||||||||||||||||||||||||||||||||||||||||||||||||||||||||||||||||||||||||||||||||||||
| Raytracing Cores | 32 | 6 | ||||||||||||||||||||||||||||||||||||||||||||||||||||||||||||||||||||||||||||||||||||||||||||||||||||||||||||||||||||||||||||||||||||||||
| Cache | L1: 6 MB, L2: 16 MB | L1: 1.1 MB, L2: 4 MB | ||||||||||||||||||||||||||||||||||||||||||||||||||||||||||||||||||||||||||||||||||||||||||||||||||||||||||||||||||||||||||||||||||||||||
| Memory Bandwidth | 512 GB/s | 112 GB/s | ||||||||||||||||||||||||||||||||||||||||||||||||||||||||||||||||||||||||||||||||||||||||||||||||||||||||||||||||||||||||||||||||||||||||
| Transistors | 21.7 Billion | 7.2 Billion | ||||||||||||||||||||||||||||||||||||||||||||||||||||||||||||||||||||||||||||||||||||||||||||||||||||||||||||||||||||||||||||||||||||||||
| Die Size | 406 mm² | 157 mm² | ||||||||||||||||||||||||||||||||||||||||||||||||||||||||||||||||||||||||||||||||||||||||||||||||||||||||||||||||||||||||||||||||||||||||
| PCIe | 4 16x | 4 8x | ||||||||||||||||||||||||||||||||||||||||||||||||||||||||||||||||||||||||||||||||||||||||||||||||||||||||||||||||||||||||||||||||||||||||
| Displays | 4 Displays (max.), HDMI 2.0b, DisplayPort 2.0 10G Ready | 4 Displays (max.), HDMI 2.0b, DisplayPort 2.0 10G Ready | ||||||||||||||||||||||||||||||||||||||||||||||||||||||||||||||||||||||||||||||||||||||||||||||||||||||||||||||||||||||||||||||||||||||||
| Herstellerseite | ark.intel.com | ark.intel.com |
Benchmarks

3DM Vant. Perf. total + NVIDIA GeForce RTX 2070 Super Mobile
specvp12 sw-03 + Intel Arc A770M
Cinebench R15 OpenGL 64 Bit + NVIDIA GeForce RTX 2070 Super Mobile
GFXBench T-Rex HD Offscreen C24Z16 + Intel Arc A350M
Average Benchmarks NVIDIA GeForce RTX 2070 Super Mobile → 100% n=23
Average Benchmarks Intel Arc A770M → 107% n=23
Average Benchmarks Intel Arc A350M → 45% n=23
* Smaller numbers mean a higher performance
1 This benchmark is not used for the average calculation
Spiele-Benchmarks
Die folgenden Benchmarks basieren auf unseren Spieletests mit Testnotebooks. Die Performance dieser Grafikkarte bei den gelisteten Spielen ist abhängig von der verwendeten CPU, Speicherausstattung, Treiber und auch Betriebssystem. Dadurch müssen die untenstehenden Werte nicht repräsentativ sein. Detaillierte Informationen über das verwendete System sehen Sie nach einem Klick auf den fps-Wert.

Star Wars Outlaws
2024
Black Myth: Wukong
2024
F1 24
2024

Helldivers 2
2024

The Finals
2023
Total War Pharaoh
2023
EA Sports FC 24
2023
Counter-Strike 2
2023

Baldur's Gate 3
2023
Hogwarts Legacy
2023
Dead Space Remake
2023
The Witcher 3 v4.00
2023
High On Life
2023


The Quarry
2022
F1 22
2022
Vampire Bloodhunt
2022
Ghostwire Tokyo
2022

Cyberpunk 2077 1.6
2022
GRID Legends
2022
Elden Ring
2022
Dying Light 2
2022

God of War
2022
Farming Simulator 22
2021
Forza Horizon 5
2021
Riders Republic
2021

Back 4 Blood
2021
Far Cry 6
2021
New World
2021
F1 2021
2021
Yakuza Like a Dragon
2020


Dirt 5
2020
Watch Dogs Legion
2020
Star Wars Squadrons
2020

Serious Sam 4
2020

Horizon Zero Dawn
2020
Death Stranding
2020
F1 2020
2020
Gears Tactics
2020
Doom Eternal
2020
Hunt Showdown
2020
Escape from Tarkov
2020


Need for Speed Heat
2019

GRID 2019
2019

FIFA 20
2019
Borderlands 3
2019
Control
2019
F1 2019
2019
Rage 2
2019
Anno 1800
2019
The Division 2
2019
Dirt Rally 2.0
2019
Far Cry New Dawn
2019
Metro Exodus
2019
Apex Legends
2019
Just Cause 4
2018
Darksiders III
2018
Battlefield V
2018
Hitman 2
2018


Strange Brigade
2018
Monster Hunter World
2018
Far Cry 5
2018
X-Plane 11.11
2018


Fortnite
2018Dota 2 Reborn
2015
The Witcher 3
2015
GTA V
2015BioShock Infinite
2013Average Gaming NVIDIA GeForce RTX 2070 Super Mobile → 100%
Average Gaming 30-70 fps → 100%
Average Gaming Intel Arc A770M → 88%
Average Gaming 30-70 fps → 85%
Average Gaming Intel Arc A350M → 37%
Average Gaming 30-70 fps → 37%
| Intel Arc A770M | low | med. | high | ultra | QHD | 4K |
|---|---|---|---|---|---|---|
| Star Wars Outlaws | 42.8 | 40.9 | 35.1 | 29.5 | ||
| Black Myth: Wukong | 56 | 42 | 32 | 19 | 15 | |
| F1 24 | 229 | 196.4 | 151.3 | 49.1 | ||
| Senua's Saga Hellblade 2 | 34.2 | 27.3 | 19.9 | |||
| Helldivers 2 | 96.2 | 73.7 | 32.3 | |||
| Palworld | 61.7 | 46.6 | ||||
| The Finals | 106 | 69.6 | ||||
| Total War Pharaoh | 67.3 | |||||
| EA Sports FC 24 | 116.9 | |||||
| Counter-Strike 2 | 79.2 | |||||
| Cyberpunk 2077 2.1 Phantom Liberty | 97.1 | 78.8 | 65 | 43.1 | 20.7 | |
| Baldur's Gate 3 | 88.9 | 60.6 | 31.7 | |||
| Hogwarts Legacy | 51.9 | 52.5 | 55.1 | 51.9 | 39.1 | 22.2 |
| Dead Space Remake | 42.2 | 49.2 | 46.2 | 54.1 | 24.4 | 15.8 |
| The Witcher 3 v4.00 | 143.7 | 125.1 | 111.3 | 99.2 | 44.1 | |
| High On Life | 178.5 | 126.5 | 99.7 | 80.9 | 52.9 | 24.9 |
| The Callisto Protocol | 122.5 | 90.6 | 64.1 | 64 | 47.5 | 28.1 |
| Spider-Man Miles Morales | 102.8 | 100 | 90 | 86.4 | 67.7 | 38.3 |
| Call of Duty Modern Warfare 2 2022 | 95 | 86 | 71 | 68 | 51 | 32 |
| Uncharted Legacy of Thieves Collection | 43.4 | 40.8 | 44.2 | 43.4 | 41.1 | |
| A Plague Tale Requiem | 79.3 | 71.5 | 55 | 42.1 | 31.9 | 18.6 |
| The Quarry | 108 | 84.9 | 69.3 | 52.9 | 35.9 | 18.8 |
| F1 22 | 181.5 | 166 | 131 | 42 | 27.8 | 14.6 |
| Tiny Tina's Wonderlands | 192.2 | 138.5 | 95.1 | 76.8 | 52.4 | 27.4 |
| Cyberpunk 2077 1.6 | 112.5 | 95.3 | 77 | 66.5 | 44 | 21.6 |
| GRID Legends | 143.1 | 117.9 | 95.9 | 81.2 | 74.5 | 71.9 |
| Elden Ring | 57.7 | 40.8 | ||||
| God of War | 62.1 | 62.3 | 59.3 | 47.3 | 26.8 | |
| Guardians of the Galaxy | 124 | 112 | 110 | 105 | 79 | 45 |
| Far Cry 6 | 143.2 | 119.9 | 103.3 | 88 | 67.7 | 40.2 |
| New World | 101.9 | 84.2 | 77.6 | 74.8 | 35.2 | |
| F1 2021 | 355 | 285 | 227 | 106.4 | 75.9 | 43.6 |
| Death Stranding | 140.6 | 123.7 | 116.6 | 113.7 | 85.7 | 49.4 |
| F1 2020 | 249 | 175.9 | 149.9 | 104.5 | 81.6 | 53.1 |
| Borderlands 3 | 99.4 | 87 | 78.9 | 69.2 | 53.5 | 29.1 |
| Far Cry New Dawn | 115 | 100 | 95 | 85 | 50 | |
| Metro Exodus | 155.1 | 123.8 | 85.1 | 69.6 | 56.5 | 37 |
| Shadow of the Tomb Raider | 100.9 | 74.2 | 73 | 68.5 | 57.6 | 38.6 |
| Strange Brigade | 439 | 256 | 211 | 178.7 | 74.3 | |
| Far Cry 5 | 127 | 106 | 99 | 95 | 81 | 45 |
| X-Plane 11.11 | 67.5 | 59.4 | 55.5 | 38.5 | ||
| Final Fantasy XV Benchmark | 132.4 | 91.3 | 50.7 | 41.6 | 28.6 | |
| Dota 2 Reborn | 110.1 | 96.3 | 104 | 101.7 | 85.9 | |
| The Witcher 3 | 274.7 | 172.7 | 50.7 | 61.5 | ||
| GTA V | 174.5 | 165.6 | 119.4 | 53.3 | 45.2 | |
| < 30 fps < 60 fps < 120 fps ≥ 120 fps | 5 13 18 | 7 18 11 | 1 9 20 6 | 2 10 25 1 | 4 16 14 | 13 18 4 |
| Intel Arc A350M | low | med. | high | ultra | QHD | 4K |
|---|---|---|---|---|---|---|
| Hogwarts Legacy | 37.5 | 25 | 19.8 | 15.3 | 10.1 | 2.96 |
| The Witcher 3 v4.00 | 56.3 | 42.6 | 36.1 | 29.7 | 20.4 | |
| High On Life | 71.9 | 42.6 | 38.2 | 27.8 | 18.8 | 4.36 |
| The Callisto Protocol | 42.1 | 28.3 | 12.3 | 13.9 | 8.3 | 3.1 |
| Spider-Man Miles Morales | 41.5 | 33.2 | 25.4 | 20.4 | 14.7 | 7.22 |
| Call of Duty Modern Warfare 2 2022 | 41 | 37 | 23 | 12 | 7 | 6 |
| A Plague Tale Requiem | 29.9 | 24.3 | 20 | 15 | 6.4 | |
| F1 22 | 52.1 | 51.4 | 35.5 | |||
| Vampire Bloodhunt | 80.6 | 64.7 | 54.9 | 49.9 | 30.6 | 10.8 |
| Ghostwire Tokyo | 32.2 | 30.6 | 29.6 | 29.2 | ||
| Cyberpunk 2077 1.6 | 27.4 | 18.5 | 16.2 | 11.6 | ||
| GRID Legends | 78 | 56 | 41 | 28 | ||
| Dying Light 2 | 26.7 | 21.9 | 17.8 | |||
| Rainbow Six Extraction | 68 | 52 | 45 | 30 | 17 | 2.6 |
| God of War | 22 | 18 | 15 | 11 | ||
| Farming Simulator 22 | 121 | 63 | 47 | 43 | ||
| Forza Horizon 5 | 108 | 50 | 47 | 11 | 9 | 6 |
| Riders Republic | 60 | 32 | 25 | 21 | 12 | 7 |
| Back 4 Blood | 139.3 | 60.2 | 48.1 | 46 | 31 | 14.9 |
| F1 2021 | 166.6 | 63.8 | 52.2 | 21.1 | ||
| Assassin´s Creed Valhalla | 65 | 35 | 20 | 16 | 14 | |
| Flight Simulator 2020 | 43.1 | |||||
| Doom Eternal | 113.4 | 55.6 | ||||
| The Division 2 | 92 | 46 | 37 | 27 | 17 | 7 |
| Strange Brigade | 151 | 66 | 53 | 45 | 36.6 | 19 |
| Far Cry 5 | 77 | 42 | 39 | 37 | 25 | 12 |
| X-Plane 11.11 | 39 | 31 | 27 | 19.6 | ||
| Final Fantasy XV Benchmark | 62 | 32 | 19 | 13.6 | 7 | |
| Dota 2 Reborn | 103 | 85 | 62 | 59 | ||
| The Witcher 3 | 130 | 80 | 43 | 19 | 15.1 | |
| GTA V | 153 | 133 | 37 | 15 | 10.1 | 11.1 |
| < 30 fps < 60 fps < 120 fps ≥ 120 fps | 4 9 12 6 | 6 16 7 1 | 13 15 1 | 17 7 | 15 3 | 18 |
| NVIDIA GeForce RTX 2070 Super Mobile | low | med. | high | ultra | QHD | 4K |
|---|---|---|---|---|---|---|
| Yakuza Like a Dragon | 156 | 105.4 | 104.1 | 92.2 | 61 | 31.4 |
| Call of Duty Black Ops Cold War | 191 | 100.5 | 93.8 | 85.1 | 60.6 | 35.3 |
| Assassin´s Creed Valhalla | 122 | 83 | 71 | 71 | ||
| Dirt 5 | 161 | 93 | 76 | 59 | 52.3 | 34.9 |
| Watch Dogs Legion | 112 | 104 | 91 | 61 | 44 | 25 |
| Star Wars Squadrons | 263.1 | 224.6 | 211.5 | 202.4 | ||
| Mafia Definitive Edition | 137 | 101 | 94 | |||
| Serious Sam 4 | 130 | 97 | 85 | 76 | 63.7 | 39.8 |
| Flight Simulator 2020 | 69 | 60 | 51 | 41 | ||
| Horizon Zero Dawn | 146 | 118 | 105 | 85 | ||
| Death Stranding | 141 | 129 | 118 | 120 | 81.3 | 46.9 |
| F1 2020 | 227 | 168 | 147 | 121 | ||
| Gears Tactics | 249.1 | 194 | 133 | 97 | 64.5 | 33.3 |
| Doom Eternal | 227 | 178 | 162 | 166 | 118 | 61.6 |
| Hunt Showdown | 136 | 113 | 74 | 34.1 | ||
| Escape from Tarkov | 121 | 121 | 121 | 81 | 41.4 | |
| Red Dead Redemption 2 | 110 | 73.1 | 47.6 | 38.1 | 24.8 | |
| Star Wars Jedi Fallen Order | 119 | 114 | 108 | 84 | 42.5 | |
| Need for Speed Heat | 105 | 97 | 92.4 | 81.7 | 48.1 | |
| Call of Duty Modern Warfare 2019 | 141 | 134 | 107 | 75.3 | 41.6 | |
| GRID 2019 | 160 | 119 | 80.7 | 70.2 | 47.2 | |
| Ghost Recon Breakpoint | 115 | 101 | 75 | 55 | 32 | |
| FIFA 20 | 280 | 267 | 264 | 262 | 211 | |
| Borderlands 3 | 127 | 92.1 | 70.6 | 49.8 | 26.8 | |
| Control | 107 | 80.8 | 52.6 | 25.6 | ||
| F1 2019 | 203 | 178 | 170 | 116 | 73 | |
| Rage 2 | 143 | 121 | 119 | 74.2 | 36.7 | |
| Anno 1800 | 116 | 90.4 | 51 | 44 | 23.9 | |
| The Division 2 | 150 | 124 | 87 | 61 | 32 | |
| Dirt Rally 2.0 | 211 | 178 | 97.7 | 72.4 | ||
| Far Cry New Dawn | 111 | 104 | 94 | 89 | 50 | |
| Metro Exodus | 112 | 82.7 | 65.5 | 54.4 | 31.9 | |
| Apex Legends | 144 | 144 | 144 | 121 | 66.6 | |
| Just Cause 4 | 162 | 119 | 105 | 75 | 41.2 | |
| Darksiders III | 166 | 141 | 127 | 88.3 | 44 | |
| Battlefield V | 166 | 152 | 141 | 110 | 62.7 | |
| Hitman 2 | 98.8 | 89.7 | 82.5 | 78.8 | 46.4 | |
| Assassin´s Creed Odyssey | 104 | 90 | 63 | 56 | 36 | |
| Shadow of the Tomb Raider | 137 | 118 | 113 | 104 | 73 | 37 |
| Monster Hunter World | 130 | 120 | 98.9 | 63.9 | 32.1 | |
| Far Cry 5 | 105 | |||||
| X-Plane 11.11 | 114 | 99 | 84 | |||
| Kingdom Come: Deliverance | 146 | 119 | 82.5 | 59.7 | 31.1 | |
| Final Fantasy XV Benchmark | 121 | 85 | 37.7 | |||
| Fortnite | 164 | 156 | 129 | 93.4 | 47.9 | |
| Dota 2 Reborn | 155 | 140 | 127 | 120 | ||
| The Witcher 3 | 330 | 255 | 163 | 87 | 59 | |
| GTA V | 182 | 177 | 163 | 94 | ||
| BioShock Infinite | 371.8 | 308.3 | 299 | 173.4 | ||
| < 30 fps < 60 fps < 120 fps ≥ 120 fps | 3 17 | 21 27 | 1 27 20 | 4 27 13 | 10 24 2 | 5 27 4 1 |
Eine Liste mit weiteren Spielen und allen Grafikkarten finden Sie auf unserer Seite: Welches Spiel ist mit welcher Grafikkarte spielbar?