Notebookcheck Logo

NVIDIA GeForce RTX 2070 Super Max-Q vs NVIDIA GeForce RTX 3050 A Laptop GPU vs NVIDIA GeForce RTX 3090 Ti

NVIDIA GeForce RTX 2070 Super Max-Q

► remove from comparison NVIDIA GeForce RTX 2070 Super Max-Q

Die Nvidia GeForce RTX 2070 Super Max-Q (für Laptops) ist die Stromsparversion der mobilen GeForce RTX 2070 Super. Sie basiert auf den selben TU104-725-A1 Chip mit 2560 Shader, jedoch bei deutlich reduzierten Taktraten und Stromverbrauch. Es gibt drei Varianten mit einem TGP (Stromverbrauch des Chips) von 80, 85 und 90 Watt. Die Taktung ranginert von 930 - 1080 MHz für den Basistakt und 1155 - 1290 MHz im Boost. Die normale 2070 Super Mobile taktet mit 1140 - 1380 MHz bis zu 23% höher, die gleichnamige Desktop-Version ist nochmals schneller getaktet. Die GPU trägt den Codenamen N18E-G2R-A1 (für Refresh).

Mit dem Refresh wurden die Max-Q Technologien überarbeitet und bieten nun neben einer verbesserten Effizienz durch (neue Spannungswandler, Low-Power-GDDR6) auch zwei optionale Features. Der Notebookhersteller kann Dynamic Boost implementieren um Strom von der CPU zur GPU zu verlagern (TDP in 5 Watt Schritten). Weiters gibt es einen neuen "Dynamic Display Switch" für Advanced Optimus der G-SYNC und bis zu 4K 120 Hz ermöglichen.

Features

Der TU104-Chip wird in 12nm gefertigt und bietet eine Reihe neuer Features, wie DLSS (Deep Learning Super Sampling) und Real Time Ray Tracing. Dadurch lassen sich vor allem Beleuchtungseffekte sehr viel realistischer darstellen. Weiterhin gibt es Support für DisplayPort 1.4 (ready), HDMI 2.0b, HDR, Simultaneous Multi-Projection (SMP) sowie H.265 Video De- und Encoding (PlayReady 3.0). 

Performance

Die Performance der mobilen GeForce RTX 2070 Super Max-Q sollte sich zwischen den alten RTX 2070 Max-Q und RTX 2070 Mobile GPUs einordnen und ist damit im im High-End-Segment und kann die meisten Spiele des Jahres 2019 in hohen Einstellungen und 4K-Auflösung flüssig darstellen.

Durch den verringerten Stromverbrauch von 80 - 90 Watt TGP eignet sich die RTX 2070 Super Max-Q auch für dünnere Gaming-Notebooks.

NVIDIA GeForce RTX 3050 A Laptop GPU

► remove from comparison NVIDIA GeForce RTX 3050 A Laptop GPU

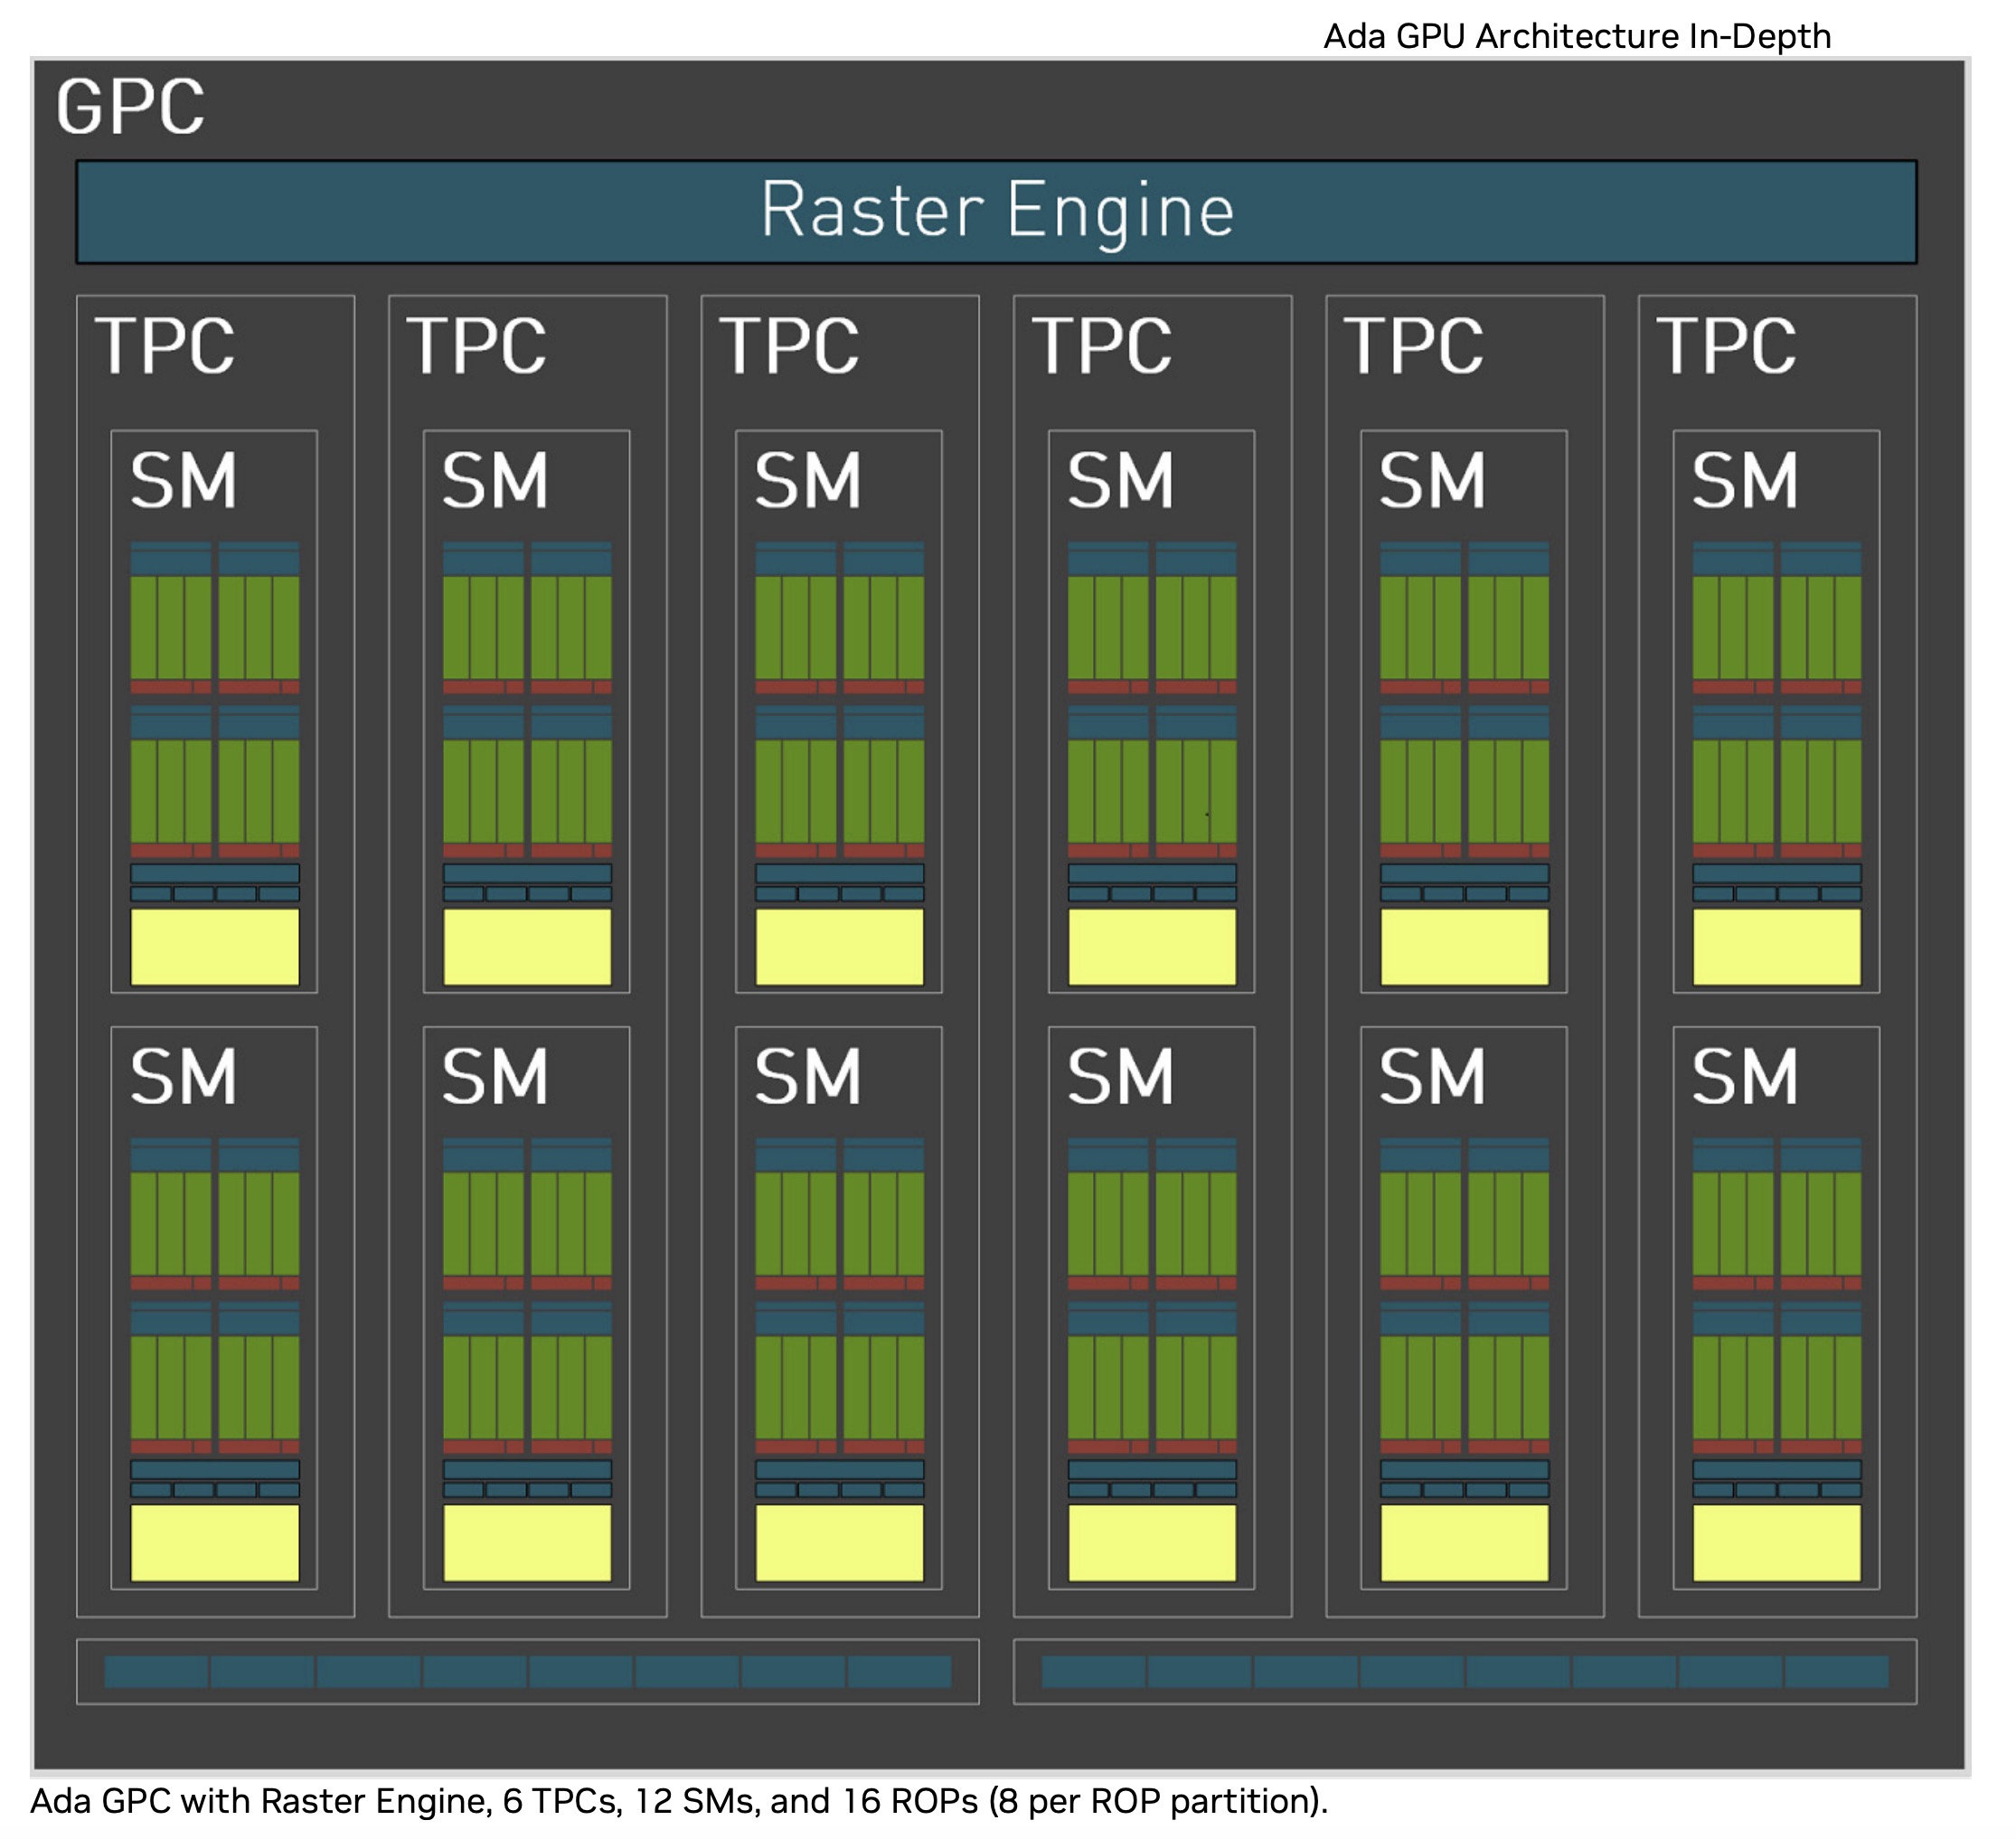
Die Nvidia GeForce RTX 3050 A Laptop GPU (oder Mobile) ist eine neue Variante basierend auf die aktuelle Ada Lovelace Architektur (im Vergleich zu Ampere bei den anderen RTX 3050 Laptop GPUs). Sie nutzt den AD106 Chip der RTX 4060 oder AD107 der RTX 4050, jedoch mit deutlich verringerter Kernanzahl und Speicherbus. Die RTX 3050 A bietet nur 1.792 GPU Kerne (CUDA Cores) und ein 4GB GDDR6 Grafikspeicher der nur mit 64-Bit angebunden ist. Nach aktuellen Informationen ist die 3050 A zum Launch nur für den Indischen Markt gedacht.

Durch die geringe Kernanzahl und den kleinen Speicherbus, sollte die Performance nicht deutlich überhalb der alten RTX 3050 4GB Laptop GPU liegen.

Der AD106 Chip wird bei TSMC im 5nm (4N) Verfahren gefertigt und ist dadurch deutlich effizienter als der alte Ampere Chip der RTX 3050 4GB. Der TGP kann vom Notebookhersteller zwischen 35 und 50 Watt gewählt werden (System Power).

NVIDIA GeForce RTX 3090 Ti

► remove from comparison NVIDIA NVIDIA GeForce RTX 3090 Ti

Die Nvidia GeForce RTX 3090 Ti is zum Launch Anfang 2022 die schnellste GeForce Grafikkarte der Ampere-Generation. Sie nutzt den großen GA102-Chip mit 10.752 Shader und 24 GB GDDR6X Grafikspeicher.

Mit einer Leistungsaufnahme von 450 Watt braucht die GPU zwar sehr viel Strom unter Last, die Energieeffizienz ist jedoch trotzdem sehr gut (Leistung pro Watt).

NVIDIA GeForce RTX 2070 Super Max-QNVIDIA GeForce RTX 3050 A Laptop GPUNVIDIA GeForce RTX 3090 Ti
GeForce RTX 3000 Serie
NVIDIA Titan RTX 4608 @ 1.35 - 1.77 GHz384 Bit @ 14000 MHz
GeForce RTX 2080 Ti (Desktop) 4352 @ 1.35 - 1.55 GHz352 Bit @ 14000 MHz
GeForce RTX 2080 Super (Desktop) 3072 @ 1.65 - 1.82 GHz256 Bit @ 15500 MHz
GeForce RTX 2080 (Desktop) 2944 @ 1.52 - 1.71 GHz256 Bit @ 14000 MHz
GeForce RTX 2080 Super Mobile 3072 @ 1.37 - 1.56 GHz256 Bit @ 14000 MHz
GeForce RTX 2080 Mobile 2944 @ 1.38 - 1.59 GHz256 Bit @ 14000 MHz
GeForce RTX 2070 Super (Desktop) 2560 @ 1.61 - 1.77 GHz256 Bit @ 14000 MHz
GeForce RTX 2070 (Desktop) 2304 @ 1.41 - 1.62 GHz256 Bit @ 14000 MHz
GeForce RTX 2070 Super Mobile 2560 @ 1.14 - 1.38 GHz256 Bit @ 14002 MHz
GeForce RTX 2080 Super Max-Q 3072 @ 0.98 - 1.23 GHz256 Bit @ 11000 MHz
GeForce RTX 2060 Super (Desktop) 2176 @ 1.47 - 1.65 GHz256 Bit @ 14000 MHz
GeForce RTX 2070 Mobile 2304 @ 1.22 - 1.44 GHz256 Bit @ 14000 MHz
GeForce RTX 2080 Max-Q 2944 @ 0.74 - 1.1 GHz256 Bit @ 12000 MHz
GeForce RTX 2060 (Desktop) 1920 @ 1.32 - 1.62 GHz192 Bit @ 14000 MHz
GeForce RTX 2070 Super Max-Q 2560 @ 0.93 - 1.16 GHz256 Bit @ 11000 MHz
GeForce RTX 2070 Max-Q 2304 @ 0.89 - 1.19 GHz256 Bit @ 12000 MHz
GeForce RTX 2060 Mobile 1920 @ 0.96 - 1.2 GHz192 Bit @ 14000 MHz
GeForce RTX 2060 Max-Q 1920 @ 0.98 - 1.19 GHz192 Bit @ 11000 MHz
GeForce RTX 2050 Mobile 2048 @ 1.48 GHz64 Bit @ 14000 MHz
NVIDIA GeForce RTX 3090 Ti 10752 @ 1.56 - 1.86 GHz384 Bit @ 21000 MHz
NVIDIA GeForce RTX 3090 10496 @ 1.4 - 1.7 GHz384 Bit @ 19500 MHz
NVIDIA GeForce RTX 3080 Ti 10240 @ 1.37 - 1.67 GHz384 Bit @ 19000 MHz
NVIDIA GeForce RTX 3080 12 GB 8960/ cores @ 1.26 - 1.71 GHz384 Bit @ 19000 MHz
NVIDIA GeForce RTX 3080 8704 @ 1.45 - 1.71 GHz320 Bit @ 19000 MHz
GeForce RTX 3070 Ti 6144 @ 1.58 - 1.77 GHz256 Bit @ 19000 MHz
GeForce RTX 3080 Ti Laptop GPU 7424 @ 0.98 - 1.59 GHz256 Bit @ 14000 MHz
NVIDIA GeForce RTX 3070 5888 @ 1.5 - 1.73 GHz256 Bit @ 14000 MHz
GeForce RTX 3080 Laptop GPU 6144 @ 0.78 - 1.25 GHz256 Bit @ 14000 MHz
NVIDIA GeForce RTX 3060 Ti 4864 @ 1.41 - 1.67 GHz256 Bit @ 14000 MHz
GeForce RTX 3070 Ti Laptop GPU 5888 @ 0.92 - 1.48 GHz256 Bit @ 14000 MHz
GeForce RTX 3070 Laptop GPU 5120 @ 0.78 - 1.29 GHz256 Bit @ 14000 MHz
NVIDIA GeForce RTX 3060 3584 @ 1.32 - 1.78 GHz192 Bit @ 15000 MHz
GeForce RTX 3080 Max-Q 6144 @ 0.78 - 1.25 GHz256 Bit @ 6000 MHz
GeForce RTX 3070 Max-Q 5120 @ 1.29 GHz256 Bit
GeForce RTX 3060 Laptop GPU 3840 @ 0.82 - 1.7 GHz192 Bit @ 14000 MHz
GeForce RTX 3060 Max-Q 3840 @ 1.28 GHz192 Bit
NVIDIA GeForce RTX 3050 2560 @ 1.55 - 1.78 GHz128 Bit Bit @ 1750 MHz
GeForce RTX 3050 Ti Laptop GPU 2560 @ 1.22 - 1.49 GHz128 Bit @ 12000 MHz
GeForce RTX 3050 6GB Laptop GPU 2560 @ 1.24 - 1.49 GHz96 Bit @ 12000 MHz
GeForce RTX 3050 A Laptop GPU 1792 64 Bit
GeForce RTX 3050 4GB Laptop GPU 2048 @ 1.24 - 1.5 GHz128 Bit @ 12000 MHz
CodenameN18E-G2RAmpere GA102
ArchitekturTuringAda LovelaceAmpere
Pipelines2560 - unified1792 - unified10752 - unified
Kerntakt930 - 1155 (Boost) MHz1560 - 1860 (Boost) MHz
Speichertakt11000 MHz21000 effective = 1313 MHz
Speicherbandbreite256 Bit64 Bit384 Bit
SpeichertypGDDR6GDDR6GDDR6X
Max. Speichergröße8 GB4 GB24 GB
Shared Memoryneinneinnein
APIDirectX 12_1, OpenGL 4.6DirectX 12_2, Shader 6.7, OpenGL 4.6DirectX 12_2, Shader 6.7, OpenGL 4.6
Stromverbrauch80 Watt45 Watt (35 - 80 Watt TGP)450 Watt
Herstellungsprozess12 nm5 nm8 nm
FeaturesDLSS, Raytraycing, VR Ready, G-SYNC, Vulkan, Multi Monitor, 550 Watt system power recommendedNVIDIA DLSS, NVIDIA Reflex, Resizable BAR, NVIDIA Broadcast, NVIDIA Ansel, NVIDIA ShadowPlay, NVIDIA G-SYNC, Advanced Optimus, Nvidia Max-Q, Dynamic Boost
Notebookgrößegroß (17" z.B.)mittel (15.4" z.B.)
Erscheinungsdatum02.04.2020 26.07.2024 27.01.2022
PCIe4.04.0 x16
DisplaysHDMI 2.1, DisplayPort 1.4a4 Displays (max.), HDMI 2.1, DisplayPort 1.4a
PredecessorGeForce RTX 3050 4GB Laptop GPUGeForce RTX 2080 Ti (Desktop)
TMUs336
ROPs112
Raytracing Cores84
Tensor / AI Cores336
Theoretical Performance40 TFLOPS FP16, 40 TFLOPS FP32, 625 TFLOPS FP64
CacheL1: 10.5 MB, L2: 6 MB
Memory Bandwidth1008 GB/s
Transistors28.3 Billion
Die Size 628 mm²

Benchmarks

Performance Rating - 3DMark 11 + Fire Strike + Time Spy - GeForce RTX 2070 Super Max-Q
9.2 pt (28%)
Performance Rating - 3DMark 11 + Fire Strike + Time Spy - NVIDIA GeForce RTX 3090 Ti
23.5 pt (71%)
3DMark - 3DMark Time Spy Score
min: 7199     avg: 7605     median: 7611.5 (22%)     max: 8066 Points
19241 Points (55%)
3DMark - 3DMark Time Spy Graphics
min: 7084     avg: 7445     median: 7373.5 (20%)     max: 7891 Points
21645 Points (57%)
3DMark - 3DMark Ice Storm Unlimited Graphics
min: 461097     avg: 461649     median: 461648 (47%)     max: 462200 Points
564087 Points (57%)
3DMark - 3DMark Ice Storm Extreme Graphics
444102 Points (55%)
3DMark - 3DMark Cloud Gate Score
min: 38593     avg: 45672     median: 47119 (50%)     max: 49917 Points
75753 Points (81%)
3DMark - 3DMark Cloud Gate Graphics
min: 65295     avg: 117307     median: 126747 (33%)     max: 134954 Points
246319 Points (65%)
3DMark - 3DMark Fire Strike Standard Score
min: 16736     avg: 18097     median: 18395 (32%)     max: 18947 Points
36563 Points (65%)
3DMark - 3DMark Fire Strike Standard Graphics
min: 18559     avg: 20277     median: 20872.5 (24%)     max: 21446 Points
53110 Points (60%)
3DMark - 3DMark Ice Storm Graphics
66977 Points (8%)
465704 Points (54%)
3DMark - 3DMark Wild Life Unlimited
48041 Points (24%)
118439 Points (60%)
3DMark - 3DMark Wild Life Extreme Unlimited
46562 Points (54%)
3DMark - 3DMark Night Raid
64315 Points (61%)
3DMark - 3DMark Night Raid Graphics Score
139165 Points (54%)
3DMark 11 - 3DM11 Performance Score
min: 20666     avg: 23000     median: 23755.5 (33%)     max: 24383 Points
49471 Points (69%)
3DMark 11 - 3DM11 Performance GPU
min: 24244     avg: 27104     median: 27724 (24%)     max: 28900 Points
69481 Points (60%)
3DMark Vantage
3DM Vant. Perf. total + NVIDIA GeForce RTX 2070 Super Max-Q
3DMark Vantage - 3DM Vant. Perf. total
65101 Points (19%)
3DM Vant. Perf. GPU no PhysX + NVIDIA GeForce RTX 2070 Super Max-Q
3DMark Vantage - 3DM Vant. Perf. GPU no PhysX
69136 Points (38%)
3DMark 06 3DMark 06 - Standard 1280x1024 + NVIDIA GeForce RTX 2070 Super Max-Q
3DMark 06
43406 Points (57%)
Unigine Valley 1.0 - Unigine Valley 1.0 DX
201.7 fps (62%)
SPECviewperf 12
specvp12 sw-03 + NVIDIA GeForce RTX 3090 Ti
SPECviewperf 12 - specvp12 sw-03
85.7 fps (21%)
specvp12 snx-02 + NVIDIA GeForce RTX 3090 Ti
SPECviewperf 12 - specvp12 snx-02
15.6 fps (2%)
specvp12 showcase-01 + NVIDIA GeForce RTX 3090 Ti
SPECviewperf 12 - specvp12 showcase-01
265 fps (58%)
specvp12 mediacal-01 + NVIDIA GeForce RTX 3090 Ti
SPECviewperf 12 - specvp12 mediacal-01
87.1 fps (22%)
specvp12 maya-04 + NVIDIA GeForce RTX 3090 Ti
SPECviewperf 12 - specvp12 maya-04
197 fps (54%)
specvp12 energy-01 + NVIDIA GeForce RTX 3090 Ti
SPECviewperf 12 - specvp12 energy-01
27.6 fps (25%)
specvp12 creo-01 + NVIDIA GeForce RTX 3090 Ti
SPECviewperf 12 - specvp12 creo-01
76.4 fps (31%)
specvp12 catia-04 + NVIDIA GeForce RTX 3090 Ti
SPECviewperf 12 - specvp12 catia-04
150 fps (25%)
specvp12 3dsmax-05 + NVIDIA GeForce RTX 3090 Ti
SPECviewperf 12 - specvp12 3dsmax-05
371 fps (65%)
SPECviewperf 13 specvp13 sw-04 + NVIDIA GeForce RTX 2070 Super Max-Q
SPECviewperf 13 - specvp13 sw-04
min: 80.2     avg: 85.8     median: 85.8 (23%)     max: 91.3 fps
specvp13 sw-04 + NVIDIA GeForce RTX 3090 Ti
118 fps (32%)
specvp13 snx-03 + NVIDIA GeForce RTX 2070 Super Max-Q
SPECviewperf 13 - specvp13 snx-03
min: 19.65     avg: 19.9     median: 19.9 (2%)     max: 20.06 fps
specvp13 snx-03 + NVIDIA GeForce RTX 3090 Ti
28 fps (3%)
specvp13 showcase-02 + NVIDIA GeForce RTX 2070 Super Max-Q
SPECviewperf 13 - specvp13 showcase-02
min: 94.1     avg: 95.6     median: 95.6 (21%)     max: 97 fps
specvp13 showcase-02 + NVIDIA GeForce RTX 3090 Ti
265 fps (58%)
specvp13 medical-02 + NVIDIA GeForce RTX 2070 Super Max-Q
SPECviewperf 13 - specvp13 medical-02
min: 48.6     avg: 50.6     median: 50.6 (11%)     max: 52.6 fps
specvp13 medical-02 + NVIDIA GeForce RTX 3090 Ti
113 fps (24%)
specvp13 maya-05 + NVIDIA GeForce RTX 2070 Super Max-Q
SPECviewperf 13 - specvp13 maya-05
min: 199.7     avg: 210.6     median: 210.6 (24%)     max: 221.5 fps
specvp13 maya-05 + NVIDIA GeForce RTX 3090 Ti
493 fps (56%)
specvp13 energy-02 + NVIDIA GeForce RTX 2070 Super Max-Q
SPECviewperf 13 - specvp13 energy-02
min: 18.47     avg: 18.7     median: 18.7 (6%)     max: 18.95 fps
specvp13 energy-02 + NVIDIA GeForce RTX 3090 Ti
48.4 fps (16%)
specvp13 creo-02 + NVIDIA GeForce RTX 2070 Super Max-Q
SPECviewperf 13 - specvp13 creo-02
min: 160.4     avg: 166.2     median: 166.2 (24%)     max: 172 fps
specvp13 creo-02 + NVIDIA GeForce RTX 3090 Ti
353 fps (52%)
specvp13 catia-05 + NVIDIA GeForce RTX 2070 Super Max-Q
SPECviewperf 13 - specvp13 catia-05
min: 124.3     avg: 126.6     median: 126.6 (14%)     max: 128.9 fps
specvp13 catia-05 + NVIDIA GeForce RTX 3090 Ti
230 fps (26%)
specvp13 3dsmax-06 + NVIDIA GeForce RTX 2070 Super Max-Q
SPECviewperf 13 - specvp13 3dsmax-06
min: 171.5     avg: 176.4     median: 176.4 (31%)     max: 181.2 fps
specvp13 3dsmax-06 + NVIDIA GeForce RTX 3090 Ti
373 fps (65%)
SPECviewperf 2020 specvp2020 solidworks-05 1080p + NVIDIA GeForce RTX 2070 Super Max-Q
SPECviewperf 2020 - specvp2020 solidworks-05 1080p
152.8 fps (30%)
specvp2020 snx-04 1080p + NVIDIA GeForce RTX 2070 Super Max-Q
SPECviewperf 2020 - specvp2020 snx-04 1080p
19.5 fps (3%)
specvp2020 medical-03 1080p + NVIDIA GeForce RTX 2070 Super Max-Q
SPECviewperf 2020 - specvp2020 medical-03 1080p
24 fps (17%)
specvp2020 maya-06 1080p + NVIDIA GeForce RTX 2070 Super Max-Q
SPECviewperf 2020 - specvp2020 maya-06 1080p
221.6 fps (25%)
specvp2020 energy-03 1080p + NVIDIA GeForce RTX 2070 Super Max-Q
SPECviewperf 2020 - specvp2020 energy-03 1080p
19.2 fps (13%)
specvp2020 creo-03 1080p + NVIDIA GeForce RTX 2070 Super Max-Q
SPECviewperf 2020 - specvp2020 creo-03 1080p
76.8 fps (38%)
specvp2020 catia-06 1080p + NVIDIA GeForce RTX 2070 Super Max-Q
SPECviewperf 2020 - specvp2020 catia-06 1080p
49 fps (30%)
specvp2020 3dsmax-07 1080p + NVIDIA GeForce RTX 2070 Super Max-Q
SPECviewperf 2020 - specvp2020 3dsmax-07 1080p
86.4 fps (28%)
specvp2020 solidworks-05 4k + NVIDIA GeForce RTX 3090 Ti
SPECviewperf 2020 - specvp2020 solidworks-05 4k
197 fps (58%)
specvp2020 snx-04 4k + NVIDIA GeForce RTX 3090 Ti
SPECviewperf 2020 - specvp2020 snx-04 4k
23.7 fps (2%)
specvp2020 medical-03 4k + NVIDIA GeForce RTX 3090 Ti
SPECviewperf 2020 - specvp2020 medical-03 4k
22.2 fps (21%)
specvp2020 maya-06 4k + NVIDIA GeForce RTX 3090 Ti
SPECviewperf 2020 - specvp2020 maya-06 4k
353 fps (57%)
specvp2020 energy-03 4k + NVIDIA GeForce RTX 3090 Ti
SPECviewperf 2020 - specvp2020 energy-03 4k
31.6 fps (7%)
specvp2020 creo-03 4k + NVIDIA GeForce RTX 3090 Ti
SPECviewperf 2020 - specvp2020 creo-03 4k
84.5 fps (40%)
specvp2020 catia-06 4k + NVIDIA GeForce RTX 3090 Ti
SPECviewperf 2020 - specvp2020 catia-06 4k
58.6 fps (38%)
specvp2020 3dsmax-07 4k + NVIDIA GeForce RTX 3090 Ti
SPECviewperf 2020 - specvp2020 3dsmax-07 4k
145 fps (60%)
Cinebench R10 Cinebench R10 Shading (32bit) + NVIDIA GeForce RTX 2070 Super Max-Q
Cinebench R10 - Cinebench R10 Shading (32bit)
6835 Points (5%)
Cinebench R11.5 Cinebench R11.5 OpenGL 64 Bit + NVIDIA GeForce RTX 2070 Super Max-Q
Cinebench R11.5 - Cinebench R11.5 OpenGL 64 Bit
88.5 fps (29%)
Cinebench R11.5 OpenGL 64 Bit + NVIDIA GeForce RTX 3090 Ti
Cinebench R15
Cinebench R15 OpenGL 64 Bit + NVIDIA GeForce RTX 2070 Super Max-Q
Cinebench R15 - Cinebench R15 OpenGL 64 Bit
min: 129     avg: 139.5     median: 138 (8%)     max: 157 fps
Cinebench R15 OpenGL 64 Bit + NVIDIA GeForce RTX 3090 Ti
204 fps (12%)
Cinebench R15 OpenGL Ref. Match 64 Bit + NVIDIA GeForce RTX 2070 Super Max-Q
Cinebench R15 - Cinebench R15 OpenGL Ref. Match 64 Bit
99.6 % (100%)
Cinebench R15 OpenGL Ref. Match 64 Bit + NVIDIA GeForce RTX 3090 Ti
99.6 % (100%)
GFXBench - GFXBench Car Chase Offscreen
349 fps (39%)
LuxMark v2.0 64Bit - LuxMark v2.0 Room GPU
6221 Samples/s (28%)
LuxMark v2.0 64Bit - LuxMark v2.0 Sala GPU
16046 Samples/s (28%)
ComputeMark v2.1 - ComputeMark v2.1 Result
14015 Points (15%)
52258 Points (56%)
Power Consumption - Furmark Stress Test Power Consumption - external Monitor *
min: 598     avg: 615     median: 599 (85%)     max: 648 Watt
Power Consumption - The Witcher 3 Power Consumption - external Monitor *
153 Watt (21%)
min: 561     avg: 564     median: 561 (78%)     max: 569 Watt
Power Consumption - Witcher 3 Power Consumption *
min: 144     avg: 156     median: 155 (34%)     max: 176 Watt
Power Consumption - Witcher 3 ultra Power Efficiency
min: 0.4324     avg: 0.5     median: 0.5 (43%)     max: 0.531 fps per Watt
Power Consumption - Witcher 3 ultra Power Efficiency - external Monitor
0.5 fps per Watt (43%)
min: 0.3447     avg: 0.3     median: 0.3 (29%)     max: 0.345 fps per Watt
Emissions Witcher 3 Fan Noise + NVIDIA GeForce RTX 2070 Super Max-Q
Emissions - Witcher 3 Fan Noise
min: 46     avg: 48.9     median: 48 (77%)     max: 53 dB(A)
Clock Speed - GPU Clock Witcher 3 ultra
min: 1320     avg: 1363     median: 1350 (53%)     max: 1440 MHz

Average Benchmarks NVIDIA GeForce RTX 2070 Super Max-Q → 0% n=0

Average Benchmarks NVIDIA GeForce RTX 3090 Ti → 0% n=0

- Bereich der Benchmarkergebnisse für diese Grafikkarte
- Durchschnittliche Benchmarkergebnisse für diese Grafikkarte
* Smaller numbers mean a higher performance
1 This benchmark is not used for the average calculation

Spiele-Benchmarks

Die folgenden Benchmarks basieren auf unseren Spieletests mit Testnotebooks. Die Performance dieser Grafikkarte bei den gelisteten Spielen ist abhängig von der verwendeten CPU, Speicherausstattung, Treiber und auch Betriebssystem. Dadurch müssen die untenstehenden Werte nicht repräsentativ sein. Detaillierte Informationen über das verwendete System sehen Sie nach einem Klick auf den fps-Wert.

low 1920x1080
NVIDIA GeForce RTX 3090 Ti:
263 263 ~ 263 fps
med. 1920x1080
NVIDIA GeForce RTX 3090 Ti:
260 260 ~ 260 fps
high 1920x1080
NVIDIA GeForce RTX 3090 Ti:
261 261 ~ 261 fps
ultra 1920x1080
NVIDIA GeForce RTX 3090 Ti:
261 261 ~ 261 fps
QHD 2560x1440
NVIDIA GeForce RTX 3090 Ti:
210 210 ~ 210 fps
4K 3840x2160
NVIDIA GeForce RTX 3090 Ti:
113.2 113.2 ~ 113 fps
low 1920x1080
NVIDIA GeForce RTX 3090 Ti:
324  fps
med. 1920x1080
NVIDIA GeForce RTX 3090 Ti:
277 277 ~ 277 fps
high 1920x1080
NVIDIA GeForce RTX 3090 Ti:
231 231 ~ 231 fps
ultra 1920x1080
NVIDIA GeForce RTX 3090 Ti:
190.2 190.2 ~ 190 fps
QHD 2560x1440
NVIDIA GeForce RTX 3090 Ti:
142.6 142.6 ~ 143 fps
4K 3840x2160
NVIDIA GeForce RTX 3090 Ti:
81.1 81.1 ~ 81 fps
low 1920x1080
NVIDIA GeForce RTX 3090 Ti:
219 219 ~ 219 fps
med. 1920x1080
NVIDIA GeForce RTX 3090 Ti:
201 201 ~ 201 fps
high 1920x1080
NVIDIA GeForce RTX 3090 Ti:
172.8 172.8 ~ 173 fps
ultra 1920x1080
NVIDIA GeForce RTX 3090 Ti:
151.8 151.8 ~ 152 fps
QHD 2560x1440
NVIDIA GeForce RTX 3090 Ti:
103.9 103.9 ~ 104 fps
4K 3840x2160
NVIDIA GeForce RTX 3090 Ti:
53.3 53.3 ~ 53 fps
low 1920x1080
NVIDIA GeForce RTX 3090 Ti:
228 228 ~ 228 fps
med. 1920x1080
NVIDIA GeForce RTX 3090 Ti:
202 202 ~ 202 fps
high 1920x1080
NVIDIA GeForce RTX 3090 Ti:
173.4 173.4 ~ 173 fps
ultra 1920x1080
NVIDIA GeForce RTX 3090 Ti:
156.6 156.6 ~ 157 fps
QHD 2560x1440
NVIDIA GeForce RTX 3090 Ti:
153.2 153.2 ~ 153 fps
4K 3840x2160
NVIDIA GeForce RTX 3090 Ti:
120.5 120.5 ~ 121 fps
low 1920x1080
NVIDIA GeForce RTX 3090 Ti:
60 60 ~ 60 fps
med. 1920x1080
NVIDIA GeForce RTX 3090 Ti:
60 60 ~ 60 fps
high 1920x1080
NVIDIA GeForce RTX 3090 Ti:
60 60 ~ 60 fps
ultra 1920x1080
NVIDIA GeForce RTX 3090 Ti:
60 60 ~ 60 fps
QHD 2560x1440
NVIDIA GeForce RTX 3090 Ti:
60 60 ~ 60 fps
4K 3840x2160
NVIDIA GeForce RTX 3090 Ti:
60 60 ~ 60 fps
low 1920x1080
NVIDIA GeForce RTX 3090 Ti:
202 202 ~ 202 fps
med. 1920x1080
NVIDIA GeForce RTX 3090 Ti:
171.4 171.4 ~ 171 fps
high 1920x1080
NVIDIA GeForce RTX 3090 Ti:
153 153 ~ 153 fps
QHD 2560x1440
NVIDIA GeForce RTX 3090 Ti:
113.2 113.2 ~ 113 fps
4K 3840x2160
NVIDIA GeForce RTX 3090 Ti:
64.3 64.3 ~ 64 fps
low 1920x1080
NVIDIA GeForce RTX 3090 Ti:
411 411 ~ 411 fps
med. 1920x1080
NVIDIA GeForce RTX 3090 Ti:
347 347 ~ 347 fps
high 1920x1080
NVIDIA GeForce RTX 3090 Ti:
315 315 ~ 315 fps
ultra 1920x1080
NVIDIA GeForce RTX 3090 Ti:
290 290 ~ 290 fps
QHD 2560x1440
NVIDIA GeForce RTX 3090 Ti:
208 208 ~ 208 fps
4K 3840x2160
NVIDIA GeForce RTX 3090 Ti:
116 116 ~ 116 fps
low 1280x720
NVIDIA GeForce RTX 3090 Ti:
231  fps
med. 1920x1080
NVIDIA GeForce RTX 3090 Ti:
200 200 ~ 200 fps
high 1920x1080
NVIDIA GeForce RTX 3090 Ti:
188 188 ~ 188 fps
ultra 1920x1080
NVIDIA GeForce RTX 3090 Ti:
127 127 ~ 127 fps
QHD 2560x1440
NVIDIA GeForce RTX 3090 Ti:
114 114 ~ 114 fps
4K 3840x2160
NVIDIA GeForce RTX 3090 Ti:
89 89 ~ 89 fps
med. 1920x1080
NVIDIA GeForce RTX 3090 Ti:
195.5 195.5 ~ 196 fps
high 1920x1080
NVIDIA GeForce RTX 3090 Ti:
207 207 ~ 207 fps
ultra 1920x1080
NVIDIA GeForce RTX 3090 Ti:
191.2 191.2 ~ 191 fps
QHD 2560x1440
NVIDIA GeForce RTX 3090 Ti:
149.9 149.9 ~ 150 fps
4K 3840x2160
NVIDIA GeForce RTX 3090 Ti:
93.7 93.7 ~ 94 fps
Far Cry 6

Far Cry 6

2021
med. 1920x1080
NVIDIA GeForce RTX 3090 Ti:
179 179 ~ 179 fps
high 1920x1080
NVIDIA GeForce RTX 3090 Ti:
161.6 162 ~ 162 fps
ultra 1920x1080
NVIDIA GeForce RTX 3090 Ti:
142 142 ~ 142 fps
QHD 2560x1440
NVIDIA GeForce RTX 3090 Ti:
132.9 132.9 ~ 133 fps
4K 3840x2160
NVIDIA GeForce RTX 3090 Ti:
89.9 90 ~ 90 fps
F1 2021

F1 2021

2021
med. 1920x1080
NVIDIA GeForce RTX 3090 Ti:
537 537 ~ 537 fps
high 1920x1080
NVIDIA GeForce RTX 3090 Ti:
470 470 ~ 470 fps
ultra 1920x1080
NVIDIA GeForce RTX 3090 Ti:
242 242 ~ 242 fps
QHD 2560x1440
NVIDIA GeForce RTX 3090 Ti:
189.3 189.3 ~ 189 fps
4K 3840x2160
NVIDIA GeForce RTX 3090 Ti:
114.9 114.9 ~ 115 fps
low 1280x720
100%
GeForce RTX 2070 Super Max-Q:
117.8  fps
med. 1920x1080
100%
GeForce RTX 2070 Super Max-Q:
67.7  fps
high 1920x1080
100%
GeForce RTX 2070 Super Max-Q:
56.7  fps
ultra 1920x1080
100%
GeForce RTX 2070 Super Max-Q:
48.5  fps
low 1280x720
100%
GeForce RTX 2070 Super Max-Q:
135.7  fps
med. 1920x1080
100%
GeForce RTX 2070 Super Max-Q:
102.6  fps
high 1920x1080
100%
GeForce RTX 2070 Super Max-Q:
101.6  fps
ultra 1920x1080
100%
GeForce RTX 2070 Super Max-Q:
86.1  fps
low 1280x720
100%
GeForce RTX 2070 Super Max-Q:
163.7  fps
med. 1920x1080
100%
GeForce RTX 2070 Super Max-Q:
93.6  fps
high 1920x1080
100%
GeForce RTX 2070 Super Max-Q:
86.2  fps
ultra 1920x1080
100%
GeForce RTX 2070 Super Max-Q:
77.4  fps
low 1280x720
100%
GeForce RTX 2070 Super Max-Q:
118  fps
med. 1920x1080
100%
GeForce RTX 2070 Super Max-Q:
81  fps
198%
NVIDIA GeForce RTX 3090 Ti:
160 160 ~ 160 fps
high 1920x1080
100%
GeForce RTX 2070 Super Max-Q:
70  fps
197%
NVIDIA GeForce RTX 3090 Ti:
138 138 ~ 138 fps
ultra 1920x1080
100%
GeForce RTX 2070 Super Max-Q:
60  fps
205%
NVIDIA GeForce RTX 3090 Ti:
123 123 ~ 123 fps
QHD 2560x1440
NVIDIA GeForce RTX 3090 Ti:
108 108 ~ 108 fps
4K 3840x2160
NVIDIA GeForce RTX 3090 Ti:
73 73 ~ 73 fps
Dirt 5

Dirt 5

2020
low 1280x720
100%
GeForce RTX 2070 Super Max-Q:
160  fps
med. 1920x1080
100%
GeForce RTX 2070 Super Max-Q:
95.6  fps
high 1920x1080
100%
GeForce RTX 2070 Super Max-Q:
78.2  fps
ultra 1920x1080
100%
GeForce RTX 2070 Super Max-Q:
65.1  fps
low 1280x720
100%
GeForce RTX 2070 Super Max-Q:
100  fps
med. 1920x1080
100%
GeForce RTX 2070 Super Max-Q:
96  fps
178%
NVIDIA GeForce RTX 3090 Ti:
171.4 171.4 ~ 171 fps
high 1920x1080
100%
GeForce RTX 2070 Super Max-Q:
84  fps
183%
NVIDIA GeForce RTX 3090 Ti:
154.2 154.2 ~ 154 fps
ultra 1920x1080
100%
GeForce RTX 2070 Super Max-Q:
59  fps
220%
NVIDIA GeForce RTX 3090 Ti:
130.2 130.2 ~ 130 fps
QHD 2560x1440
NVIDIA GeForce RTX 3090 Ti:
107.8 107.8 ~ 108 fps
4K 3840x2160
NVIDIA GeForce RTX 3090 Ti:
70.1 70.1 ~ 70 fps
med. 1920x1080
NVIDIA GeForce RTX 3090 Ti:
240 240 240 ~ 240 fps
high 1920x1080
NVIDIA GeForce RTX 3090 Ti:
231 231 ~ 231 fps
QHD 2560x1440
NVIDIA GeForce RTX 3090 Ti:
173.9 173.9 ~ 174 fps
4K 3840x2160
NVIDIA GeForce RTX 3090 Ti:
99.2 99.2 ~ 99 fps
low 1280x720
100%
GeForce RTX 2070 Super Max-Q:
127  fps
med. 1920x1080
100%
GeForce RTX 2070 Super Max-Q:
87.7  fps
high 1920x1080
100%
GeForce RTX 2070 Super Max-Q:
81.9  fps
ultra 1920x1080
100%
GeForce RTX 2070 Super Max-Q:
67.7  fps
low 1280x720
100%
GeForce RTX 2070 Super Max-Q:
145  fps
med. 1920x1080
100%
GeForce RTX 2070 Super Max-Q:
120  fps
high 1920x1080
100%
GeForce RTX 2070 Super Max-Q:
107  fps
ultra 1920x1080
100%
GeForce RTX 2070 Super Max-Q:
93  fps
low 1280x720
100%
GeForce RTX 2070 Super Max-Q:
164.3  fps
med. 1920x1080
100%
GeForce RTX 2070 Super Max-Q:
114.5  fps
high 1920x1080
100%
GeForce RTX 2070 Super Max-Q:
104.3  fps
ultra 1920x1080
100%
GeForce RTX 2070 Super Max-Q:
101.8  fps
F1 2020

F1 2020

2020
low 1280x720
100%
GeForce RTX 2070 Super Max-Q:
258  fps
med. 1920x1080
100%
GeForce RTX 2070 Super Max-Q:
163  fps
high 1920x1080
100%
GeForce RTX 2070 Super Max-Q:
145  fps
ultra 1920x1080
100%
GeForce RTX 2070 Super Max-Q:
104  fps
low 1280x720
100%
GeForce RTX 2070 Super Max-Q:
272.4  fps
med. 1920x1080
100%
GeForce RTX 2070 Super Max-Q:
165.8  fps
high 1920x1080
100%
GeForce RTX 2070 Super Max-Q:
109 109.2 116 ~ 111 fps
ultra 1920x1080
100%
GeForce RTX 2070 Super Max-Q:
79 82.2 90.6 ~ 84 fps
low 1280x720
100%
GeForce RTX 2070 Super Max-Q:
229.6 232.3 ~ 231 fps
med. 1920x1080
100%
GeForce RTX 2070 Super Max-Q:
152 157 164.1 ~ 158 fps
high 1920x1080
100%
GeForce RTX 2070 Super Max-Q:
135.1 139 141 149.4 ~ 141 fps
ultra 1920x1080
100%
GeForce RTX 2070 Super Max-Q:
130.2 135 137 146.4 ~ 137 fps
QHD 2560x1440
100%
GeForce RTX 2070 Super Max-Q:
99.6  fps
4K 3840x2160
100%
GeForce RTX 2070 Super Max-Q:
51.2  fps
med. 1920x1080
100%
GeForce RTX 2070 Super Max-Q:
109  fps
high 1920x1080
100%
GeForce RTX 2070 Super Max-Q:
91.6 96.8 ~ 94 fps
QHD 2560x1440
100%
GeForce RTX 2070 Super Max-Q:
56.8  fps
4K 3840x2160
100%
GeForce RTX 2070 Super Max-Q:
27.4  fps
med. 1920x1080
100%
GeForce RTX 2070 Super Max-Q:
121  fps
high 1920x1080
100%
GeForce RTX 2070 Super Max-Q:
116 121 ~ 119 fps
ultra 1920x1080
100%
GeForce RTX 2070 Super Max-Q:
107 119 ~ 113 fps
QHD 2560x1440
100%
GeForce RTX 2070 Super Max-Q:
79.8  fps
4K 3840x2160
100%
GeForce RTX 2070 Super Max-Q:
36.8  fps
low 1280x720
100%
GeForce RTX 2070 Super Max-Q:
132.8  fps
med. 1920x1080
100%
GeForce RTX 2070 Super Max-Q:
86.6 91.3 ~ 89 fps
high 1920x1080
100%
GeForce RTX 2070 Super Max-Q:
60.2 61.8 65.7 ~ 63 fps
ultra 1920x1080
100%
GeForce RTX 2070 Super Max-Q:
39.4 40.2 42.4 ~ 41 fps
QHD 2560x1440
100%
GeForce RTX 2070 Super Max-Q:
32 34.3 ~ 33 fps
4K 3840x2160
100%
GeForce RTX 2070 Super Max-Q:
20.5 22 ~ 21 fps
med. 1920x1080
100%
GeForce RTX 2070 Super Max-Q:
108 109 ~ 109 fps
high 1920x1080
100%
GeForce RTX 2070 Super Max-Q:
95 98.2 104 ~ 99 fps
ultra 1920x1080
100%
GeForce RTX 2070 Super Max-Q:
88.8 92.1 94.1 ~ 92 fps
QHD 2560x1440
100%
GeForce RTX 2070 Super Max-Q:
71.3  fps
4K 3840x2160
100%
GeForce RTX 2070 Super Max-Q:
35.9  fps
med. 1920x1080
100%
GeForce RTX 2070 Super Max-Q:
103  fps
high 1920x1080
100%
GeForce RTX 2070 Super Max-Q:
88.2 94 ~ 91 fps
ultra 1920x1080
100%
GeForce RTX 2070 Super Max-Q:
80.7 82.6 ~ 82 fps
QHD 2560x1440
100%
GeForce RTX 2070 Super Max-Q:
60.5  fps
4K 3840x2160
100%
GeForce RTX 2070 Super Max-Q:
33.4  fps
low 1280x720
100%
GeForce RTX 2070 Super Max-Q:
160.9  fps
med. 1920x1080
100%
GeForce RTX 2070 Super Max-Q:
116.2 134 ~ 125 fps
high 1920x1080
100%
GeForce RTX 2070 Super Max-Q:
97.8 117 126 ~ 114 fps
ultra 1920x1080
100%
GeForce RTX 2070 Super Max-Q:
84.2 99.6 104 ~ 96 fps
QHD 2560x1440
100%
GeForce RTX 2070 Super Max-Q:
72.3  fps
4K 3840x2160
100%
GeForce RTX 2070 Super Max-Q:
41  fps
GRID 2019

GRID 2019

2019
med. 1920x1080
100%
GeForce RTX 2070 Super Max-Q:
131  fps
high 1920x1080
100%
GeForce RTX 2070 Super Max-Q:
103 104 ~ 104 fps
ultra 1920x1080
100%
GeForce RTX 2070 Super Max-Q:
69.7 71.1 ~ 70 fps
QHD 2560x1440
100%
GeForce RTX 2070 Super Max-Q:
60.6  fps
4K 3840x2160
100%
GeForce RTX 2070 Super Max-Q:
39.7  fps
med. 1920x1080
100%
GeForce RTX 2070 Super Max-Q:
101  fps
high 1920x1080
100%
GeForce RTX 2070 Super Max-Q:
89 92 ~ 91 fps
ultra 1920x1080
100%
GeForce RTX 2070 Super Max-Q:
66 69 ~ 68 fps
QHD 2560x1440
100%
GeForce RTX 2070 Super Max-Q:
49 50 ~ 50 fps
4K 3840x2160
100%
GeForce RTX 2070 Super Max-Q:
28 29 ~ 29 fps
FIFA 20

FIFA 20

2019
med. 1920x1080
100%
GeForce RTX 2070 Super Max-Q:
271  fps
high 1920x1080
100%
GeForce RTX 2070 Super Max-Q:
196 259 ~ 228 fps
ultra 1920x1080
100%
GeForce RTX 2070 Super Max-Q:
190 257 ~ 224 fps
QHD 2560x1440
100%
GeForce RTX 2070 Super Max-Q:
253  fps
4K 3840x2160
100%
GeForce RTX 2070 Super Max-Q:
186  fps
med. 1920x1080
100%
GeForce RTX 2070 Super Max-Q:
112  fps
182%
NVIDIA GeForce RTX 3090 Ti:
204 204 ~ 204 fps
high 1920x1080
100%
GeForce RTX 2070 Super Max-Q:
76.3 77.2 78 84.4 ~ 79 fps
238%
NVIDIA GeForce RTX 3090 Ti:
187.6 187.6 ~ 188 fps
ultra 1920x1080
100%
GeForce RTX 2070 Super Max-Q:
58.9 58.9 59.6 64.8 ~ 61 fps
284%
NVIDIA GeForce RTX 3090 Ti:
173.3 173.3 ~ 173 fps
QHD 2560x1440
100%
GeForce RTX 2070 Super Max-Q:
41.7 45.6 ~ 44 fps
325%
NVIDIA GeForce RTX 3090 Ti:
143.1 143.1 ~ 143 fps
4K 3840x2160
100%
GeForce RTX 2070 Super Max-Q:
22.2 24.5 ~ 23 fps
365%
NVIDIA GeForce RTX 3090 Ti:
83.8 83.8 ~ 84 fps
Control

Control

2019
med. 1920x1080
100%
GeForce RTX 2070 Super Max-Q:
92.6  fps
259%
NVIDIA GeForce RTX 3090 Ti:
240 240 ~ 240 fps
high 1920x1080
100%
GeForce RTX 2070 Super Max-Q:
60.2 68.4 ~ 64 fps
327%
NVIDIA GeForce RTX 3090 Ti:
209 209 ~ 209 fps
QHD 2560x1440
100%
GeForce RTX 2070 Super Max-Q:
40.6 43.9 ~ 42 fps
340%
NVIDIA GeForce RTX 3090 Ti:
142.5 142.5 ~ 143 fps
4K 3840x2160
100%
GeForce RTX 2070 Super Max-Q:
21.1 23.8 ~ 22 fps
336%
NVIDIA GeForce RTX 3090 Ti:
73.9 73.9 ~ 74 fps
F1 2019

F1 2019

2019
med. 1920x1080
100%
GeForce RTX 2070 Super Max-Q:
191  fps
high 1920x1080
100%
GeForce RTX 2070 Super Max-Q:
152 159 ~ 156 fps
ultra 1920x1080
100%
GeForce RTX 2070 Super Max-Q:
141 143 ~ 142 fps
QHD 2560x1440
100%
GeForce RTX 2070 Super Max-Q:
107  fps
4K 3840x2160
100%
GeForce RTX 2070 Super Max-Q:
61  fps
low 1280x720
100%
GeForce RTX 2070 Super Max-Q:
255.2 260.9 ~ 258 fps
med. 1920x1080
100%
GeForce RTX 2070 Super Max-Q:
122.8 141.2 ~ 132 fps
260%
NVIDIA GeForce RTX 3090 Ti:
342.6 342.6 ~ 343 fps
high 1920x1080
100%
GeForce RTX 2070 Super Max-Q:
77.6 97.5 ~ 88 fps
283%
NVIDIA GeForce RTX 3090 Ti:
248.9 248.9 ~ 249 fps
ultra 1920x1080
100%
GeForce RTX 2070 Super Max-Q:
54.8 68.7 ~ 62 fps
285%
NVIDIA GeForce RTX 3090 Ti:
176.6 176.6 ~ 177 fps
QHD 2560x1440
NVIDIA GeForce RTX 3090 Ti:
117.9 117.9 ~ 118 fps
4K 3840x2160
NVIDIA GeForce RTX 3090 Ti:
59.9 59.9 ~ 60 fps
Rage 2

Rage 2

2019
med. 1920x1080
100%
GeForce RTX 2070 Super Max-Q:
119  fps
high 1920x1080
100%
GeForce RTX 2070 Super Max-Q:
97.5 99.5 ~ 99 fps
ultra 1920x1080
100%
GeForce RTX 2070 Super Max-Q:
94.9 97.1 ~ 96 fps
QHD 2560x1440
100%
GeForce RTX 2070 Super Max-Q:
62.8  fps
4K 3840x2160
100%
GeForce RTX 2070 Super Max-Q:
30.1  fps
Anno 1800

Anno 1800

2019
med. 1920x1080
100%
GeForce RTX 2070 Super Max-Q:
112  fps
high 1920x1080
100%
GeForce RTX 2070 Super Max-Q:
84.2 85.5 ~ 85 fps
ultra 1920x1080
100%
GeForce RTX 2070 Super Max-Q:
46.8 47.4 ~ 47 fps
QHD 2560x1440
100%
GeForce RTX 2070 Super Max-Q:
36.6 37 ~ 37 fps
4K 3840x2160
100%
GeForce RTX 2070 Super Max-Q:
21.1 21.5 ~ 21 fps
med. 1920x1080
100%
GeForce RTX 2070 Super Max-Q:
123  fps
high 1920x1080
100%
GeForce RTX 2070 Super Max-Q:
105 113 ~ 109 fps
ultra 1920x1080
100%
GeForce RTX 2070 Super Max-Q:
77 81 ~ 79 fps
QHD 2560x1440
100%
GeForce RTX 2070 Super Max-Q:
54 60 ~ 57 fps
4K 3840x2160
100%
GeForce RTX 2070 Super Max-Q:
29 29 ~ 29 fps
med. 1920x1080
100%
GeForce RTX 2070 Super Max-Q:
183  fps
high 1920x1080
100%
GeForce RTX 2070 Super Max-Q:
151 155 ~ 153 fps
ultra 1920x1080
100%
GeForce RTX 2070 Super Max-Q:
85.8 86.9 ~ 86 fps
QHD 2560x1440
100%
GeForce RTX 2070 Super Max-Q:
66  fps
med. 1920x1080
100%
GeForce RTX 2070 Super Max-Q:
98  fps
high 1920x1080
100%
GeForce RTX 2070 Super Max-Q:
92 110 ~ 101 fps
ultra 1920x1080
100%
GeForce RTX 2070 Super Max-Q:
83 98 ~ 91 fps
QHD 2560x1440
100%
GeForce RTX 2070 Super Max-Q:
70 80 ~ 75 fps
4K 3840x2160
100%
GeForce RTX 2070 Super Max-Q:
43 45 ~ 44 fps
med. 1920x1080
100%
GeForce RTX 2070 Super Max-Q:
92  fps
232%
NVIDIA GeForce RTX 3090 Ti:
213 213 ~ 213 fps
high 1920x1080
100%
GeForce RTX 2070 Super Max-Q:
72 75.4 ~ 74 fps
236%
NVIDIA GeForce RTX 3090 Ti:
175.2 175.2 ~ 175 fps
ultra 1920x1080
100%
GeForce RTX 2070 Super Max-Q:
57.7 60.4 ~ 59 fps
247%
NVIDIA GeForce RTX 3090 Ti:
145.9 145.9 ~ 146 fps
QHD 2560x1440
100%
GeForce RTX 2070 Super Max-Q:
46.7 49.1 ~ 48 fps
260%
NVIDIA GeForce RTX 3090 Ti:
125.3 125.3 ~ 125 fps
4K 3840x2160
100%
GeForce RTX 2070 Super Max-Q:
26.5 29.1 ~ 28 fps
300%
NVIDIA GeForce RTX 3090 Ti:
84.3 84.3 ~ 84 fps
med. 1920x1080
100%
GeForce RTX 2070 Super Max-Q:
144  fps
high 1920x1080
100%
GeForce RTX 2070 Super Max-Q:
140 144 ~ 142 fps
ultra 1920x1080
100%
GeForce RTX 2070 Super Max-Q:
139 143 ~ 141 fps
QHD 2560x1440
100%
GeForce RTX 2070 Super Max-Q:
109  fps
4K 3840x2160
100%
GeForce RTX 2070 Super Max-Q:
61.1  fps
med. 1920x1080
100%
GeForce RTX 2070 Super Max-Q:
137  fps
high 1920x1080
100%
GeForce RTX 2070 Super Max-Q:
101  fps
ultra 1920x1080
100%
GeForce RTX 2070 Super Max-Q:
93.4  fps
QHD 2560x1440
100%
GeForce RTX 2070 Super Max-Q:
63.6  fps
4K 3840x2160
100%
GeForce RTX 2070 Super Max-Q:
34.5  fps
med. 1920x1080
100%
GeForce RTX 2070 Super Max-Q:
135  fps
high 1920x1080
100%
GeForce RTX 2070 Super Max-Q:
118  fps
ultra 1920x1080
100%
GeForce RTX 2070 Super Max-Q:
107  fps
QHD 2560x1440
100%
GeForce RTX 2070 Super Max-Q:
71.6  fps
4K 3840x2160
100%
GeForce RTX 2070 Super Max-Q:
36.4  fps
med. 1920x1080
100%
GeForce RTX 2070 Super Max-Q:
144  fps
high 1920x1080
100%
GeForce RTX 2070 Super Max-Q:
121 135 136 139 ~ 133 fps
ultra 1920x1080
100%
GeForce RTX 2070 Super Max-Q:
113 125 126 130 ~ 124 fps
QHD 2560x1440
100%
GeForce RTX 2070 Super Max-Q:
99.4 100 ~ 100 fps
4K 3840x2160
100%
GeForce RTX 2070 Super Max-Q:
56.8 58.2 ~ 58 fps
Hitman 2

Hitman 2

2018
med. 1920x1080
100%
GeForce RTX 2070 Super Max-Q:
89.2  fps
high 1920x1080
100%
GeForce RTX 2070 Super Max-Q:
83.2  fps
ultra 1920x1080
100%
GeForce RTX 2070 Super Max-Q:
79.7  fps
QHD 2560x1440
100%
GeForce RTX 2070 Super Max-Q:
76.1  fps
4K 3840x2160
100%
GeForce RTX 2070 Super Max-Q:
41.5  fps
med. 1920x1080
100%
GeForce RTX 2070 Super Max-Q:
99  fps
high 1920x1080
100%
GeForce RTX 2070 Super Max-Q:
81  fps
ultra 1920x1080
100%
GeForce RTX 2070 Super Max-Q:
62  fps
QHD 2560x1440
100%
GeForce RTX 2070 Super Max-Q:
47  fps
4K 3840x2160
100%
GeForce RTX 2070 Super Max-Q:
32  fps
low 1280x720
100%
GeForce RTX 2070 Super Max-Q:
133  fps
med. 1920x1080
100%
GeForce RTX 2070 Super Max-Q:
112 118 ~ 115 fps
230%
NVIDIA GeForce RTX 3090 Ti:
265 265 ~ 265 fps
high 1920x1080
100%
GeForce RTX 2070 Super Max-Q:
102 106 110 110 110 ~ 108 fps
238%
NVIDIA GeForce RTX 3090 Ti:
257 257 ~ 257 fps
ultra 1920x1080
100%
GeForce RTX 2070 Super Max-Q:
91 96 99 99 100 ~ 97 fps
252%
NVIDIA GeForce RTX 3090 Ti:
244 244 ~ 244 fps
QHD 2560x1440
100%
GeForce RTX 2070 Super Max-Q:
68 68 ~ 68 fps
271%
NVIDIA GeForce RTX 3090 Ti:
184 184 ~ 184 fps
4K 3840x2160
100%
GeForce RTX 2070 Super Max-Q:
35 36 ~ 36 fps
294%
NVIDIA GeForce RTX 3090 Ti:
106 106 ~ 106 fps
med. 1920x1080
100%
GeForce RTX 2070 Super Max-Q:
113  fps
high 1920x1080
100%
GeForce RTX 2070 Super Max-Q:
102  fps
ultra 1920x1080
100%
GeForce RTX 2070 Super Max-Q:
84.2  fps
QHD 2560x1440
100%
GeForce RTX 2070 Super Max-Q:
55.7  fps
4K 3840x2160
100%
GeForce RTX 2070 Super Max-Q:
27.5  fps
Far Cry 5

Far Cry 5

2018
low 1280x720
100%
GeForce RTX 2070 Super Max-Q:
149  fps
med. 1920x1080
100%
GeForce RTX 2070 Super Max-Q:
118  fps
high 1920x1080
100%
GeForce RTX 2070 Super Max-Q:
111  fps
ultra 1920x1080
100%
GeForce RTX 2070 Super Max-Q:
104  fps
low 1280x720
100%
GeForce RTX 2070 Super Max-Q:
113 119 119 121 121 122 ~ 119 fps
142%
NVIDIA GeForce RTX 3090 Ti:
169.1 169.1 ~ 169 fps
med. 1920x1080
100%
GeForce RTX 2070 Super Max-Q:
97.4 104 104 106 107 109 ~ 105 fps
150%
NVIDIA GeForce RTX 3090 Ti:
158.1 158.1 ~ 158 fps
high 1920x1080
100%
GeForce RTX 2070 Super Max-Q:
82.3 87.6 87.6 88.1 89.3 90 ~ 87 fps
156%
NVIDIA GeForce RTX 3090 Ti:
135.9 135.9 ~ 136 fps
4K 3840x2160
100%
GeForce RTX 2070 Super Max-Q:
67.8 75.4 ~ 72 fps
161%
NVIDIA GeForce RTX 3090 Ti:
115.7 115.7 ~ 116 fps
med. 1920x1080
100%
GeForce RTX 2070 Super Max-Q:
127  fps
high 1920x1080
100%
GeForce RTX 2070 Super Max-Q:
108  fps
ultra 1920x1080
100%
GeForce RTX 2070 Super Max-Q:
75.9  fps
QHD 2560x1440
100%
GeForce RTX 2070 Super Max-Q:
54.4  fps
4K 3840x2160
100%
GeForce RTX 2070 Super Max-Q:
27.9  fps
low 1280x720
100%
GeForce RTX 2070 Super Max-Q:
162  fps
137%
NVIDIA GeForce RTX 3090 Ti:
222 222 ~ 222 fps
med. 1920x1080
100%
GeForce RTX 2070 Super Max-Q:
104 110 ~ 107 fps
211%
NVIDIA GeForce RTX 3090 Ti:
226 226 ~ 226 fps
high 1920x1080
100%
GeForce RTX 2070 Super Max-Q:
80 83.7 ~ 82 fps
227%
NVIDIA GeForce RTX 3090 Ti:
186.1 186.1 ~ 186 fps
QHD 2560x1440
NVIDIA GeForce RTX 3090 Ti:
151.6 151.6 ~ 152 fps
4K 3840x2160
100%
GeForce RTX 2070 Super Max-Q:
33  fps
291%
NVIDIA GeForce RTX 3090 Ti:
96.3 96.3 ~ 96 fps
Fortnite

Fortnite

2018
med. 1920x1080
100%
GeForce RTX 2070 Super Max-Q:
133  fps
high 1920x1080
100%
GeForce RTX 2070 Super Max-Q:
132  fps
ultra 1920x1080
100%
GeForce RTX 2070 Super Max-Q:
108  fps
QHD 2560x1440
100%
GeForce RTX 2070 Super Max-Q:
86.2  fps
4K 3840x2160
100%
GeForce RTX 2070 Super Max-Q:
43  fps
low 1280x720
100%
GeForce RTX 2070 Super Max-Q:
144 148 153 157.8 163 163.9 ~ 155 fps
166%
NVIDIA GeForce RTX 3090 Ti:
257.7 257.7 ~ 258 fps
med. 1366x768
100%
GeForce RTX 2070 Super Max-Q:
132 137 138 146.6 147 148.3 ~ 141 fps
164%
NVIDIA GeForce RTX 3090 Ti:
231.2 231.2 ~ 231 fps
high 1920x1080
100%
GeForce RTX 2070 Super Max-Q:
127 128 132 138 139.5 140.9 ~ 134 fps
162%
NVIDIA GeForce RTX 3090 Ti:
217.1 217.1 ~ 217 fps
ultra 1920x1080
100%
GeForce RTX 2070 Super Max-Q:
120 120 125 129 131.4 132.3 ~ 126 fps
155%
NVIDIA GeForce RTX 3090 Ti:
194.1 195.8 ~ 195 fps
4K 3840x2160
100%
GeForce RTX 2070 Super Max-Q:
103  fps
179%
NVIDIA GeForce RTX 3090 Ti:
184.2 184.2 ~ 184 fps
low 1024x768
100%
GeForce RTX 2070 Super Max-Q:
312 323.7 326.3 348.3 ~ 328 fps
med. 1366x768
100%
GeForce RTX 2070 Super Max-Q:
232 235 235.4 240 254.1 ~ 239 fps
high 1920x1080
100%
GeForce RTX 2070 Super Max-Q:
131 136.2 141 141.4 142 142 152 163.1 ~ 144 fps
274%
NVIDIA GeForce RTX 3090 Ti:
394 394 ~ 394 fps
ultra 1920x1080
100%
GeForce RTX 2070 Super Max-Q:
62.7 70.5 71.9 73.6 74 75.3 75.5 76.2 79.1 92.5 ~ 75 fps
259%
NVIDIA GeForce RTX 3090 Ti:
193.4 193.4 196.3 ~ 194 fps
4K 3840x2160
100%
GeForce RTX 2070 Super Max-Q:
49.7 50.5 52.9 ~ 51 fps
339%
NVIDIA GeForce RTX 3090 Ti:
172.9 172.9 ~ 173 fps
GTA V

GTA V

2015
low 1024x768
100%
GeForce RTX 2070 Super Max-Q:
182 182 182 182 ~ 182 fps
med. 1366x768
100%
GeForce RTX 2070 Super Max-Q:
174 175 176 177 ~ 176 fps
high 1920x1080
100%
GeForce RTX 2070 Super Max-Q:
153 159 160 161 ~ 158 fps
116%
NVIDIA GeForce RTX 3090 Ti:
179.9 185.6 ~ 183 fps
ultra 1920x1080
100%
GeForce RTX 2070 Super Max-Q:
83.4 89.9 91.1 91.3 ~ 89 fps
175%
NVIDIA GeForce RTX 3090 Ti:
151.8 160.7 ~ 156 fps
QHD 2560x1440
NVIDIA GeForce RTX 3090 Ti:
146.4 155.3 ~ 151 fps
4K 3840x2160
100%
GeForce RTX 2070 Super Max-Q:
73.1  fps
248%
NVIDIA GeForce RTX 3090 Ti:
179.5 182.6 ~ 181 fps
low 1280x720
100%
GeForce RTX 2070 Super Max-Q:
420.2  fps
med. 1366x768
100%
GeForce RTX 2070 Super Max-Q:
359.5  fps
high 1366x768
100%
GeForce RTX 2070 Super Max-Q:
329.8  fps
ultra 1920x1080
100%
GeForce RTX 2070 Super Max-Q:
166.5  fps

Average Gaming NVIDIA GeForce RTX 2070 Super Max-Q → 100%

Average Gaming 30-70 fps → 100%

Average Gaming NVIDIA GeForce RTX 3090 Ti → 233%

NVIDIA GeForce RTX 3090 Tilowmed.highultraQHD4K
Ghostwire Tokyo263260261261210113
Tiny Tina's Wonderlands32427723119014381
Cyberpunk 2077 1.621920117315210453
GRID Legends228202173157153121
Elden Ring606060606060
Dying Light 220217115311364
Rainbow Six Extraction411347315290208116
Forza Horizon 523120018812711489
Call of Duty Vanguard19620719115094
Far Cry 617916214213390
F1 2021537470242189115
Assassin´s Creed Valhalla16013812310873
Watch Dogs Legion17115413010870
Mafia Definitive Edition24023117499
Borderlands 320418817314384
Control24020914374
Total War: Three Kingdoms34324917711860
Metro Exodus21317514612584
Shadow of the Tomb Raider265257244184106
X-Plane 11.11169158136116
Final Fantasy XV Benchmark22222618615296
Dota 2 Reborn258231217195184
The Witcher 3394194173
GTA V183156151181
< 30 fps
< 60 fps
< 120 fps
≥ 120 fps


1
10


1
21


1
23


1
18


7
14

1
19
4
NVIDIA GeForce RTX 2070 Super Max-Qlowmed.highultraQHD4K
Cyberpunk 2077 1.0117.867.756.748.5
Yakuza Like a Dragon135.7102.6101.686.1
Call of Duty Black Ops Cold War163.793.686.277.4
Assassin´s Creed Valhalla118817060
Dirt 516095.678.265.1
Watch Dogs Legion100968459
Serious Sam 412787.781.967.7
Horizon Zero Dawn14512010793
Death Stranding164.3114.5104.3101.8
F1 2020258163145104
Gears Tactics272.4165.811184
Doom Eternal23115814113799.651.2
Hunt Showdown1099456.827.4
Escape from Tarkov12111911379.836.8
Red Dead Redemption 2132.88963413321
Star Wars Jedi Fallen Order109999271.335.9
Need for Speed Heat103918260.533.4
Call of Duty Modern Warfare 2019160.91251149672.341
GRID 20191311047060.639.7
Ghost Recon Breakpoint10191685029
FIFA 20271228224253186
Borderlands 311279614423
Control92.6644222
F1 201919115614210761
Total War: Three Kingdoms2581328862
Rage 2119999662.830.1
Anno 180011285473721
The Division 2123109795729
Dirt Rally 2.01831538666
Far Cry New Dawn98101917544
Metro Exodus9274594828
Apex Legends14414214110961.1
Just Cause 413710193.463.634.5
Darksiders III13511810771.636.4
Battlefield V14413312410058
Hitman 289.283.279.776.141.5
Assassin´s Creed Odyssey9981624732
Shadow of the Tomb Raider133115108976836
Monster Hunter World11310284.255.727.5
Far Cry 5149118111104
X-Plane 11.111191058772
Kingdom Come: Deliverance12710875.954.427.9
Final Fantasy XV Benchmark1621078233
Fortnite13313210886.243
Dota 2 Reborn155141134126103
The Witcher 33282391447551
GTA V1821761588973.1
BioShock Infinite420.2359.5329.8166.5
< 30 fps
< 60 fps
< 120 fps
≥ 120 fps


4
19


26
22

1
35
12

5
32
7

11
17
1
10
17
5
1

Eine Liste mit weiteren Spielen und allen Grafikkarten finden Sie auf unserer Seite: Welches Spiel ist mit welcher Grafikkarte spielbar?

v1.28
log 20. 03:32:00

#0 ran 0s before starting gpusingle class +0s ... 0s

#1 checking url part for id 10307 +0s ... 0s

#2 checking url part for id 12736 +0s ... 0s

#3 checking url part for id 11324 +0s ... 0s

#4 redirected to Ajax server, took 1726795920s time from redirect:0 +0s ... 0s

#5 did not recreate cache, as it is less than 5 days old! Created at Thu, 19 Sep 2024 05:16:33 +0200 +0s ... 0s

#6 composed specs +0.004s ... 0.004s

#7 did output specs +0s ... 0.004s

#8 start showIntegratedCPUs +0s ... 0.004s

#9 getting avg benchmarks for device 10307 +0.011s ... 0.015s

#10 got single benchmarks 10307 +0.002s ... 0.017s

#11 getting avg benchmarks for device 12736 +0s ... 0.017s

#12 got single benchmarks 12736 +0s ... 0.017s

#13 getting avg benchmarks for device 11324 +0.001s ... 0.018s

#14 got single benchmarks 11324 +0.001s ... 0.019s

#15 got avg benchmarks for devices +0s ... 0.019s

#16 min, max, avg, median took s +0.027s ... 0.045s

#17 before gaming benchmark output +0s ... 0.045s

#18 Got 643 rows for game benchmarks. +0.036s ... 0.081s

#19 composed SQL query for gamebenchmarks +0s ... 0.081s

#20 got data and put it in $dataArray +0.003s ... 0.084s

#21 benchmarks composed for output. +0.02s ... 0.104s

#22 calculated avg scores. +0s ... 0.104s

#23 return log +0.001s ... 0.105s

Teilen Sie diesen Artikel, um uns zu unterstützen. Jeder Link hilft!
> Notebook Test, Laptop Test und News > Benchmarks / Technik > Benchmarks / Technik > Grafikkarten Vergleich - Head 2 Head
Autor: Klaus Hinum,  8.09.2017 (Update:  1.07.2023)