NVIDIA GeForce GTX 1660 Ti Max-Q vs Intel UHD Graphics 64EUs (Alder Lake 12th Gen) vs NVIDIA GeForce GTX 1650 Ti Max-Q
NVIDIA GeForce GTX 1660 Ti Max-Q ► remove from comparison
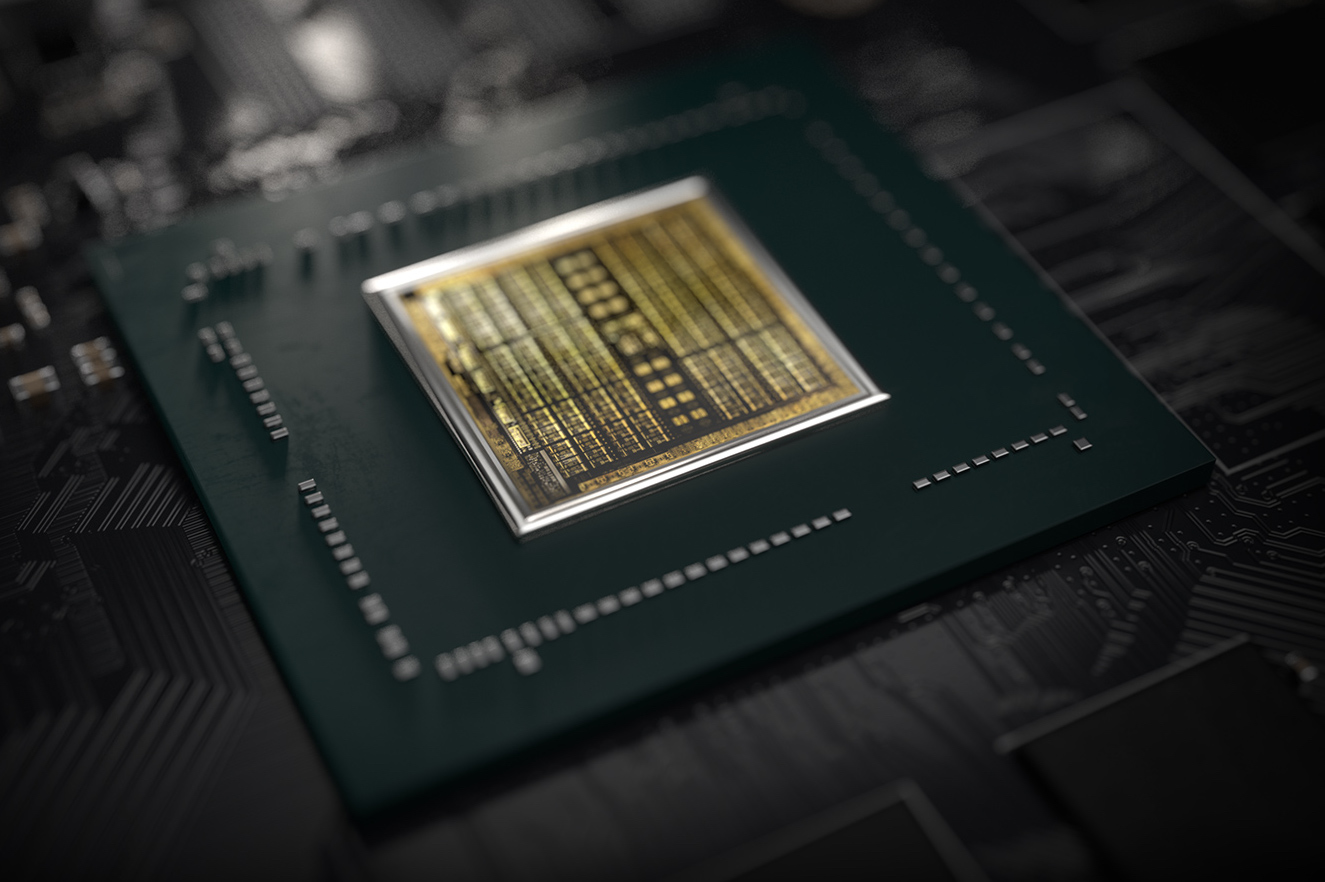
Die Nvidia GeForce GTX 1660 Ti mit Max-Q Design für Laptops ist eine mobile Grafikkarte basierend auf der Turing Architektur. Sie ist gedacht für dünne und leichte Notebook und je nach Kühlungsdesign etwa 10-15% langsamer als eine normale GTX 1660 Ti für Laptops (22% geringerer Basis-Takt und 16% geringerer Boost-Takt). Sie basiert wie die Desktop-Version auf den TU116 Chip und wurde Ende April 2019 vorgestellt. Die GTX 1660 Serie bietet im Unterschied zu den stärkeren RTX 2000er Karten (z.B. RTX 2060 ) keine Raytracing und Tensor Kerne. Die Leistung sollte vergleichbar mit einer GTX 1070 Max-Q sein, jedoch bei deutlich geringerem Stromverbrauch von 60 Watt TGP (versus 80 Watt der Laptop 1660 Ti und 115 Watt der Desktop-Version).
Im April 2020 gab es einen Refresh der GeFroce GTX 1660 Ti Max-Q mit dem Codenamen N18E-G0-A1. Die Specs bleiben aber vergleichbar, der Chip ist im selben Package erhältlich wie die neuen RTX Chips (z.b. RTX 2070 Super ).
Bei der Turing Architektur gab es auch auf der Ebene der CUDA-Kerne deutliche Verbesserungen. Float und INT Operationen können nun gleichzeitig ausgeführt werden, der Cache wurde vereinheitlicht und verbessert und Adaptive Shading eingeführt. Nvidia spricht dadurch von einer bis zu 50% höheren Leistung pro Kern im Vergleich zu Pascal.
Der Stromverbrauch ist mit 60 Watt TGP (Total Graphics Power) von Nvidia spezifiziert und damit 20 Watt unterhalb der normalen (Max-P) Version . Dadurch eignet sich die GPU auch für dünnere Gaming-Laptops. Der verbaute TU116 Chip wird bei TSMC im 12nm FFN Verfahren gefertigt.
Intel UHD Graphics 64EUs (Alder Lake 12th Gen) ► remove from comparison
Die Intel Xe Graphics 64 EUS (Alder Lake) ist eine Prozessorgrafikkarte, die Anfang 2021 vorgestellt wurde. Sie basiert auf die Xe Architektur (Gen12) und bietet in Alder Lake CPUs nur 64 der 96 verbauten Execution Units (EUs). Die GPU wird im verbesserten 10nm Verfahren (Intel 7) bei Intel gefertigt. Die Rohleistung ist vergleichbar mit der RAdeon RX Vega 8 (in Ryzen 5000 CPUs), jedoch ist die Spieleleistung geringer durch den schwächeren Treibersupport (in 2022). Nur anspruchslose Spiele wie Grid Legends sind flüssig spielbar in niedrigen Settings (siehe unten).
NVIDIA GeForce GTX 1650 Ti Max-Q ► remove from comparison
Die Nvidia GeForce GTX 1650 Ti Max-Q (N18P-G62) für Laptops ist die Stromsparversion der mobilen GeForce GTX 1650 Ti mit reduzierten Taktraten und Stromverbrauch. Die GTX 1650 Serie bietet im Unterschied zu den stärkeren RTX 2000er Karten (z.B. RTX 2060 ) keine Raytracing und Tensor Kerne. Die Leistung sollte leicht oberhalb einer mobilen GTX 1650 liegen.
Aktuell wissen wir von zwei Varianten mit 35 und 40 Watt TGP und unterschiedlichen Taktraten von 1035 - 1200 bzw 1200 - 1365 MHz. Beide Versionen sind jedoch deutlich unter der noromalen Max-P-Variante mit 1350 - 1485 MHz und 50 Watt TGP angesiedelt. Der Speicher wird mit 1250 MHz = 10.000 MHz effektiv (Gbps) getaktet. Es kann aber eventuell auch Varianten mit 1500 MHz (non Max-Q Taktraten) geben.
Bei der Turing Architektur gab es auch auf der Ebene der CUDA-Kerne deutliche Verbesserungen. Float und INT Operationen können nun gleichzeitig ausgeführt werden, der Cache wurde vereinheitlicht und verbessert und Adaptive Shading eingeführt. Nvidia spricht dadurch von einer bis zu 50% höheren Leistung pro Kern im Vergleich zu Pascal.
Im Gegensatz zu den größeren Turing Chips (wie den TU116 der GTX 1660 Ti) bietet der TU117 nur die älteren NVENC Videoenkodierung der Pascal / Volta Generation.
Nvidia spezifiziert einen Stromverbrauch von 35 bzw 40 Watt (im Vergleich zu den 50 - 80 Watt TGP der normalen GTX 1650 Ti Mobile ) für die Grafikkarte und damit 15 Watt mehr als die langsamere und effizientere Max-Q Variante der GTX1650 . Der TU117 Chip wird bei TSMC im 12nm FFN Verfahren gefertigt.
NVIDIA GeForce GTX 1660 Ti Max-Q Intel UHD Graphics 64EUs (Alder Lake 12th Gen) NVIDIA GeForce GTX 1650 Ti Max-Q GeForce GTX 1600 Serie Codename N18E-G0 Alder Lake Xe N18P-G62 Max-Q Architektur Turing Gen. 12 Turing Pipelines 1536 - unified 64 - unified 1024 - unified Kerntakt 1140 - 1335 (Boost) MHz 1400 (Boost) MHz 1035 - 1200 (Boost) MHz Speichertakt 12000 MHz 10000 MHz Speicherbandbreite 192 Bit 128 Bit Speichertyp GDDR6 GDDR6 Max. Speichergröße 6 GB 4 GB Shared Memory nein ja nein API DirectX 12_1, OpenGL 4.6 DirectX 12_1, OpenGL 4.6 DirectX 12_1, OpenGL 4.6 Stromverbrauch 60 Watt 35 Watt Herstellungsprozess 12 nm 10 nm 12 nm Notebookgröße mittel (15.4" z.B.) mittel (15.4" z.B.) Erscheinungsdatum 23.04.2019 04.01.2022 02.04.2020 Herstellerseite www.nvidia.com www.nvidia.com Features QuickSync
Benchmarks Performance Rating - 3DMark 11 + Fire Strike + Time Spy - GeForce GTX 1660 Ti Max-Q
6 pt (18%)
...
NVIDIA GeForce GTX 1660 Ti Max-Q
...
max:
Performance Rating - 3DMark 11 + Fire Strike + Time Spy - UHD Graphics 64EUs
1.7 pt (5%)
...
Intel UHD Graphics 64EUs (Alder Lake 12th Gen)
...
max:
3DMark - 3DMark Time Spy Score
min: 4547 avg: 5197 median: 5072 (15%) max: 6395 Points
min: 935 avg: 1219 median: 1259 (4%) max: 1537 Points
GPU TDP ? TDP 52 W 100% 54%
min: 3015 avg: 3309 median: 3235.5 (9%) max: 3709 Points
GPU TDP ? TDP 21 W TDP 35 W TDP 52 W 84% 92% 100% 43%
3DMark - 3DMark Time Spy Graphics
min: 4867 avg: 5089 median: 5084.5 (13%) max: 5440 Points
min: 830 avg: 1067 median: 1110 (3%) max: 1336 Points
GPU TDP ? TDP 52 W 100% 47%
min: 2886 avg: 3139 median: 3098 (8%) max: 3526 Points
GPU TDP ? TDP 21 W TDP 35 W TDP 52 W 88% 92% 100% 40%
3DMark - 3DMark Ice Storm Unlimited Graphics
min: 220799 avg: 314100 median: 306910 (31%) max: 414592 Points
min: 192047 avg: 233684 median: 209544 (21%) max: 279392 Points
421834 Points (43%)
GPU TDP ? TDP 35 W 61% 100%
3DMark - 3DMark Ice Storm Extreme Graphics
min: 76153 avg: 110626 median: 110626 (14%) max: 145099 Points
min: 44105 avg: 77363 median: 82608 (10%) max: 92077 Points
34142 Points (4%)
3DMark - 3DMark Cloud Gate Score
min: 16807 avg: 29350 median: 33027 (35%) max: 39942 Points
min: 15139 avg: 19114 median: 18950.5 (20%) max: 24767 Points
min: 18333 avg: 22116 median: 22895 (24%) max: 26161 Points
GPU TDP ? TDP 21 W TDP 35 W 91% 95% 100%
3DMark - 3DMark Cloud Gate Graphics
min: 38321 avg: 63736 median: 63086 (17%) max: 89505 Points
min: 19949 avg: 22251 median: 21761 (6%) max: 27185 Points
min: 29035 avg: 42978 median: 47657 (13%) max: 53539 Points
GPU TDP ? TDP 21 W TDP 35 W 75% 98% 100%
3DMark - 3DMark Fire Strike Standard Score
min: 10103 avg: 11548 median: 11615 (20%) max: 12739 Points
min: 2275 avg: 3417 median: 3566.5 (6%) max: 4318 Points
GPU TDP ? TDP 52 W 100% 66%
min: 7292 avg: 7764 median: 7700 (13%) max: 8659 Points
GPU TDP ? TDP 21 W TDP 35 W TDP 52 W 86% 92% 100% 53%
3DMark - 3DMark Fire Strike Standard Graphics
min: 12903 avg: 13356 median: 13355 (15%) max: 13870 Points
min: 2592 avg: 3671 median: 3894.5 (4%) max: 4567 Points
GPU TDP ? TDP 52 W 100% 62%
min: 8024 avg: 8542 median: 8564 (10%) max: 9573 Points
GPU TDP ? TDP 21 W TDP 35 W TDP 52 W 88% 92% 100% 52%
3DMark - 3DMark Ice Storm Graphics
min: 59373 avg: 104094 median: 86295 (10%) max: 166615 Points
min: 59484 avg: 116753 median: 120342 (14%) max: 180662 Points
3DMark - 3DMark Wild Life Unlimited
10921 Points (6%)
21348 Points (11%)
GPU TDP ? TDP 35 W 51% 100%
3DMark - 3DMark Wild Life Extreme Unlimited
min: 1719 avg: 2343 median: 2342.5 (3%) max: 2966 Points
3DMark - 3DMark Night Raid
min: 14009 avg: 15923 median: 15922.5 (15%) max: 17836 Points
3DMark - 3DMark Night Raid Graphics Score
min: 15138 avg: 16847 median: 16846.5 (6%) max: 18555 Points
3DMark 11 - 3DM11 Performance Score
min: 12279 avg: 15364 median: 15913 (22%) max: 17377 Points
min: 4116 avg: 5265 median: 5469.5 (8%) max: 6259 Points
GPU TDP ? TDP 52 W 100% 69%
min: 10610 avg: 11524 median: 11398 (16%) max: 13121 Points
GPU TDP ? TDP 21 W TDP 35 W TDP 52 W 83% 93% 100% 53%
3DMark 11 - 3DM11 Performance GPU
min: 17010 avg: 17711 median: 17439 (15%) max: 18653 Points
min: 3886 avg: 4735 median: 5038.5 (4%) max: 5566 Points
GPU TDP ? TDP 52 W 100% 55%
min: 11055 avg: 11796 median: 11538 (10%) max: 13343 Points
GPU TDP ? TDP 21 W TDP 35 W TDP 52 W 87% 91% 100% 46%
3DMark Vantage + NVIDIA GeForce GTX 1660 Ti Max-Q 3DMark Vantage - 3DM Vant. Perf. total
31845 Points (9%)
3DM Vant. Perf. total + Intel UHD Graphics 64EUs (Alder Lake 12th Gen)
min: 15454 avg: 18595 median: 18748.5 (5%) max: 22757 Points
3DM Vant. Perf. total + NVIDIA GeForce GTX 1650 Ti Max-Q
31116 Points (9%)
3DM Vant. Perf. GPU no PhysX + NVIDIA GeForce GTX 1660 Ti Max-Q 3DMark Vantage - 3DM Vant. Perf. GPU no PhysX
34951 Points (19%)
3DM Vant. Perf. GPU no PhysX + Intel UHD Graphics 64EUs (Alder Lake 12th Gen)
min: 12674 avg: 15409 median: 16126 (9%) max: 18466 Points
3DM Vant. Perf. GPU no PhysX + NVIDIA GeForce GTX 1650 Ti Max-Q
33179 Points (18%)
3DMark 05 - 3DMark 05 - Standard
min: 26272 avg: 35662 median: 36705 (40%) max: 41013 Points
3DMark 06 3DMark 06 - Standard 1280x1024 + NVIDIA GeForce GTX 1660 Ti Max-Q
min: 24029 avg: 28247 median: 25211 (33%) max: 38536 Points
3DMark 06 - Standard 1280x1024 + Intel UHD Graphics 64EUs (Alder Lake 12th Gen)
min: 22825 avg: 26660 median: 25362 (33%) max: 33042 Points
3DMark 06 - Standard 1280x1024 + NVIDIA GeForce GTX 1650 Ti Max-Q
30266 Points (40%)
Unigine Valley 1.0 - Unigine Valley 1.0 DX
min: 10 avg: 11.2 median: 11.7 (4%) max: 12.8 fps
SPECviewperf 12 + Intel UHD Graphics 64EUs (Alder Lake 12th Gen) SPECviewperf 12 - specvp12 sw-03
min: 38.3 avg: 40.7 median: 38.9 (10%) max: 44.5 fps
specvp12 snx-02 + Intel UHD Graphics 64EUs (Alder Lake 12th Gen) SPECviewperf 12 - specvp12 snx-02
min: 2.81 avg: 3.4 median: 3.4 (1%) max: 3.89 fps
specvp12 showcase-01 + Intel UHD Graphics 64EUs (Alder Lake 12th Gen) SPECviewperf 12 - specvp12 showcase-01
min: 13.1 avg: 14.4 median: 15.1 (3%) max: 15.9 fps
specvp12 mediacal-01 + Intel UHD Graphics 64EUs (Alder Lake 12th Gen) SPECviewperf 12 - specvp12 mediacal-01
min: 4.98 avg: 7 median: 8.3 (2%) max: 9.12 fps
specvp12 maya-04 + Intel UHD Graphics 64EUs (Alder Lake 12th Gen) SPECviewperf 12 - specvp12 maya-04
min: 22.8 avg: 28.4 median: 31.4 (9%) max: 33.4 fps
specvp12 energy-01 + Intel UHD Graphics 64EUs (Alder Lake 12th Gen) SPECviewperf 12 - specvp12 energy-01
min: 0.24 avg: 0.5 median: 0.6 (1%) max: 0.78 fps
specvp12 creo-01 + Intel UHD Graphics 64EUs (Alder Lake 12th Gen) SPECviewperf 12 - specvp12 creo-01
min: 6.44 avg: 17.5 median: 18.4 (7%) max: 21.1 fps
specvp12 catia-04 + Intel UHD Graphics 64EUs (Alder Lake 12th Gen) SPECviewperf 12 - specvp12 catia-04
min: 22.8 avg: 27.6 median: 29.9 (5%) max: 34.5 fps
specvp12 3dsmax-05 + Intel UHD Graphics 64EUs (Alder Lake 12th Gen) SPECviewperf 12 - specvp12 3dsmax-05
min: 29.5 avg: 32.6 median: 34.2 (6%) max: 36.2 fps
SPECviewperf 13 specvp13 sw-04 + Intel UHD Graphics 64EUs (Alder Lake 12th Gen) SPECviewperf 13 - specvp13 sw-04
min: 46.6 avg: 49.2 median: 47.2 (13%) max: 53.9 fps
specvp13 snx-03 + Intel UHD Graphics 64EUs (Alder Lake 12th Gen) SPECviewperf 13 - specvp13 snx-03
min: 5.06 avg: 6 median: 6.1 (1%) max: 6.68 fps
specvp13 showcase-02 + Intel UHD Graphics 64EUs (Alder Lake 12th Gen) SPECviewperf 13 - specvp13 showcase-02
min: 13.1 avg: 14.3 median: 15 (3%) max: 15.7 fps
specvp13 medical-02 + Intel UHD Graphics 64EUs (Alder Lake 12th Gen) SPECviewperf 13 - specvp13 medical-02
min: 4.48 avg: 7.2 median: 8.6 (2%) max: 10.9 fps
specvp13 maya-05 + Intel UHD Graphics 64EUs (Alder Lake 12th Gen) SPECviewperf 13 - specvp13 maya-05
min: 32.1 avg: 36.8 median: 38.2 (4%) max: 41.3 fps
specvp13 energy-02 + Intel UHD Graphics 64EUs (Alder Lake 12th Gen) SPECviewperf 13 - specvp13 energy-02
min: 0.92 avg: 1.9 median: 2.6 (1%) max: 2.82 fps
specvp13 creo-02 + Intel UHD Graphics 64EUs (Alder Lake 12th Gen) SPECviewperf 13 - specvp13 creo-02
min: 26.5 avg: 30.3 median: 32.4 (5%) max: 33.1 fps
specvp13 catia-05 + Intel UHD Graphics 64EUs (Alder Lake 12th Gen) SPECviewperf 13 - specvp13 catia-05
min: 32.7 avg: 39.6 median: 42.8 (5%) max: 49.6 fps
specvp13 3dsmax-06 + Intel UHD Graphics 64EUs (Alder Lake 12th Gen) SPECviewperf 13 - specvp13 3dsmax-06
min: 29.3 avg: 32.4 median: 34.1 (6%) max: 36 fps
SPECviewperf 2020 specvp2020 solidworks-05 4k + Intel UHD Graphics 64EUs (Alder Lake 12th Gen) SPECviewperf 2020 - specvp2020 solidworks-05 4k
min: 5.05 avg: 5.1 median: 5.1 (2%) max: 5.1 fps
specvp2020 snx-04 4k + Intel UHD Graphics 64EUs (Alder Lake 12th Gen) SPECviewperf 2020 - specvp2020 snx-04 4k
min: 5.69 avg: 6 median: 5.9 (1%) max: 6.61 fps
specvp2020 medical-03 4k + Intel UHD Graphics 64EUs (Alder Lake 12th Gen) SPECviewperf 2020 - specvp2020 medical-03 4k
min: 0.78 avg: 1.2 median: 0.8 (1%) max: 2.54 fps
specvp2020 maya-06 4k + Intel UHD Graphics 64EUs (Alder Lake 12th Gen) SPECviewperf 2020 - specvp2020 maya-06 4k
min: 15.3 avg: 16.8 median: 15.4 (3%) max: 21.2 fps
specvp2020 energy-03 4k + Intel UHD Graphics 64EUs (Alder Lake 12th Gen) SPECviewperf 2020 - specvp2020 energy-03 4k
min: 0.52 avg: 1 median: 0.8 (0%) max: 1.9 fps
specvp2020 creo-03 4k + Intel UHD Graphics 64EUs (Alder Lake 12th Gen) SPECviewperf 2020 - specvp2020 creo-03 4k
min: 9.17 avg: 10.2 median: 9.4 (4%) max: 12.7 fps
specvp2020 catia-06 4k + Intel UHD Graphics 64EUs (Alder Lake 12th Gen) SPECviewperf 2020 - specvp2020 catia-06 4k
min: 5.24 avg: 5.8 median: 5.3 (3%) max: 7.63 fps
specvp2020 3dsmax-07 4k + Intel UHD Graphics 64EUs (Alder Lake 12th Gen) SPECviewperf 2020 - specvp2020 3dsmax-07 4k
min: 6.95 avg: 7.4 median: 7 (3%) max: 8.65 fps
Cinebench R10 Cinebench R10 Shading (32bit) + NVIDIA GeForce GTX 1660 Ti Max-Q Cinebench R10 - Cinebench R10 Shading (32bit)
min: 6820 avg: 9290 median: 8562.5 (6%) max: 13213 Points
Cinebench R10 Shading (32bit) + Intel UHD Graphics 64EUs (Alder Lake 12th Gen)
min: 14413 avg: 17390 median: 17783 (13%) max: 19969 Points
Cinebench R11.5 Cinebench R11.5 OpenGL 64 Bit + NVIDIA GeForce GTX 1660 Ti Max-Q Cinebench R11.5 - Cinebench R11.5 OpenGL 64 Bit
min: 49.83 avg: 59.5 median: 59.5 (20%) max: 69.2 fps
Cinebench R11.5 OpenGL 64 Bit + Intel UHD Graphics 64EUs (Alder Lake 12th Gen)
min: 68.25 avg: 83.7 median: 81.5 (27%) max: 95.55 fps
Cinebench R11.5 OpenGL 64 Bit + NVIDIA GeForce GTX 1650 Ti Max-Q
64.9 fps (21%)
Cinebench R15 + NVIDIA GeForce GTX 1660 Ti Max-Q Cinebench R15 - Cinebench R15 OpenGL 64 Bit
min: 78.2 avg: 100.5 median: 96.9 (6%) max: 130.7 fps
Cinebench R15 OpenGL 64 Bit + Intel UHD Graphics 64EUs (Alder Lake 12th Gen)
min: 74.5 avg: 93.6 median: 88.9 (5%) max: 117.3 fps
GPU TDP ? TDP 52 W 88% 100%
Cinebench R15 OpenGL 64 Bit + NVIDIA GeForce GTX 1650 Ti Max-Q
min: 83.9 avg: 132.8 median: 140 (8%) max: 145 fps
GPU TDP ? TDP 21 W TDP 35 W TDP 52 W 77% 94% 100% 81%
Cinebench R15 OpenGL Ref. Match 64 Bit + NVIDIA GeForce GTX 1660 Ti Max-Q Cinebench R15 - Cinebench R15 OpenGL Ref. Match 64 Bit
99.6 % (100%)
Cinebench R15 OpenGL Ref. Match 64 Bit + Intel UHD Graphics 64EUs (Alder Lake 12th Gen)
97.8 % (98%)
GPU TDP ? TDP 52 W 100% 99%
Cinebench R15 OpenGL Ref. Match 64 Bit + NVIDIA GeForce GTX 1650 Ti Max-Q
99.6 % (100%)
GPU TDP ? TDP 21 W TDP 35 W TDP 52 W 99% 100% 100% 98%
GFXBench - GFXBench 5.0 4K Aztec Ruins High Tier Offscreen
17.9 fps (7%)
GFXBench - GFXBench 5.0 Aztec Ruins High Tier Offscreen
110.2 fps (20%)
42.4 fps (8%)
GFXBench - GFXBench 5.0 Aztec Ruins Normal Tier Offscreen
253.8 fps (19%)
118.5 fps (9%)
GFXBench - GFXBench Car Chase Offscreen
227.4 fps (26%)
101.4 fps (11%)
GFXBench 3.1 - GFXBench Manhattan ES 3.1 Offscreen
345.8 fps (7%)
130.9 fps (3%)
GFXBench 3.0 - GFXBench 3.0 Manhattan Offscreen
360.6 fps (21%)
234.9 fps (14%)
GFXBench (DX / GLBenchmark) 2.7 + NVIDIA GeForce GTX 1660 Ti Max-Q GFXBench (DX / GLBenchmark) 2.7 - GFXBench T-Rex HD Offscreen C24Z16
943 fps (8%)
GFXBench T-Rex HD Offscreen C24Z16 + Intel UHD Graphics 64EUs (Alder Lake 12th Gen)
320.3 fps (3%)
Basemark GPU 1.2 - Basemark GPU 1.2 Vulkan Official Medium Offscreen 1080
min: 104.6 avg: 156.6 median: 147.6 (1%) max: 289 fps
GPU TDP ? TDP 52 W 83% 100%
Basemark GPU 1.2 - Basemark GPU 1.2 Vulkan Official High Offscreen 2160
min: 3.64 avg: 8.7 median: 9.4 (2%) max: 11.6 fps
GPU TDP ? TDP 52 W 100% 38%
Geekbench 6.3 - Geekbench 6.3 GPU OpenCL
min: 8359 avg: 10360 median: 11201 (3%) max: 12297 Points
GPU TDP ? TDP 52 W 82% 100%
Geekbench 6.3 - Geekbench 6.3 GPU Vulkan
min: 10236 avg: 12651 median: 13850.5 (4%) max: 14850 Points
GPU TDP ? TDP 52 W 84% 100%
LuxMark v2.0 64Bit - LuxMark v2.0 Room GPU
2141 Samples/s (10%)
min: 448 avg: 562 median: 558 (3%) max: 743 Samples/s
9546 Samples/s (43%)
LuxMark v2.0 64Bit - LuxMark v2.0 Sala GPU
4254 Samples/s (7%)
min: 1164 avg: 1623 median: 1717 (3%) max: 2059 Samples/s
10809 Samples/s (19%)
ComputeMark v2.1 - ComputeMark v2.1 Result
10027 Points (11%)
min: 1724 avg: 2185 median: 2353 (3%) max: 2657 Points
6297 Points (7%)
Power Consumption - Furmark Stress Test Power Consumption - external Monitor *
min: 77.6 avg: 86.3 median: 86.3 (12%) max: 95 Watt
min: 28.6 avg: 45.1 median: 48.6 (7%) max: 62.1 Watt
GPU TDP ? TDP 52 W 100% 100%
min: 61.5 avg: 66.7 median: 65.2 (9%) max: 75 Watt
GPU TDP ? TDP 52 W 100% 100%
Power Consumption - The Witcher 3 Power Consumption - external Monitor *
min: 92 avg: 96.6 median: 96.6 (13%) max: 101.2 Watt
min: 24.4 avg: 46 median: 47.6 (7%) max: 66.5 Watt
GPU TDP ? TDP 52 W 100% 100%
min: 59.8 avg: 63.3 median: 63 (9%) max: 67.3 Watt
GPU TDP ? TDP 52 W 100% 101%
Power Consumption - Witcher 3 Power Consumption *
min: 94.2 avg: 104.8 median: 106.9 (24%) max: 121 Watt
min: 34.5 avg: 41.5 median: 34.9 (8%) max: 55.2 Watt
GPU TDP ? TDP 52 W 100% 109%
min: 60.6 avg: 72 median: 68.6 (15%) max: 94 Watt
GPU TDP ? TDP 21 W TDP 35 W TDP 52 W 100% 105% 101% 107%
Power Consumption - Witcher 3 ultra Power Efficiency
min: 0.4388 avg: 0.5 median: 0.5 (43%) max: 0.537 fps per Watt
min: 0.2023 avg: 0.2 median: 0.2 (20%) max: 0.25 fps per Watt
GPU TDP ? TDP 52 W 100% 56%
min: 0.3568 avg: 0.4 median: 0.4 (40%) max: 0.522 fps per Watt
GPU TDP ? TDP 21 W TDP 35 W TDP 52 W 86% 100% 86% 49%
Power Consumption - Witcher 3 ultra Power Efficiency - external Monitor
min: 0.4822 avg: 0.5 median: 0.5 (44%) max: 0.578 fps per Watt
min: 0.1789 avg: 0.2 median: 0.2 (18%) max: 0.25 fps per Watt
GPU TDP ? TDP 52 W 100% 80%
min: 0.4161 avg: 0.4 median: 0.4 (37%) max: 0.4716 fps per Watt
GPU TDP ? TDP 52 W 100% 70%
Power Consumption - Cyberpunk 2077 Power Consumption 150cd *
52.3 Watt (17%)
Power Consumption - Cyberpunk 2077 Power Consumption - external Monitor *
46.1 Watt (6%)
Power Consumption - Cyberpunk 2077 ultra Power Efficiency
0.2 fps per Watt (23%)
Emissions Witcher 3 Fan Noise + NVIDIA GeForce GTX 1660 Ti Max-Q Emissions - Witcher 3 Fan Noise
min: 34 avg: 43.4 median: 43.7 (70%) max: 53.8 dB(A)
Witcher 3 Fan Noise + Intel UHD Graphics 64EUs (Alder Lake 12th Gen)
min: 36.2 avg: 39.5 median: 38.3 (61%) max: 45.2 dB(A)
GPU TDP ? TDP 52 W 100% 95%
Witcher 3 Fan Noise + NVIDIA GeForce GTX 1650 Ti Max-Q
min: 34.5 avg: 40.9 median: 42 (67%) max: 47 dB(A)
GPU TDP ? TDP 21 W TDP 35 W TDP 52 W 100% 81% 91% 94%
Clock Speed - GPU Clock Witcher 3 ultra
1501 MHz (59%)
min: 1340 avg: 1405 median: 1405 (55%) max: 1470 MHz
GPU TDP ? TDP 35 W 97% 100%
Clock Speed - GPU Clock Speed Furmark
1062 MHz (42%)
998 MHz (40%)
Average Benchmarks NVIDIA GeForce GTX 1660 Ti Max-Q → 100% n=19 Average Benchmarks Intel UHD Graphics 64EUs (Alder Lake 12th Gen) → 54% n=19 Average Benchmarks NVIDIA GeForce GTX 1650 Ti Max-Q → 112% n=19
- Bereich der Benchmarkergebnisse für diese Grafikkarte
- Durchschnittliche Benchmarkergebnisse für diese Grafikkarte
* Smaller numbers mean a higher performance
1 This benchmark is not used for the average calculation
Spiele-Benchmarks Die folgenden Benchmarks basieren auf unseren Spieletests mit Testnotebooks. Die Performance dieser Grafikkarte bei den gelisteten Spielen ist abhängig von der verwendeten CPU, Speicherausstattung, Treiber und auch Betriebssystem. Dadurch müssen die untenstehenden Werte nicht repräsentativ sein. Detaillierte Informationen über das verwendete System sehen Sie nach einem Klick auf den fps-Wert.
UHD Graphics 64EUs:
26.9 fps
UHD Graphics 64EUs:
23.1 fps
UHD Graphics 64EUs:
16.7 fps
UHD Graphics 64EUs:
12.8 fps
UHD Graphics 64EUs:
7.8 fps
UHD Graphics 64EUs:
12.4 fps
UHD Graphics 64EUs:
9.6 fps
UHD Graphics 64EUs:
24.2 [X] NiPoGi CK10 1030131
Intel Core i5-12450H 1.5GHz
UHD Graphics 64EUs
min:
20 fps, P1:
20 fps, max:
27 fps
24.6 [X] Geekom Mini IT12 1050579
Intel Core i5-12450H 1.5GHz
UHD Graphics 64EUs
min:
20 fps, P1:
20 fps, max:
28 fps
27.8 28.6 [X] NiPoGi AD08 1057599
Intel Core i7-12650H 1.7GHz
UHD Graphics 64EUs
min:
23 fps, P1:
23 fps, max:
33 fps
31.1 [X] NiPoGi AD08 1057599
Intel Core i7-12650H 1.7GHz
UHD Graphics 64EUs
min:
26 fps, P1:
26 fps, max:
36 fps
32.3 [X] NiPoGi AD08 1057599
Intel Core i7-12650H 1.7GHz
UHD Graphics 64EUs
min:
27 fps, P1:
27 fps, max:
37 fps
~ 28 fps
UHD Graphics 64EUs:
21.6 [X] NiPoGi CK10 1030131
Intel Core i5-12450H 1.5GHz
UHD Graphics 64EUs
min:
19 fps, P1:
17 fps, max:
24 fps
22.1 [X] Geekom Mini IT12 1050579
Intel Core i5-12450H 1.5GHz
UHD Graphics 64EUs
min:
19 fps, P1:
19 fps, max:
24 fps
25.3 26.2 [X] NiPoGi AD08 1057599
Intel Core i7-12650H 1.7GHz
UHD Graphics 64EUs
min:
22 fps, P1:
22 fps, max:
29 fps
28.3 [X] NiPoGi AD08 1057599
Intel Core i7-12650H 1.7GHz
UHD Graphics 64EUs
min:
24 fps, P1:
24 fps, max:
31 fps
29.2 [X] NiPoGi AD08 1057599
Intel Core i7-12650H 1.7GHz
UHD Graphics 64EUs
min:
25 fps, P1:
24 fps, max:
32 fps
~ 25 fps
UHD Graphics 64EUs:
14.8 [X] NiPoGi CK10 1030131
Intel Core i5-12450H 1.5GHz
UHD Graphics 64EUs
min:
12 fps, P1:
12 fps, max:
16 fps
15.2 [X] Geekom Mini IT12 1050579
Intel Core i5-12450H 1.5GHz
UHD Graphics 64EUs
min:
12 fps, P1:
12 fps, max:
16 fps
17.7 18.2 [X] NiPoGi AD08 1057599
Intel Core i7-12650H 1.7GHz
UHD Graphics 64EUs
min:
15 fps, P1:
15 fps, max:
20 fps
19.5 [X] NiPoGi AD08 1057599
Intel Core i7-12650H 1.7GHz
UHD Graphics 64EUs
min:
16 fps, P1:
16 fps, max:
21 fps
19.9 [X] NiPoGi AD08 1057599
Intel Core i7-12650H 1.7GHz
UHD Graphics 64EUs
min:
16 fps, P1:
15 fps, max:
22 fps
~ 18 fps
UHD Graphics 64EUs:
14.1 [X] NiPoGi AD08 1057599
Intel Core i7-12650H 1.7GHz
UHD Graphics 64EUs
min:
12 fps, P1:
11 fps, max:
16 fps
15.1 [X] NiPoGi AD08 1057599
Intel Core i7-12650H 1.7GHz
UHD Graphics 64EUs
min:
12 fps, P1:
12 fps, max:
17 fps
15.2 [X] NiPoGi AD08 1057599
Intel Core i7-12650H 1.7GHz
UHD Graphics 64EUs
min:
13 fps, P1:
12 fps, max:
18 fps
~ 15 fps
UHD Graphics 64EUs:
23.3 [X] MSI Katana 17 B13VFK Intel Core i7-13620H 1.8GHz
UHD Graphics 64EUs
P0.1:
15.6 fpsP1:
16.8 fps
fps
UHD Graphics 64EUs:
21.4 [X] MSI Katana 17 B13VFK Intel Core i7-13620H 1.8GHz
UHD Graphics 64EUs
P0.1:
10.6 fpsP1:
14.8 fps
fps
UHD Graphics 64EUs:
16.7 [X] MSI Katana 17 B13VFK Intel Core i7-13620H 1.8GHz
UHD Graphics 64EUs
P0.1:
8.5 fpsP1:
10.6 fps
fps
UHD Graphics 64EUs:
12.4 [X] MSI Katana 17 B13VFK Intel Core i7-13620H 1.8GHz
UHD Graphics 64EUs
min:
2.7 fps, P0.1:
2.73 fps, P1:
3.04 fps, max:
27.5 fps
fps
UHD Graphics 64EUs:
24.4 [X] MSI Katana 17 B13VFK Intel Core i7-13620H 1.8GHz
UHD Graphics 64EUs
min:
14.2 fps, P0.1:
18.7 fps, P1:
20.7 fps, max:
82.7 fps
fps
UHD Graphics 64EUs:
17.5 [X] MSI Katana 17 B13VFK Intel Core i7-13620H 1.8GHz
UHD Graphics 64EUs
min:
11.1 fps, P0.1:
14 fps, P1:
15.1 fps, max:
42.4 fps
fps
UHD Graphics 64EUs:
12.5 [X] MSI Katana 17 B13VFK Intel Core i7-13620H 1.8GHz
UHD Graphics 64EUs
min:
7.61 fps, P0.1:
9.77 fps, P1:
11.2 fps, max:
44.9 fps
fps
UHD Graphics 64EUs:
17.1 [X] MSI Katana 17 B13VFK Intel Core i7-13620H 1.8GHz
UHD Graphics 64EUs
min:
9.3 fps, P0.1:
9.96 fps, P1:
13.4 fps, max:
74.5 fps
fps
UHD Graphics 64EUs:
11.6 [X] MSI Katana 17 B13VFK Intel Core i7-13620H 1.8GHz
UHD Graphics 64EUs
min:
7.09 fps, P0.1:
7.42 fps, P1:
8.97 fps, max:
20.7 fps
fps
UHD Graphics 64EUs:
11.7 (!) [X] MSI Katana 17 B13VFK Intel Core i7-13620H 1.8GHz
UHD Graphics 64EUs
min:
9.19 fps, P0.1:
9.23 fps, P1:
9.62 fps, max:
16.9 fps
fps
UHD Graphics 64EUs:
33.4 [X] MSI Katana 17 B13VFK Intel Core i7-13620H 1.8GHz
UHD Graphics 64EUs
min:
12.5 fps, P0.1:
12.6 fps, P1:
15.9 fps, max:
220 fps
fps
UHD Graphics 64EUs:
20.1 [X] MSI Katana 17 B13VFK Intel Core i7-13620H 1.8GHz
UHD Graphics 64EUs
min:
7.77 fps, P0.1:
7.81 fps, P1:
10.2 fps, max:
224 fps
fps
UHD Graphics 64EUs:
18.2 [X] MSI Katana 17 B13VFK Intel Core i7-13620H 1.8GHz
UHD Graphics 64EUs
min:
6.49 fps, P0.1:
6.59 fps, P1:
7.54 fps, max:
176.1 fps
fps
UHD Graphics 64EUs:
19.7 [X] MSI Katana 17 B13VFK Intel Core i7-13620H 1.8GHz
UHD Graphics 64EUs
fps
UHD Graphics 64EUs:
13.6 [X] MSI Katana 17 B13VFK Intel Core i7-13620H 1.8GHz
UHD Graphics 64EUs
fps
UHD Graphics 64EUs:
20.8 [X] MSI Katana 17 B13VFK Intel Core i7-13620H 1.8GHz
UHD Graphics 64EUs
min:
15.6 fps, P0.1:
15.6 fps, P1:
16.4 fps, max:
31.3 fps
fps
UHD Graphics 64EUs:
17.1 [X] MSI Katana 17 B13VFK Intel Core i7-13620H 1.8GHz
UHD Graphics 64EUs
min:
1.665 fps, P0.1:
8.82 fps, P1:
14.4 fps, max:
97.4 fps
fps
UHD Graphics 64EUs:
14.1 [X] MSI Katana 17 B13VFK Intel Core i7-13620H 1.8GHz
UHD Graphics 64EUs
min:
6.56 fps, P0.1:
7.05 fps, P1:
11.8 fps, max:
51.3 fps
fps
UHD Graphics 64EUs:
22.4 (!) [X] MSI Katana 17 B13VFK Intel Core i7-13620H 1.8GHz
UHD Graphics 64EUs
min:
18 fps, P0.1:
18 fps, P1:
19.1 fps, max:
27.3 fps
fps
UHD Graphics 64EUs:
19.5 (!) [X] MSI Katana 17 B13VFK Intel Core i7-13620H 1.8GHz
UHD Graphics 64EUs
min:
14.5 fps, P0.1:
15.1 fps, P1:
16.1 fps, max:
30 fps
fps
UHD Graphics 64EUs:
18.5 (!) [X] MSI Katana 17 B13VFK Intel Core i7-13620H 1.8GHz
UHD Graphics 64EUs
min:
15.3 fps, P0.1:
15.4 fps, P1:
15.9 fps, max:
32.7 fps
fps
UHD Graphics 64EUs:
24 [X] MSI Katana 17 B13VFK Intel Core i7-13620H 1.8GHz
UHD Graphics 64EUs
min:
14 fps
fps
UHD Graphics 64EUs:
21 [X] MSI Katana 17 B13VFK Intel Core i7-13620H 1.8GHz
UHD Graphics 64EUs
min:
13 fps
fps
UHD Graphics 64EUs:
18 [X] MSI Katana 17 B13VFK Intel Core i7-13620H 1.8GHz
UHD Graphics 64EUs
min:
7 fps
fps
UHD Graphics 64EUs:
13.8 [X] MSI Katana 17 B13VFK Intel Core i7-13620H 1.8GHz
UHD Graphics 64EUs
min:
10.2 fps, P0.1:
10.5 fps, P1:
11.1 fps, max:
23.1 fps
fps
UHD Graphics 64EUs:
27.1 [X] NiPoGi CK10 959964
Intel Core i5-12450H 1.5GHz
UHD Graphics 64EUs
min:
21 fps, P1:
21 fps, max:
31 fps
27.3 [X] Geekom Mini IT12 959964
Intel Core i5-12450H 1.5GHz
UHD Graphics 64EUs
min:
23 fps, P1:
20 fps, max:
31 fps
27.9 31.7 [X] NiPoGi AD08 959964
Intel Core i7-12650H 1.7GHz
UHD Graphics 64EUs
min:
25 fps, P1:
23 fps, max:
36 fps
34.4 [X] NiPoGi AD08 959964
Intel Core i7-12650H 1.7GHz
UHD Graphics 64EUs
min:
29 fps, P1:
27 fps, max:
40 fps
35.2 [X] NiPoGi AD08 959964
Intel Core i7-12650H 1.7GHz
UHD Graphics 64EUs
min:
30 fps, P1:
27 fps, max:
42 fps
37.6 ~ 32 fps
UHD Graphics 64EUs:
24.3 [X] NiPoGi CK10 959964
Intel Core i5-12450H 1.5GHz
UHD Graphics 64EUs
min:
19 fps, P1:
19 fps, max:
27 fps
24.5 [X] Geekom Mini IT12 959964
Intel Core i5-12450H 1.5GHz
UHD Graphics 64EUs
min:
19 fps, P1:
18 fps, max:
27 fps
24.9 29.4 [X] NiPoGi AD08 959964
Intel Core i7-12650H 1.7GHz
UHD Graphics 64EUs
min:
24 fps, P1:
22 fps, max:
33 fps
31.3 [X] NiPoGi AD08 959964
Intel Core i7-12650H 1.7GHz
UHD Graphics 64EUs
min:
27 fps, P1:
24 fps, max:
36 fps
31.9 [X] NiPoGi AD08 959964
Intel Core i7-12650H 1.7GHz
UHD Graphics 64EUs
min:
27 fps, P1:
24 fps, max:
37 fps
34 ~ 29 fps
UHD Graphics 64EUs:
17.2 [X] NiPoGi CK10 959964
Intel Core i5-12450H 1.5GHz
UHD Graphics 64EUs
min:
14 fps, P1:
13 fps, max:
19 fps
17.5 [X] Geekom Mini IT12 959964
Intel Core i5-12450H 1.5GHz
UHD Graphics 64EUs
min:
14 fps, P1:
13 fps, max:
20 fps
17.7 21.1 [X] NiPoGi AD08 959964
Intel Core i7-12650H 1.7GHz
UHD Graphics 64EUs
min:
17 fps, P1:
16 fps, max:
23 fps
21.9 [X] NiPoGi AD08 959964
Intel Core i7-12650H 1.7GHz
UHD Graphics 64EUs
min:
18 fps, P1:
17 fps, max:
25 fps
22.1 [X] NiPoGi AD08 959964
Intel Core i7-12650H 1.7GHz
UHD Graphics 64EUs
min:
19 fps, P1:
17 fps, max:
25 fps
24.7 ~ 20 fps
UHD Graphics 64EUs:
13.4 [X] NiPoGi CK10 959964
Intel Core i5-12450H 1.5GHz
UHD Graphics 64EUs
min:
9 fps, P1:
10 fps, max:
15 fps
13.5 [X] Geekom Mini IT12 959964
Intel Core i5-12450H 1.5GHz
UHD Graphics 64EUs
min:
11 fps, P1:
10 fps, max:
16 fps
13.6 16.6 [X] NiPoGi AD08 959964
Intel Core i7-12650H 1.7GHz
UHD Graphics 64EUs
min:
13 fps, P1:
13 fps, max:
19 fps
17.3 [X] NiPoGi AD08 959964
Intel Core i7-12650H 1.7GHz
UHD Graphics 64EUs
min:
14 fps, P1:
14 fps, max:
20 fps
17.3 [X] NiPoGi AD08 959964
Intel Core i7-12650H 1.7GHz
UHD Graphics 64EUs
min:
14 fps, P1:
13 fps, max:
20 fps
18.8 ~ 16 fps
UHD Graphics 64EUs:
63.2 [X] MSI Katana 17 B13VFK Intel Core i7-13620H 1.8GHz
UHD Graphics 64EUs
min:
15.7 fps, P0.1:
46.5 fps, P1:
50.1 fps, max:
203 fps
fps
UHD Graphics 64EUs:
38.9 [X] MSI Katana 17 B13VFK Intel Core i7-13620H 1.8GHz
UHD Graphics 64EUs
min:
17.7 fps, P0.1:
18.6 fps, P1:
30.4 fps, max:
244 fps
fps
UHD Graphics 64EUs:
31.4 [X] MSI Katana 17 B13VFK Intel Core i7-13620H 1.8GHz
UHD Graphics 64EUs
min:
8.68 fps, P0.1:
11.2 fps, P1:
24 fps, max:
147.9 fps
fps
UHD Graphics 64EUs:
28.1 [X] MSI Katana 17 B13VFK Intel Core i7-13620H 1.8GHz
UHD Graphics 64EUs
min:
14.9 fps, P0.1:
15.8 fps, P1:
22.6 fps, max:
190.9 fps
fps
UHD Graphics 64EUs:
18.6 [X] Asus TUF Dash F15 FX517ZR Intel Core i7-12650H 1.7GHz
UHD Graphics 64EUs
min:
7.55 fps, P0.1:
7.91 fps, P1:
9.37 fps, max:
174.2 fps
fps
UHD Graphics 64EUs:
18.6 [X] Asus TUF Dash F15 FX517ZR Intel Core i7-12650H 1.7GHz
UHD Graphics 64EUs
min:
7.44 fps, P0.1:
7.84 fps, P1:
9.5 fps, max:
168.9 fps
fps
UHD Graphics 64EUs:
18.4 [X] Asus TUF Dash F15 FX517ZR Intel Core i7-12650H 1.7GHz
UHD Graphics 64EUs
min:
7.56 fps, P0.1:
7.98 fps, P1:
9.46 fps, max:
167.5 fps
fps
UHD Graphics 64EUs:
18.1 [X] Asus TUF Dash F15 FX517ZR Intel Core i7-12650H 1.7GHz
UHD Graphics 64EUs
min:
8.31 fps, P0.1:
8.37 fps, P1:
9.04 fps, max:
161.1 fps
fps
UHD Graphics 64EUs:
8.3 8.7 10.6 11 12.1 12.4 [X] Asus TUF Dash F15 FX517ZR Intel Core i7-12650H 1.7GHz
UHD Graphics 64EUs
~ 11 fps
UHD Graphics 64EUs:
6 6.4 6.7 8.1 9.3 9.7 [X] Asus TUF Dash F15 FX517ZR Intel Core i7-12650H 1.7GHz
UHD Graphics 64EUs
~ 8 fps
UHD Graphics 64EUs:
18 [X] Asus TUF Dash F15 FX517ZR Intel Core i7-12650H 1.7GHz
UHD Graphics 64EUs
min:
12.2 fps, max:
26.4 fps
fps
UHD Graphics 64EUs:
14.7 [X] Asus TUF Dash F15 FX517ZR Intel Core i7-12650H 1.7GHz
UHD Graphics 64EUs
min:
10.5 fps, max:
20.2 fps
fps
UHD Graphics 64EUs:
11.3 [X] Asus TUF Dash F15 FX517ZR Intel Core i7-12650H 1.7GHz
UHD Graphics 64EUs
min:
8.6 fps, max:
15 fps
fps
UHD Graphics 64EUs:
56.1 [X] Asus TUF Dash F15 FX517ZR Intel Core i7-12650H 1.7GHz
UHD Graphics 64EUs
min:
43.1 fps, max:
66.6 fps
fps
UHD Graphics 64EUs:
41.6 [X] Asus TUF Dash F15 FX517ZR Intel Core i7-12650H 1.7GHz
UHD Graphics 64EUs
min:
32 fps, max:
48.9 fps
fps
UHD Graphics 64EUs:
34.4 [X] Asus TUF Dash F15 FX517ZR Intel Core i7-12650H 1.7GHz
UHD Graphics 64EUs
min:
29.1 fps, max:
39.7 fps
fps
UHD Graphics 64EUs:
25.3 [X] Asus TUF Dash F15 FX517ZR Intel Core i7-12650H 1.7GHz
UHD Graphics 64EUs
min:
20 fps, max:
30.1 fps
fps
UHD Graphics 64EUs:
20.2 [X] Asus TUF Dash F15 FX517ZR Intel Core i7-12650H 1.7GHz
UHD Graphics 64EUs
min:
16.5 fps, max:
23.5 fps
fps
UHD Graphics 64EUs:
35.5 [X] MSI Katana 17 B13VFK Intel Core i7-13620H 1.8GHz
UHD Graphics 64EUs
min:
15.3 fps, P0.1:
23.6 fps, P1:
27.5 fps, max:
66.6 fps
fps
UHD Graphics 64EUs:
29.1 [X] MSI Katana 17 B13VFK Intel Core i7-13620H 1.8GHz
UHD Graphics 64EUs
min:
12.4 fps, P0.1:
15.2 fps, P1:
20.1 fps, max:
72.2 fps
fps
UHD Graphics 64EUs:
24.7 [X] MSI Katana 17 B13VFK Intel Core i7-13620H 1.8GHz
UHD Graphics 64EUs
min:
11.4 fps, P0.1:
16.2 fps, P1:
19.7 fps, max:
62.1 fps
fps
UHD Graphics 64EUs:
20.3 [X] MSI Katana 17 B13VFK Intel Core i7-13620H 1.8GHz
UHD Graphics 64EUs
min:
10.3 fps, P0.1:
11.5 fps, P1:
14.7 fps, max:
59.9 fps
fps
UHD Graphics 64EUs:
33 [X] Asus TUF Dash F15 FX517ZR Intel Core i7-12650H 1.7GHz
UHD Graphics 64EUs
min:
21 fps, max:
42 fps
fps
UHD Graphics 64EUs:
25 [X] Asus TUF Dash F15 FX517ZR Intel Core i7-12650H 1.7GHz
UHD Graphics 64EUs
min:
16 fps, max:
32 fps
fps
UHD Graphics 64EUs:
24 [X] Asus TUF Dash F15 FX517ZR Intel Core i7-12650H 1.7GHz
UHD Graphics 64EUs
min:
15 fps, max:
31 fps
fps
UHD Graphics 64EUs:
13.1 [X] NiPoGi CK10 Intel Core i5-12450H 1.5GHz
UHD Graphics 64EUs
min:
8.88 fps, P0.1:
9.02 fps, P1:
10.1 fps, max:
20.8 fps
18.8 [X] Asus TUF Dash F15 FX517ZR Intel Core i7-12650H 1.7GHz
UHD Graphics 64EUs
min:
12.6 fps, P0.1:
12.8 fps, P1:
14.1 fps, max:
32.5 fps
~ 16 fps
UHD Graphics 64EUs:
11.3 [X] NiPoGi CK10 Intel Core i5-12450H 1.5GHz
UHD Graphics 64EUs
min:
7.4 fps, P0.1:
7.53 fps, P1:
8.25 fps, max:
20.9 fps
16.6 [X] Asus TUF Dash F15 FX517ZR Intel Core i7-12650H 1.7GHz
UHD Graphics 64EUs
min:
11.1 fps, P0.1:
11.1 fps, P1:
12.7 fps, max:
28.7 fps
~ 14 fps
UHD Graphics 64EUs:
8.9 [X] NiPoGi CK10 Intel Core i5-12450H 1.5GHz
UHD Graphics 64EUs
min:
5.93 fps, P0.1:
5.96 fps, P1:
8.1 fps, max:
20.2 fps
13.2 [X] Asus TUF Dash F15 FX517ZR Intel Core i7-12650H 1.7GHz
UHD Graphics 64EUs
min:
8.36 fps, P0.1:
8.47 fps, P1:
9.64 fps, max:
32.6 fps
~ 11 fps
UHD Graphics 64EUs:
6.6 [X] NiPoGi CK10 Intel Core i5-12450H 1.5GHz
UHD Graphics 64EUs
min:
5.04 fps, P0.1:
5.1 fps, P1:
5.61 fps, max:
11.3 fps
fps
UHD Graphics 64EUs:
12.1 [X] Asus TUF Dash F15 FX517ZR Intel Core i7-12650H 1.7GHz
UHD Graphics 64EUs
min:
9.17 fps, P0.1:
9.22 fps, P1:
9.71 fps, max:
20.2 fps
fps
UHD Graphics 64EUs:
55 [X] Asus TUF Dash F15 FX517ZR Intel Core i7-12650H 1.7GHz
UHD Graphics 64EUs
fps
UHD Graphics 64EUs:
25 [X] Asus TUF Dash F15 FX517ZR Intel Core i7-12650H 1.7GHz
UHD Graphics 64EUs
fps
UHD Graphics 64EUs:
22 [X] Asus TUF Dash F15 FX517ZR Intel Core i7-12650H 1.7GHz
UHD Graphics 64EUs
fps
UHD Graphics 64EUs:
30 [X] Asus TUF Dash F15 FX517ZR Intel Core i7-12650H 1.7GHz
UHD Graphics 64EUs
min:
23 fps, max:
39 fps
fps
UHD Graphics 64EUs:
19 [X] Asus TUF Dash F15 FX517ZR Intel Core i7-12650H 1.7GHz
UHD Graphics 64EUs
min:
16 fps, max:
23 fps
fps
UHD Graphics 64EUs:
15 [X] Asus TUF Dash F15 FX517ZR Intel Core i7-12650H 1.7GHz
UHD Graphics 64EUs
min:
12 fps, max:
19 fps
fps
UHD Graphics 64EUs:
13 [X] Asus TUF Dash F15 FX517ZR Intel Core i7-12650H 1.7GHz
UHD Graphics 64EUs
min:
11 fps, max:
17 fps
fps
UHD Graphics 64EUs:
44.8 [X] Asus TUF Dash F15 FX517ZR Intel Core i7-12650H 1.7GHz
UHD Graphics 64EUs
min:
37 fps, max:
48 fps
fps
UHD Graphics 64EUs:
21.6 [X] Asus TUF Dash F15 FX517ZR Intel Core i7-12650H 1.7GHz
UHD Graphics 64EUs
min:
18 fps, max:
23 fps
fps
UHD Graphics 64EUs:
17.5 [X] Asus TUF Dash F15 FX517ZR Intel Core i7-12650H 1.7GHz
UHD Graphics 64EUs
min:
16 fps, max:
19 fps
fps
UHD Graphics 64EUs:
14.7 [X] Asus TUF Dash F15 FX517ZR Intel Core i7-12650H 1.7GHz
UHD Graphics 64EUs
min:
13 fps, max:
17 fps
fps
UHD Graphics 64EUs:
68.4 [X] NiPoGi CK10 874931
Intel Core i5-12450H 1.5GHz
UHD Graphics 64EUs
min:
49 fps, P1:
49 fps, max:
79 fps
69.2 [X] Geekom Mini IT12 874931
Intel Core i5-12450H 1.5GHz
UHD Graphics 64EUs
min:
52 fps, P1:
52 fps, max:
80 fps
71.5 76.9 [X] NiPoGi AD08 874931
Intel Core i7-12650H 1.7GHz
UHD Graphics 64EUs
min:
61 fps, P1:
62 fps, max:
90 fps
82.9 [X] NiPoGi AD08 874931
Intel Core i7-12650H 1.7GHz
UHD Graphics 64EUs
min:
66 fps, P1:
63 fps, max:
95 fps
84.8 [X] NiPoGi AD08 874931
Intel Core i7-12650H 1.7GHz
UHD Graphics 64EUs
min:
66 fps, P1:
62 fps, max:
97 fps
92.1 96.3 [X] Asus TUF Dash F15 FX517ZR 874931
Intel Core i7-12650H 1.7GHz
UHD Graphics 64EUs
min:
76 fps, P1:
74 fps, max:
111 fps
~ 80 fps
UHD Graphics 64EUs:
30.4 [X] NiPoGi CK10 874931
Intel Core i5-12450H 1.5GHz
UHD Graphics 64EUs
min:
25 fps, P1:
23 fps, max:
34 fps
31.1 [X] Geekom Mini IT12 874931
Intel Core i5-12450H 1.5GHz
UHD Graphics 64EUs
min:
26 fps, P1:
23 fps, max:
34 fps
31.4 34.8 [X] NiPoGi AD08 874931
Intel Core i7-12650H 1.7GHz
UHD Graphics 64EUs
min:
30 fps, P1:
26 fps, max:
39 fps
38 [X] NiPoGi AD08 874931
Intel Core i7-12650H 1.7GHz
UHD Graphics 64EUs
min:
31 fps, P1:
27 fps, max:
43 fps
39 [X] NiPoGi AD08 874931
Intel Core i7-12650H 1.7GHz
UHD Graphics 64EUs
min:
32 fps, P1:
21 fps, max:
45 fps
42.6 44.1 [X] Asus TUF Dash F15 FX517ZR 874931
Intel Core i7-12650H 1.7GHz
UHD Graphics 64EUs
min:
14 fps, P1:
35 fps, max:
51 fps
~ 36 fps
UHD Graphics 64EUs:
24.4 [X] NiPoGi CK10 874931
Intel Core i5-12450H 1.5GHz
UHD Graphics 64EUs
min:
20 fps, P1:
20 fps, max:
26 fps
24.8 [X] Geekom Mini IT12 874931
Intel Core i5-12450H 1.5GHz
UHD Graphics 64EUs
min:
21 fps, P1:
19 fps, max:
27 fps
25.2 27.6 [X] NiPoGi AD08 874931
Intel Core i7-12650H 1.7GHz
UHD Graphics 64EUs
min:
23 fps, P1:
21 fps, max:
30 fps
30.3 [X] NiPoGi AD08 874931
Intel Core i7-12650H 1.7GHz
UHD Graphics 64EUs
min:
25 fps, P1:
23 fps, max:
33 fps
30.7 [X] NiPoGi AD08 874931
Intel Core i7-12650H 1.7GHz
UHD Graphics 64EUs
min:
25 fps, P1:
18 fps, max:
33 fps
33.2 35.4 [X] Asus TUF Dash F15 FX517ZR 874931
Intel Core i7-12650H 1.7GHz
UHD Graphics 64EUs
min:
29 fps, P1:
29 fps, max:
38 fps
~ 29 fps
UHD Graphics 64EUs:
16 [X] NiPoGi CK10 874931
Intel Core i5-12450H 1.5GHz
UHD Graphics 64EUs
min:
13 fps, P1:
12 fps, max:
18 fps
16.1 [X] Geekom Mini IT12 874931
Intel Core i5-12450H 1.5GHz
UHD Graphics 64EUs
min:
13 fps, P1:
12 fps, max:
18 fps
16.2 19.7 [X] NiPoGi AD08 874931
Intel Core i7-12650H 1.7GHz
UHD Graphics 64EUs
min:
16 fps, P1:
15 fps, max:
22 fps
20.7 [X] NiPoGi AD08 874931
Intel Core i7-12650H 1.7GHz
UHD Graphics 64EUs
min:
17 fps, P1:
16 fps, max:
23 fps
20.9 [X] NiPoGi AD08 874931
Intel Core i7-12650H 1.7GHz
UHD Graphics 64EUs
min:
16 fps, P1:
13 fps, max:
23 fps
22.5 24.1 [X] Asus TUF Dash F15 FX517ZR 874931
Intel Core i7-12650H 1.7GHz
UHD Graphics 64EUs
min:
19 fps, P1:
19 fps, max:
27 fps
~ 20 fps
UHD Graphics 64EUs:
71 [X] Asus TUF Dash F15 FX517ZR Intel Core i7-12650H 1.7GHz
UHD Graphics 64EUs
fps
UHD Graphics 64EUs:
30.9 [X] Asus TUF Dash F15 FX517ZR Intel Core i7-12650H 1.7GHz
UHD Graphics 64EUs
fps
UHD Graphics 64EUs:
24.6 [X] Asus TUF Dash F15 FX517ZR Intel Core i7-12650H 1.7GHz
UHD Graphics 64EUs
fps
UHD Graphics 64EUs:
22.5 [X] Asus TUF Dash F15 FX517ZR Intel Core i7-12650H 1.7GHz
UHD Graphics 64EUs
fps
UHD Graphics 64EUs:
13.8 [X] Asus TUF Dash F15 FX517ZR Intel Core i7-12650H 1.7GHz
UHD Graphics 64EUs
fps
GeForce GTX 1650 Ti Max-Q:
63.7 fps
GeForce GTX 1650 Ti Max-Q:
33 fps
GeForce GTX 1650 Ti Max-Q:
26.8 fps
GeForce GTX 1650 Ti Max-Q:
22.2 fps
GeForce GTX 1650 Ti Max-Q:
70 77 ~ 74 fps
GeForce GTX 1650 Ti Max-Q:
45 48 ~ 47 fps
GeForce GTX 1650 Ti Max-Q:
32 36 [X] MSI Summit E15 A11SCST High Performance
Intel Core i7-1185G7 3GHz
GeForce GTX 1650 Ti Max-Q
min:
9 fps, max:
78 fps
37 ~ 35 fps
GeForce GTX 1650 Ti Max-Q:
28 29 ~ 29 fps
GeForce GTX 1650 Ti Max-Q:
24 fps
GeForce GTX 1650 Ti Max-Q:
14 fps
GeForce GTX 1650 Ti Max-Q:
97.5 105.1 ~ 101 fps
GeForce GTX 1650 Ti Max-Q:
42.5 46.9 ~ 45 fps
GeForce GTX 1650 Ti Max-Q:
40.5 44.8 ~ 43 fps
GeForce GTX 1650 Ti Max-Q:
35.7 39.6 ~ 38 fps
GeForce GTX 1650 Ti Max-Q:
25.4 fps
GeForce GTX 1650 Ti Max-Q:
12.4 fps
GeForce GTX 1650 Ti Max-Q:
100 fps
GeForce GTX 1650 Ti Max-Q:
55.6 fps
GeForce GTX 1650 Ti Max-Q:
44.1 fps
GeForce GTX 1650 Ti Max-Q:
40.2 fps
GeForce GTX 1650 Ti Max-Q:
25.8 fps
GeForce GTX 1650 Ti Max-Q:
10.6 fps
UHD Graphics 64EUs:
31 [X] Asus TUF Dash F15 FX517ZR Intel Core i7-12650H 1.7GHz
UHD Graphics 64EUs
min:
22 fps, P0.1:
23 fps, P1:
24 fps, max:
142 fps
fps
GeForce GTX 1650 Ti Max-Q:
47 63 [X] MSI Summit E15 A11SCST Intel Core i7-1185G7 3GHz
GeForce GTX 1650 Ti Max-Q
min:
14 fps, P0.1:
28 fps, P1:
44 fps, max:
115 fps
74 ~ 61 fps
UHD Graphics 64EUs:
18 [X] Asus TUF Dash F15 FX517ZR Intel Core i7-12650H 1.7GHz
UHD Graphics 64EUs
min:
14 fps, P0.1:
14 fps, P1:
15 fps, max:
107 fps
fps
GeForce GTX 1650 Ti Max-Q:
30 38 [X] MSI Summit E15 A11SCST Intel Core i7-1185G7 3GHz
GeForce GTX 1650 Ti Max-Q
min:
18 fps, P0.1:
22 fps, P1:
26 fps, max:
92 fps
45 ~ 38 fps
UHD Graphics 64EUs:
15 [X] Asus TUF Dash F15 FX517ZR Intel Core i7-12650H 1.7GHz
UHD Graphics 64EUs
min:
11 fps, P0.1:
11 fps, P1:
12 fps, max:
82 fps
fps
GeForce GTX 1650 Ti Max-Q:
19 24 [X] MSI Summit E15 A11SCST Intel Core i7-1185G7 3GHz
GeForce GTX 1650 Ti Max-Q
min:
10 fps, P0.1:
12 fps, P1:
16 fps, max:
88 fps
32 ~ 25 fps
GeForce GTX 1650 Ti Max-Q:
5 12 14 ~ 10 fps
GeForce GTX 1650 Ti Max-Q:
12 fps
GeForce GTX 1650 Ti Max-Q:
5 fps
UHD Graphics 64EUs:
41.4 [X] Asus TUF Dash F15 FX517ZR Intel Core i7-12650H 1.7GHz
UHD Graphics 64EUs
min:
30 fps, P0.1:
31.5 fps, P1:
35.1 fps, max:
51.7 fps
fps
UHD Graphics 64EUs:
17.6 [X] Asus TUF Dash F15 FX517ZR Intel Core i7-12650H 1.7GHz
UHD Graphics 64EUs
min:
13.5 fps, P0.1:
13.8 fps, P1:
14.3 fps, max:
22.7 fps
fps
UHD Graphics 64EUs:
14.6 [X] Asus TUF Dash F15 FX517ZR Intel Core i7-12650H 1.7GHz
UHD Graphics 64EUs
min:
11.1 fps, P0.1:
11.4 fps, P1:
12 fps, max:
18.2 fps
fps
GeForce GTX 1650 Ti Max-Q:
70 [X] MSI Summit E15 A11SCST Intel Core i7-1185G7 3GHz
GeForce GTX 1650 Ti Max-Q
min:
31 fps, P0.1:
43 fps, P1:
51 fps, max:
108 fps
89 ~ 80 fps
GeForce GTX 1650 Ti Max-Q:
43 [X] MSI Summit E15 A11SCST Intel Core i7-1185G7 3GHz
GeForce GTX 1650 Ti Max-Q
min:
19 fps, P0.1:
25 fps, P1:
33 fps, max:
59 fps
54 ~ 49 fps
GeForce GTX 1650 Ti Max-Q:
37 [X] MSI Summit E15 A11SCST Intel Core i7-1185G7 3GHz
GeForce GTX 1650 Ti Max-Q
min:
19 fps, P0.1:
22 fps, P1:
29 fps, max:
54 fps
39 [X] MSI Summit E15 A11SCST High Performance
Intel Core i7-1185G7 3GHz
GeForce GTX 1650 Ti Max-Q
min:
14 fps, P0.1:
17 fps, P1:
30 fps, max:
39 fps
47 ~ 41 fps
GeForce GTX 1650 Ti Max-Q:
11 21 ~ 16 fps
GeForce GTX 1650 Ti Max-Q:
14 fps
GeForce GTX 1650 Ti Max-Q:
210 fps
GeForce GTX 1650 Ti Max-Q:
202 fps
GeForce GTX 1650 Ti Max-Q:
192.9 fps
GeForce GTX 1650 Ti Max-Q:
165.2 fps
GeForce GTX 1650 Ti Max-Q:
129.6 fps
GeForce GTX 1650 Ti Max-Q:
79.6 fps
GeForce GTX 1650 Ti Max-Q:
222 fps
GeForce GTX 1650 Ti Max-Q:
124 fps
GeForce GTX 1650 Ti Max-Q:
112.9 fps
GeForce GTX 1650 Ti Max-Q:
103.4 fps
GeForce GTX 1650 Ti Max-Q:
70 fps
GeForce GTX 1650 Ti Max-Q:
30.7 fps
GeForce GTX 1650 Ti Max-Q:
93.9 fps
GeForce GTX 1650 Ti Max-Q:
46.2 fps
GeForce GTX 1650 Ti Max-Q:
43 fps
GeForce GTX 1650 Ti Max-Q:
27.9 fps
GeForce GTX 1650 Ti Max-Q:
14.1 fps
GeForce GTX 1650 Ti Max-Q:
94.8 [X] MSI Summit E15 A11SCST Intel Core i7-1185G7 3GHz
GeForce GTX 1650 Ti Max-Q
min:
6.8 fps, P0.1:
19 fps, P1:
48.4 fps, max:
187 fps
115.7 ~ 105 fps
GeForce GTX 1650 Ti Max-Q:
47.5 [X] MSI Summit E15 A11SCST Intel Core i7-1185G7 3GHz
GeForce GTX 1650 Ti Max-Q
min:
7.4 fps, P0.1:
10.4 fps, P1:
23.4 fps, max:
86.8 fps
51.9 ~ 50 fps
GeForce GTX 1650 Ti Max-Q:
36.8 [X] MSI Summit E15 A11SCST Intel Core i7-1185G7 3GHz
GeForce GTX 1650 Ti Max-Q
min:
12.2 fps, P0.1:
12.7 fps, P1:
19.3 fps, max:
92.5 fps
40.8 ~ 39 fps
GeForce GTX 1650 Ti Max-Q:
20.9 [X] MSI Summit E15 A11SCST Intel Core i7-1185G7 3GHz
GeForce GTX 1650 Ti Max-Q
min:
6.91 fps, P0.1:
8.01 fps, P1:
9.96 fps, max:
62.5 fps
30.5 ~ 26 fps
GeForce GTX 1650 Ti Max-Q:
22.3 fps
GeForce GTX 1650 Ti Max-Q:
154.1 fps
GeForce GTX 1650 Ti Max-Q:
59.8 fps
GeForce GTX 1650 Ti Max-Q:
31.9 fps
GeForce GTX 1650 Ti Max-Q:
23.6 fps
100%
GeForce GTX 1660 Ti Max-Q:
55.1 fps
49%
UHD Graphics 64EUs:
27 [X] MSI Katana 17 B13VFK Intel Core i7-13620H 1.8GHz
UHD Graphics 64EUs
min:
18.1 fps, P0.1:
18.6 fps, P1:
24.8 fps, max:
29.3 fps
fps
100%
GeForce GTX 1660 Ti Max-Q:
49.4 fps
25%
UHD Graphics 64EUs:
12.5 [X] MSI Katana 17 B13VFK Intel Core i7-13620H 1.8GHz
UHD Graphics 64EUs
min:
10.2 fps, P0.1:
10.3 fps, P1:
11.4 fps, max:
13.5 fps
fps
100%
GeForce GTX 1660 Ti Max-Q:
37.1 fps
100%
GeForce GTX 1660 Ti Max-Q:
25.3 fps
100%
GeForce GTX 1660 Ti Max-Q:
119 fps
76%
GeForce GTX 1650 Ti Max-Q:
80 99 ~ 90 fps
100%
GeForce GTX 1660 Ti Max-Q:
78 fps
64%
GeForce GTX 1650 Ti Max-Q:
42 58 ~ 50 fps
100%
GeForce GTX 1660 Ti Max-Q:
65 fps
62%
GeForce GTX 1650 Ti Max-Q:
35 36 [X] MSI Summit E15 A11SCST High Performance
Intel Core i7-1185G7 3GHz
GeForce GTX 1650 Ti Max-Q
min:
24 fps, max:
57 fps
48 ~ 40 fps
100%
GeForce GTX 1660 Ti Max-Q:
51 fps
71%
GeForce GTX 1650 Ti Max-Q:
32 40 ~ 36 fps
GeForce GTX 1650 Ti Max-Q:
30 fps
GeForce GTX 1650 Ti Max-Q:
8 fps
100%
GeForce GTX 1660 Ti Max-Q:
136.1 fps
31%
UHD Graphics 64EUs:
41.7 [X] Asus TUF Dash F15 FX517ZR Intel Core i7-12650H 1.7GHz
UHD Graphics 64EUs
min:
8 fps, P0.1:
32.9 fps, P1:
34.6 fps, max:
130.5 fps
fps
68%
GeForce GTX 1650 Ti Max-Q:
85.6 99.6 ~ 93 fps
100%
GeForce GTX 1660 Ti Max-Q:
87.7 fps
27%
UHD Graphics 64EUs:
23.8 [X] Asus TUF Dash F15 FX517ZR Intel Core i7-12650H 1.7GHz
UHD Graphics 64EUs
min:
19.5 fps, P0.1:
19.6 fps, P1:
20.9 fps, max:
28.8 fps
fps
65%
GeForce GTX 1650 Ti Max-Q:
53.6 60.9 ~ 57 fps
100%
GeForce GTX 1660 Ti Max-Q:
81.3 fps
27%
UHD Graphics 64EUs:
22.3 [X] Asus TUF Dash F15 FX517ZR Intel Core i7-12650H 1.7GHz
UHD Graphics 64EUs
min:
19.8 fps, P0.1:
19.8 fps, P1:
20.2 fps, max:
25.6 fps
fps
66%
GeForce GTX 1650 Ti Max-Q:
50.7 56.4 ~ 54 fps
100%
GeForce GTX 1660 Ti Max-Q:
78.4 fps
28%
UHD Graphics 64EUs:
21.6 [X] Asus TUF Dash F15 FX517ZR Intel Core i7-12650H 1.7GHz
UHD Graphics 64EUs
min:
13 fps, P0.1:
13.1 fps, P1:
18.7 fps, max:
43.8 fps
fps
66%
GeForce GTX 1650 Ti Max-Q:
49.5 54.4 ~ 52 fps
GeForce GTX 1650 Ti Max-Q:
35.9 fps
GeForce GTX 1650 Ti Max-Q:
16.8 fps
100%
GeForce GTX 1660 Ti Max-Q:
219 fps
31%
UHD Graphics 64EUs:
58.2 [X] NiPoGi CK10 759689
Intel Core i5-12450H 1.5GHz
UHD Graphics 64EUs
min:
52 fps, max:
67 fps
60.2 67 [X] NiPoGi AD08 759689
Intel Core i7-12650H 1.7GHz
UHD Graphics 64EUs
min:
58 fps, max:
76 fps
72.1 [X] NiPoGi AD08 759689
Intel Core i7-12650H 1.7GHz
UHD Graphics 64EUs
min:
64 fps, max:
83 fps
73 [X] NiPoGi AD08 759689
Intel Core i7-12650H 1.7GHz
UHD Graphics 64EUs
min:
64 fps, max:
85 fps
78.4 ~ 68 fps
96%
GeForce GTX 1650 Ti Max-Q:
211 fps
100%
GeForce GTX 1660 Ti Max-Q:
130 fps
25%
UHD Graphics 64EUs:
27.5 [X] NiPoGi CK10 759689
Intel Core i5-12450H 1.5GHz
UHD Graphics 64EUs
min:
23 fps, max:
31 fps
28.3 32.4 [X] NiPoGi AD08 759689
Intel Core i7-12650H 1.7GHz
UHD Graphics 64EUs
min:
23 fps, max:
37 fps
35.1 [X] NiPoGi AD08 759689
Intel Core i7-12650H 1.7GHz
UHD Graphics 64EUs
min:
30 fps, max:
40 fps
35.5 [X] NiPoGi AD08 759689
Intel Core i7-12650H 1.7GHz
UHD Graphics 64EUs
min:
29 fps, max:
41 fps
38.2 ~ 33 fps
82%
GeForce GTX 1650 Ti Max-Q:
107 fps
100%
GeForce GTX 1660 Ti Max-Q:
112 fps
22%
UHD Graphics 64EUs:
20.5 [X] NiPoGi CK10 759689
Intel Core i5-12450H 1.5GHz
UHD Graphics 64EUs
min:
16 fps, max:
24 fps
21 25.7 [X] NiPoGi AD08 759689
Intel Core i7-12650H 1.7GHz
UHD Graphics 64EUs
min:
21 fps, max:
30 fps
26.6 [X] NiPoGi AD08 759689
Intel Core i7-12650H 1.7GHz
UHD Graphics 64EUs
min:
21 fps, max:
31 fps
26.9 [X] NiPoGi AD08 759689
Intel Core i7-12650H 1.7GHz
UHD Graphics 64EUs
min:
22 fps, max:
31 fps
29 ~ 25 fps
73%
GeForce GTX 1650 Ti Max-Q:
82 fps
100%
GeForce GTX 1660 Ti Max-Q:
79 fps
20%
UHD Graphics 64EUs:
12.9 [X] NiPoGi CK10 759689
Intel Core i5-12450H 1.5GHz
UHD Graphics 64EUs
min:
8 fps, max:
16 fps
13 16.8 [X] NiPoGi AD08 759689
Intel Core i7-12650H 1.7GHz
UHD Graphics 64EUs
min:
11 fps, max:
21 fps
16.9 [X] NiPoGi AD08 759689
Intel Core i7-12650H 1.7GHz
UHD Graphics 64EUs
min:
11 fps, max:
21 fps
16.9 [X] NiPoGi AD08 759689
Intel Core i7-12650H 1.7GHz
UHD Graphics 64EUs
min:
10 fps, max:
22 fps
18.3 ~ 16 fps
72%
GeForce GTX 1650 Ti Max-Q:
57 fps
GeForce GTX 1650 Ti Max-Q:
41 fps
GeForce GTX 1650 Ti Max-Q:
22 fps
100%
GeForce GTX 1660 Ti Max-Q:
214.7 fps
51%
UHD Graphics 64EUs:
109.9 [X] Asus TUF Dash F15 FX517ZR Intel Core i7-12650H 1.7GHz
UHD Graphics 64EUs
fps
76%
GeForce GTX 1650 Ti Max-Q:
162.9 fps
100%
GeForce GTX 1660 Ti Max-Q:
130.2 fps
32%
UHD Graphics 64EUs:
41.7 [X] Asus TUF Dash F15 FX517ZR Intel Core i7-12650H 1.7GHz
UHD Graphics 64EUs
fps
57%
GeForce GTX 1650 Ti Max-Q:
73.7 fps
100%
GeForce GTX 1660 Ti Max-Q:
79.9 fps
32%
UHD Graphics 64EUs:
25.4 [X] Asus TUF Dash F15 FX517ZR Intel Core i7-12650H 1.7GHz
UHD Graphics 64EUs
fps
56%
GeForce GTX 1650 Ti Max-Q:
44.4 fps
100%
GeForce GTX 1660 Ti Max-Q:
56.1 fps
31%
UHD Graphics 64EUs:
17.6 [X] Asus TUF Dash F15 FX517ZR Intel Core i7-12650H 1.7GHz
UHD Graphics 64EUs
fps
60%
GeForce GTX 1650 Ti Max-Q:
33.4 fps
GeForce GTX 1650 Ti Max-Q:
23.5 fps
GeForce GTX 1650 Ti Max-Q:
13.5 fps
100%
GeForce GTX 1660 Ti Max-Q:
168.9 fps
29%
UHD Graphics 64EUs:
49.8 [X] Asus TUF Dash F15 FX517ZR Intel Core i7-12650H 1.7GHz
UHD Graphics 64EUs
min:
32.5 fps, P0.1:
34.8 fps, P1:
37 fps, max:
75.7 fps
fps
86%
GeForce GTX 1650 Ti Max-Q:
145.1 fps
100%
GeForce GTX 1660 Ti Max-Q:
101.7 fps
25%
UHD Graphics 64EUs:
25 [X] Asus TUF Dash F15 FX517ZR Intel Core i7-12650H 1.7GHz
UHD Graphics 64EUs
min:
17 fps, P0.1:
17.3 fps, P1:
18.9 fps, max:
47.7 fps
fps
90%
GeForce GTX 1650 Ti Max-Q:
91.2 fps
100%
GeForce GTX 1660 Ti Max-Q:
95.4 fps
24%
UHD Graphics 64EUs:
22.6 [X] Asus TUF Dash F15 FX517ZR Intel Core i7-12650H 1.7GHz
UHD Graphics 64EUs
min:
17.2 fps, P0.1:
17.2 fps, P1:
17.4 fps, max:
28.4 fps
fps
55%
GeForce GTX 1650 Ti Max-Q:
52.6 fps
100%
GeForce GTX 1660 Ti Max-Q:
93.4 fps
24%
UHD Graphics 64EUs:
22.2 [X] Asus TUF Dash F15 FX517ZR Intel Core i7-12650H 1.7GHz
UHD Graphics 64EUs
min:
15.2 fps, P0.1:
15.6 fps, P1:
16.4 fps, max:
27.9 fps
fps
100%
GeForce GTX 1660 Ti Max-Q:
176.8 fps
32%
UHD Graphics 64EUs:
57.3 [X] Asus TUF Dash F15 FX517ZR Intel Core i7-12650H 1.7GHz
UHD Graphics 64EUs
min:
26.1 fps, P0.1:
31.4 fps, P1:
45.3 fps, max:
97.7 fps
fps
65%
GeForce GTX 1650 Ti Max-Q:
115.7 fps
100%
GeForce GTX 1660 Ti Max-Q:
81.2 fps
27%
UHD Graphics 64EUs:
22 [X] Asus TUF Dash F15 FX517ZR Intel Core i7-12650H 1.7GHz
UHD Graphics 64EUs
min:
17.7 fps, P0.1:
17.8 fps, P1:
18.6 fps, max:
27.9 fps
fps
62%
GeForce GTX 1650 Ti Max-Q:
50.1 fps
100%
GeForce GTX 1660 Ti Max-Q:
63.3 fps
28%
UHD Graphics 64EUs:
17.9 [X] Asus TUF Dash F15 FX517ZR Intel Core i7-12650H 1.7GHz
UHD Graphics 64EUs
min:
8.29 fps, P0.1:
10.7 fps, P1:
15.1 fps, max:
21.6 fps
fps
66%
GeForce GTX 1650 Ti Max-Q:
41.8 fps
100%
GeForce GTX 1660 Ti Max-Q:
121.2 fps
100%
GeForce GTX 1650 Ti Max-Q:
120.7 fps
100%
GeForce GTX 1660 Ti Max-Q:
98.3 fps
72%
GeForce GTX 1650 Ti Max-Q:
71.2 fps
100%
GeForce GTX 1660 Ti Max-Q:
90.5 fps
58%
GeForce GTX 1650 Ti Max-Q:
52.8 fps
100%
GeForce GTX 1660 Ti Max-Q:
87.7 fps
54%
GeForce GTX 1650 Ti Max-Q:
47 fps
100%
GeForce GTX 1660 Ti Max-Q:
115.1 fps
100%
GeForce GTX 1660 Ti Max-Q:
71.7 fps
100%
GeForce GTX 1660 Ti Max-Q:
47.2 fps
100%
GeForce GTX 1660 Ti Max-Q:
29.4 fps
100%
GeForce GTX 1660 Ti Max-Q:
91.5 fps
69%
GeForce GTX 1650 Ti Max-Q:
63.3 fps
100%
GeForce GTX 1660 Ti Max-Q:
78.1 fps
68%
GeForce GTX 1650 Ti Max-Q:
53.2 fps
100%
GeForce GTX 1660 Ti Max-Q:
72.4 fps
64%
GeForce GTX 1650 Ti Max-Q:
46 fps
100%
GeForce GTX 1660 Ti Max-Q:
95.8 fps
65%
GeForce GTX 1650 Ti Max-Q:
61.8 fps
100%
GeForce GTX 1660 Ti Max-Q:
83 fps
59%
GeForce GTX 1650 Ti Max-Q:
49.3 fps
100%
GeForce GTX 1660 Ti Max-Q:
73.9 fps
62%
GeForce GTX 1650 Ti Max-Q:
45.8 fps
100%
GeForce GTX 1660 Ti Max-Q:
66.9 fps
51%
GeForce GTX 1650 Ti Max-Q:
33.9 fps
100%
GeForce GTX 1660 Ti Max-Q:
135.2 fps
100%
GeForce GTX 1660 Ti Max-Q:
88 fps
100%
GeForce GTX 1660 Ti Max-Q:
72.6 fps
100%
GeForce GTX 1660 Ti Max-Q:
62.6 fps
100%
GeForce GTX 1660 Ti Max-Q:
112.9 fps
101%
GeForce GTX 1650 Ti Max-Q:
114 fps
100%
GeForce GTX 1660 Ti Max-Q:
86.5 fps
89%
GeForce GTX 1650 Ti Max-Q:
76.9 fps
100%
GeForce GTX 1660 Ti Max-Q:
72 fps
89%
GeForce GTX 1650 Ti Max-Q:
64.3 fps
100%
GeForce GTX 1660 Ti Max-Q:
58.7 fps
47%
GeForce GTX 1650 Ti Max-Q:
27.5 fps
100%
GeForce GTX 1660 Ti Max-Q:
83 114 ~ 99 fps
75%
GeForce GTX 1650 Ti Max-Q:
74 fps
100%
GeForce GTX 1660 Ti Max-Q:
68 72 ~ 70 fps
64%
GeForce GTX 1650 Ti Max-Q:
45 fps
100%
GeForce GTX 1660 Ti Max-Q:
65 66 ~ 66 fps
52%
GeForce GTX 1650 Ti Max-Q:
34 fps
100%
GeForce GTX 1660 Ti Max-Q:
48 51 ~ 50 fps
44%
GeForce GTX 1650 Ti Max-Q:
22 fps
100%
GeForce GTX 1660 Ti Max-Q:
147.9 fps
100%
GeForce GTX 1660 Ti Max-Q:
145.4 fps
100%
GeForce GTX 1660 Ti Max-Q:
141 fps
100%
GeForce GTX 1660 Ti Max-Q:
139.3 fps
100%
GeForce GTX 1660 Ti Max-Q:
87 116.5 ~ 102 fps
101%
GeForce GTX 1650 Ti Max-Q:
102.8 fps
100%
GeForce GTX 1660 Ti Max-Q:
72.1 81.5 ~ 77 fps
68%
GeForce GTX 1650 Ti Max-Q:
52.6 fps
100%
GeForce GTX 1660 Ti Max-Q:
52.9 54.9 ~ 54 fps
64%
GeForce GTX 1650 Ti Max-Q:
34.7 fps
100%
GeForce GTX 1660 Ti Max-Q:
41.5 42.3 ~ 42 fps
62%
GeForce GTX 1650 Ti Max-Q:
26.1 fps
100%
GeForce GTX 1660 Ti Max-Q:
158.3 fps
66%
GeForce GTX 1650 Ti Max-Q:
104.7 fps
100%
GeForce GTX 1660 Ti Max-Q:
63.7 fps
62%
GeForce GTX 1650 Ti Max-Q:
39.2 fps
100%
GeForce GTX 1660 Ti Max-Q:
47.1 fps
62%
GeForce GTX 1650 Ti Max-Q:
29.1 fps
100%
GeForce GTX 1660 Ti Max-Q:
155 183 ~ 169 fps
101%
GeForce GTX 1650 Ti Max-Q:
171 fps
100%
GeForce GTX 1660 Ti Max-Q:
119 140 ~ 130 fps
68%
GeForce GTX 1650 Ti Max-Q:
89 fps
100%
GeForce GTX 1660 Ti Max-Q:
106 117 ~ 112 fps
63%
GeForce GTX 1650 Ti Max-Q:
71 fps
100%
GeForce GTX 1660 Ti Max-Q:
71 77 ~ 74 fps
84%
GeForce GTX 1650 Ti Max-Q:
62 fps
100%
GeForce GTX 1660 Ti Max-Q:
144.1 209.4 ~ 177 fps
100%
GeForce GTX 1660 Ti Max-Q:
76.5 93.1 ~ 85 fps
68%
GeForce GTX 1650 Ti Max-Q:
56 57.5 60.3 ~ 58 fps
100%
GeForce GTX 1660 Ti Max-Q:
54.7 57.1 ~ 56 fps
63%
GeForce GTX 1650 Ti Max-Q:
33.4 36 36.5 ~ 35 fps
100%
GeForce GTX 1660 Ti Max-Q:
41.1 41.6 ~ 41 fps
100%
GeForce GTX 1660 Ti Max-Q:
146.4 154.7 ~ 151 fps
100%
GeForce GTX 1660 Ti Max-Q:
70.9 76.2 ~ 74 fps
100%
GeForce GTX 1660 Ti Max-Q:
58.7 65.8 ~ 62 fps
100%
GeForce GTX 1660 Ti Max-Q:
58.2 64.8 ~ 62 fps
100%
GeForce GTX 1660 Ti Max-Q:
59.6 87.9 ~ 74 fps
121%
GeForce GTX 1650 Ti Max-Q:
89.4 fps
100%
GeForce GTX 1660 Ti Max-Q:
58.7 83.2 ~ 71 fps
93%
GeForce GTX 1650 Ti Max-Q:
65.8 fps
100%
GeForce GTX 1660 Ti Max-Q:
45.3 64.1 ~ 55 fps
75%
GeForce GTX 1650 Ti Max-Q:
41.1 fps
100%
GeForce GTX 1660 Ti Max-Q:
26 33.2 ~ 30 fps
72%
GeForce GTX 1650 Ti Max-Q:
21.5 fps
100%
GeForce GTX 1660 Ti Max-Q:
110 142 ~ 126 fps
36%
UHD Graphics 64EUs:
45 [X] Asus TUF Dash F15 FX517ZR Intel Core i7-12650H 1.7GHz
UHD Graphics 64EUs
fps
74%
GeForce GTX 1650 Ti Max-Q:
93 fps
100%
GeForce GTX 1660 Ti Max-Q:
80 87 ~ 84 fps
26%
UHD Graphics 64EUs:
22 [X] Asus TUF Dash F15 FX517ZR Intel Core i7-12650H 1.7GHz
UHD Graphics 64EUs
fps
61%
GeForce GTX 1650 Ti Max-Q:
51 fps
100%
GeForce GTX 1660 Ti Max-Q:
66 69 ~ 68 fps
24%
UHD Graphics 64EUs:
16 [X] Asus TUF Dash F15 FX517ZR Intel Core i7-12650H 1.7GHz
UHD Graphics 64EUs
fps
60%
GeForce GTX 1650 Ti Max-Q:
41 fps
100%
GeForce GTX 1660 Ti Max-Q:
49 50 ~ 50 fps
60%
GeForce GTX 1650 Ti Max-Q:
30 fps
100%
GeForce GTX 1660 Ti Max-Q:
181.2 194.2 ~ 188 fps
104%
GeForce GTX 1650 Ti Max-Q:
195.9 fps
100%
GeForce GTX 1660 Ti Max-Q:
102.6 139.9 ~ 121 fps
52%
GeForce GTX 1650 Ti Max-Q:
63.1 fps
100%
GeForce GTX 1660 Ti Max-Q:
88.7 103.2 ~ 96 fps
57%
GeForce GTX 1650 Ti Max-Q:
55.1 fps
100%
GeForce GTX 1660 Ti Max-Q:
57.3 59.2 ~ 58 fps
66%
GeForce GTX 1650 Ti Max-Q:
38.1 fps
100%
GeForce GTX 1660 Ti Max-Q:
53.6 fps
100%
GeForce GTX 1660 Ti Max-Q:
48.9 fps
100%
GeForce GTX 1660 Ti Max-Q:
48.8 fps
100%
GeForce GTX 1660 Ti Max-Q:
46.4 fps
100%
GeForce GTX 1660 Ti Max-Q:
97 fps
40%
UHD Graphics 64EUs:
33 [X] NiPoGi CK10 Intel Core i5-12450H 1.5GHz
UHD Graphics 64EUs
min:
21 fps, max:
42 fps
34 34 [X] NiPoGi AD08 Intel Core i7-12650H 1.7GHz
UHD Graphics 64EUs
min:
24 fps, max:
44 fps
35 44 [X] NiPoGi AD08 Intel Core i7-12650H 1.7GHz
UHD Graphics 64EUs
min:
30 fps, max:
56 fps
45 [X] NiPoGi AD08 Intel Core i7-12650H 1.7GHz
UHD Graphics 64EUs
min:
29 fps, max:
56 fps
48 ~ 39 fps
92%
GeForce GTX 1650 Ti Max-Q:
89 fps
100%
GeForce GTX 1660 Ti Max-Q:
81 fps
25%
UHD Graphics 64EUs:
17 17 [X] NiPoGi CK10 Intel Core i5-12450H 1.5GHz
UHD Graphics 64EUs
min:
13 fps, max:
22 fps
17 19 [X] NiPoGi AD08 Intel Core i7-12650H 1.7GHz
UHD Graphics 64EUs
min:
15 fps, max:
24 fps
23 [X] NiPoGi AD08 Intel Core i7-12650H 1.7GHz
UHD Graphics 64EUs
min:
17 fps, max:
28 fps
23 [X] NiPoGi AD08 Intel Core i7-12650H 1.7GHz
UHD Graphics 64EUs
min:
17 fps, max:
29 fps
24 ~ 20 fps
69%
GeForce GTX 1650 Ti Max-Q:
56 fps
100%
GeForce GTX 1660 Ti Max-Q:
78 fps
24%
UHD Graphics 64EUs:
16 16 [X] NiPoGi CK10 Intel Core i5-12450H 1.5GHz
UHD Graphics 64EUs
min:
12 fps, max:
20 fps
16 18 [X] NiPoGi AD08 Intel Core i7-12650H 1.7GHz
UHD Graphics 64EUs
min:
14 fps, max:
23 fps
22 [X] NiPoGi AD08 Intel Core i7-12650H 1.7GHz
UHD Graphics 64EUs
min:
16 fps, max:
27 fps
22 [X] NiPoGi AD08 Intel Core i7-12650H 1.7GHz
UHD Graphics 64EUs
min:
16 fps, max:
27 fps
23 ~ 19 fps
68%
GeForce GTX 1650 Ti Max-Q:
53 fps
100%
GeForce GTX 1660 Ti Max-Q:
71 fps
24%
UHD Graphics 64EUs:
15 15 [X] NiPoGi CK10 Intel Core i5-12450H 1.5GHz
UHD Graphics 64EUs
min:
11 fps, max:
19 fps
15 16 [X] NiPoGi AD08 Intel Core i7-12650H 1.7GHz
UHD Graphics 64EUs
min:
11 fps, max:
21 fps
20 [X] NiPoGi AD08 Intel Core i7-12650H 1.7GHz
UHD Graphics 64EUs
min:
13 fps, max:
25 fps
20 [X] NiPoGi AD08 Intel Core i7-12650H 1.7GHz
UHD Graphics 64EUs
min:
14 fps, max:
25 fps
21 ~ 17 fps
69%
GeForce GTX 1650 Ti Max-Q:
49 fps
29%
UHD Graphics 64EUs:
22.3 [X] NiPoGi AD08 Intel Core i7-12650H 1.7GHz
UHD Graphics 64EUs
min:
12.19 fps, max:
37.36 fps
27.3 [X] NiPoGi CK10 Intel Core i5-12450H 1.5GHz
UHD Graphics 64EUs
min:
16.35 fps, max:
41.99 fps
27.5 [X] Geekom Mini IT12 Intel Core i5-12450H 1.5GHz
UHD Graphics 64EUs
min:
16.8 fps, max:
40.79 fps
33.1 [X] NiPoGi AD08 Intel Core i7-12650H 1.7GHz
UHD Graphics 64EUs
min:
19.24 fps, max:
49.3 fps
33.2 [X] NiPoGi AD08 Intel Core i7-12650H 1.7GHz
UHD Graphics 64EUs
min:
19.15 fps, max:
50.68 fps
37.6 ~ 30 fps
81%
GeForce GTX 1650 Ti Max-Q:
83.1 fps
100%
GeForce GTX 1660 Ti Max-Q:
53.9 60 66.5 ~ 60 fps
23%
UHD Graphics 64EUs:
12.1 [X] NiPoGi AD08 Intel Core i7-12650H 1.7GHz
UHD Graphics 64EUs
min:
6.36 fps, max:
19.45 fps
12.3 [X] NiPoGi CK10 Intel Core i5-12450H 1.5GHz
UHD Graphics 64EUs
min:
6.65 fps, max:
18.79 fps
12.9 [X] Geekom Mini IT12 Intel Core i5-12450H 1.5GHz
UHD Graphics 64EUs
min:
6.97 fps, max:
19.25 fps
15.9 [X] NiPoGi AD08 Intel Core i7-12650H 1.7GHz
UHD Graphics 64EUs
min:
8.49 fps, max:
22.97 fps
15.9 [X] NiPoGi AD08 Intel Core i7-12650H 1.7GHz
UHD Graphics 64EUs
min:
8.54 fps, max:
23.97 fps
17 ~ 14 fps
67%
GeForce GTX 1650 Ti Max-Q:
40.1 fps
23%
UHD Graphics 64EUs:
9.5 [X] NiPoGi CK10 Intel Core i5-12450H 1.5GHz
UHD Graphics 64EUs
min:
4.94 fps, max:
14.31 fps
9.6 10 [X] NiPoGi AD08 Intel Core i7-12650H 1.7GHz
UHD Graphics 64EUs
min:
4.99 fps, max:
15.67 fps
11.7 [X] NiPoGi AD08 Intel Core i7-12650H 1.7GHz
UHD Graphics 64EUs
min:
6.1 fps, max:
17.86 fps
11.7 [X] NiPoGi AD08 Intel Core i7-12650H 1.7GHz
UHD Graphics 64EUs
min:
6.13 fps, max:
18.1 fps
12.5 ~ 11 fps
63%
GeForce GTX 1650 Ti Max-Q:
29.8 fps
24%
UHD Graphics 64EUs:
7.7 [X] NiPoGi CK10 Intel Core i5-12450H 1.5GHz
UHD Graphics 64EUs
min:
4.18 fps, max:
11.51 fps
7.9 [X] Geekom Mini IT12 Intel Core i5-12450H 1.5GHz
UHD Graphics 64EUs
min:
4.34 fps, max:
11.75 fps
8 [X] NiPoGi AD08 Intel Core i7-12650H 1.7GHz
UHD Graphics 64EUs
min:
4.22 fps, max:
11.91 fps
9.5 [X] NiPoGi AD08 Intel Core i7-12650H 1.7GHz
UHD Graphics 64EUs
min:
5.26 fps, max:
14.62 fps
9.5 [X] NiPoGi AD08 Intel Core i7-12650H 1.7GHz
UHD Graphics 64EUs
min:
5.24 fps, max:
14.77 fps
10.2 ~ 9 fps
63%
GeForce GTX 1650 Ti Max-Q:
23.2 fps
100%
GeForce GTX 1660 Ti Max-Q:
144 144 ~ 144 fps
100%
GeForce GTX 1650 Ti Max-Q:
143.7 fps
100%
GeForce GTX 1660 Ti Max-Q:
105.3 133.9 ~ 120 fps
72%
GeForce GTX 1650 Ti Max-Q:
86.2 fps
100%
GeForce GTX 1660 Ti Max-Q:
90.1 99.6 ~ 95 fps
72%
GeForce GTX 1650 Ti Max-Q:
68.7 fps
100%
GeForce GTX 1660 Ti Max-Q:
89 99.6 ~ 94 fps
67%
GeForce GTX 1650 Ti Max-Q:
62.9 fps
100%
GeForce GTX 1660 Ti Max-Q:
135.6 fps
100%
GeForce GTX 1660 Ti Max-Q:
85.8 fps
100%
GeForce GTX 1660 Ti Max-Q:
77.4 fps
100%
GeForce GTX 1660 Ti Max-Q:
72.8 fps
100%
GeForce GTX 1660 Ti Max-Q:
61 73 85 ~ 73 fps
100%
GeForce GTX 1660 Ti Max-Q:
37.9 fps
100%
GeForce GTX 1660 Ti Max-Q:
115.2 fps
100%
GeForce GTX 1660 Ti Max-Q:
87.9 fps
100%
GeForce GTX 1660 Ti Max-Q:
84.6 fps
100%
GeForce GTX 1660 Ti Max-Q:
83.1 fps
100%
GeForce GTX 1660 Ti Max-Q:
48 64 90 ~ 67 fps
94%
GeForce GTX 1650 Ti Max-Q:
63 fps
100%
GeForce GTX 1660 Ti Max-Q:
43 56 71 ~ 57 fps
86%
GeForce GTX 1650 Ti Max-Q:
49 fps
100%
GeForce GTX 1660 Ti Max-Q:
39 51 60 ~ 50 fps
82%
GeForce GTX 1650 Ti Max-Q:
41 fps
100%
GeForce GTX 1660 Ti Max-Q:
33 42 44 ~ 40 fps
48%
GeForce GTX 1650 Ti Max-Q:
19 fps
100%
GeForce GTX 1660 Ti Max-Q:
62 82 113 126 ~ 96 fps
100%
GeForce GTX 1660 Ti Max-Q:
53 57 83 85 ~ 70 fps
100%
GeForce GTX 1660 Ti Max-Q:
52 53 74 75 ~ 64 fps
100%
GeForce GTX 1660 Ti Max-Q:
49 49 64 67 ~ 57 fps
GeForce GTX 1650 Ti Max-Q:
15 15 ~ 15 fps
UHD Graphics 64EUs:
47.9 [X] HP 250 G9 7N029ES 1.47.22.14 D3D12
Intel Core i3-1215U 0.9GHz
UHD Graphics 64EUs
min:
6.9 fps, P1:
16.3 fps, max:
249 fps
61.7 [X] NiPoGi CK10 1.47.22.14 D3D12
Intel Core i5-12450H 1.5GHz
UHD Graphics 64EUs
min:
14.2 fps, P1:
18.8 fps, max:
283 fps
63.4 [X] Geekom Mini IT12 1.47.22.14 D3D12
Intel Core i5-12450H 1.5GHz
UHD Graphics 64EUs
min:
14.3 fps, P1:
18.6 fps, max:
372 fps
67.4 76.4 [X] NiPoGi AD08 1.47.22.14 D3D12
Intel Core i7-12650H 1.7GHz
UHD Graphics 64EUs
min:
17.3 fps, P1:
24.6 fps, max:
362 fps
77.3 [X] NiPoGi AD08 1.47.22.14 D3D12
Intel Core i7-12650H 1.7GHz
UHD Graphics 64EUs
min:
17.1 fps, P1:
24.6 fps, max:
383 fps
78.1 [X] NiPoGi AD08 1.47.22.14 D3D12
Intel Core i7-12650H 1.7GHz
UHD Graphics 64EUs
min:
17.5 fps, P1:
24 fps, max:
419 fps
84.5 89.1 [X] Asus TUF Dash F15 FX517ZR 1.47.22.14 D3D12
Intel Core i7-12650H 1.7GHz
UHD Graphics 64EUs
min:
19.7 fps, P1:
29.6 fps, max:
492 fps
~ 72 fps
GeForce GTX 1650 Ti Max-Q:
167 [X] MSI Summit E14 A11SCS 1.47.22.14 D3D12
Intel Core i7-1185G7 3GHz
GeForce GTX 1650 Ti Max-Q
min:
117 fps, P1:
124 fps, max:
279 fps
188 [X] HP Envy 14-eb0010nr 1.47.22.14 D3D12
Intel Core i5-1135G7 2.4GHz
GeForce GTX 1650 Ti Max-Q
min:
61.8 fps, P1:
146 fps, max:
283 fps
196 ~ 184 fps
UHD Graphics 64EUs:
17.9 [X] HP 250 G9 7N029ES 1.47.22.14 D3D12
Intel Core i3-1215U 0.9GHz
UHD Graphics 64EUs
min:
5 fps, P1:
6.89 fps, max:
214 fps
25.1 [X] NiPoGi CK10 1.47.22.14 D3D12
Intel Core i5-12450H 1.5GHz
UHD Graphics 64EUs
min:
8.8 fps, P1:
12.7 fps, max:
181.3 fps
25.1 [X] Geekom Mini IT12 1.47.22.14 D3D12
Intel Core i5-12450H 1.5GHz
UHD Graphics 64EUs
min:
7.6 fps, P1:
11.4 fps, max:
246 fps
29.9 32.2 [X] NiPoGi AD08 1.47.22.14 D3D12
Intel Core i7-12650H 1.7GHz
UHD Graphics 64EUs
min:
11.9 fps, P1:
17.7 fps, max:
168.4 fps
32.3 [X] NiPoGi AD08 1.47.22.14 D3D12
Intel Core i7-12650H 1.7GHz
UHD Graphics 64EUs
min:
8.8 fps, P1:
18.4 fps, max:
199.4 fps
32.4 [X] NiPoGi AD08 1.47.22.14 D3D12
Intel Core i7-12650H 1.7GHz
UHD Graphics 64EUs
min:
11.4 fps, P1:
17.3 fps, max:
174.2 fps
34.5 38.6 [X] Asus TUF Dash F15 FX517ZR 1.47.22.14 D3D12
Intel Core i7-12650H 1.7GHz
UHD Graphics 64EUs
min:
16.6 fps, P1:
20.9 fps, max:
290 fps
~ 30 fps
GeForce GTX 1650 Ti Max-Q:
68.6 [X] MSI Summit E14 A11SCS 1.47.22.14 D3D12
Intel Core i7-1185G7 3GHz
GeForce GTX 1650 Ti Max-Q
min:
51.8 fps, P1:
56.2 fps, max:
105 fps
76.5 [X] HP Envy 14-eb0010nr 1.47.22.14 D3D12
Intel Core i5-1135G7 2.4GHz
GeForce GTX 1650 Ti Max-Q
min:
46.5 fps, P1:
66.4 fps, max:
168 fps
81.5 ~ 76 fps
UHD Graphics 64EUs:
15.3 [X] HP 250 G9 7N029ES 1.47.22.14 D3D12
Intel Core i3-1215U 0.9GHz
UHD Graphics 64EUs
min:
5 fps, P1:
5.16 fps, max:
225 fps
19.8 [X] NiPoGi CK10 1.47.22.14 D3D12
Intel Core i5-12450H 1.5GHz
UHD Graphics 64EUs
min:
5 fps, P1:
6.19 fps, max:
218 fps
19.9 [X] Geekom Mini IT12 1.47.22.14 D3D12
Intel Core i5-12450H 1.5GHz
UHD Graphics 64EUs
min:
5.1 fps, P1:
6.2 fps, max:
255 fps
23.3 25.5 [X] NiPoGi AD08 1.47.22.14 D3D12
Intel Core i7-12650H 1.7GHz
UHD Graphics 64EUs
min:
7.4 fps, P1:
9.71 fps, max:
300 fps
25.5 [X] NiPoGi AD08 1.47.22.14 D3D12
Intel Core i7-12650H 1.7GHz
UHD Graphics 64EUs
min:
6.6 fps, P1:
10.4 fps, max:
218 fps
25.6 [X] NiPoGi AD08 1.47.22.14 D3D12
Intel Core i7-12650H 1.7GHz
UHD Graphics 64EUs
min:
5 fps, P1:
9.18 fps, max:
212 fps
27.2 30 [X] Asus TUF Dash F15 FX517ZR 1.47.22.14 D3D12
Intel Core i7-12650H 1.7GHz
UHD Graphics 64EUs
min:
9.6 fps, P1:
15.1 fps, max:
340 fps
~ 24 fps
GeForce GTX 1650 Ti Max-Q:
54.9 [X] MSI Summit E14 A11SCS 1.47.22.14 D3D12
Intel Core i7-1185G7 3GHz
GeForce GTX 1650 Ti Max-Q
min:
40.1 fps, P1:
41.6 fps, max:
82.2 fps
62.2 [X] HP Envy 14-eb0010nr 1.47.22.14 D3D12
Intel Core i5-1135G7 2.4GHz
GeForce GTX 1650 Ti Max-Q
min:
48.5 fps, P1:
50 fps, max:
86.8 fps
65.6 ~ 61 fps
UHD Graphics 64EUs:
0 (!) 16.8 [X] NiPoGi CK10 1.47.22.14 D3D12
Intel Core i5-12450H 1.5GHz
UHD Graphics 64EUs
min:
5 fps, P1:
5 fps, max:
274 fps
16.8 [X] Geekom Mini IT12 1.47.22.14 D3D12
Intel Core i5-12450H 1.5GHz
UHD Graphics 64EUs
min:
5 fps, P1:
5 fps, max:
335 fps
20.2 [X] NiPoGi AD08 1.47.22.14 D3D12
Intel Core i7-12650H 1.7GHz
UHD Graphics 64EUs
min:
5 fps, P1:
6.3 fps, max:
223 fps
20.3 [X] NiPoGi AD08 1.47.22.14 D3D12
Intel Core i7-12650H 1.7GHz
UHD Graphics 64EUs
min:
5 fps, P1:
6.46 fps, max:
247 fps
20.5 [X] NiPoGi AD08 1.47.22.14 D3D12
Intel Core i7-12650H 1.7GHz
UHD Graphics 64EUs
min:
5 fps, P1:
5.27 fps, max:
229 fps
22.1 24.4 [X] Asus TUF Dash F15 FX517ZR 1.47.22.14 D3D12
Intel Core i7-12650H 1.7GHz
UHD Graphics 64EUs
min:
6.8 fps, P1:
8.33 fps, max:
464 fps
~ 18 fps
GeForce GTX 1650 Ti Max-Q:
47.9 [X] MSI Summit E14 A11SCS 1.47.22.14 D3D12
Intel Core i7-1185G7 3GHz
GeForce GTX 1650 Ti Max-Q
min:
35.1 fps, P1:
36.4 fps, max:
68.6 fps
53.6 [X] HP Envy 14-eb0010nr 1.47.22.14 D3D12
Intel Core i5-1135G7 2.4GHz
GeForce GTX 1650 Ti Max-Q
min:
27 fps, P1:
43 fps, max:
125 fps
55.2 ~ 52 fps
GeForce GTX 1650 Ti Max-Q:
35 [X] MSI Summit E14 A11SCS 1.47.22.14 D3D12
Intel Core i7-1185G7 3GHz
GeForce GTX 1650 Ti Max-Q
min:
29.2 fps, P1:
29.8 fps, max:
48 fps
fps
GeForce GTX 1650 Ti Max-Q:
21.4 [X] MSI Summit E14 A11SCS 1.47.22.14 D3D12
Intel Core i7-1185G7 3GHz
GeForce GTX 1650 Ti Max-Q
min:
18.1 fps, P1:
18.5 fps, max:
26.5 fps
fps
100%
GeForce GTX 1660 Ti Max-Q:
66.9 fps
100%
GeForce GTX 1660 Ti Max-Q:
59.3 fps
100%
GeForce GTX 1660 Ti Max-Q:
59.5 fps
100%
GeForce GTX 1660 Ti Max-Q:
50.8 fps
100%
GeForce GTX 1660 Ti Max-Q:
68 103 ~ 86 fps
47%
UHD Graphics 64EUs:
25 35 [X] NiPoGi AD08 Intel Core i7-12650H 1.7GHz
UHD Graphics 64EUs
min:
32 fps, max:
43 fps
36 36 [X] NiPoGi CK10 Intel Core i5-12450H 1.5GHz
UHD Graphics 64EUs
min:
32 fps, max:
41 fps
36 46 [X] NiPoGi AD08 Intel Core i7-12650H 1.7GHz
UHD Graphics 64EUs
min:
38 fps, max:
52 fps
46 [X] NiPoGi AD08 Intel Core i7-12650H 1.7GHz
UHD Graphics 64EUs
min:
42 fps, max:
54 fps
50 53 [X] Asus TUF Dash F15 FX517ZR Intel Core i7-12650H 1.7GHz
UHD Graphics 64EUs
min:
47 fps, max:
61 fps
~ 40 fps
119%
GeForce GTX 1650 Ti Max-Q:
90 102 115 ~ 102 fps
100%
GeForce GTX 1660 Ti Max-Q:
54 84 ~ 69 fps
28%
UHD Graphics 64EUs:
13 17 17 [X] NiPoGi CK10 Intel Core i5-12450H 1.5GHz
UHD Graphics 64EUs
min:
15 fps, max:
21 fps
17 18 [X] NiPoGi AD08 Intel Core i7-12650H 1.7GHz
UHD Graphics 64EUs
min:
15 fps, max:
24 fps
22 [X] NiPoGi AD08 Intel Core i7-12650H 1.7GHz
UHD Graphics 64EUs
min:
19 fps, max:
27 fps
22 [X] NiPoGi AD08 Intel Core i7-12650H 1.7GHz
UHD Graphics 64EUs
min:
19 fps, max:
27 fps
24 25 [X] Asus TUF Dash F15 FX517ZR Intel Core i7-12650H 1.7GHz
UHD Graphics 64EUs
min:
21 fps, max:
30 fps
~ 19 fps
80%
GeForce GTX 1650 Ti Max-Q:
46 56 64 ~ 55 fps
100%
GeForce GTX 1660 Ti Max-Q:
53 79 ~ 66 fps
29%
UHD Graphics 64EUs:
16 16 [X] NiPoGi CK10 Intel Core i5-12450H 1.5GHz
UHD Graphics 64EUs
min:
13 fps, max:
20 fps
16 17 [X] NiPoGi AD08 Intel Core i7-12650H 1.7GHz
UHD Graphics 64EUs
min:
15 fps, max:
22 fps
21 [X] NiPoGi AD08 Intel Core i7-12650H 1.7GHz
UHD Graphics 64EUs
min:
18 fps, max:
25 fps
21 [X] NiPoGi AD08 Intel Core i7-12650H 1.7GHz
UHD Graphics 64EUs
min:
18 fps, max:
25 fps
22 23 [X] Asus TUF Dash F15 FX517ZR Intel Core i7-12650H 1.7GHz
UHD Graphics 64EUs
min:
20 fps, max:
28 fps
~ 19 fps
77%
GeForce GTX 1650 Ti Max-Q:
42 51 60 ~ 51 fps
100%
GeForce GTX 1660 Ti Max-Q:
50 74 ~ 62 fps
29%
UHD Graphics 64EUs:
14 15 [X] NiPoGi CK10 Intel Core i5-12450H 1.5GHz
UHD Graphics 64EUs
min:
13 fps, max:
18 fps
15 16 [X] NiPoGi AD08 Intel Core i7-12650H 1.7GHz
UHD Graphics 64EUs
min:
14 fps, max:
20 fps
19 [X] NiPoGi AD08 Intel Core i7-12650H 1.7GHz
UHD Graphics 64EUs
min:
17 fps, max:
23 fps
19 [X] NiPoGi AD08 Intel Core i7-12650H 1.7GHz
UHD Graphics 64EUs
min:
17 fps, max:
23 fps
21 [X] Asus TUF Dash F15 FX517ZR Intel Core i7-12650H 1.7GHz
UHD Graphics 64EUs
min:
18 fps, max:
26 fps
21 ~ 18 fps
77%
GeForce GTX 1650 Ti Max-Q:
39 47 48 [X] MSI Summit E15 A11SCST High Performance
Intel Core i7-1185G7 3GHz
GeForce GTX 1650 Ti Max-Q
min:
41 fps, max:
56 fps
56 ~ 48 fps
UHD Graphics 64EUs:
14 [X] Asus TUF Dash F15 FX517ZR Intel Core i7-12650H 1.7GHz
UHD Graphics 64EUs
min:
12 fps, max:
17 fps
fps
GeForce GTX 1650 Ti Max-Q:
27 38 ~ 33 fps
100%
GeForce GTX 1660 Ti Max-Q:
30 fps
53%
GeForce GTX 1650 Ti Max-Q:
14 17 ~ 16 fps
100%
GeForce GTX 1660 Ti Max-Q:
376.8 fps
100%
GeForce GTX 1660 Ti Max-Q:
215.9 fps
100%
GeForce GTX 1660 Ti Max-Q:
117.3 fps
111%
GeForce GTX 1650 Ti Max-Q:
79 80.2 85.9 86.6 86.8 91.2 92.6 93.9 96.4 97.5 [X] MSI Summit E15 A11SCST High Performance
Intel Core i7-1185G7 3GHz
GeForce GTX 1650 Ti Max-Q
98 [X] MSI Summit E15 A11SCST High Performance, Cooler Boost
Intel Core i7-1185G7 3GHz
GeForce GTX 1650 Ti Max-Q
~ 90 fps
110%
GeForce GTX 1650 Ti Max-Q:
71.5 71.9 72.8 73.5 78.2 79.2 79.4 80.7 83.5 [X] MSI Summit E15 A11SCST High Performance
Intel Core i7-1185G7 3GHz
GeForce GTX 1650 Ti Max-Q
83.9 [X] MSI Summit E15 A11SCST High Performance, Cooler Boost
Intel Core i7-1185G7 3GHz
GeForce GTX 1650 Ti Max-Q
87.5 ~ 78 fps
108%
GeForce GTX 1650 Ti Max-Q:
60.5 62.6 62.7 63.1 66.4 66.7 67.5 69.7 70.6 [X] MSI Summit E15 A11SCST High Performance
Intel Core i7-1185G7 3GHz
GeForce GTX 1650 Ti Max-Q
70.8 [X] MSI Summit E15 A11SCST High Performance, Cooler Boost
Intel Core i7-1185G7 3GHz
GeForce GTX 1650 Ti Max-Q
72.3 ~ 67 fps
100%
GeForce GTX 1660 Ti Max-Q:
125.6 fps
100%
GeForce GTX 1660 Ti Max-Q:
91.7 fps
100%
GeForce GTX 1660 Ti Max-Q:
77.3 fps
100%
GeForce GTX 1660 Ti Max-Q:
53.7 fps
81%
GeForce GTX 1650 Ti Max-Q:
72 90.1 94 ~ 85 fps
100%
GeForce GTX 1660 Ti Max-Q:
44.9 50 54.6 ~ 50 fps
GeForce GTX 1650 Ti Max-Q:
19.3 fps
GeForce GTX 1650 Ti Max-Q:
10.1 fps
100%
GeForce GTX 1660 Ti Max-Q:
138 fps
100%
GeForce GTX 1660 Ti Max-Q:
92.2 fps
100%
GeForce GTX 1660 Ti Max-Q:
89.5 fps
100%
GeForce GTX 1660 Ti Max-Q:
78.6 fps
100%
GeForce GTX 1660 Ti Max-Q:
91 fps
100%
GeForce GTX 1660 Ti Max-Q:
82 fps
100%
GeForce GTX 1660 Ti Max-Q:
72 fps
100%
GeForce GTX 1660 Ti Max-Q:
61 fps
100%
GeForce GTX 1660 Ti Max-Q:
206.7 247.4 ~ 227 fps
100%
GeForce GTX 1660 Ti Max-Q:
160.8 212.1 ~ 186 fps
100%
GeForce GTX 1660 Ti Max-Q:
141.7 173.7 ~ 158 fps
100%
GeForce GTX 1660 Ti Max-Q:
130.4 fps
100%
GeForce GTX 1660 Ti Max-Q:
78.1 fps
100%
GeForce GTX 1660 Ti Max-Q:
72.4 fps
100%
GeForce GTX 1660 Ti Max-Q:
41.5 fps
100%
GeForce GTX 1660 Ti Max-Q:
193.7 fps
100%
GeForce GTX 1660 Ti Max-Q:
140.7 fps
100%
GeForce GTX 1660 Ti Max-Q:
116 fps
100%
GeForce GTX 1660 Ti Max-Q:
42.4 fps
100%
GeForce GTX 1660 Ti Max-Q:
40.7 fps
100%
GeForce GTX 1660 Ti Max-Q:
93.7 fps
136%
GeForce GTX 1650 Ti Max-Q:
89.7 163.4 ~ 127 fps
GeForce GTX 1650 Ti Max-Q:
84.7 107.4 ~ 96 fps
100%
GeForce GTX 1660 Ti Max-Q:
72.7 fps
81%
GeForce GTX 1650 Ti Max-Q:
58.1 60.5 ~ 59 fps
100%
GeForce GTX 1660 Ti Max-Q:
64.5 fps
76%
GeForce GTX 1650 Ti Max-Q:
48.9 49.1 ~ 49 fps
GeForce GTX 1650 Ti Max-Q:
19.9 22.9 ~ 21 fps
100%
GeForce GTX 1660 Ti Max-Q:
232.8 fps
100%
GeForce GTX 1660 Ti Max-Q:
200.1 fps
100%
GeForce GTX 1660 Ti Max-Q:
163.6 fps
100%
GeForce GTX 1660 Ti Max-Q:
148.8 fps
100%
GeForce GTX 1660 Ti Max-Q:
60 fps
100%
GeForce GTX 1660 Ti Max-Q:
60 fps
100%
GeForce GTX 1660 Ti Max-Q:
60 fps
100%
GeForce GTX 1660 Ti Max-Q:
93.3 113 119 ~ 108 fps
127%
GeForce GTX 1650 Ti Max-Q:
118 128 130 137 140 [X] MSI Summit E15 A11SCST High Performance, Cooler Boost
Intel Core i7-1185G7 3GHz
GeForce GTX 1650 Ti Max-Q
min:
123.5 fps, max:
-1 fps
140 142 143 [X] MSI Summit E15 A11SCST High Performance
Intel Core i7-1185G7 3GHz
GeForce GTX 1650 Ti Max-Q
min:
125.9 fps, max:
-1 fps
143 144 147 ~ 137 fps
82%
UHD Graphics 64EUs:
61.1 70.5 [X] NiPoGi AD08 Intel Core i7-12650H 1.7GHz
UHD Graphics 64EUs
min:
55.3 fps, max:
-1 fps
70.8 74.6 79.2 [X] NiPoGi CK10 Intel Core i5-12450H 1.5GHz
UHD Graphics 64EUs
min:
64.2 fps, max:
-1 fps
84.1 84.7 [X] NiPoGi AD08 Intel Core i7-12650H 1.7GHz
UHD Graphics 64EUs
min:
65.2 fps, max:
-1 fps
86.5 [X] NiPoGi AD08 Intel Core i7-12650H 1.7GHz
UHD Graphics 64EUs
min:
71.1 fps, max:
-1 fps
88.9 93.4 99.6 100.9 [X] Asus TUF Dash F15 FX517ZR Intel Core i7-12650H 1.7GHz
UHD Graphics 64EUs
min:
80.2 fps, max:
-1 fps
~ 83 fps
119%
GeForce GTX 1650 Ti Max-Q:
112 116 117 118 118 119 121 124 [X] MSI Summit E15 A11SCST High Performance
Intel Core i7-1185G7 3GHz
GeForce GTX 1650 Ti Max-Q
min:
109 fps, max:
-1 fps
124 [X] MSI Summit E15 A11SCST High Performance, Cooler Boost
Intel Core i7-1185G7 3GHz
GeForce GTX 1650 Ti Max-Q
min:
107.8 fps, max:
-1 fps
127 129 ~ 120 fps
53%
UHD Graphics 64EUs:
37.1 43.3 [X] NiPoGi CK10 Intel Core i5-12450H 1.5GHz
UHD Graphics 64EUs
min:
40.5 fps, max:
-1 fps
44.4 44.7 47.9 48.3 [X] NiPoGi AD08 Intel Core i7-12650H 1.7GHz
UHD Graphics 64EUs
min:
44.7 fps, max:
-1 fps
49.5 54.8 [X] NiPoGi AD08 Intel Core i7-12650H 1.7GHz
UHD Graphics 64EUs
min:
51.1 fps, max:
-1 fps
55 [X] NiPoGi AD08 Intel Core i7-12650H 1.7GHz
UHD Graphics 64EUs
min:
51.6 fps, max:
-1 fps
57.8 58.3 [X] Asus TUF Dash F15 FX517ZR Intel Core i7-12650H 1.7GHz
UHD Graphics 64EUs
min:
54.2 fps, max:
-1 fps
62.7 ~ 50 fps
120%
GeForce GTX 1650 Ti Max-Q:
107 107 109 111 111 112 113 115 117 [X] MSI Summit E15 A11SCST High Performance
Intel Core i7-1185G7 3GHz
GeForce GTX 1650 Ti Max-Q
min:
100.4 fps, max:
-1 fps
117 [X] MSI Summit E15 A11SCST High Performance, Cooler Boost
Intel Core i7-1185G7 3GHz
GeForce GTX 1650 Ti Max-Q
min:
100.7 fps, max:
-1 fps
121 ~ 113 fps
52%
UHD Graphics 64EUs:
34.4 40.4 [X] NiPoGi CK10 Intel Core i5-12450H 1.5GHz
UHD Graphics 64EUs
min:
37.2 fps, max:
-1 fps
41 41.6 43.9 45.1 [X] NiPoGi AD08 Intel Core i7-12650H 1.7GHz
UHD Graphics 64EUs
min:
41.4 fps, max:
-1 fps
45.5 50.2 [X] NiPoGi AD08 Intel Core i7-12650H 1.7GHz
UHD Graphics 64EUs
min:
46.8 fps, max:
-1 fps
50.7 [X] NiPoGi AD08 Intel Core i7-12650H 1.7GHz
UHD Graphics 64EUs
min:
47.5 fps, max:
-1 fps
53.3 54 [X] Asus TUF Dash F15 FX517ZR Intel Core i7-12650H 1.7GHz
UHD Graphics 64EUs
min:
49.8 fps, max:
-1 fps
57.5 ~ 46 fps
120%
GeForce GTX 1650 Ti Max-Q:
101 103 104 104 105 106 107 108 [X] MSI Summit E15 A11SCST High Performance
Intel Core i7-1185G7 3GHz
GeForce GTX 1650 Ti Max-Q
min:
89.9 fps, max:
-1 fps
108 [X] MSI Summit E15 A11SCST High Performance, Cooler Boost
Intel Core i7-1185G7 3GHz
GeForce GTX 1650 Ti Max-Q
min:
91.3 fps, max:
-1 fps
109 110 ~ 106 fps
100%
GeForce GTX 1660 Ti Max-Q:
89 fps
100%
GeForce GTX 1660 Ti Max-Q:
69 fps
100%
GeForce GTX 1660 Ti Max-Q:
51 fps
32%
UHD Graphics 64EUs:
48 51 59.5 [X] NiPoGi CK10 Intel Core i5-12450H 1.5GHz
UHD Graphics 64EUs
min:
19.9 fps, P0.1:
24.7 fps, P1:
33.7 fps, max:
214 fps
60.8 [X] Geekom Mini IT12 Intel Core i5-12450H 1.5GHz
UHD Graphics 64EUs
min:
17.3 fps, P0.1:
25.8 fps, P1:
34.4 fps, max:
254 fps
62.4 64.3 [X] NiPoGi AD08 Intel Core i7-12650H 1.7GHz
UHD Graphics 64EUs
min:
27.3 fps, P0.1:
29.2 fps, P1:
37 fps, max:
199.8 fps
74 [X] NiPoGi AD08 Intel Core i7-12650H 1.7GHz
UHD Graphics 64EUs
min:
26 fps, P0.1:
29.9 fps, P1:
42.4 fps, max:
267 fps
77.3 [X] NiPoGi AD08 Intel Core i7-12650H 1.7GHz
UHD Graphics 64EUs
min:
33.5 fps, P0.1:
35.5 fps, P1:
45.8 fps, max:
242 fps
78.9 [X] Asus TUF Dash F15 FX517ZR Intel Core i7-12650H 1.7GHz
UHD Graphics 64EUs
min:
7.36 fps, P0.1:
24.8 fps, P1:
43.1 fps, max:
273 fps
80.8 85.3 ~ 67 fps
28%
UHD Graphics 64EUs:
31 36.4 [X] NiPoGi CK10 Intel Core i5-12450H 1.5GHz
UHD Graphics 64EUs
min:
17.3 fps, P0.1:
17.8 fps, P1:
20.4 fps, max:
133.7 fps
37 37.5 [X] Geekom Mini IT12 Intel Core i5-12450H 1.5GHz
UHD Graphics 64EUs
min:
4.96 fps, P0.1:
17.4 fps, P1:
20.5 fps, max:
158.5 fps
39 41.5 [X] NiPoGi AD08 Intel Core i7-12650H 1.7GHz
UHD Graphics 64EUs
min:
18.6 fps, P0.1:
19.6 fps, P1:
23.4 fps, max:
152.1 fps
48.9 [X] NiPoGi AD08 Intel Core i7-12650H 1.7GHz
UHD Graphics 64EUs
min:
21.9 fps, P0.1:
23.4 fps, P1:
27.8 fps, max:
179.4 fps
49.8 [X] NiPoGi AD08 Intel Core i7-12650H 1.7GHz
UHD Graphics 64EUs
min:
22.8 fps, P0.1:
24.2 fps, P1:
27.9 fps, max:
193.7 fps
52.4 [X] Asus TUF Dash F15 FX517ZR Intel Core i7-12650H 1.7GHz
UHD Graphics 64EUs
min:
21.3 fps, P0.1:
23.8 fps, P1:
28.3 fps, max:
211 fps
56 ~ 43 fps
26%
UHD Graphics 64EUs:
15 19.2 [X] NiPoGi CK10 Intel Core i5-12450H 1.5GHz
UHD Graphics 64EUs
min:
9.37 fps, P0.1:
9.7 fps, P1:
10.7 fps, max:
79.5 fps
20 20 [X] Geekom Mini IT12 Intel Core i5-12450H 1.5GHz
UHD Graphics 64EUs
min:
10.1 fps, P0.1:
11.2 fps, P1:
11.3 fps, max:
78.2 fps
20.2 22.7 [X] NiPoGi AD08 Intel Core i7-12650H 1.7GHz
UHD Graphics 64EUs
min:
11 fps, P0.1:
12 fps, P1:
12.4 fps, max:
86.1 fps
25.7 [X] NiPoGi AD08 Intel Core i7-12650H 1.7GHz
UHD Graphics 64EUs
min:
12.9 fps, P0.1:
13.4 fps, P1:
14.2 fps, max:
112.5 fps
26.2 26.9 [X] Asus TUF Dash F15 FX517ZR Intel Core i7-12650H 1.7GHz
UHD Graphics 64EUs
min:
13.6 fps, P0.1:
13.8 fps, P1:
16.3 fps, max:
107.2 fps
30.1 30.2 [X] NiPoGi AD08 Intel Core i7-12650H 1.7GHz
UHD Graphics 64EUs
min:
5.17 fps, P0.1:
14.7 fps, P1:
16.3 fps, max:
162.3 fps
~ 23 fps
22%
UHD Graphics 64EUs:
7.1 9.6 [X] NiPoGi CK10 Intel Core i5-12450H 1.5GHz
UHD Graphics 64EUs
min:
4.5 fps, P0.1:
5.38 fps, P1:
5.84 fps, max:
20.2 fps
10 10.2 10.2 [X] Geekom Mini IT12 Intel Core i5-12450H 1.5GHz
UHD Graphics 64EUs
min:
5.61 fps, P0.1:
5.81 fps, P1:
6.02 fps, max:
22.1 fps
11 [X] NiPoGi AD08 Intel Core i7-12650H 1.7GHz
UHD Graphics 64EUs
min:
1.524 fps, P0.1:
4.05 fps, P1:
6.64 fps, max:
69.9 fps
11.4 [X] NiPoGi AD08 Intel Core i7-12650H 1.7GHz
UHD Graphics 64EUs
min:
5.5 fps, P0.1:
6.42 fps, P1:
6.7 fps, max:
26.5 fps
11.4 [X] NiPoGi AD08 Intel Core i7-12650H 1.7GHz
UHD Graphics 64EUs
min:
6.58 fps, P0.1:
6.61 fps, P1:
6.69 fps, max:
25.8 fps
11.9 13.1 [X] Asus TUF Dash F15 FX517ZR Intel Core i7-12650H 1.7GHz
UHD Graphics 64EUs
min:
3.48 fps, P0.1:
4.99 fps, P1:
10.7 fps, max:
39 fps
13.8 ~ 11 fps
100%
GeForce GTX 1660 Ti Max-Q:
30.9 fps
100%
GeForce GTX 1660 Ti Max-Q:
161.3 fps
66%
UHD Graphics 64EUs:
55.6 [X] HP 250 G9 7N029ES Intel Core i3-1215U 0.9GHz
UHD Graphics 64EUs
min:
1.809 fps, P1:
28.6 fps, max:
86.7 fps
92.6 95.3 97.7 [X] NiPoGi AD08 Intel Core i7-12650H 1.7GHz
UHD Graphics 64EUs
min:
29.9 fps, P1:
62.5 fps, max:
254 fps
108.8 [X] NiPoGi CK10 Intel Core i5-12450H 1.5GHz
UHD Graphics 64EUs
min:
14.4 fps, P1:
71.4 fps, max:
217 fps
108.9 [X] Geekom Mini IT12 Intel Core i5-12450H 1.5GHz
UHD Graphics 64EUs
min:
9.13 fps, P1:
71.4 fps, max:
273 fps
116.1 117.3 [X] NiPoGi AD08 Intel Core i7-12650H 1.7GHz
UHD Graphics 64EUs
min:
38 fps, P1:
71.4 fps, max:
196.3 fps
118.3 [X] NiPoGi AD08 Intel Core i7-12650H 1.7GHz
UHD Graphics 64EUs
min:
10.2 fps, P1:
76.9 fps, max:
249 fps
129.9 141.9 [X] Asus TUF Dash F15 FX517ZR Intel Core i7-12650H 1.7GHz
UHD Graphics 64EUs
min:
4.66 fps, P1:
90.9 fps, max:
326 fps
~ 107 fps
102%
GeForce GTX 1650 Ti Max-Q:
156 [X] HP Envy 14-eb0010nr Intel Core i5-1135G7 2.4GHz
GeForce GTX 1650 Ti Max-Q
min:
4.62 fps, P1:
90.9 fps, max:
263 fps
167 171 ~ 165 fps
100%
GeForce GTX 1660 Ti Max-Q:
151.5 fps
59%
UHD Graphics 64EUs:
42.5 [X] HP 250 G9 7N029ES Intel Core i3-1215U 0.9GHz
UHD Graphics 64EUs
min:
6.28 fps, P1:
23.3 fps, max:
109.5 fps
71.8 81.1 83 [X] NiPoGi AD08 Intel Core i7-12650H 1.7GHz
UHD Graphics 64EUs
min:
23.4 fps, P1:
50 fps, max:
143.6 fps
90.1 [X] Geekom Mini IT12 Intel Core i5-12450H 1.5GHz
UHD Graphics 64EUs
min:
34.3 fps, P1:
62.5 fps, max:
189 fps
91.9 [X] NiPoGi CK10 Intel Core i5-12450H 1.5GHz
UHD Graphics 64EUs
min:
52.8 fps, P1:
62.5 fps, max:
157.6 fps
97.1 [X] NiPoGi AD08 Intel Core i7-12650H 1.7GHz
UHD Graphics 64EUs
min:
7.77 fps, P1:
62.5 fps, max:
187.8 fps
97.4 100.9 [X] NiPoGi AD08 Intel Core i7-12650H 1.7GHz
UHD Graphics 64EUs
min:
8.17 fps, P1:
62.5 fps, max:
234 fps
113.4 121.2 [X] Asus TUF Dash F15 FX517ZR Intel Core i7-12650H 1.7GHz
UHD Graphics 64EUs
min:
24.1 fps, P1:
76.9 fps, max:
206 fps
~ 90 fps
102%
GeForce GTX 1650 Ti Max-Q:
145 [X] HP Envy 14-eb0010nr Intel Core i5-1135G7 2.4GHz
GeForce GTX 1650 Ti Max-Q
min:
4.59 fps, P1:
83.3 fps, max:
250 fps
157 164 ~ 155 fps
100%
GeForce GTX 1660 Ti Max-Q:
114.6 fps
14%
UHD Graphics 64EUs:
8.6 [X] HP 250 G9 7N029ES Intel Core i3-1215U 0.9GHz
UHD Graphics 64EUs
min:
1.921 fps, P1:
4.33 fps, max:
48.3 fps
14.4 [X] Geekom Mini IT12 Intel Core i5-12450H 1.5GHz
UHD Graphics 64EUs
min:
7.59 fps, P1:
11 fps, max:
44.3 fps
14.6 14.6 16.4 [X] NiPoGi AD08 Intel Core i7-12650H 1.7GHz
UHD Graphics 64EUs
min:
7.58 fps, P1:
12.8 fps, max:
38.2 fps
16.9 [X] NiPoGi AD08 Intel Core i7-12650H 1.7GHz
UHD Graphics 64EUs
min:
5.82 fps, P1:
13 fps, max:
41.6 fps
17.1 17.6 [X] NiPoGi AD08 Intel Core i7-12650H 1.7GHz
UHD Graphics 64EUs
min:
5.86 fps, P1:
13.2 fps, max:
271 fps
18.5 20.8 [X] Asus TUF Dash F15 FX517ZR Intel Core i7-12650H 1.7GHz
UHD Graphics 64EUs
min:
6.16 fps, P1:
15.6 fps, max:
187.3 fps
~ 16 fps
73%
GeForce GTX 1650 Ti Max-Q:
73.2 88.1 [X] HP Envy 14-eb0010nr Intel Core i5-1135G7 2.4GHz
GeForce GTX 1650 Ti Max-Q
min:
15.1 fps, P1:
62.5 fps, max:
150 fps
91.5 ~ 84 fps
100%
GeForce GTX 1660 Ti Max-Q:
59.6 fps
12%
UHD Graphics 64EUs:
6.2 [X] Geekom Mini IT12 Intel Core i5-12450H 1.5GHz
UHD Graphics 64EUs
min:
2.8 fps, P1:
3.44 fps, max:
21.6 fps
6.2 6.3 7.1 [X] NiPoGi AD08 Intel Core i7-12650H 1.7GHz
UHD Graphics 64EUs
min:
4.34 fps, P1:
5.75 fps, max:
15.9 fps
7.1 [X] NiPoGi AD08 Intel Core i7-12650H 1.7GHz
UHD Graphics 64EUs
min:
3.36 fps, P1:
5.71 fps, max:
35.1 fps
7.4 8 8.9 [X] Asus TUF Dash F15 FX517ZR Intel Core i7-12650H 1.7GHz
UHD Graphics 64EUs
min:
3.82 fps, P1:
4.88 fps, max:
35.4 fps
~ 7 fps
72%
GeForce GTX 1650 Ti Max-Q:
37.1 45.3 [X] HP Envy 14-eb0010nr Intel Core i5-1135G7 2.4GHz
GeForce GTX 1650 Ti Max-Q
min:
17.6 fps, P1:
29.4 fps, max:
102 fps
45.4 ~ 43 fps
UHD Graphics 64EUs:
5.6 [X] Asus TUF Dash F15 FX517ZR Intel Core i7-12650H 1.7GHz
UHD Graphics 64EUs
min:
2.21 fps, P1:
3 fps, max:
30.7 fps
fps
GeForce GTX 1650 Ti Max-Q:
26 fps
GeForce GTX 1650 Ti Max-Q:
24.8 fps
100%
GeForce GTX 1660 Ti Max-Q:
343.8 fps
100%
GeForce GTX 1660 Ti Max-Q:
322.9 fps
100%
GeForce GTX 1660 Ti Max-Q:
296.9 fps
100%
GeForce GTX 1660 Ti Max-Q:
166.1 fps
Average Gaming NVIDIA GeForce GTX 1660 Ti Max-Q → 100% Average Gaming 30-70 fps → 100%
Average Gaming Intel UHD Graphics 64EUs (Alder Lake 12th Gen) → 33% Average Gaming 30-70 fps → 37%
Average Gaming NVIDIA GeForce GTX 1650 Ti Max-Q → 76% Average Gaming 30-70 fps → 69%
 Deutsch
 English
 Español
 Français
 Italiano
 Nederlands
 Polski
 Português
 Русский
 Türkçe
 Svenska
 Chinese
 Magyar